1. Introduction
Atomic oxygen O(
3P), as one of the most important chemical constituents in the MLT (mesosphere and lower thermosphere) region, plays a crucial role in the physical, chemical and energy budgets of this region [
1]. The photo-dissociation of O
2 and O
3 in the lower thermosphere is the main method of its formation. O(
3P) is transported from the lower thermosphere into the mesosphere through the eddy diffusion process, reaching a peak density at night around 96 km [
2]. In the region of the upper mesosphere, the chemical lifetime of oxygen atoms is longer and can reach months at 100 km. Most heating mechanisms in the mesosphere and lower thermosphere are associated with atomic oxygen, and the dominant radiative cooling in this region is also caused by the collisions between O(
3P) and CO
2 [
3,
4,
5].
The measurements of the Sounding of the Atmosphere using Broadband Emission Radiometry (SABER) instrument on the Thermosphere-Ionosphere-Mesosphere Energetics and Dynamics (TIMED) satellite can be used to determine the atomic oxygen concentrations in the mesosphere–lower thermosphere [
6]. Although the determination of atomic oxygen density during both day and night relies on the assumption that ozone is in photochemical equilibrium, the photochemical models differ. During the day, the atomic oxygen density is directly determined from the ozone density. Meanwhile, at night, atomic oxygen is calculated from the Meinel bands airglow emission of vibrationally excited hydroxyl (OH) [
7]. The O(
3P) densities in the MLT are derived from several instruments. Recent results have relied on the measurements of nighttime atomic oxygen green line limb emission by the Scanning Imaging Absorption Spectrometer for Atmospheric Chartography (SCIAMACHY) instrument on the European Environmental Satellite [
8,
9], OH nightglow radiances at 2.0 µm by the SABER instrument on the TIMED satellite since 2002 [
10], the O
2 A band and OH* airglow on the Optical Spectrograph and Infrared Imaging System (OSIRIS) instrument on the Odin satellite since 2002 [
11], and the O(
1S) green-line and hydroxyl (8–3) band emissions at 734 nm on the WIND Imaging Interferometer (WINDII) instrument on the Upper Atmosphere Research Satellite [
12,
13]. The atomic oxygen abundance derived from WINDII, OSIRIS and SCIAMACHY differ by no more than 20%, while a difference of up to 60% can be found by comparing O(
3P) densities derived from SABER 2.0 μm OH and those results [
14]. New atomic oxygen data, retrieved from SABER 2.0, and 1.6 μm radiance measurements using the new nighttime OH(v) model, are significantly better than the previous SABER data derived from the SABER 2.0 μm OH emission [
15].
Atomic oxygen detection data in the MLT region are often used to study the oscillations of the mesopause in the mid-latitude and equatorial regions. Roach researched the trends in atomic oxygen on the measurements of the atomic oxygen green line and found a semiannual variation [
16]. Based on International Geophysical Year (IGY) data, Fukuyama [
17] studied the variation in atomic oxygen density in a larger latitude range, identified a semiannual variation in the atomic oxygen, and showed that its amplitude would decrease with increasing latitude. Recent results have identified annual and semiannual atomic oxygen variations in the mesopause region for mid- and equatorial latitudes, and have shown that height and latitude determine amplitude and phase variations. Recent results also suggest that there is a quasi-biennial oscillation in the atomic oxygen in the upper region of the mesopause [
18].
In this paper, we summarize the trends in O(3P) densities retrieved from the SABER nighttime limb measurements of OH(v) Meinel band emissions at 2.0 and 1.6 μm in the range of 85–100 km. We also analyze variations in the O(3P) volume mixing ratio and its long-term variation trends from 2002 to 2019 in the mesopause. We present results of the mean variations in the atomic oxygen volume mixing ratio SAO and AO, and the QBO correlations with equatorial stratospheric QBO.
2. Data and Methods
The data of the SABER probe carried by the TIMED satellite range from 25 January 2002 to the present. The TIMED satellite progresses slowly along the latitudinal circle, and its local time migrates 12 min per day. The latitude range of the SABER observations extends from 52° in one hemisphere to 83° in the other hemisphere, changing about every 60 days. SABER scans up and down over a vertical range from 10 to 120 km, and directly measures certain atmospheric physical quantities, including the atmospheric temperature, density, ozone volume mixing ratio (O
3-volume mixing ratio), atomic oxygen volume mixing ratio (O-volume mixing ratio), hydrogen atomic volume mixing ratio (H-volume mixing ratio) and so on [
19,
20,
21,
22].
The previous version of the nighttime O(3P) retrievals used the measurements from the SABER OH 2.0 μm channel using the OH(v) model. This model included both the spontaneous emission of the OH chemical production, and the collisional quenching effect between N2, O2 and O(3P). The SABER atomic oxygen retrievals used a significantly smaller rate coefficient for OH (v = 8, 9) and O(3P) quenching relative to the measurements of the other instrument, and it was believed that an excessively large rate coefficient would lead to a significant enhancement of the retrieved O(3P). Although the rate coefficients for collisional quenching effects were applied, the SABER-2013 O(3P) data still did not agree with the other O(3P) measurements within the retrieval uncertainties.
This article used version 1.0 nighttime O(
3P) densities data of TIMED/SABER (MLT) retrieved from 2.0 and 1.6 μm radiances from February 2002 to December 2019. This atomic oxygen dataset is based on a new detailed OH(v) model and novel retrieval algorithm proposed by Panka et al. [
15].
The new detailed OH(v) model solves this problem well. It avoids any empirical adjustment of the rate coefficients, as well as the use of the assumption on the chemical equilibrium of the nighttime ozone. It guarantees the reliability of the retrieved results without any unreliable assumptions, and resolves the historical differences in the derived nighttime O(3P) densities in the mesosphere and lower thermosphere. This creates better agreement between the SABER nighttime O(3P) data and the other measurements. Compared to the other measurements, the SABER data have wider coverage and unprecedented duration.
Atomic oxygen volume mixing ratio data from February 2002 to December 2019, between 40° S and 40° N, were divided into 17 bands with a 5° interval. To obtain a reliable signal of the SAO, AO and QBO, the daily mean atomic oxygen volume mixing ratio between 95 and 97 km was averaged and taken as representative for 96 km.
To determine which long period variations are dominant in atomic oxygen volume mixing ratio, the Fast Fourier Transform method was used. For the analysis of the SAO and AO, we fitted two sinusoidal functions with periods of 12 and 6 months to the daily mean atomic oxygen volume mixing ratio to obtain the annual and semiannual amplitudes.
To study the relationship of the equatorial stratosphere QBO with the atomic oxygen volume mixing ratio QBO, we used the Singapore (1° N, 104° E) daily mean zonal winds at 30 km to obtain equatorial stratosphere quasi-biennial oscillation (SQBO) information.
3. Results and Discussion
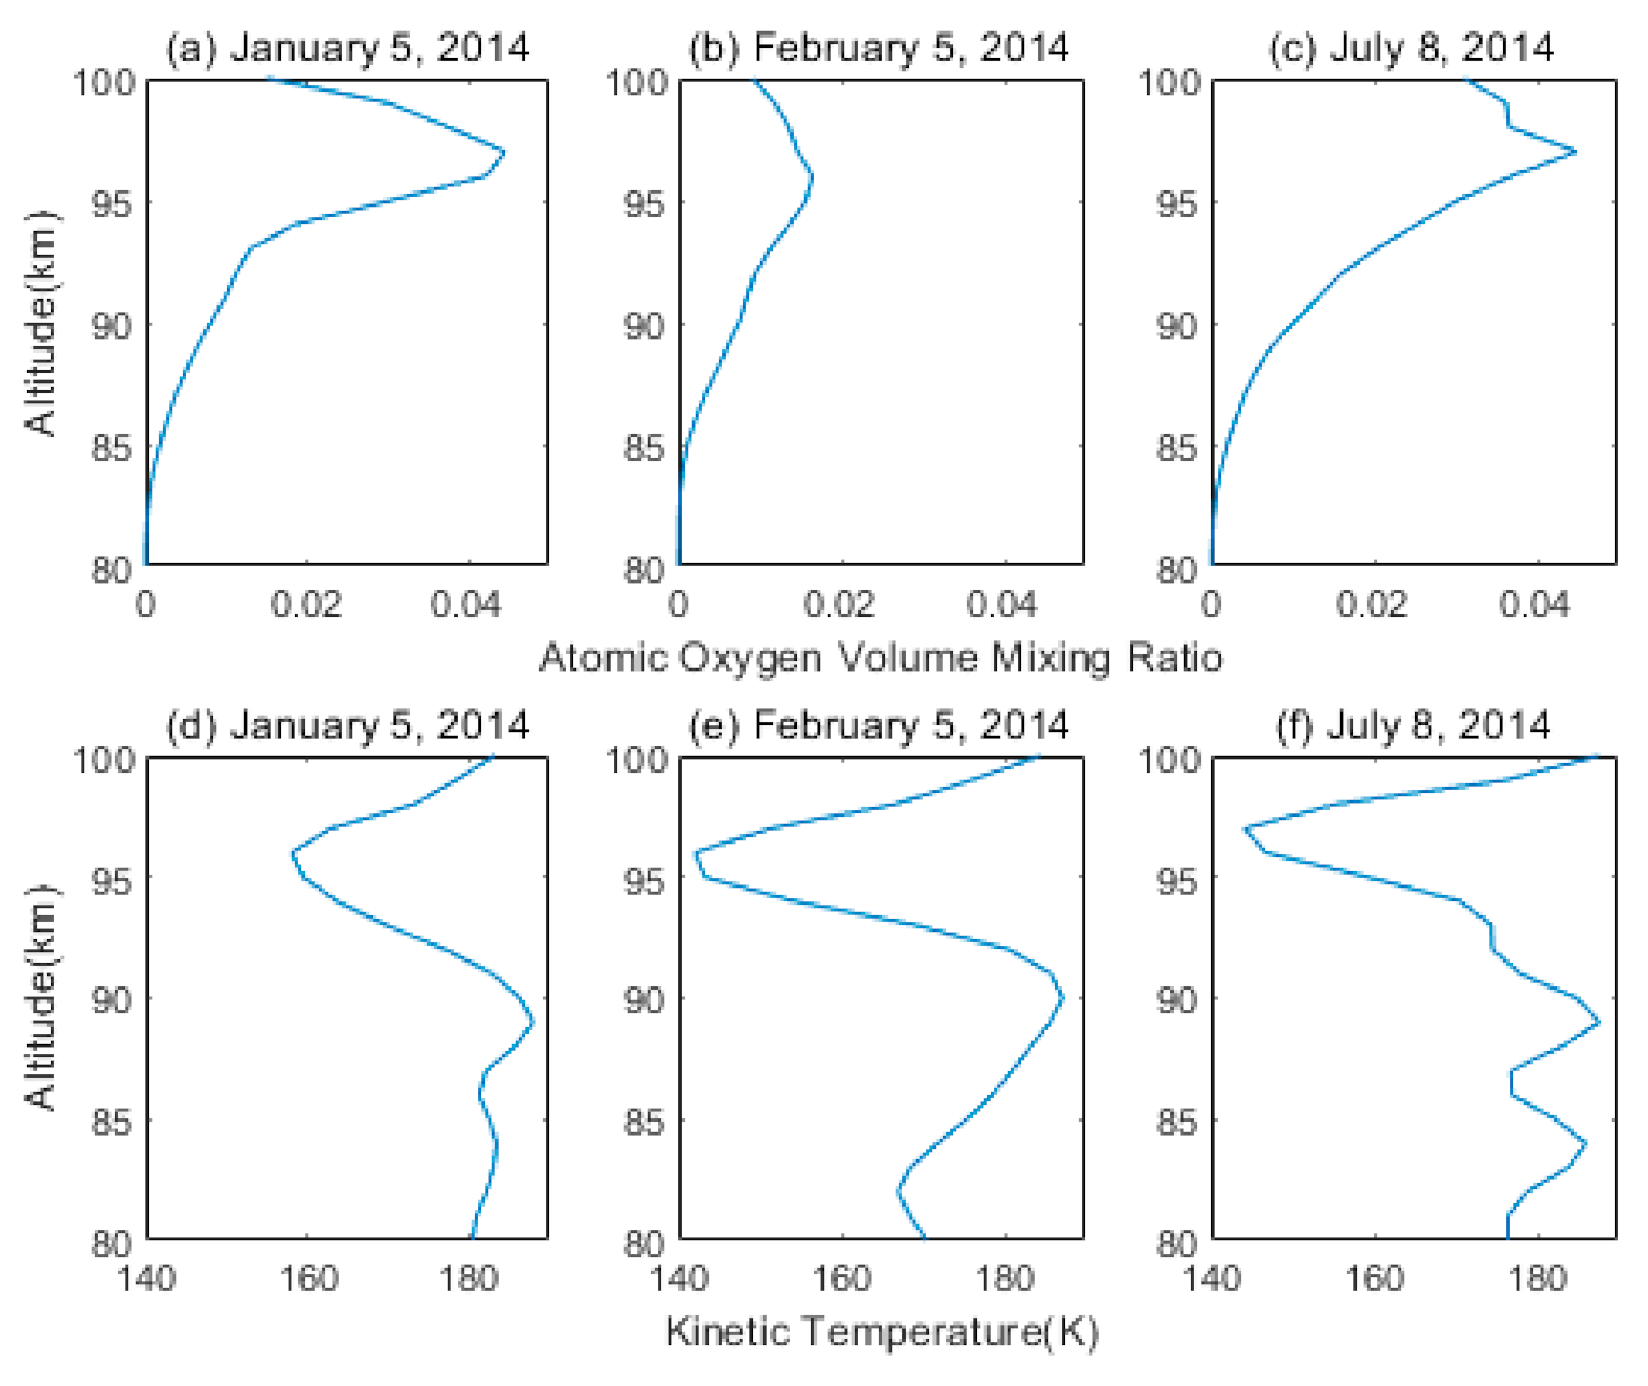
The examples of the O(
3P) vertical profiles were taken over the course of three different days. Data for the equatorial region are shown in
Figure 1, showing the volume mixing ratio versus the tangent altitude for the range of 80–100 km with a maximum volume mixing ratio at 96 km. The vertical transport and chemical losses caused the atomic oxygen levels to increase with altitude below 96 km. The atomic oxygen levels decreased above 96 km, which was mainly due to the flux of atomic oxygen by diffusive transport. Our result is similar to the result of Russell et al., (2004). We also analyzed the temporal variations in temperature corresponding to the three examples. There was a distinct peak in both the volume mixing ratio and mean temperature at around 96 km. Considering that the strongest radiative cooling of the MLT region is caused by the CO
2 15-μm emission generated by collisions of CO
2 molecules with O atoms, and the change in oxygen atoms reflects the change in temperature to a certain extent [
1], we chose to study the average value of the atomic oxygen volume mixing ratio at 95–97 km as a representative of 96 km.
Figure 1a shows the altitude profile of the daily mean atomic oxygen volume mixing ratio at the equator for 5 January 2014. The atomic oxygen volume mixing ratio was between 0 and 0.045, with a peak of 0.0445 at around 96 km.
Figure 1d is the altitude profile of the daily mean temperature at the equator corresponding to
Figure 1a. There was a maximum value of 188 K at around 89 km, and a minimum value of 158 K at around 96 km.
Figure 1b shows the altitude profile of the daily mean atomic oxygen volume mixing ratio at the equator for 5 February 2014. The atomic oxygen volume mixing ratio was between 0 and 0.017, with a peak of 0.0168 at around 96 km.
Figure 1e is the altitude profile of the daily mean temperature at the equator corresponding to
Figure 1b. There was a maximum value of 183 K at around 90 km, and a minimum value of 142 K at around 96 km.
Figure 1c shows the altitude profile of the daily mean atomic oxygen volume mixing ratio at the equator for 8 July 2014. The atomic oxygen volume mixing ratio was between 0 and 0.045, with a peak of 0.0449 at around 96 km.
Figure 2f is the altitude profile of the daily mean temperature at the equator corresponding to
Figure 2c. There was a maximum value of 183 K at around 90 km, and a minimum value of 142 K at around 96 km. Comparing
Figure 1d,e, a trough appears in the range of 85–90 km, which may have been caused by some disturbance.
Figure 2 shows the variation in the altitude mean atomic oxygen volume mixing ratio at the equator for 96 km over 18 years. The minima appeared at the equatorial latitudes, and the maximum value appeared at mid latitudes. The value of the atomic oxygen volume mixing ratio was larger at mid latitudes in the northern hemisphere than the southern hemisphere. The maxima of the annual atomic oxygen volume mixing ratio in the northern hemisphere was between 0.023 and 0.026 near the June solstice, the maxima of the annual atomic oxygen volume mixing ratio in the southern hemisphere was between 0.021 and 0.023 near the the March equinox. The variations in the atomic oxygen volume mixing ratio suggest that there are annual and semiannual variations in atomic oxygen volume mixing ratio at the equator. The existence of the SAO and AO signal in the equatorial mesosphere were further indicated by measurements of various satellites, as well as ground-based observations [
23,
24].
Figure 3 displays the FFT result of the atomic oxygen volume mixing ratio at the equator, and the FFT result of the atomic oxygen volume mixing ratio in the latitude range of 40° S–40° N. The results show that there was SAO-type variation and AO-type variation in the volume mixing ratio at the equator. It indicates that the oscillations in the atomic oxygen volume mixing ratio vary with latitude, and the AO is slightly stronger than SAO at the equator. In the latitude range of 40° S–40° N, the AO is more dominant with the increase in latitude, especially in the northern hemisphere.
Figure 4 shows the 18-year average atomic oxygen volume mixing ratio as a function of latitude and date at 96 km. The atomic oxygen volume mixing ratio showed an upward trend in its overall structure with the increase in latitude. There were two maximum values near days 140 and 310, and two minimum values near days 50 and 230.
We noticed an amplitude (in the 18-year average atomic oxygen volume mixing ratio) of the annual and semiannual variations after a least-squares fit was performed. In
Figure 5, the SAO amplitude was between 0.6 × 10
−3 and 1.7 × 10
−3, with a minimum value of 6.49× 10
−4 near the equator. The SAO amplitude maximizes at mid-latitudes at a peak altitude of 96 km. The uncertainty of the least-squares fitting is depicted as vertical lines in the plots.
In
Figure 6, there is also a minimum value of 3.36 × 10
−4 near the equator, similar to the SAO, with hemispheric differences in the AO amplitude of the atomic oxygen volume mixing ratio. The AO amplitude decreased toward the equator in the latitude range of 0°–40°. Considering the effects of the inclination of the Earth and annual variations in the mesospheric circulation, the AO is expected to be stronger at higher latitudes. The AO was stronger at mid latitudes in the northern hemisphere relative to the southern hemisphere. The amplitudes of the AO showed strong variability and an antisymmetric nature as functions of latitude. This is consistent with the results of Russell et al. [
18].
Our result of the SAO amplitude and AO amplitude is consistent with the result of Russell et al. [
18]. Our result indicates that the semiannual variation is more significant than the annual variation at the equator. Russell et al. [
18] also indicated that the variations in [O] are modulated by the tides, and there was also a QBO in [O].
In
Figure 7, we smoothed the data of
Figure 2 with a 365-day sliding window and observed a clear quasi-biennial oscillation in the atomic oxygen volume mixing ratio around the equator. Because there are no previous results of the QBO in the atomic oxygen volume mixing ratio with which to compare, and considering the QBO wind modulation of the tides, we decided to compare correlations between the atomic oxygen volume mixing rate QBO and equatorial stratosphere QBO based on the MERRA-2 data. The QBO is a very strong signal in the stratospheric zonal wind, and we only used a 365-day smooth window to highlight the QBO phenomenon in MERRA2.
In
Figure 8, the long-term variation in the stratospheric mean zonal wind shows the variation in the SQBO at 30 km. We compared this with the long-term variation in the atomic oxygen volume mixing ratio at the equator and found that there was also a QBO in the atomic oxygen volume mixing ratio. However, the QBO was negatively correlated with the maxima in the SQBO, and the minima in the atomic oxygen volume mixing ratio QBO occurred almost synchronously.
In
Figure 9, we further compared the correlation between the QBO in the atomic oxygen volume mixing ratio and the SQBO in the range from 40° S to 40° N., and the absolute value of the correlation coefficient decreased as the latitude increased, with a maximum value of 0.39 at the equator. The correlation coefficient was close to zero at 40° N and −0.134 at 40° S. This trend indicates that the SQBO impact diminished as the altitude increased. The variations in the atomic oxygen volume mixing ratio are not only subject to QBO in the stratosphere, but are also correlated with solar activity, SSW events and other dynamical processes. These perturbations may be responsible for the observed interannual variability in atomic oxygen at QBO scales.
4. Conclusions
This paper used the O(3P) density data derived from SABER 2.0 and 1.6 μm radiances from February 2002 to December 2019. We analyzed the SAO, AO and QBO in the low-latitude mesospheric height region (96 km) and examined the relationship between QBO and SQBO.
This is the first study of the atomic oxygen volume mixing ratio at low latitudes using updated nighttime O(3P) densities in the MLT retrieved from SABER OH radiances. This atomic oxygen dataset is more extensive than any other dataset to date. The data show that there is SAO-type variation, AO-type variation and QBO-type variation in the atomic oxygen volume mixing ratio at the equator.
Because there are no previous results on the atomic oxygen volume mixing ratio QBO in the mesosphere and lower thermosphere, we analyzed correlations between the equatorial stratosphere QBO and atomic oxygen volume mixing rate QBO based on the Singapore (1° N, 104° E) daily mean zonal winds data from MERRA-2.
We calculated and quantified the amplitudes of the annual and semiannual variations using a least-squares fit technique. The results showed that the amplitudes of the annual and semiannual variations were variable as functions of latitude. Both the amplitude of the SAO and the AO had minimum values near the equator, and the annual oscillation was stronger at the equator than the semiannual oscillation. The amplitudes of the AO showed a distinct antisymmetric nature.
The QBO was distinct near the equator in the latitude time distributions of the atomic oxygen volume mixing ratio, so we compared the correlation between QBO in the atomic oxygen volume mixing ratio and SQBO in the range of 40° S to 40° N by calculating the correlation coefficient of QBO and SQBO. The result indicates that the correlation between the QBO and SQBO decreases with the increasing latitude.
We summarize the long-term variability in atomic oxygen over a longer duration than previously studied, and provide a better foundation for analyzing the effects of atomic oxygen on other measurements in the mesosphere and lower thermosphere.

