Article

Compositions, Sources, and Aging Processes of Aerosol Particles during Winter Hazes in an Inland Megacity of NW China

1
State Key Laboratory of Coal Resources and Safe Mining, College of Geoscience and Surveying Engineering, China University of Mining and Technology (Beijing), Beijing 100083, China
2
Hebei Center for Ecological and Environmental Geology Research, Hebei GEO University, Shijiazhuang 050031, China
3
School of Resources and Materials, Northeastern University at Qinhuangdao, Qinhuangdao 066004, China
4
Institute of Earth Sciences, China University of Geosciences Beijing, Beijing 100083, China
5
Key Laboratory of Resource Exploration Research of Hebei Province, Hebei University of Engineering, Handan 056038, China
6
Faculty of Environmental and Symbiotic Sciences, Prefectural University of Kumamoto, Kumamoto 862-8502, Japan
*
Author to whom correspondence should be addressed.
Atmosphere 2022, 13(4), 521; https://doi.org/10.3390/atmos13040521
Submission received: 18 February 2022 / Revised: 21 March 2022 / Accepted: 23 March 2022 / Published: 24 March 2022
(This article belongs to the Section Aerosols)

Abstract

:
As one of the largest inland megacities in Northwest (NW) China, Xi’an has been facing serious regional haze frequently, especially during winter. The composition of aerosols in Xi’an is highly complex due to its unique basinal topography and unique meteorological conditions. In this study, we characterized the morphology, size, and composition of individual aerosol particles collected during regional haze events at an urban site in Xi’an using Transmission Electron Microscopy (TEM) coupled with Energy-Dispersive X-ray Spectrometry (EDX). Six types of particles were identified based on their morphology and chemical composition, including organic (41.88%), sulfate (32.36%), soot (8.33%), mineral (7.91%), K-rich (5.13%), and fly ash particles (4.49%). These results demonstrate that the organic particles made a larger contribution to haze formation than the secondary inorganic particles during the sampling period. Size distribution and dominance suggest that organic and sulfate particles exert major control on the variation trends of particle size in haze. The coating thickness of organic-cored particles was about 369 nm and that of sulfate-cored particles was about 322 nm, implying that the organic particles were more aged than the sulfate particles. The results presented in this study provide further insights into understanding haze particle formation.

1. Introduction

In recent years, frequent haze events in megacities have caused public concerns due to their influence on atmospheric visibility, human health, and global climate change [1,2]. Aerosol particles in the atmosphere can reduce visibility, scatter or absorb solar radiation, act as cloud condensation nuclei, and affect regional and global precipitation [3,4,5,6,7]. Additioanlly, aerosol particles, especially those of smaller sizes, can be inhaled by humans, causing harm to health [8,9,10]. Many megacities in China have been extensively studied for the characteristics and major sources of air pollution. Studies in Beijing city showed that the air pollutants could be attributed to the combined effects of traffic, coal burning, biomass burning, industrial sources, and dust [1,11]. Air pollutants in Shanghai were mainly caused by biomass burning and traffic emissions [12,13]. Air pollutants in Chengdu were mainly sourced from coal-related industrial emissions [14]. Air pollutants in Chongqing mainly came from industry, traffic, and agricultural activities [15]. These results indicate that different cities have different characteristics of pollution sources.
Xi’an, one of the largest cities in Northwest (NW) China, is the capital of Shaanxi Province and is located at the southern margin of the Loess Plateau (400 m above sea level at 33°29′–34°44′ N, 107°40′–109°49′ E). The climate of Xi’an is dominated by the East Asian monsoon [16]. Geographically, Xi’an is situated in the hinterland of Guanzhong Plain, and its air quality is not only controlled by the local topography and meteorological factors but is also affected by pollution from surrounding areas (Yulin Sand and Loess Plateau) [17,18]. Especially during the heavy pollution episodes in winter, the hazes in the Beijing, Tianjin, Hebei, and surrounding areas move westward along the Taeyang Mountains and are then superimposed with locally sourced pollution in the Guanzhong Basin, resulting in the accumulation of pollutants [17,19]. The cold air mass generally comes from the northeast and is blocked by the Loess Plateau, with little effect on the diffusion of pollutants in the Jianzhong urban agglomeration [20]. As a result, the pressure on air quality improvement in the Guanzhong urban agglomeration is more serious than in other cities. Especially in winter, the dominant wind direction of Xi‘an is from the northeast and can be blocked by the Qinling Mountains. Pollutants are particularly easy to gather due to the accumulation effect of the mountain front [21]. In addition, the static and stable weather conditions make the diffusion of pollutants difficult [22]. Geographical conditions and meteorological factors lead to the complex composition of air pollutants in Xi‘an. As a result, mass concentrations of PM2.5 (particulate matter with an aerodynamic diameter equal to or smaller than 2.5 μm) have been high all the year round in Xi’an [23]. Recently, frequent haze events have attracted the attention of scientists [24,25,26,27]. To improve the air quality, it is essential to understand the physical and chemical characterization of airborne PM2.5 and to identify the possible pollution sources.
In view of the serious air pollution problem in Xi’an and its surrounding areas, many studies have been conducted on pollution characteristics and sources. A study of the vertical distribution regular pattern of PM2.5 with a hexacopter-type unmanned aerial vehicle found that relative humidity had the greatest impact on the vertical profile of PM2.5 [28]. Another work on the assessment of toxicological properties of PM2.5 indicated that the addition of PM2.5 samples collected from haze episodes in Xi’an to albumin in vitro resulted in oxidation of methionine moieties [29]. The evaluation of hazardous volatile organic compounds (VOCs) by source apportionment with a receptor model indicated that the harmful VOCs in typical Xi’an residential buildings in winter mainly came from furniture and building materials [27]. A study of the chemical composition of PM2.5 emitted from motor vehicles by dynamometer tests revealed that carbon species were the major components of PM2.5 for each type of vehicle, and the components of organic carbon (OC) were generally higher than those of elemental carbon (EC) [26]. Source apportionment and principal component analysis demonstrated that the polycyclic aromatic hydrocarbons (PAHs) in PM2.5 mainly came from coal combustion, biomass burning, and vehicle emissions [25]. These results are important for understanding the sources and their impact on health and climate. However, detailed information about some aspects of the atmospheric particles is not available. For example, the variation in the composition and sizes of different types of particles during the evolution of haze has not been well understood, which has hindered understanding of the formation mechanism of regional haze. Individual particle analysis has significant advantages in this regard, as it can provide not only the elemental compositions but also morphological and size information, favoring the identification of particle sources and understanding of the secondary formation of particles.
In this study, we collected aerosol particles during the haze event in winter in Xi’an, and have analyzed the size distribution, elemental components, and morphology of individual particles by means of TEM-EDX. The types, mixing states, sources, heterogeneous reactions, and aging process of particles were studied. These results could provide important information for the comprehensive governance of regional haze.

2. Sampling and Analysis

2.1. Site Description and Sampling

The sampling site was located at the Institute of Earth Environment, Chinese Academy of Sciences. The samplers were mounted on the roof of a building, about 10 m above ground level. There was no obvious pollution source around the sampling site. The sampling site was in the downwind direction of Xi’an City in winter, which could better represent the air pollution of Xi’an City. Aerosol particles were collected on copper TEM grids coated with carbon film by a DKL-2 single-stage cascade impactor with a 0.5 mm diameter jet nozzle at an airflow rate of 1.0 L min−1. When the particle density was 2 g cm−3, the collection efficiency of particles with an aerodynamic diameter of 0.5 μm reached 100%. The sampling time was from the 20 to 80 s, and the specific sampling time was determined according to the pollution situation. Temperature, relative humidity, and pressure all refer to the instantaneous values at the middle of the sampling period, which could well represent the meteorological conditions of the particles collected. The meteorological parameters, including temperature, relative humidity, and pressure, were recorded with a Kestrel 5500 portable meteorological instrument. The collected samples were stored in a sealed and dry plastic capsule in a dryer at 25 °C and 20 ± 3% relative humidity (RH) for subsequent TEM analysis. Cu was excluded from our analysis because the TEM grids were composed of Cu. Image analysis software (Leica Microsystems Image Solutions Ltd., Cambridge, UK) was used to obtain the equivalent spherical diameters of particles. The samples were numbered D1, D2, D3, and D4, according to the chronological order of sampling days. According to PM2.5 mass concentration, D1 was a moderate pollution day, D2 was a heavy pollution day, D3 was a clean day, and D4 was a light pollution day. Detailed information about the sample collections is presented in Table 1.

2.2. TEM-EDX Analysis

Individual particle samples were analyzed by Transmission Electron Microscopy (TEM) at 200 kV accelerating voltage, and the element composition was measured semi-quantitatively by Energy Dispersive X-ray Spectrometry (EDX). Studies have shown that TEM-EDX is a very effective method for analyzing atmospheric particles [30,31]. The collection time of the energy spectrum was about 30 s, and EDX can detect elements with atomic weights heavier than carbon. The distribution of aerosol particles on TEM grids was not uniform, with coarser particles occurring near the center and finer particles occurring on the periphery. Therefore, to make sure that the analyzed particles were representative of the entire size range, five domains were chosen from the center to the periphery of the sampling spot on each grid [32,33].

3. Results

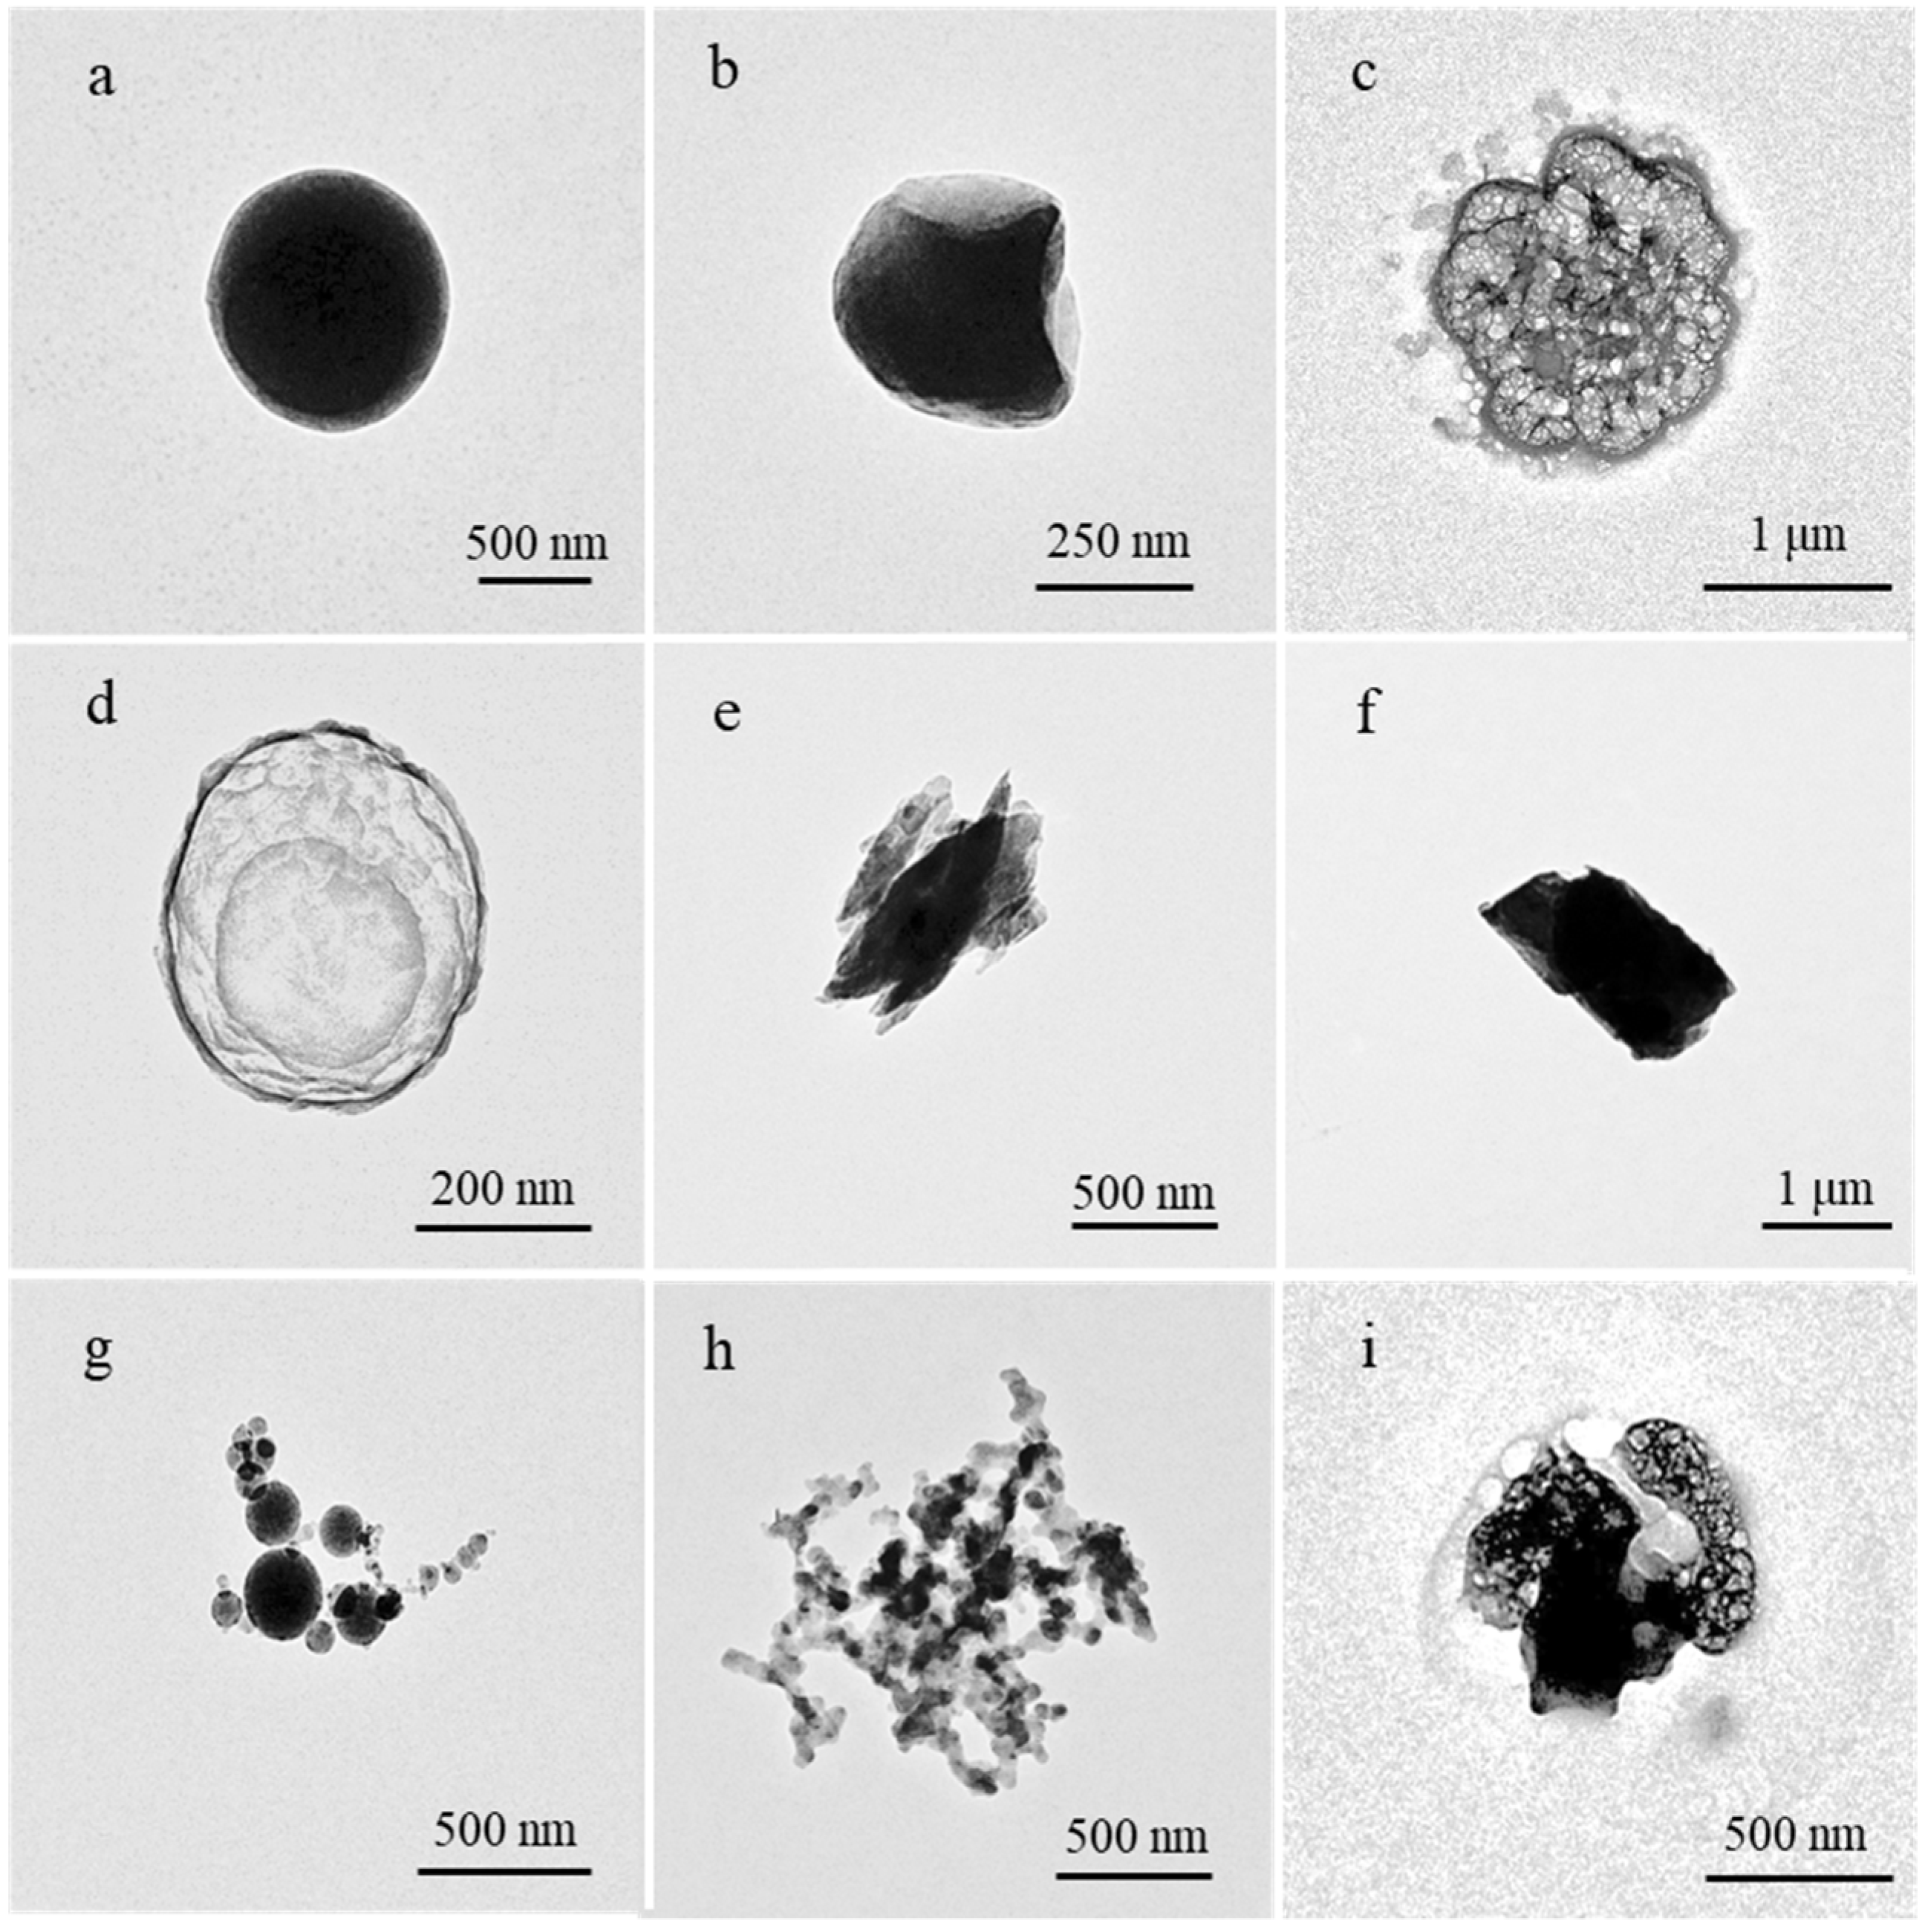
3.1. Types of Individual Particles

According to the elemental composition and morphology, the individual particles were divided into two categories: carbonaceous particles and non-carbonaceous particles. Carbonaceous particles were further subdivided into organic particles and soot particles. Non-carbonaceous particles were subdivided into sulfate particles, mineral particles, fly ash particles, and K-rich particles (Table 2).
Organic particles (Figure 1a,b) were mainly composed of C and O and contained a small amount of S, Na, Mg, K, and other elements. These are extremely stable under electron beams. Organic particles generally included regular organic particles (Figure 1a) and irregular, spherical organic particles (Figure 1b). Organic particles easily combine with sulfate particles, and, therefore, a coating on the surface of some organic particles was found in our study.
Sulfate particles (Figure 1c,d) represent secondary inorganic particles in the air and they are easily volatilized under the electron beams. The secondary inorganic particles detected by TEM-EDX have been suggested to be a mixture of sulfate and nitrate particles [34]. Sulfate particles that only contain S and O are known as ammonium sulfate [35]. Other sulfate particles containing S, O, Na, and K can be Na2SO4 and K2SO4 [36]. Sulfate particles tend to display an irregular shape, and coatings have also been found on this type of particles.
Soot particles (Figure 1h) are mainly composed of the elements C and O and contain trace amounts of S and K. Soot particles are chain-like aggregates of carbon spheres, composed of many carbonaceous pellets. They are not easy to volatilize under an electron beam. Some soot particles show onion-like nano-graphite structures under a high-resolution transmission electron microscope. Mixed particles combined with soot and sulfate are common on polluted days [37].
Mineral particles (Figure 1e,f) are mainly composed of crustal elements and are extremely stable under the electron beams [31]. The compositions of mineral particles are complex, containing Si, Ca, Al, Fe, Na, K, Mg, and P. The mineral particles are irregular, in general, and their sizes tend to be larger than those of other types of particles.
K-rich particles (Figure 1i) are mainly composed of K, together with S and minor O. TEM shows that the K-rich particles are irregular in shape. K-rich particles are considered as tracers of biomass burning.
Fly ash particles (Figure 1g) can be subdivided into three types, including Si-based fly ash particles, Fe-based fly ash particles and Zn-based fly ash particles. Fly ash particles are extremely stable under the electron beams and generally show regular spherical or quasi-spherical shapes. TEM showed that fly ash particles are easily mixed with sulfate particles.
Many mixed particles were also found in this study (Figure 2), and the proportion of these in all samples reached 33%. To understand the formation mechanism of different aerosol components, mixed particles can be further subdivided into five types, including soot–fly ash mixed particles (Figure 2a), sulfate–soot (S–soot) mixed particles (Figure 2b), sulfate–fly ash (S–fly ash) mixed particles (Figure 2c), core–shell structure particles (Figure 2d,e), and sulfate-organic (S–organic) mixed particles (Figure 2f). There are two main types of core–shell particles, including the organic-cored particles and the sulfate-cored particles. The core can be sulfate or organic, while the shell can be sulfate, nitrate, or organic matter.

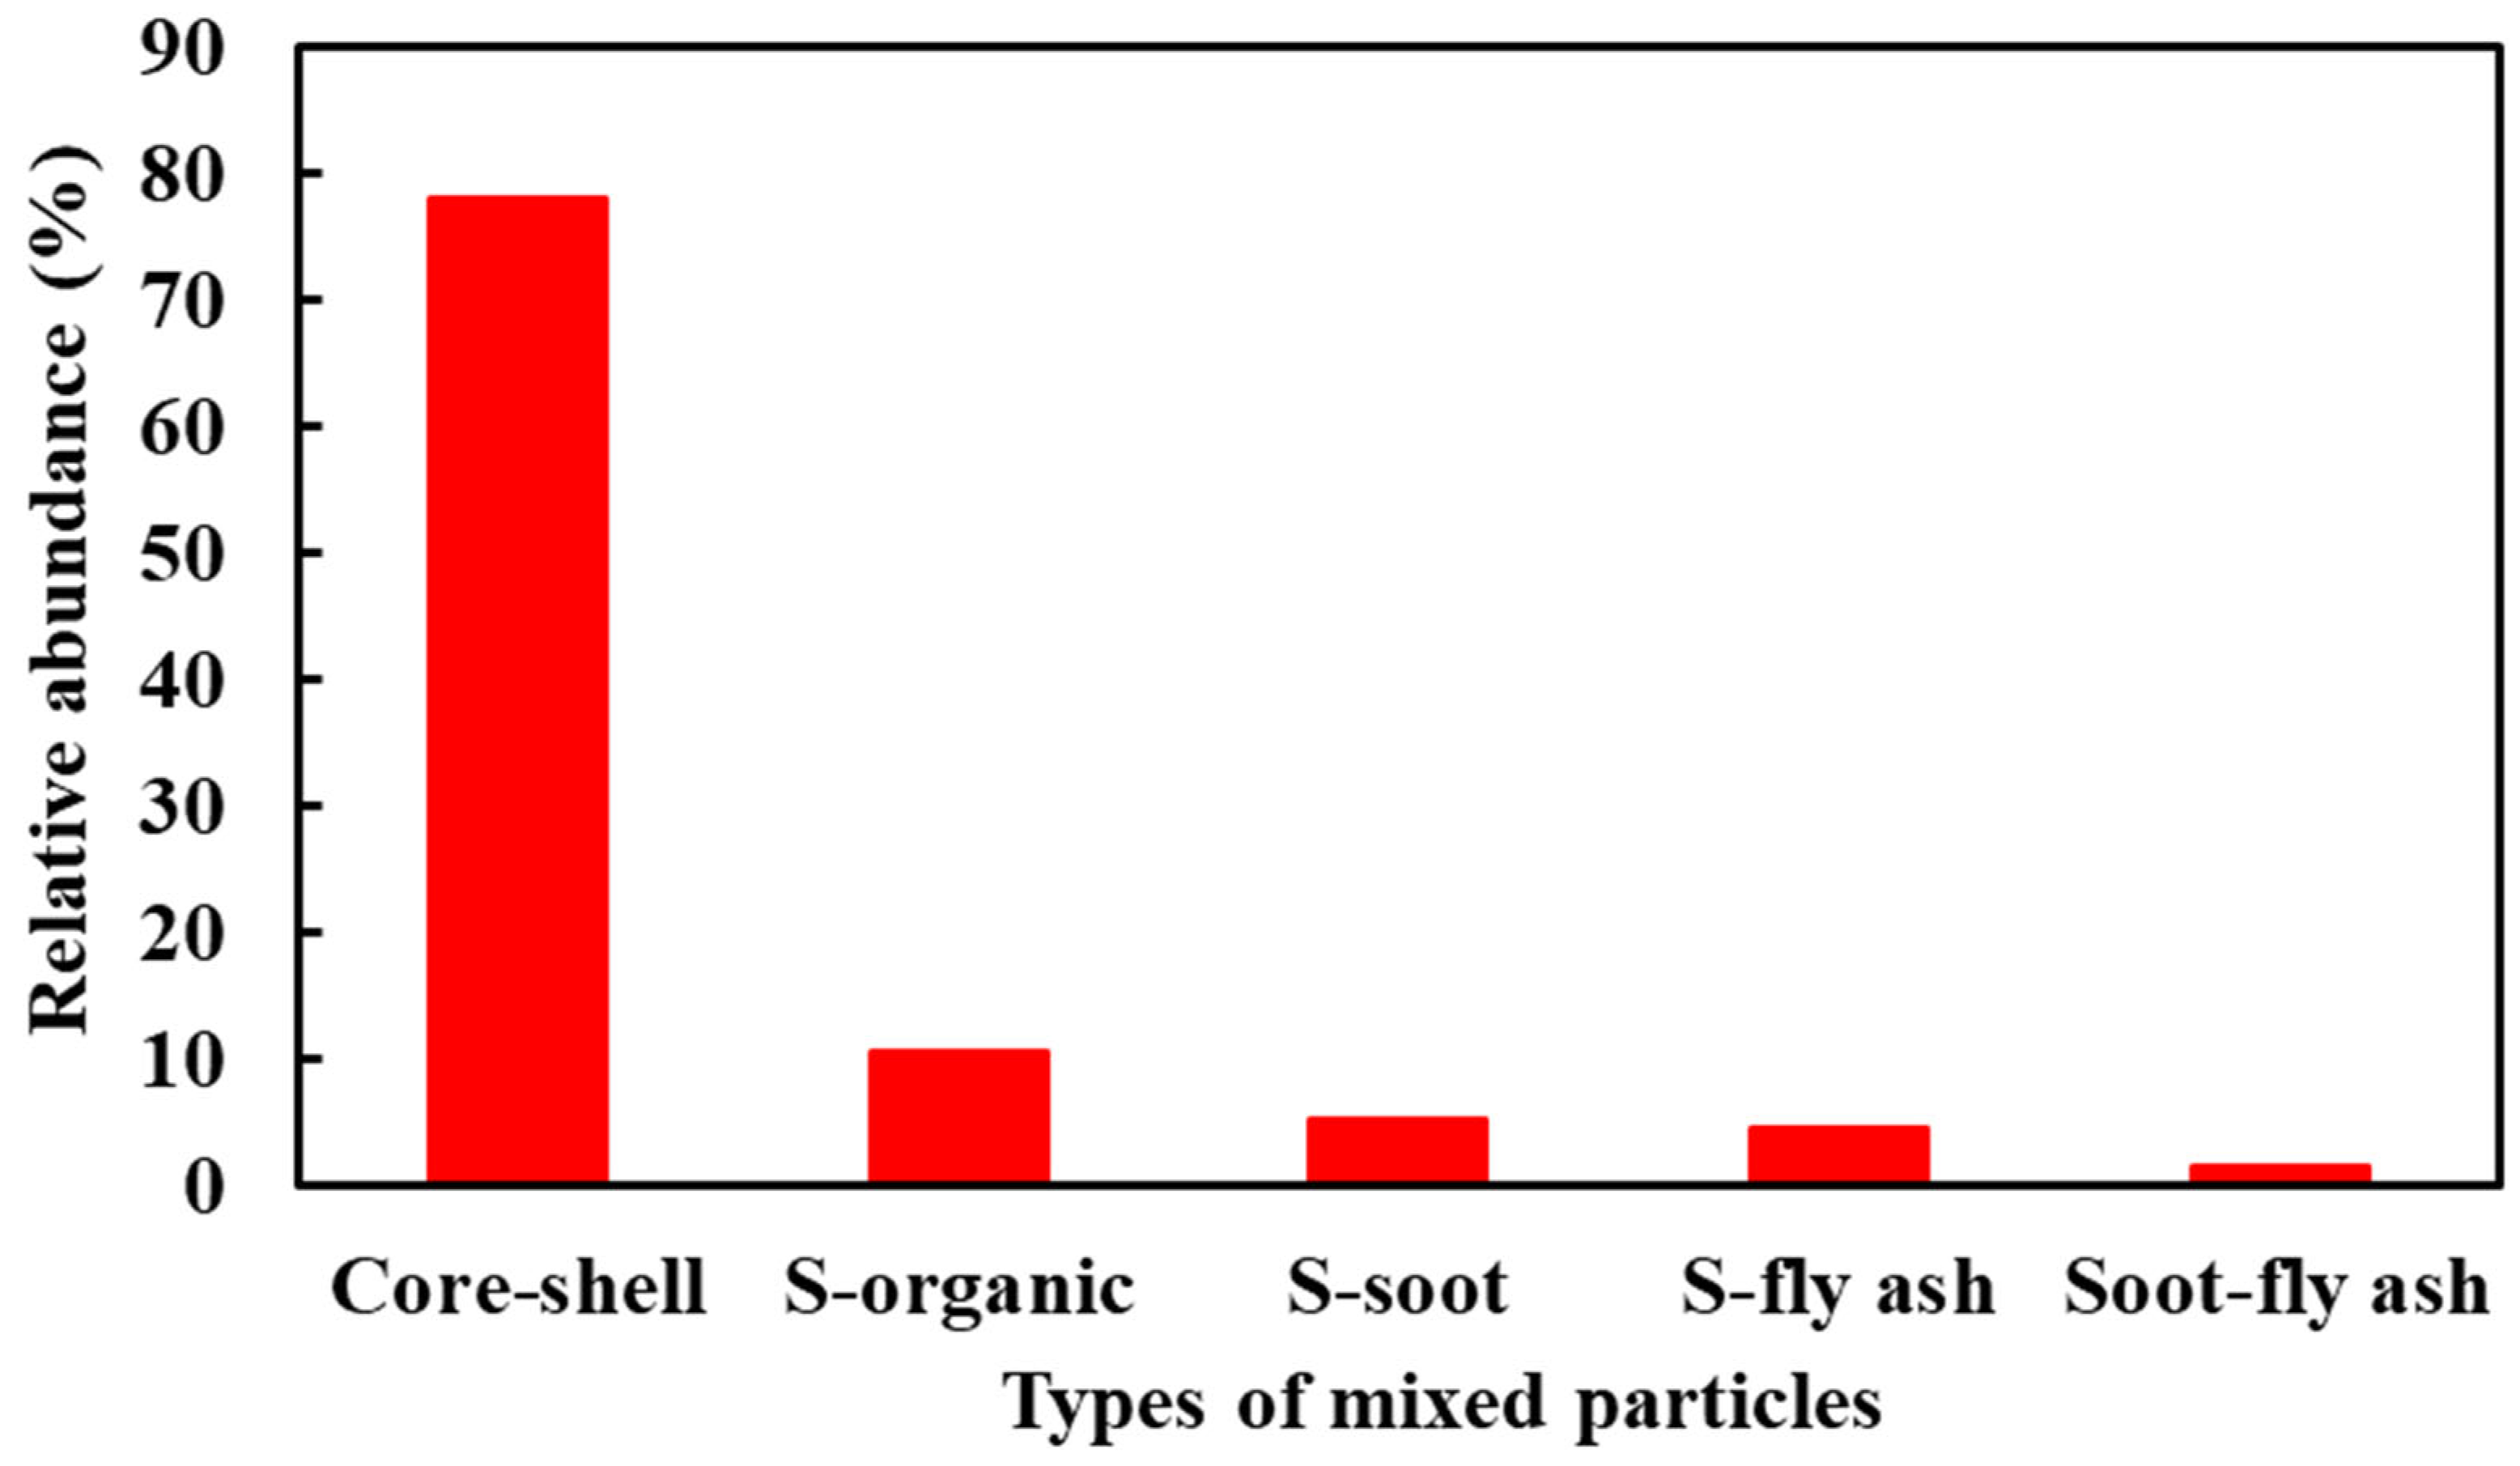
3.2. Relative Abundance of Different Types of Particles

A total of 519 individual particles were analyzed. The results showed that organic particles and sulfate particles had the highest proportions, reaching 41.88% and 32.26%, respectively, followed by soot particles (8.33%), mineral particles (7.91%), K-rich particles (5.13%), and fly ash particles (4.49%), in descending order.
Among all the particles, mixed particles accounted for 28.35% and were dominated by core–shell structure particles, accounting for 78.03% (Figure 3). The percentages of sulfate–organic mixed particles, sulfate–soot mixed particles, sulfate–fly ash mixed particles, and soot–fly ash mixed particles were 10.60%, 5.30%, 4.55%, and 1.52%, respectively (Figure 3).

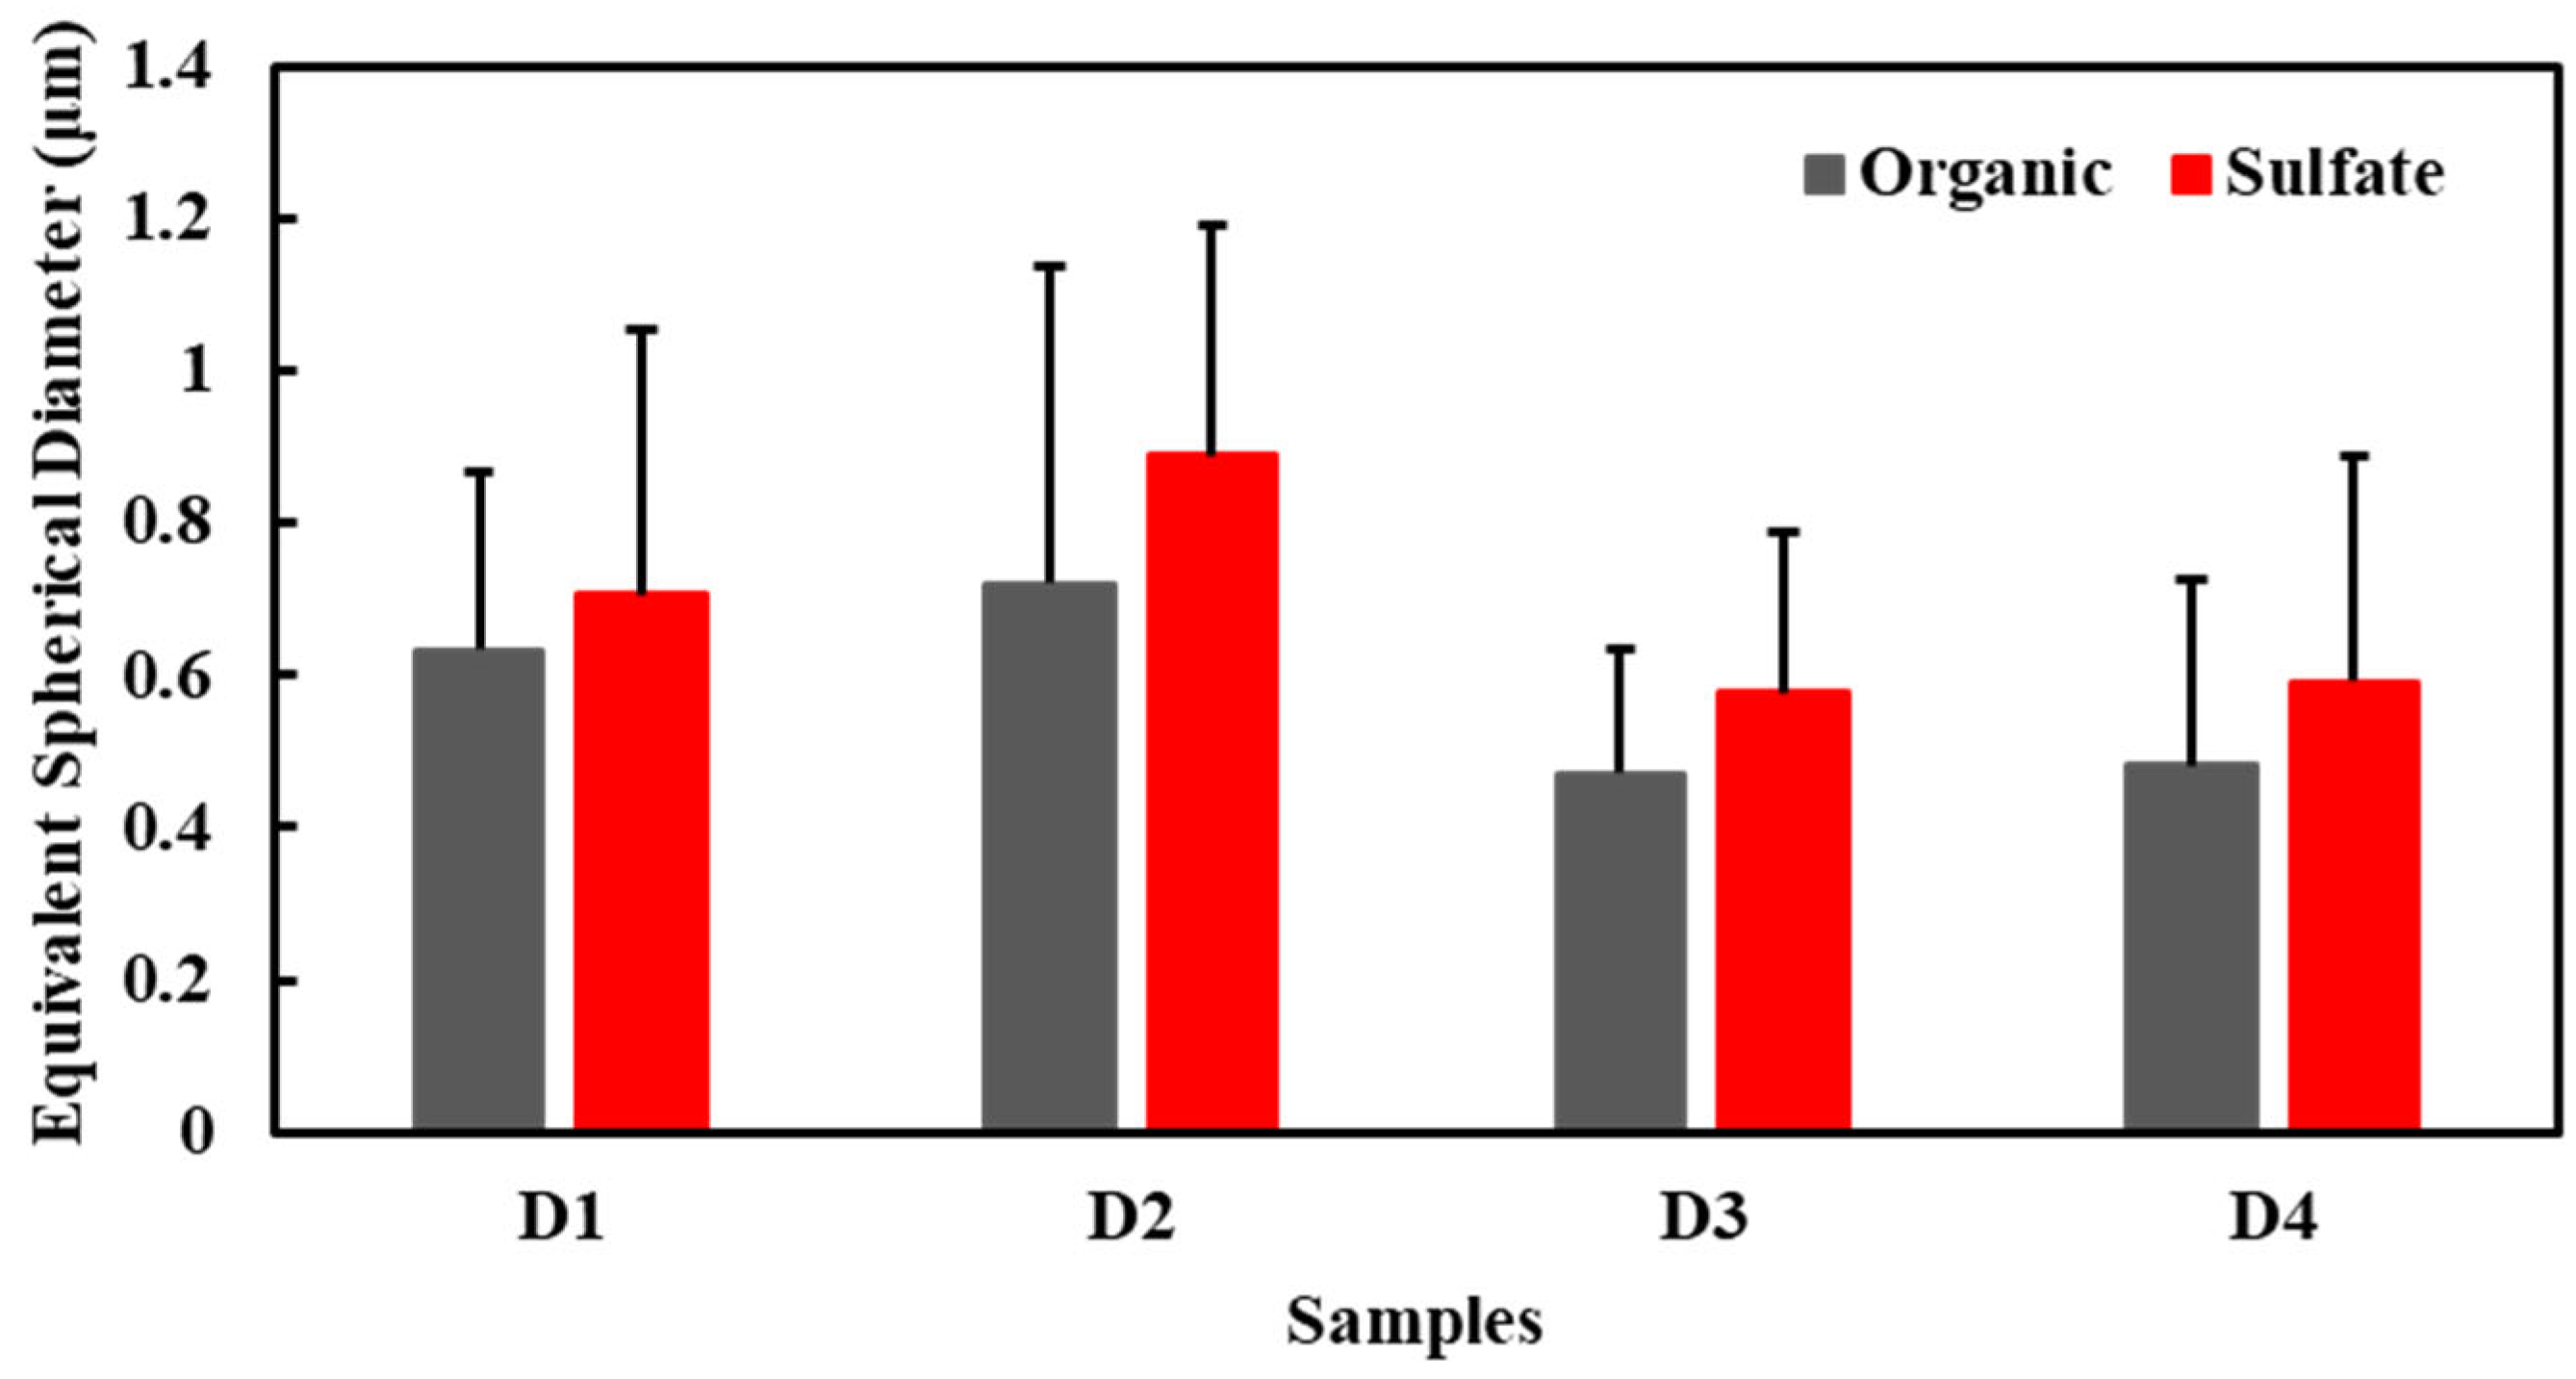
3.3. Size Distribution of Particles

The average sizes of particles in the D1, D2, D3, and D4 samples were 0.54, 0.95, 0.48 and 0.52 μm, respectively. The relative percentages of different particle types were calculated for different particle size segments (Figure 4). The average sizes of organic particles for the D1, D2, D3, and D4 samples were 0.63, 0.72, 0.48, and 0.47 μm, respectively. The average sizes of sulfate particles for the D1, D2, D3 and D4 samples were 0.71, 0.88, 0.57 and 0.59 μm, respectively. The size of organic particles ranged from 0.27 to 1.2 μm, with a median diameter of 0.44 μm, and the size of sulfate particles ranged from 0.16 to 1.2 μm, with a median diameter of 0.75 μm (Figure 5). The results showed that the mineral particles had the largest average size, this being 0.75 μm, followed by sulfate particles (0.69 μm), K-rich particles (0.59 μm), organic particles (0.58 μm), soot particles (0.53 μm), and fly ash particles (0.49 μm), in descending order.

4. Discussion

4.1. Possible Sources of Organic Particles

In this study, organic particles were the major type of individual particles, accounting for 41.88%. There were also many spherical organic particles among these. Shen et al. [38] found that organic matter (30.3%) was the main component of PM2.5 in Xi’an, followed by sulfate (26.9%) and nitrate (12.1%). Wang et al. [39] noticed that many spherical organic particles occurred in PM2.5 in Xi’an. Organic particles were also considered to be the main pollutants in the winter haze in areas other than Xi’an. Previous studies have also shown that the pollutants in haze in Northeast China were commonly associated with high levels of organic particles [34,40]. Similar results were obtained for haze in Beijing [41,42]. Previous studies have shown that the organic particles were mainly sourced from coal combustion [43]. Tian et al. [44] used the mass concentrations of OC/EC to analyze the source of carbonaceous aerosols, and the mean values for Xi’an were 5.8—well within the range for coal combustion (2.5–10.5)—indicating that coal combustion was the most important source of carbonaceous aerosol in winter in Xi’an. Therefore, we believe that the organic particles in the Xi’an samples mainly came from coal combustion.
Moreover, we found a few fly ash particles in these samples. These particles are believed to be mainly sourced from industrial activities and coal-fired power plants [45]. Some studies found that there were no fly ash particles in the coal emissions from domestic stoves [46,47], which may be due to combustion at temperatures far below those of power plants [48,49]. Some other investigations have shown that emissions of organic particles from industrial boilers and coal-fired power plants are far lower than those from coal and biomass burning in residential stoves [34,43,50]. These results indicate that air pollutants from industrial activity and coal-fired power plants contributed less to haze formation than those from domestic coal burning. Therefore, we conclude that the organic particles in these samples were mainly emitted by residential coal combustion.

4.2. The Mechanism of Haze Formation

As can be seen in Figure 6, the proportions of organic particles on D1, D2, D3, and D4 samples were 41.9%, 50.84%, 37.78%, and 38.97%, while the proportions of sulfate particles were 33.33%, 27.97%, 26.44%, and 38.23%. The proportion of organic particles in each sample was larger than that of sulfate particles. These results show that organic particles made a greater contribution to haze than secondary inorganic particles during the sampling period. The study found that the relative abundance of organic particles increased by 8.9% and sulfate particles increased by 5.4% during the evolutionary processes leading from moderate to heavy pollution days (D1 to D2). The results suggest that the organic particles emitted from residential coal combustion accumulated rapidly, in far greater quantities than the secondary generation of sulfate, leading to further aggravation of haze. When haze dissipated from D2 to D3, it was found that the relative abundance of organic particles decreased by 13.1%, which was much greater than the 1.5% decrease in the abundance of sulfate particles. This result further indicates that change in the content of organic particles was an important factor leading to the aggravation or dissipation of haze. It was found that the relative abundance of organic particles increased by 1.2% when the clean day evolved into to a light pollution day (D3 to D4), which was much smaller than the 11.8% increase in sulfate particle abundance. The results showed that the rate of formation of secondary inorganic particles was greater than the rate of emission of organic particles during evolution from a clean day to a light pollution day. From the above, we can conclude that in the evolution from a clean day to a light pollution day, change in the contents of secondary inorganic particles determined subsequent haze evolution. In the evolution from a moderate pollution day to a heavy pollution day, change in the contents of organic particles determined the further evolution of the haze. However, in terms of the absolute amounts of organic and sulfate particles over the four days, the organic particles contributed more to haze formation than the secondary inorganic particles during the sampling period.

4.3. Variation Characteristics of Particle Size

In this study, the daily average size of total particles from large to small was D2 (0.95 μm) > D1 (0.54 μm) > D4 (0.52 μm) > D3 (0.48 μm). The order of instantaneous relative humidity during the sampling period was D2 (62%) > D1 (49.5%) > D4 (31.2%) > D3 (22.2%). The variation trend of particle size was consistent with that of instantaneous relative humidity. The results show that higher relative humidity was beneficial to the growth of hygroscopic particles on haze days. It was found that the variation trends for daily average sizes of organic and sulfate particles was consistent with that of overall particles. The results show that the organic and sulfate particles exert major influences on the variation trends of particle size in haze. The study found that the average size of organic particles increased by 0.09 μm (Figure 7) and that of sulfate particles increased by 0.18 μm during the process of evolution from a moderate day to a heavy pollution day (D1 to D2), indicating that increase in sulfate particle size may be the factor leading to the increase in overall particle size in this process. When haze dissipated from D2 to D3, the average particle size of organic particles decreased by 0.25 μm and that of sulfate particles decreased by 0.31 μm (Figure 7), indicating that the decrease in sulfate particle size was the factor that affected the change in overall particle size. The average size of organic particles increased by 0.01 μm and that of sulfate particles increased by 0.14 μm (Figure 7)when the clean day evolved into a light pollution day (D3 to D4), indicating that the increase in sulfate particle size may have been the factor affecting the overall particle size change in this process. From the above, we can conclude that the sizes of organic particles and sulfate particles determine overall particle size on different pollution days and that change in sulfate particle size may contribute more to overall particle size change than change in organic particle size.

4.4. Comparison between the Aging States of the Organic and Sulfate Particles

Previous studies have shown that in the aging process, core particles can provide surfaces for the heterogeneous reaction of SO2 and NOX [51], forming the core–shell structures [52,53,54], which can be regarded as a sign of the aging of particles [55]. The core–shell structure particles accounted for 78.03% of the mixed particles during the sampling period. The core has two types, i.e., sulfate and organic, while the shell can be sulfate, nitrate, or organic matter. To better study the aging state of particles, we subdivided the core–shell structure particles into organic-cored particles and sulfate-cored particles. The thickness of the coating was used to measure the degree of aging of particles, and the larger the coating thickness, the more obvious the aging characteristics. This method has been proved effective by many studies [33,56,57]. The results presented in this study showed that the coating thickness of organic-cored particles was 369 nm and that of sulfate-cored particles was 322 nm (Figure 8), suggesting that the organic-cored particles were more aged than the sulfate-cored particles.
Temperature has an important influence on various atmospheric processes [58]. Organic and sulfate particles can age at different rates in the same environment, which is probably to be attributed to their optical properties. The aging degree of sulfate has been confirmed to be more obvious under strong solar radiation than under weak solar radiation [58]. Sulfate particles are capable of negative light radiation forcing [59,60,61], and organic particles are capable of positive light radiation forcing [62,63]. Due to backscattering light, the temperature of the reaction surface provided by sulfate may be lower than that provided by organic particles, which could lead to the differences in the heterogeneous reaction rates between the two reaction surfaces. Therefore, the aging of particles may be related to their optical properties.

5. Conclusions

(1)
Individual aerosol particles were analyzed by TEM-EDX and could be classified into two groups: carbonaceous particles and non-carbonaceous particles. Carbonaceous particles mainly included organic particles and soot particles, while non-carbonaceous particles included sulfate particles, mineral particles, fly ash particles, and K-rich particles.
(2)
Organic particles and sulfate particles were the principal particles collected during the sampling period, indicating that residential coal combustion seems to be the major pollutant source in haze formation. Organic particles greatly contributed to haze formation, more than secondary inorganic particles during the sampling period.
(3)
Organic and sulfate particles determined the variation trend of particle size in haze due to their abundance, and change in the sizes of the sulfate particles may have contributed more to the overall particle size changes than change in the sizes of the organic particles.
(4)
The aging rate of particles is related to their optical properties. In this study, organic particles were more aged than sulfate particles.

Author Contributions

Conceptualization, P.L.; Methodology, P.L. and M.Z.; Software, Y.L. and W.W.; Validation, P.L.; Formal analysis, P.L.; Investigation, M.Z. and X.F.; Resources, L.S.; Data curation, P.L. and M.Z.; Writing—original draft, P.L.; Writing—review and editing, L.S., Y.L., C.-X.Y., H.N. and D.Z.; visualization, P.L.; Supervision, L.S.; Project administration, L.S.; Funding acquisition, L.S. All authors have read and agreed to the published version of the manuscript.

Funding

This research was funded by National Natural Science Foundation of China (Grant No. 42075107), Fundamental Research Funds for the Central Universities (2021YJSDC13), and the Yueqi Scholar fund of the China University of Mining and Technology (Beijing).

Informed Consent Statement

Not applicable.

Data Availability Statement

Not application.

Acknowledgments

This study was supported by the National Natural Science Foundation of China (Grant No. 42075107), Fundamental Research Funds for the Central Universities (2021YJSDC13), and the Yueqi Scholar fund of the China University of Mining and Technology (Beijing).

Conflicts of Interest

The authors declare no conflict of interest.

References

  1. Liu, Y.; Zheng, M.; Yu, M.; Cai, X.; Du, H.; Li, J.; Zhou, T.; Yan, C.; Wang, X.; Shi, Z. High-time-resolution source apportionment of PM2.5 in Beijing with multiple models. Atmos. Chem. Phys. 2019, 19, 6595–6609. [Google Scholar] [CrossRef] [Green Version]
  2. Zhang, Y.; Zhang, X.; Fan, X.; Ni, C.; Sun, Z.; Wang, S.; Fan, J.; Zheng, C. Modifying effects of temperature on human mortality related to. black carbon particulates in Beijing, China. Atmos. Environ. 2020, 243, 11784. [Google Scholar] [CrossRef]
  3. Demott, P.J.; Cziczo, D.J.; Prenni, A.J.; Murphy, D.M.; Rogers, D.C. Measurements of the concentration and composition of nuclei for cirrus formation. Proc. Natl. Acad. Sci. USA 2003, 100, 14655–14660. [Google Scholar] [CrossRef] [Green Version]
  4. Dusek, U.; Frank, G.P.; Hildebrandt, L.; Curtius, J.; Schneider, J.; Walter, S.; Chand, D.; Drewnick, F.; Hings, S.; Jung, D. Size matters more than chemistry for cloud-nucleating ability of aerosol particles. Science 2006, 312, 1375–1378. [Google Scholar] [CrossRef] [Green Version]
  5. Andreae, M.O.; Rosenfeld, D. Aerosol–cloud–precipitation interactions. Part 1. The nature and sources of cloud-active aerosols. Earth Sci. Rev. 2008, 89, 13–41. [Google Scholar] [CrossRef]
  6. Cao, J.; Wang, Q.; Chow, J.C.; Waston, J.G.; Ti, X.; Shen, Z.; Wang, P.; An, Z. Impacts of aerosol compositions on visibility impairment in Xi’an. Atmos. Environ. 2012, 59, 559–566. [Google Scholar] [CrossRef]
  7. Rozanov, V.V.; Rozanov, A.V.; Kokhanovsky, A.A.; Burrows, J.P. Radiative transfer through terrestrial atmosphere and ocean: Software package sciatran. J. Quant. Spectrosc. Radiat. Transf. 2014, 133, 13–71. [Google Scholar] [CrossRef]
  8. Anderson, H.; Bremner, S.; Atkinson, R.; Harrison, R.; Walters, S. Particulate matter and daily mortality and hospital admissions in the west midlands conurbation of the United Kingdom: Associations with fine and coarse particles, black smoke and sulphate. Occup. Environ. Med. 2001, 58, 504–510. [Google Scholar] [CrossRef] [Green Version]
  9. Shawna, S.; Cheng, Y.; Yeh, H. Deposition of ultrafine particles in human tracheobronchial airways of adults and children. Aerosol Sci. Technol. 2001, 35, 697–709. [Google Scholar] [CrossRef]
  10. Georgakakou, S.; Gourgoulianis, K.; Daniil, Z.; Bontozoglou, V. Prediction of particle deposition in the lungs based on simple modeling of alveolar mixing. Physiol. Neurobi 2016, 225, 8–18. [Google Scholar] [CrossRef]
  11. Li, X.; Jiang, L.; Bai, Y.; Yang, Y.; Liu, S.; Chen, X.; Xu, J.; Liu, Y.; Wang, Y.; Guo, X. Wintertime aerosol chemistry in Beijing during haze period: Significant contribution from secondary formation and biomass burning emission. Atmos. Res. 2019, 218, 25–33. [Google Scholar] [CrossRef]
  12. Tong, S.; Kong, L.; Yang, K.; Shen, J.; Wang, L. Characteristics of air pollution episodes influenced by biomass burning pollution in Shanghai, China. Atmos. Environ. 2020, 238, 117756. [Google Scholar] [CrossRef]
  13. Wu, C.; Wang, H.; Cai, J.; He, H.; Peng, Z. Impact of the COVID-19 lockdown on roadside traffic-related air pollution in Shanghai, China. Build. Environ. 2021, 194, 107718. [Google Scholar] [CrossRef]
  14. Liao, T.; Wang, S.; Ai, J.; Gui, K.; Duan, B.; Zhao, Q.; Zhang, X.; Jiang, W.; Sun, Y. Heavy pollution episodes, transport pathways and potential sources of PM2.5 during the winter of 2013 in Chengdu (China). Sci. Total Environ. 2017, 584, 1056–1065. [Google Scholar] [CrossRef]
  15. Peng, Y.; Cui, J.; Zhu, H.; Cao, Y.; Du, K.; Yao, D. Long-term spatiotemporal variations of atmospheric sulfur, nitrogen and particle pollutants in Chongqing, southwest China: Implication of industrial transfer. Environ. Sci. Pollut. Res. 2019, 26, 8098–8110. [Google Scholar] [CrossRef]
  16. Hu, T.F.; Cao, J.J.; Shen, Z.X.; Wang, G.H.; Lee, S.C.; Ho, K.F. Size differentiation of individual atmospheric aerosol during winter in Xi’an, China. Aerosol Air Qual. Res. 2012, 12, 951–960. [Google Scholar] [CrossRef] [Green Version]
  17. Wang, J.; Wang, S.; Meng, X.; Zhao, Y.; Ling, Y.; Liu, X. Study on the influence of dust weather on air pollution in Xi’an. J. Dzt. Res. 2004, 24, 558–564, (In Chinese with English abstract). [Google Scholar] [CrossRef]
  18. Ma, B.; Wang, L.; Tao, W.; Liu, M.; Zhang, P.; Zhang, S.; Li, X.; Lu, X. Phthalate esters in atmospheric PM2.5 and PM10 in the semi-arid city of Xi’an, Northwest China: Pollution characteristics, sources, health risks, and relationships with meteorological factors. Chemosphere 2020, 242, 125221–125226. [Google Scholar] [CrossRef]
  19. Li, Y.; Li, J.; Yang, W.; Wang, L.; Ma, S. Transmission characteristics of atmospheric particulate matter over the Fen-Wei Plain and its surrounding areas in 2018. Acta Sci. Circum. 2020, 40, 779–791, (In Chinese with English abstract). [Google Scholar] [CrossRef]
  20. Meng, X.; Wang, J.; Lin, Y.; Deng, X. Relationship between meteorological conditions and pollutants in Xi’an and forecasting methods. Shaanxi Meteorol. 2001, 6, 23–26, (In Chinese with English abstract). [Google Scholar] [CrossRef]
  21. Han, J.; Dai, Z.; Li, W. Analysis of PM2.5 concentration and meteorological conditions under haze weather in Xi’an City. Environ. Pollut. Control 2014, 36, 52–56, (In Chinese with English abstract). [Google Scholar] [CrossRef]
  22. Zhang, R.; Rui, S.; Wang, W.; Wang, J.; Hao, Y. Influence of meteorological conditions on pollution characteristics of near-surface atmospheric environment in summer and winter in Xi’an City. Ecol. Environ. Sci. 2020, 29, 165–174, (In Chinese with English abstract). [Google Scholar] [CrossRef]
  23. Xu, H.; Cao, J.; Shen, Z.; Liu, S.; Zhang, T.; Zhou, J. Change characteristics of PM2.5 chemical components corresponding to different air quality levels in Xi’an in winter. Sci. Technol. Rev. 2015, 33, 31–36, (In Chinese with English abstract). [Google Scholar] [CrossRef]
  24. Chen, Q.; Sun, H.; Wang, M.; Mu, Z.; Wang, Y.; Wang, Y.; Wang, Y.; Zhang, L.; Zhang, Z. Dominant fraction of EPFRs from non-solvent-extractable organic matter in fine particulates over Xi’an, China. Environ. Sci. Technol. 2018, 52, 9646–9655. [Google Scholar] [CrossRef]
  25. Zeng, Y.; Shen, Z.; Lei, Y.; Zhang, T.; Zhang, Q.; Xu, H.; Wang, Q.; Cao, J.; Liu, Y. PAHs in fine particles over Xi’an, a typical northwestern city in China: Sources, distribution, and controlling factors. Environ. Sci. Processes Impacts 2018, 20, 1262–1272. [Google Scholar] [CrossRef]
  26. Hao, Y.; Gao, C.; Deng, S.; Yuan, M.; Song, W.; Lu, Z.; Qiu, Z. Chemical characterisation of PM2.5 emitted from motor vehicles powered by diesel, gasoline, natural gas and methanol fuel. Sci. Total Environ. 2019, 674, 128–139. [Google Scholar] [CrossRef]
  27. Huang, Y.; Su, T.; Wang, L.; Wang, N.; Xue, Y.; Dai, W.; Lee, S.C.; Cao, J.; Ho, S.S.H. Evaluation and characterization of volatile air toxics indoors in a heavy polluted city of northwestern China in wintertime. Sci. Total Environ. 2019, 662, 470–480. [Google Scholar] [CrossRef]
  28. Xin, K.; Zhao, J.; Ma, X.; Han, L.; Gao, Y. Effect of urban underlying surface on PM2.5 vertical distribution based on UAV in Xi’an, China. Environ. Monit. Assess. 2021, 193, 312. [Google Scholar] [CrossRef]
  29. Lee, K.Y.; Wong, C.K.C.; Chuang, K.J.; Bien, M.Y.; Cao, J.J.; Han, Y.M.; Tian, L.W.; Chang, C.C.; Feng, P.H.; Ho, K.F.; et al. Methionine oxidation in albumin by fine haze particulate matter: An in vitro and in vivo study. J. Hazard. Mater. 2014, 274, 384–391. [Google Scholar] [CrossRef]
  30. Shao, L.Y.; Li, Y.W.; Jones, T.; Santosh, M.; Liu, P.J.; Zhang, M.Y.; Xu, L.; Li, W.J.; Lu, J.; Yang, C.X.; et al. Airborne microplastics: A review of current perspectives and environmental implications. J. Clean. Prod. 2022, 347, 131048. [Google Scholar] [CrossRef]
  31. Shao, L.Y.; Liu, P.J.; Jones, T.; Yang, S.S.; Wang, W.H.; Zhang, D.Z.; Li, Y.W.; Yang, C.-X.; Xing, J.P.; Hou, C.; et al. A review of atmospheric individual particle analyses: Methodologies and applications in environmental research. Gondwana Res. 2022, in press. [Google Scholar] [CrossRef]
  32. Li, W.J.; Shao, L.Y. Chemical modification of dust particles during different dust storm episodes. Aerosol Air Qual. Res. 2013, 12, 1095–1104. [Google Scholar] [CrossRef] [Green Version]
  33. Xu, L.; Zhang, D.; Li, W. Microscopic comparison of aerosol particles collected at an urban site in North China and a coastal site in Japan. Sci. Total Environ. 2019, 669, 948–954. [Google Scholar] [CrossRef]
  34. Zhang, J.; Liu, L.; Xu, L.; Lin, Q.; Li, W. Exploring wintertime regional haze in northeast China: Role of coal and biomass burning. Atmos. Chem. Phys. 2020, 20, 5355–5372. [Google Scholar] [CrossRef]
  35. Fu, H.; Zhang, M.; Li, W.; Chen, J.; Wang, L.; Quan, X.; Wang, W. Morphology, composition and mixing state of individual carbonaceous aerosol in urban Shanghai. Atmos. Chem. Phys. 2011, 11, 20973–21011. [Google Scholar] [CrossRef] [Green Version]
  36. Li, W.J.; Shao, L.Y.; Buseck, P.R. Haze types in Beijing and the influence of agricultural biomass burning. Atmos. Chem. Phys. 2010, 10, 8119–8130. [Google Scholar] [CrossRef] [Green Version]
  37. Li, W.J.; Shao, L.Y.; Zhang, D.D.; Ro, C.; Hu, M.; Bi, X.; Geng, H.; Matsuki, A.; Niu, H.; Chen, J. A review of single aerosol particle studies in the atmosphere of East Asia: Morphology, mixing state, source, and heterogeneous reactions. J. Clean. Prod. 2016, 112, 1330–1349. [Google Scholar] [CrossRef]
  38. Shen, Z.; Cao, J.; Liu, S.; Zhu, C.; Wang, X.; Zhang, T.; Xu, H.; Hu, T. Chemical composition of PM10 and PM2.5 collected at ground level and 100 meters during a strong winter-time pollution episode in Xi’an, China. J. Air Waste Manag. 2011, 61, 1150–1159. [Google Scholar] [CrossRef] [Green Version]
  39. Wang, M.; Hu, T.; Wu, F.; Duan, J.; Song, Y.; Xue, C.; Zhang, N.; Zhang, D. Characterization of PM2.5 carbonaceous particles with a high-efficiency SEM: A case study at a suburban area of Xi’an. Aerosol Sci. Eng. 2020, 5, 70–80. [Google Scholar] [CrossRef]
  40. Xu, L.; Liu, L.; Zhang, J.; Zhang, Y.; Li, W. Morphology, composition, and mixing state of individual aerosol particles in northeast China during wintertime. Atmosphere 2017, 8, 47. [Google Scholar] [CrossRef] [Green Version]
  41. Sun, Y.; Wang, Z.; Fu, P.; Yang, T.; Jiang, Q.; Dong, H.; Li, J.; Jia, J. Aerosol composition, sources and processes during wintertime in Beijing, China. Atmos. Chem. Phys. 2013, 13, 4577–4592. [Google Scholar] [CrossRef] [Green Version]
  42. Han, L.; Xiang, X.; Zhang, H.; Cheng, S.; Wang, H.; Wei, W.; Wang, H.; Lang, J. Insights into submicron particulate evolution, sources and influences on haze pollution in Beijing, China. Atmos. Environ. 2019, 201, 360–368. [Google Scholar] [CrossRef]
  43. Zhang, Y.; Schauer, J.J.; Zhang, Y.; Zeng, L.; Wei, Y.; Liu, Y.; Shao, M. Characteristics of particulate carbon emissions from real-world Chinese coal combustion. Environ. Sci. Technol. 2008, 42, 5068–5073. [Google Scholar] [CrossRef] [PubMed]
  44. Tian, P.; Cao, J.; Han, Y.; Zhang, N.; Zhang, R.; Liu, S. Analysis of pollution characteristics and sources of carbon aerosols in winter PM2.5 in Guanzhong Plain. Environ. Sci. 2016, 2, 427–433, (In Chinese with English abstract). [Google Scholar] [CrossRef]
  45. Li, W.J.; Shao, L.Y. Transmission electron microscopy study of aerosol particles from the brown hazes in northern China. J. Geophys. Res. Atmos. 2009, 114, D09302. [Google Scholar] [CrossRef]
  46. Hou, C.; Shao, L.Y.; Zhao, C.; Jing, W.; Liu, J.; Geng, C. Characterization of coal burning-derived individual particles emitted from an experimental domestic stove. J. Environ. Sci. China 2018, 71, 45–55. [Google Scholar] [CrossRef]
  47. Wang, W.H.; Shao, L.Y.; Li, J.; Chang, L.L.; Zhang, D.Z.; Zhang, C.C.; Jiang, J.K. Characteristics of individual particles emitted from an experimental burning chamber with coal from the lung cancer area of Xuanwei, China. Aerosol Air Qual. Res. 2019, 19, 355–363. [Google Scholar] [CrossRef]
  48. Vassilev, S.V.; Menendez, R.; Borrego, A.G. Phase-mineral and chemical composition of coal fly ashes as a basis for their multicomponent utilization. 3. Characterization of magnetic and char concentrates. Fuel 2004, 83, 1563–1583. [Google Scholar] [CrossRef]
  49. Fomenko, E.V.; Anshits, N.N.; Solovyov, L.A.; Mikhaylova, O.A.; Anshits, A.G. Composition and morphology of fly ash cenospheres produced from the combustion of kuznetsk coal. Energy Fuels 2013, 27, 5440–5448. [Google Scholar] [CrossRef]
  50. Liu, J.; Mauzerall, D.L.; Qi, C.; Qiang, Z.; Zhu, T. Air pollutant emissions from Chinese households: A major and underappreciated ambient pollution source. Proc. Natl. Acad. Sci. USA 2016, 113, 7756–7761. [Google Scholar] [CrossRef] [Green Version]
  51. Ebert, M.; Weigel, R.; Kandler, K.; Günther, G.; Molleker, S.; Grooß, J.; Vogel, B.; Weinbruch, S.; Borrmann, S. Chemical analysis of refractory stratospheric aerosol particles collected within the arctic vortex and inside polar stratospheric clouds. Atmos. Chem. Phys. 2016, 16, 8405–8421. [Google Scholar] [CrossRef] [Green Version]
  52. You, Y.; Renbaum-Wolff, L.; Carreras-Sospedra, M.; Hanna, S.J.; Hiranuma, N.; Kamal, S.; Smith, M.L.; Zhang, X.; Weber, R.J.; Shilling, J.E. Images reveal that atmospheric particles can undergo liquid-liquid phase separations. Proc. Natl. Acad. Sci. USA 2012, 109, 13188–13193. [Google Scholar] [CrossRef] [PubMed] [Green Version]
  53. Li, W.; Sun, J.; Xu, L.; Shi, Z.; Riemer, N.; Sun, Y.; Fu, P.; Zhang, J.; Lin, Y.; Wang, X. A conceptual framework for mixing structures in individual aerosol particles. J. Geophys. Res. 2016, 121, 13784–13798. [Google Scholar] [CrossRef]
  54. Niu, H.; Hu, W.; Zhang, D.; Wu, Z.; Guo, S.; Pian, W.; Cheng, W.; Hu, M. Variations of fine particle physiochemical properties during a heavy haze episode in the winter of Beijing. Sci. Total Environ. 2016, 571, 103–109. [Google Scholar] [CrossRef] [PubMed]
  55. Niu, H.Y.; Shao, L.Y.; Zhang, D.Z. Soot particles at an elevated site in eastern China during the passage of a strong cyclone. Sci. Total Environ. 2012, 430, 217–222. [Google Scholar] [CrossRef]
  56. Chen, S.R.; Xu, L.; Zhang, Y.X.; Chen, B.; Wang, X.F.; Zhang, X.Y.; Zheng, M.; Chen, J.M.; Wang, W.X.; Sun, Y.L. Direct observations of organic aerosols in common wintertime hazes in North China: Insights into their size, shape, mixing state, and source. Atmos. Chem. Phys. 2016, 494, 1–32. [Google Scholar] [CrossRef] [Green Version]
  57. Hou, C.; Shao, L.Y.; Hu, W.; Zhang, D.Z.; Zhao, C.M.; Xing, J.P.; Huang, X.F.; Hu, M. Characteristics, and aging of traffic-derived particles in a highway tunnel at a coastal city in southern China. Sci. Total Environ. 2018, 619, 1385–1393. [Google Scholar] [CrossRef]
  58. Tie, X.; Granier, C.; Randel, W.; Brasseu, G. Effects of interannual variation of temperature on heterogeneous reactions and stratospheric ozone. J. Geophys. Res. Atmos. 1997, 102, 23519–23527. [Google Scholar] [CrossRef]
  59. Abo Riziq, A.; Erlick, C.; Dinar, E.; Rudich, Y. Optical properties of absorbing and non-absorbing aerosols retrieved by cavity ring down (CRD) spectroscopy. Atmos. Chem. Phys. 2007, 6, 1523–1536. [Google Scholar] [CrossRef] [Green Version]
  60. Liu, Y.; Sun, J.; Yang, B. The effects of black carbon and sulphate aerosols in China regions on East Asia monsoons. Tellus 2010, 61, 642–656. [Google Scholar] [CrossRef] [Green Version]
  61. Lambert, A.; Grainger, R.G.; Rogers, H.L.; Norton, W.A.; Rodgers, C.D.; Taylor, F.W. The H2SO4 component of stratospheric aerosols derived from satellite infrared extinction measurements: Application to stratospheric transport studies. Geophys. Res. Lett. 2013, 23, 2219–2222. [Google Scholar] [CrossRef]
  62. Kanakidou, M.; Seinfeld, J.H.; Pandis, S.N.; Barnes, I.; Dentener, F.J.; Facchini, M.C.; Van Dingenen, R.; Ervens, B.; Nenes, A.; Nielsen, C.J. Organic aerosol and global climate modelling: A review. Atmos. Chem. Phys. 2005, 4, 1053–1123. [Google Scholar] [CrossRef] [Green Version]
  63. Tao, J.; Surapipith, V.; Han, Z.; Prapamontol, T.; Zhang, R. High mass absorption efficiency of carbonaceous aerosols during the biomass burning season in Chiang Mai of northern Thailand. Atmos. Environ. 2020, 240, 117821. [Google Scholar] [CrossRef]
Figure 1. TEM images of individual particles in the winter haze of Xi’an during the sampling period. (a) Spherical organic particle. (b) Irregularly shaped organic particle. (c) Non-volatile sulfate. (d) Foamed sulfate. (e) Mineral: Si + Al. (f) Mineral: Ca. (g) Fly ash particles. (h) Soot particles. (i) K-rich particle.
Atmosphere 13 00521 g001
Figure 2. TEM images of mixed individual particles in the winter haze of Xi’an during the sampling period. (a) Soot–fly ash mixed particle. (b) Sulfate–soot mixed particle. (c) Sulfate–fly ash mixed particle. (d,e) Mixed particles with core–shell structures. (f) Sulfate–organic mixed particle.
Atmosphere 13 00521 g002
Figure 3. The relative proportions of different types of particles among those identified as mixed particles over all four sampling days in the winter haze of Xi’an during the sampling period.
Atmosphere 13 00521 g003
Figure 4. Relative number abundance–size distribution plots for all types of particles obtained by adding together the data for all four sampling days in the winter haze of Xi’an during the sampling period.
Atmosphere 13 00521 g004
Figure 5. Size distributions of organic particles and sulfate particles in the winter haze of Xi’an during the sampling period. N is the total number of particles in due size, and d(lgDp) is the derivative of the logarithm of the particle diameter Dp (Dp is the equivalent spherical diameter of analyzed individual particles) in the caption.
Atmosphere 13 00521 g005
Figure 6. Relative abundance of different particle types in daily samples of the winter haze in Xi’an during the sampling period.
Atmosphere 13 00521 g006
Figure 7. The average sizes of organic and sulfate particles in the daily samples of the winter haze in Xi’an during the sampling period.
Atmosphere 13 00521 g007
Figure 8. The correlation between the Dshell and coating thickness in the organic-cored particles and sulfate-cored particles in the winter haze of Xi’an during the sampling period.
Atmosphere 13 00521 g008
Table 1. Summary of sampling information.
Sample NumberDate
(2019)
Sampling Duration (Second)T
(°C)
RH
(%)
P
(hPa)
PM2.5 (μg m−3)
D11/23302.549.5975.0147
D21/24200.662.0972.2183
D31/25809.622.2981.050
D41/26408.331.2977.296
Table 2. Types and characteristics of individual particles in the winter haze of Xi’an during the sampling period.
Particle GroupsParticle TypesMajor ElementsMorphologies
Carbonaceous particlesOrganicC and OSpherical or irregularly shaped, easily combine with sulfate
SootC and OChain or dense, with sulfate adsorbed on the surface
Non-carbonaceous particlesMineralSi, Ca, Al, and FeIrregularly shaped, tended to have a larger diameter
Fly ashSi, Fe, and ZnSpherical, some particles mixed with sulfate
SulfateS, O, Na, and KFoam-like, unstable under electron beam
K-richK, C, Cl, and SIrregularly shaped
Publisher’s Note: MDPI stays neutral with regard to jurisdictional claims in published maps and institutional affiliations.

