Article

Atmospheric Exploration of the Qinghai–Tibet Plateau during the East Asian Winter Monsoon (EAWM) from a Ground-Based Microwave Radiometer

1
State Key Laboratory of Plateau Ecology and Agriculture, Laboratory of Ecological Protection and High-Quality Development in the Upper Yellow River, School of Water Resources and Electric Power, Qinghai University, Xining 810016, China
2
State Key Laboratory of Hydroscience and Engineering, Department of Hydraulic Engineering, Tsinghua University, Beijing 100084, China
*
Author to whom correspondence should be addressed.
Atmosphere 2022, 13(4), 549; https://doi.org/10.3390/atmos13040549
Submission received: 20 January 2022 / Revised: 28 February 2022 / Accepted: 23 March 2022 / Published: 29 March 2022
(This article belongs to the Special Issue Atmospheric Applications in Microwave Radiometry)

Abstract

:
The investigation of atmospheric characteristics is of great significance in properly exploiting air and water resources, and quantitatively estimating and nowcasting precipitation. Microwave radiometers are widely used in this field because they can operate unattended for a long time under almost all weather conditions, and obtain high-quality remote sensing data. This research focuses on the applications of ground-based microwave radiometers in retrieving meteorological characteristics of the Qinghai–Tibet Plateau (QTP) during the East Asian winter monsoon (EAWM), such as humidity and temperature structures, stability/convection indices, and cloud and precipitation retrievals. Vertical structures of atmospheric temperature, pressure, humidity, and other variables were investigated under clear-sky and snowy-sky conditions. The statistical characteristics of stability/convection indices in the QTP region, such as convective available potential energy (CAPE) and convective inhibition (CIN), were investigated, with a special focus on snowy-sky conditions. The relationship between potential cloud water resources and atmospheric and thermodynamics and instability conditions were taken into consideration. The results showed that the peak CAPEs under clear-sky and snowy-sky conditions were 1349.11 J/kg and 1165.12 J/kg, which were relatively larger than the corresponding values during the summer monsoon. CINs during the EAWM were small enough to be negligible. For quantitative precipitation forecasting (QPF), brightness temperatures at 30.0 GHz and 51.24 GHz sampling channels were sensitive to the snowfall process. Within 1 h before snowfall, the precipitable water vapour (PWV) and liquid water content (LWC) increased sharply by 0.05 cm and 0.12 mm, respectively, while the CAPE and downwards CAPE decreased by 225.60 J/kg and 180.31 J/kg, respectively. The findings of this article may be meaningful for characterizing meteorology and precipitation in the QTP and similar regions during the winter monsoon.

1. Introduction

The Qinghai–Tibet Plateau (QTP), an inland plateau in Asia, is the largest plateau in China and the highest altitude in the world, known as the roof of the world. The dynamic and thermal effects of the QTP topography have an important impact on the weather and climate, atmospheric circulation, and water cycle worldwide. The generation, development, and eastward movement of mesoscale systems in the QTP may cause catastrophic weather, such as heavy rainfall in plateau and downstream areas [1]. Therefore, it is necessary to strengthen QTP atmospheric detection and obtain more abundant meteorological information, such as atmospheric temperature, pressure, and humidity. The remote sensing detection of water vapour and liquid water content in the atmosphere has important applications in the fields of weather forecasting, artificial weather, and flight safety. Microwave remote sensing not only has the advantages of visible light and infrared remote sensing, but also has the unique advantages of all-weather and all-day conditions. For example, it can penetrate cloud cover, and dense fog and rainfall. Therefore, microwaves can be used to detect atmospheric conditions in the atmosphere and clouds with high detection sensitivity.
Microwave radiometers (MWRs) adopt microwave remote sensing technology and are sensitive to the detection of atmospheric parameters such as temperature and humidity [2,3]. This has practical significance for weather forecasting and artificial precipitation services. According to the working platform, MWR can be divided into two types, namely, space-based and ground-based systems. Based on satellite remote sensing technology in high-altitude orbits, the detected data have high spatial resolution and wide coverage, especially in land and marine areas where people are scarce [4,5]. However, satellite detection is limited by the earth’s geometry. It has high resolution at high altitudes, while the resolution at low altitudes is relatively poor [6,7]. In particular, the shielding and strong absorption of clouds, as well as the opacity of the atmosphere to millimeter-wave-band electromagnetic waves, reduce the atmospheric detection accuracy at the bottom of the satellite troposphere. However, due to the limitation of the Earth’s geometry, satellite remote sensing has high resolution at high altitudes, while the resolution at low altitudes is relatively poor. In particular, atmospheric detection at the bottom of the satellite troposphere is reduced due to the occlusion and strong absorption of clouds and the opacity of the atmosphere to the millimeter-wave-band electromagnetic wave [8]. In contrast, ground-based MWR is a supplement to satellite detection. The ground-based MWR can not only detect the temperature profile and water vapour density profile of the atmosphere in real time, but also retrieve the atmospheric integral water vapour content (PWV) and liquid water content (LWC) [2,9,10]. It can also conduct high-precision correction through the radio wave refraction error, and further investigate the spatial-temporal change rate and horizontal heterogeneity of the atmospheric refractive index. Compared with other traditional ground-based meteorological observation methods, such as sounding balloons and radars, MWR can achieve uninterrupted high temporal resolution and high detection accuracy of the atmosphere with low operation cost and no electromagnetic pollution [11,12]. Therefore, ground-based MWR has been extensively used in the field of radiosonde observation.
In 1988, Warner [13] studied and discussed the accuracy of measuring liquid water by MWR and confirmed its feasibility, which opened up a new way for measuring the continuous distribution of vapour and liquid water in the atmosphere. Snider [14] obtained the seasonal variation characteristics of total atmospheric water vapour and cloud liquid water through long-term experiments and tested the relationship between total atmospheric precipitable water vapour, cloud liquid water, and precipitation. Heggli et al. [15] used MWR to measure the continuous variation of supercooled water content in winter storm clouds and studied the weather background information of forming supercooled water droplets in clouds. Madhulatha [16] developed a nowcasting technique to investigate severe convective activity over southeast India using ground-based microwave radiometer observations. Gascón et al. [17] investigated a convective winter episode of the Iberian Peninsula using a multichannel microwave radiometer. Continuous observations showed that the vertical evolution of a precipitation event is similar to a ‘zipper’; that is, the temperature and dew point temperature profiles are closed from the surface to 400 hPa and reopen at the end of the precipitation.
The existing research on MWR precipitation detection mainly focuses on rainfall, but research on snowfall is rare due to ice deposition or antenna attenuation [18,19]. Radiometric retrievals of a variety of dynamic weather condition phenomena, including upslope supercooled fog, snowfall, a complex cold front, a nocturnal bore, and a squall line, have been successfully verified [20]. Zhang et al. [21] investigated the uncertainties of microwave radiometer retrievals in snow conditions and explored the discrepancies of MWR retrievals in zenith and off-zenith methods. He found that the temperature bias, relative humidity bias, and vapour density bias decreased from 4.6 K, 10%, and 10% with a corresponding RSME of 5.7 K, 33% and 2.14 g/m3 in the zenith method to −0.6 K, −2% and 0.1 g/m3 with a smaller RSME of 2.0 K, 20%, and 0.66 g/m3. Moisseev et al. [9] quantified the effect of riming on snowfall using ground-based observations. The MWR-retrieved liquid water path (LWP) [22] was used to cross-validate the derived rime mass fraction. Jeoung et al. [6] recently investigated the microphysical properties of near-surface, shallow, and deep snow clouds using ground-based radar and radiometer data. To date, there have been few reports on the atmospheric detection of snowfall events in the QTP region [23]. The study of the evolutionary characteristics of the atmospheric parameters of snowfall not only serve the development of air–water resources, but also help to predict severe convective weather [24,25]. Therefore, it is necessary to strengthen QTP atmospheric detection, especially in snowy environments. In this study, atmospheric exploration of the QTP during the East Asian winter monsoon (EAWM) from ground-based microwave radiometers was conducted. A special focus on the hydrometeorological characteristics of snowy processes were fully investigated and compared with clear days. The remainder of this paper is organized as follows. Section 2 presents the experimental conditions and data processing methods used in this study. Section 3 discusses the characteristics of the atmospheric vertical structures and atmospheric stability indices. Hour-scale variations in water vapour and liquid water content on the QTP were provided. Next, two retrieval applications based on radiosonde and meteorological observation data are provided, namely, short-term precipitation forecasting and quantitative precipitation estimation. Section 5 concludes the main findings of this work.

2. Materials and Methods

2.1. Introduction of Experimental Conditions

Atmospheric exploration for snowfall was carried out in Darlag, Guoluo Tibetan Autonomous Prefecture, China (33.55 °E, 99.95 °N). Darlag is located in the QTP region, belonging to the Bayan Har Mountains, with an average elevation of 4200 m (Figure 1). It has an alpine and semi-humid climate with a diurnal temperature difference of 15–25 °C. The field site is located in the source area of the Three Rivers, namely, the Yangtze, Yellow, and Lancang-Mekong Rivers, with abundant water resources in the air. The potential for runoff excavation is 30–60 mm. The warm season from June to September mainly consists of liquid precipitation, accounting for 77.7% of the annual average precipitation. The snow period is from October to May of the next year. The snowfall period can be as long as 162 days, with a maximum snow depth of 120 mm, which is suitable for snow observations.
From 19 October 2019 to 8 January 2020, 22 field tests were performed on the Qinghai–Tibet Plateau. Among them, 11 sets of atmospheric explorations of snowfall observations and 11 sets of clear-day comparisons were collected (Table 1). During the East Asian winter monsoon (EAWM), the minimum night temperature at the field site is approximately −30 °C. Considering personnel safety and equipment accuracy, radiosonde observations were generally carried out in the daytime.
A ground-based MWR (manufactured by Radiometrics Corporation, model MP3000A) and weather station with intelligent weather sensors (manufactured by LUFFT measurement and Control Technology Co., LTD, model WS401-UMB) were adopted to measure zenith direction atmospheric information and near-ground rainfall information. In addition, the MWR is equipped with a variety of meteorological sensors to measure the atmospheric temperature, relative humidity, atmospheric pressure, and precipitation on the instrument surface. The existence of clouds is judged by measuring the infrared temperature in the zenith direction. MP-3000A MWR is a 35-channel microwave radiometer that consists of a temperature profile and water vapour profile subsystems. The temperature profile subsystem uses 14 high-frequency channels (51–59 GHz) for sky brightness temperature (BT) observation, while the water vapour profile subsystem accepts 21 low-frequency channels (22–30 GHz) for BT detection. In the present snowfall observation, 8 low-frequency channels were chosen for sky brightness temperature observation, namely, 22.234, 22.500, 23.034, 23.834, 25.000, 26.234, 28.000, and 30.000 GHz. The ground-based microwave radiometer completes a whole sky scanning observation every 3 min, with a detection range of 0–400 K and a resolution of 0.1. For the weather station, both liquid and solid precipitation can be identified with a sampling period of approximately 5 s, and its sampling accuracy of near-surface precipitation intensity is 0.1 mm/h. The spatial resolutions of the atmospheric profiles of the MWR at 0–500 m, 500 m–2 km and 2–10 km are 50 m, 100 m and 250 m, respectively.

2.2. Introduction of Data Processing Methods

2.2.1. Forwards and Inversion Algorithm

The atmospheric temperature and humidity profile is the basic physical quantity to describe the thermodynamic and dynamic processes of the atmosphere. The atmospheric detection of MWR can be divided into two stages, namely, forwards modeling and inversion (Figure 2). The forwards process refers to calculating the radiant brightness temperature through known historical sounding data, including ground water vapour pressure, atmospheric pressure and dew point temperature and atmospheric pressure at different altitudes. In the forwards stage, historical radiosonde observations should be interpolated into 58 high-level layers. Subsequently, according to the atmospheric microwave absorption characteristics, the atmospheric absorption coefficients at different heights can be obtained. Finally, a radiative transfer model is used to calculate the brightness temperature of each layer of atmospheric radiation to the surface at 35 sampling frequencies [26]. In this study, the radiative transfer model was solved using MonoRTM (Atmospheric and Environmental Research, Inc., Lexington, KY, USA), and descending BT can be expressed as follows [27,28].
T θ , f = T τ ( z 0 , ) + z 0 K a ( z ) T ( z ) τ ( z 0 , z ) sec ( θ )   d z
τ ( z 0 , z ) = exp [ z 0 z K a ( z ) sec θ   d z ]
where Tθ,f denotes the radiation brightness temperature received by the microwave radiometer, τ(z0,∞) and τ(z0,z) denote the atmospheric transmittance from the ground-based MWR antenna z0 to the universe and that from z0 to height z. T denotes the cosmic background radiation temperature and can be taken as 3 K. Ka (z) denotes the volumetric absorption coefficient. θ denotes the zenith angle of MWR.
For the inversion algorithm, the information obtained by ground-based MWR is the radiation energy reaching the ground through layer-by-layer atmospheric buffing, absorption, reflection, and scattering. The relationship between the MWR-obtained radiation energy and atmospheric parameters can be constructed by statistical regression and neural network algorithms. The essence of artificial neural network calculation theory is the nonlinear statistical regression between a set of prediction indices. Some scholars have shown that the neural network algorithm has good performance in solving the nonlinear relationship between atmospheric temperature, humidity, and atmospheric liquid water and water vapour content. It has a fast operation speed and a higher inversion accuracy than the statistical regression algorithm. Thus, a neural network (NN) is trained and developed to construct the nonlinear relationship between atmospheric parameters and the obtained brightness temperature (BT) [29,30]. In this study, atmospheric vertical structures such as temperature, humidity, water density and liquid water content were derived through a built-in back-propagation (BP) neural network-based model. The historical radiosonde observations for NN training were obtained from Darlag, Qinghai Meteorological Administration (2011–2018) [31]. Detailed information can be found in the work of Wei et al. [31].

2.2.2. Atmospheric Parameters

To better understand the atmospheric characteristics of the Tibetan Plateau during the EAWM, especially in the precipitation (snow) environment, two types of parameters need to be considered. One is the direct product of the MWR, which mainly includes the vertical structure of atmospheric temperature, humidity, and water vapour density, and inverse products such as precipitable water. The other is the instability indices related to atmospheric thermodynamics, which can be used to investigate atmospheric dynamics and precipitation processes. Precipitable water can be quantified by precipitable water vapour (PWV) and liquid water content (LWC). PWV, also known as atmospheric water vapour content, represents the amount of precipitation formed by the condensation of water vapour in the whole atmosphere to the ground per unit area. Cloud liquid water content refers to the integral liquid water content from the cloud bottom to the cloud top.
The stability and convection indices mainly contain the downdraft and standard convective available potential energy (CAPE), convective inhibition (CIN), and maximum vertical velocity (MVV). When the air mass near the ground rises along the insulation line due to vertical wind shear disturbance or terrain, the energy obtained by gas inclusions from the surrounding environment can be represented by the CAPE value. CAPE is the buoyancy potential energy, which represents the energy of the air in the surface boundary layer and is an important indicator to evaluate whether the vertical atmosphere is stable and whether convection easily develops. Downdraft CAPE (DCAPE) denotes the maximum energy available in the downdraft process. CIN represents the energy that prevents gas from rising from the ground to the level of free convection. MVV refers to the maximum vertical velocity of the updraft that may produce convection. These stability and convection indices can be defined as follows [32].
C A P E = R d P L F C P E L ( T v p T v e ) d ( ln 1000 P )
D C A P E = R d P 0 P D ( T v p T w b ) d ( ln 1000 P )
C I N = R d P 0 P L F C ( T v p T v e ) d ( ln 1000 P )
M V V = 2 ( C A P E C I N )
where Rd denotes the specific gas constant of dry air and can be taken as 287.05 J/(kg∙K). Tvp, Tve and Twb denote the virtual temperature of an air parcel, ambient environmental temperature, and wet-bulb temperature, respectively. PLFE, PEL, PD and P0 denote atmospheric pressure at the level of free convection (LFC), equilibrium level (EL), depth of downdraft, and near-ground level, respectively. P denotes the specific pressure. All parcel heights and stability indices can be calculated through skew T-log diagrams and the Complete Rawinsonde Observation Program [27,28].
For sounding observations used for instrument calibration, atmospheric temperature and relative humidity are provided by a sounding balloon twice a day (7:00 and 19:00, UTC+8), and the water vapour density should be calculated by the water vapour pressure atmospheric temperature as follows [33,34].
e = 6.11 R H exp ( 17.71 T 273.16 T + 29.33 )
V D = 2.167 e T
where e denotes the water vapour pressure in hPa, RH denotes relative humidity in %, VD denotes vapour density in g/m3 and T denotes atmospheric temperature in K.

2.2.3. Error Analysis Methods

It is necessary to carefully analyze detection accuracy during microwave detection (Figure 3). The main error sources of the MWR are as follows. (i) Signal enhancement caused by aiming the radiometer antenna towards the sun. The sun is a radiation blackbody, and its surface temperature is as high as 6000 K. Assuming that the angular range of the microwave radiometer antenna towards the sun is approximately 1%, the signal will be enhanced by approximately 60 K. To avoid the observation error caused by solar radiation, the antenna should be avoided in the solar range. (ii) Detection error introduced by the inversion algorithm. The accuracy of the inversion profile depends largely on the inversion algorithm itself. MWR uses an artificial neural network to invert the temperature and humidity profile. The representativeness of historical sounding data used for neural network training directly affects the inversion effect of NN. (iii) External environmental radiation interference. When there is a strong transmitter around the observation site, peak signals may be generated due to radio frequency interference. The peak signal will affect the accuracy of the inversion profile; thus, the observation site should be away from the radio transmitter. (iv) Detection errors caused by water, ice and snow on the instrument. If there is water on the antenna shield of the MWR, the measured radiation brightness temperature may be high. The accumulation of water, snow or ice over the radome should be cleared in time during snow observation [35,36]. A hydrophobic radome and an air blower were adopted to dry raindrops and snowflakes on the radome [37]. Since the off-zenith method can mitigate the impact of snowfall on the accuracy of the MWR retrievals, both zenith and off-zenith observations were conducted [21].
To further evaluate the accuracy of the radiosonde observations, the mean difference (MD), root mean square error (RMSE), and Pearson correlation coefficient (CC) were introduced as follows [11]:
M D = 1 N i = 1 N ( X i Y i )
R M S E = 1 N i = 1 N ( X i Y i ) 2
C C = 1 N n = 1 N ( X i X i ¯ ) ( Y i Y i ¯ ) n = 1 N ( X i X i ¯ ) 2 n = 1 N ( Y i Y i ¯ ) 2
where N denotes the total number of observation samples and X and Y denote the radiosonde observation and corresponding MWR products, respectively.

3. Results

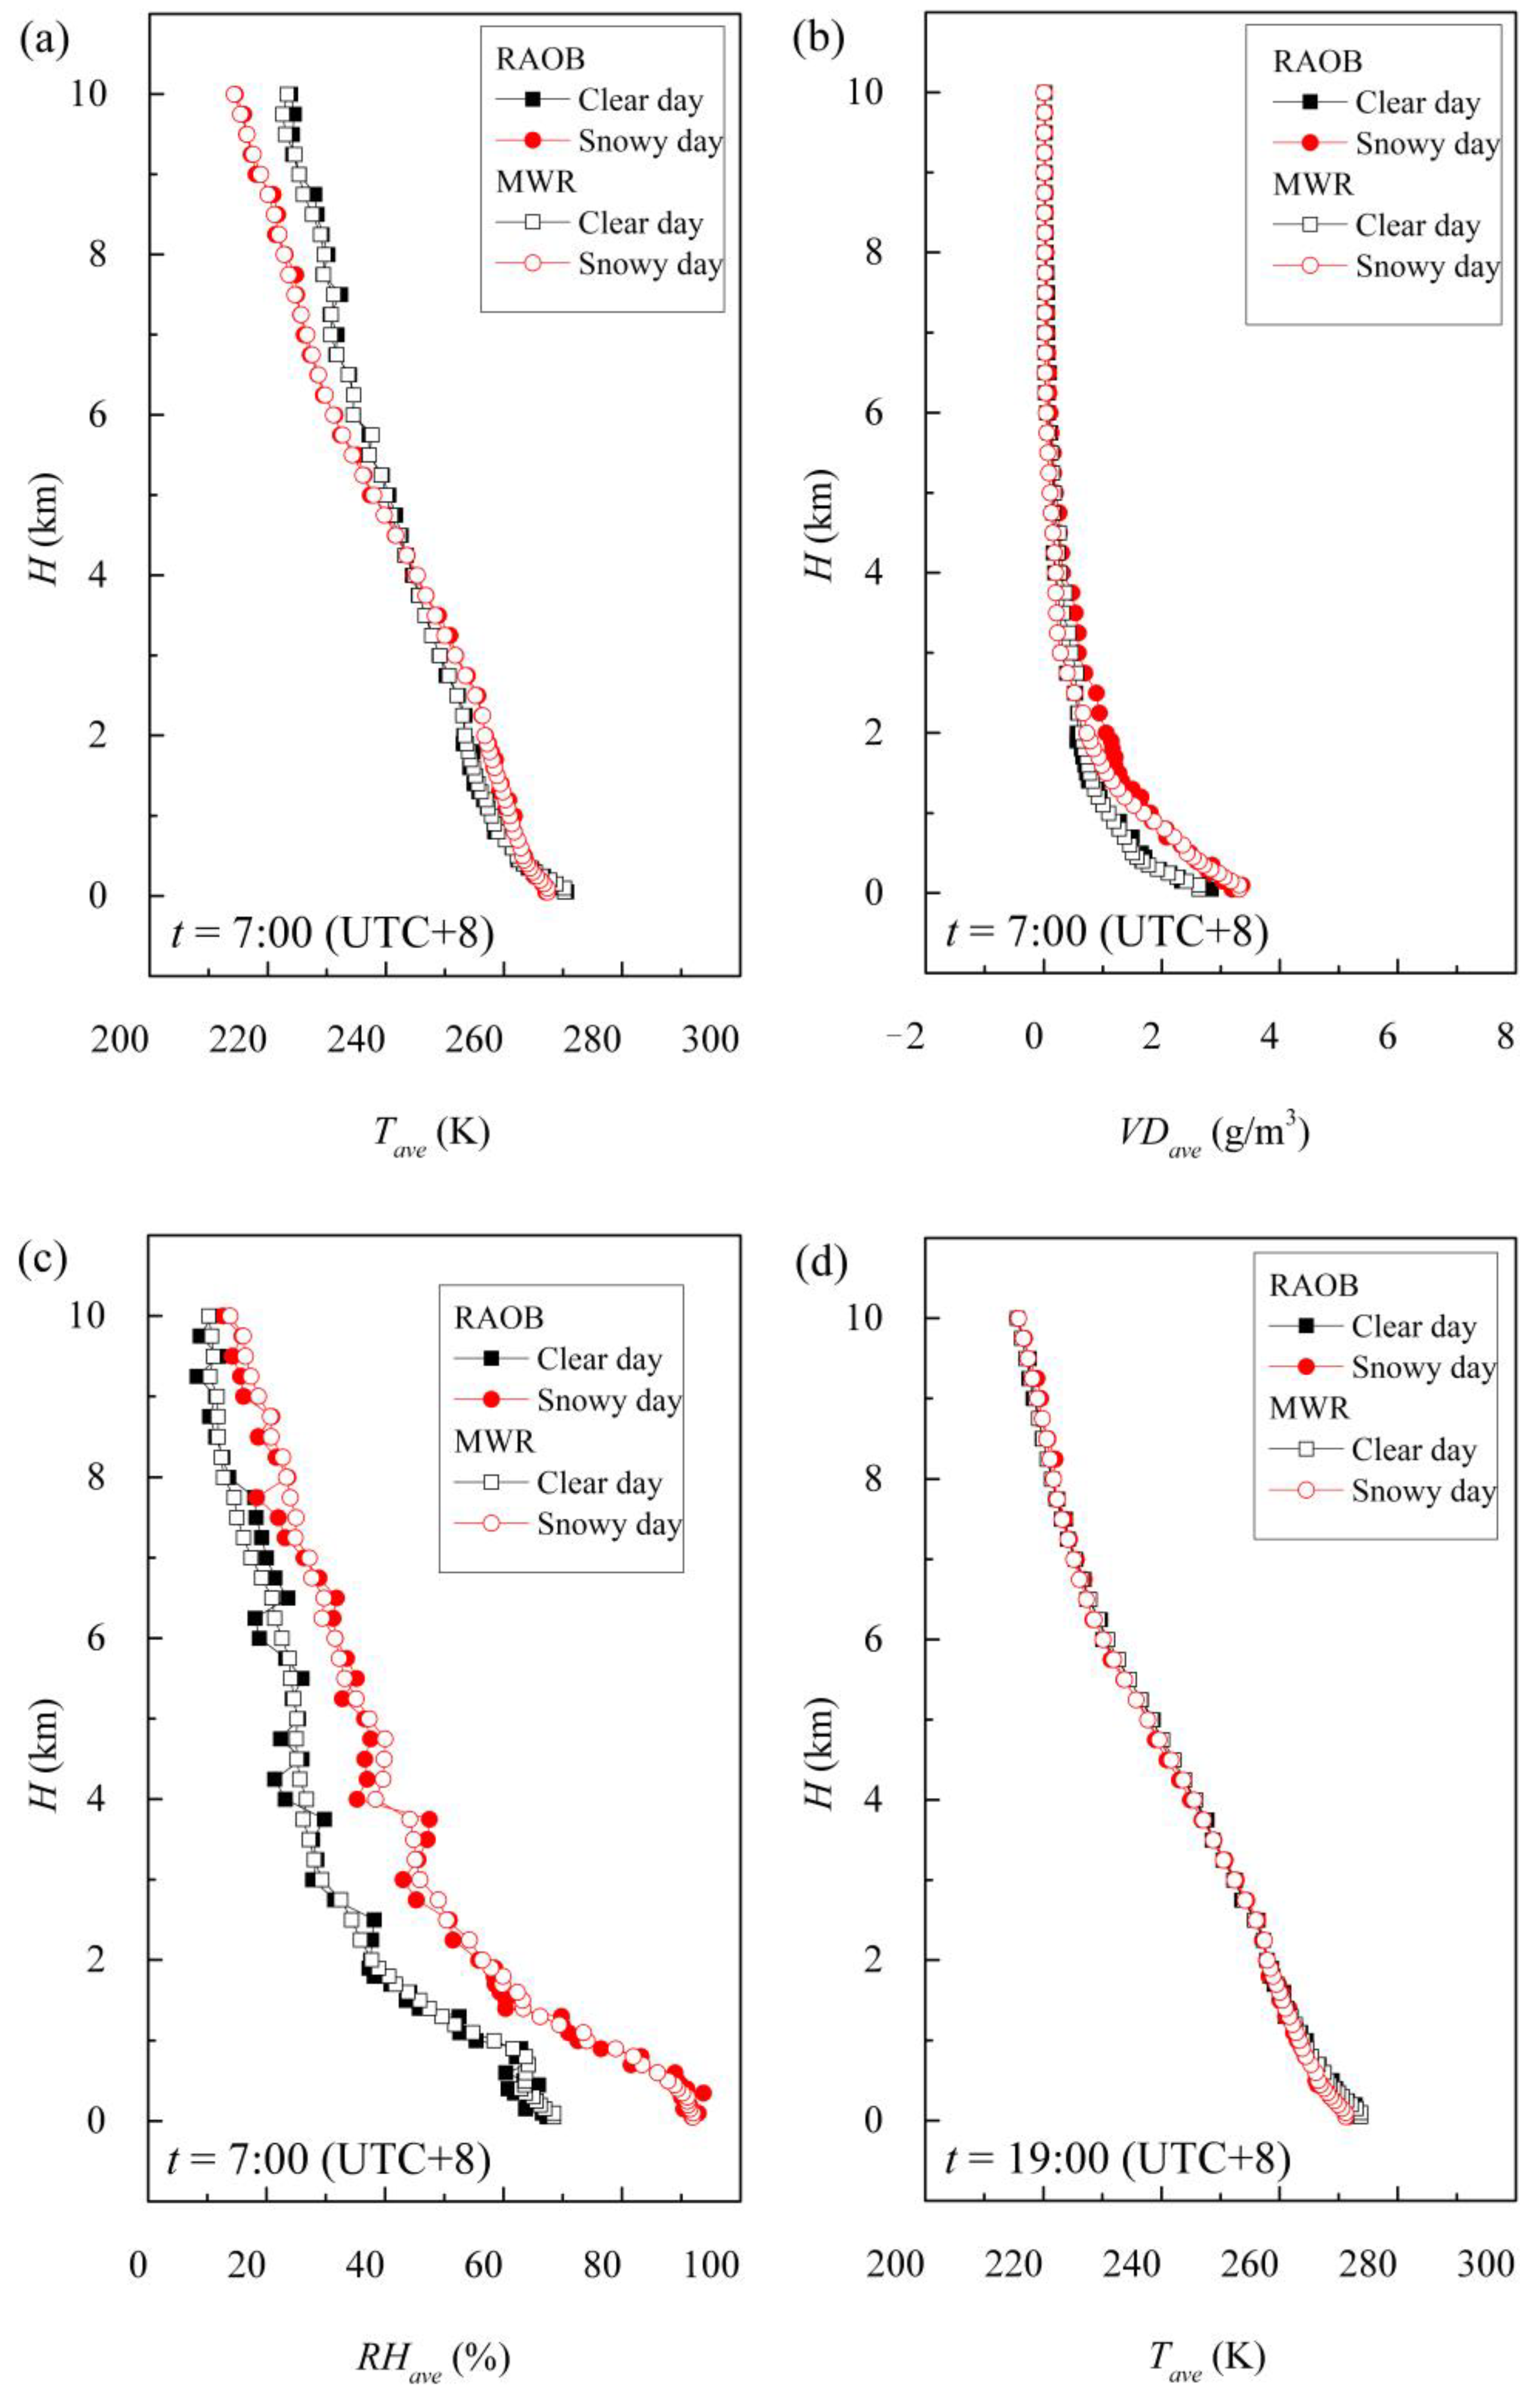
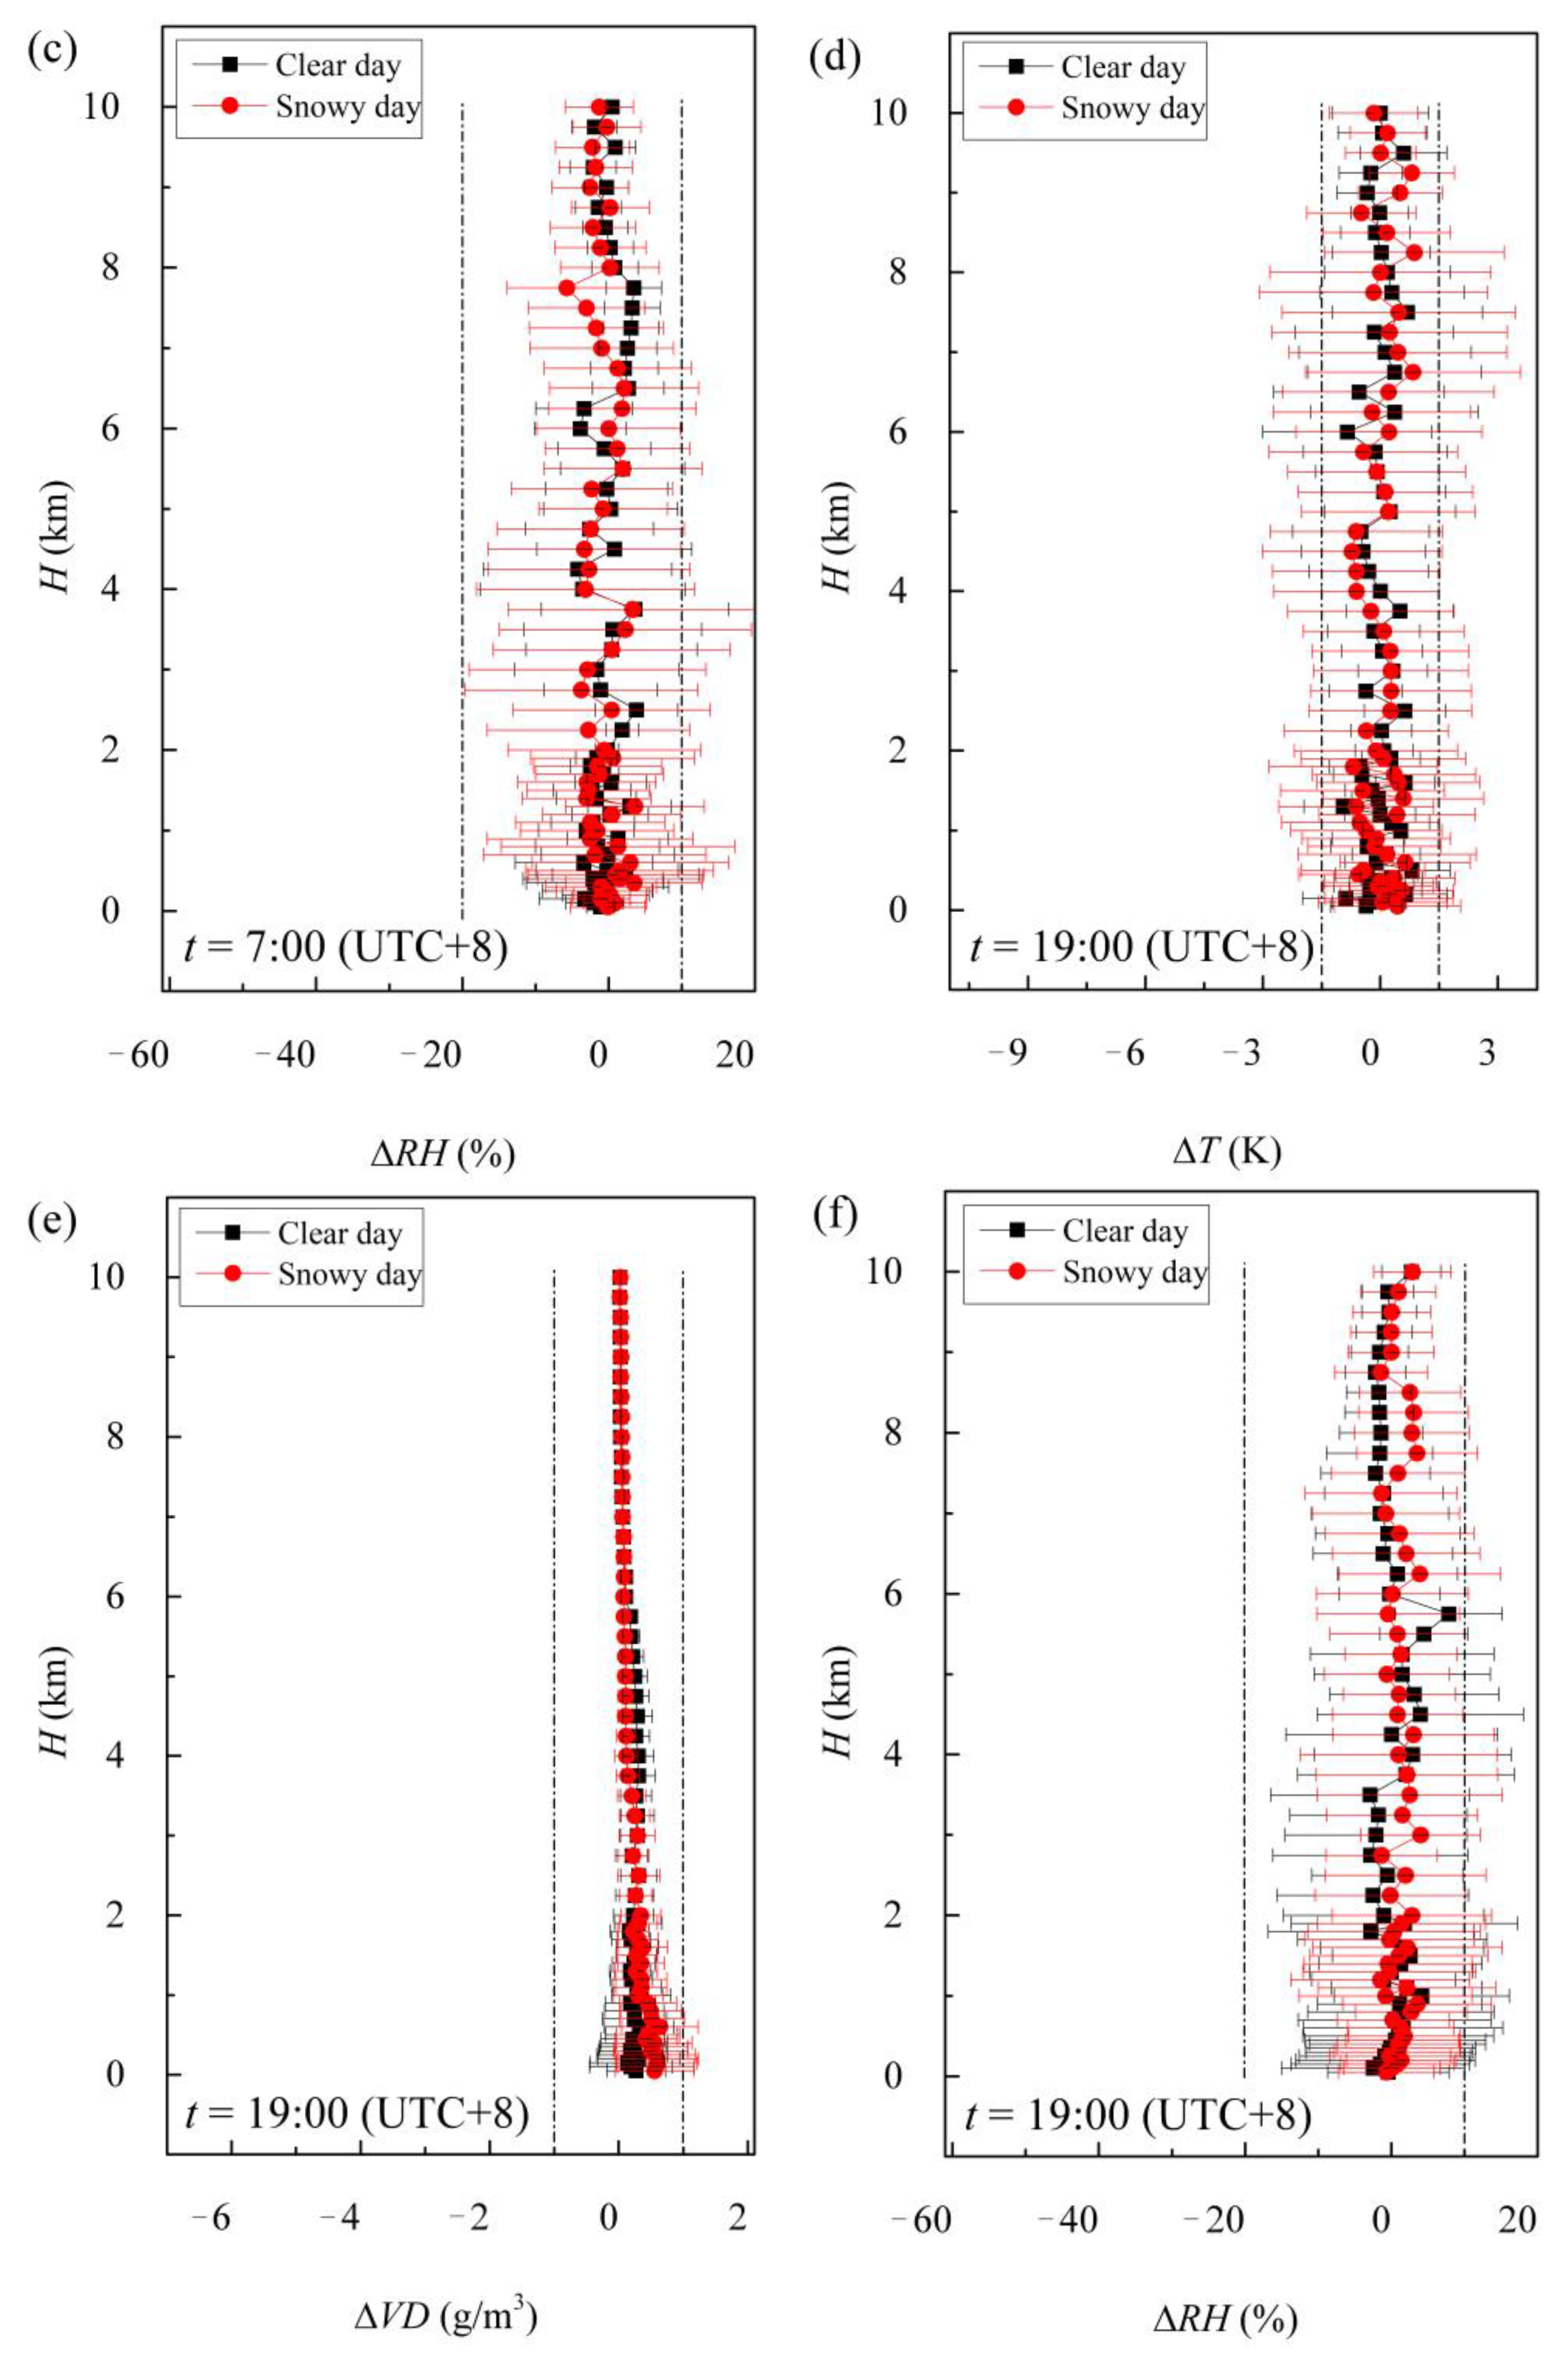
3.1. Characteristics of the Atmospheric Vertical Structure

In this section, the characteristics of the atmospheric vertical structure obtained from the MWR, namely, the temperature (T), vapour density (VD), and relative humidity (RH) profile at 58 sampling heights, were verified using radiosonde observations in the early morning, at 7:00 (UTC+8), and in the evening, at 19:00 (UTC+8). Figure 4 shows that the values of T and VD for the Qinghai–Tibet Plateau during the EAWM period decreased as the sampling height (H) increased. The Pearson correlation coefficient (CC) between the RAOB and MWR profiles was 0.99. There were almost linear trends for the T-H profile and exponential trends between VD and H. The maximum and minimum values of temperature obtained from RAOB and MWR were 268.83 and 217.77 K, respectively. The T values under snowy conditions were somewhat smaller than those under sky days, approximately 1.18 K at t = 7:00 (UTC+8) and 0.46 K in the evening at t = 19:00 (UTC+8). For VD obtained by RAOB and MWK, the VD values were in the range of 2.11 and 3.82 g/m3 near the ground. VD values on snowy days were 0.51 and 1.30 g/m3 larger than those under clear conditions at H = 50 m, respectively. For the RH profile, the RH appeared to generally decrease with increasing H under snowy conditions but showed different trends for clear days. The corresponding CC value in 58 layers between the MWR and RAOB was 0.99 for clear days and 0.96 for snowy days. At t = 7:00 (UTC+8), the RH values under clear days (snowy sky) decreased from 67.4% (91.87%) near the ground to 9.78% (12.5%) at H = 10 km. At t = 19:00 (UTC+8), RH values under snowy conditions generally decreased from sampling heights. However, for sky days, the RH values first increased from 48.28% near the ground to 57.13% at H of 5.5 km, and significantly decreased to 25.42% at H = 10 km.
Figure 5 presents deviations between the MWR and RAOB at 58 sampling heights. The average T value derived from the MWR at 58 high levels was 0.13 K smaller than radiosonde observation in the early morning (t = 7:00) but 0.27 K larger in the evening (t = 19:00). The corresponding RMSE values were 0.82 K and 1.67 K, respectively. An accurate calibration of T with an MD error less than 0.5 K was crucial to provide confidence for the retrieval of VD and RH profiles.
For VD values at higher levels (H > 6 km), the density profile derived from the MWR was close to that obtained from RAOB. For H less than 6 km, the MD values of VD under a snowy-sky environment were larger than those for clear days, with a peak value of 0.35 g/m3. The MD (and RMSE) values of VD at t = 7:00 were −0.0096 g/m3 (0.111 g/m3) and 0.127 g/m3 (0.243 g/m3) for clear-sky and snowy-sky conditions, respectively. At t = 19:00, both MD and RSME errors were larger than those in the morning, especially on snowy days. The MD values for clear-sky and snowy-sky conditions were 0.24 g/m3 and 0.32 g/m3, with corresponding RSME values of 0.34 g/m3 and 0.33 g/m3, respectively. The decrease in MWR measurement accuracy during snowfall was mainly because the inversion method does not consider the influence of snow cover, and the snow cover at the radome increased the signal noise of the MWR measurement. With regard to the RH bias, its MD and RMSE were relatively larger than those of the T and VD profiles, with maximal biases (and RMSEs) of 5.84% (14.74%) and 3.82% (15.35%) for clear-sky and snowy-sky conditions, respectively. The relatively larger MWR-derived values in terms of VD and RH may be related to a delayed response of the humidity sensor in the sounding balloon [38] and inconsistent sampling periods.

3.2. Characteristics of the Atmospheric Stability Indices

Since the atmospheric stability indices mentioned in Section 2.2 are related to the characteristics of parcel heights, representative height indices such as the convective condensation level (CCL), lifting condensation level (LCL), level of free convection (LFC), and equilibrium level (EL) are presented here first. Among them, CCL refers to the height of an air mass heated sufficiently near the ground and then adiabatically uplifted until condensation. CCL is generally produced from surface heating and thermal convection, which is often used to identify the cumulus layer. LCL refers to the height when a dry adiabatic air mass is lifted to humidity saturation. LCL is often used to identify the cloud bottom caused by terrain and windward systems. LCL value is generally less than or equal to CCL. LFC indicates the height of the turning point of the difference between the gas temperature and the ambient temperature from negative to positive. LFC represents the height when the difference between parcel temperature and ambient temperature changes from negative to positive in the process of gas mass lifting. Then, as the air parcel becomes hotter than the surrounding air, the air parcel continues to rise to the point at which the temperature again becomes equal to the ambient temperature, which is called EL. The EL value is generally used to estimate the tops of convective clouds, especially thunderstorms. Figure 6 shows the statistical characteristics of the parcel height (from 8:00 to 20:00 monsoon season) under different weather conditions. The CCL values were higher on snowy days after 11:30 and higher on sunny days before 11:30. The average CCL values (and corresponding RMSEs) were 513.29 hPa (15.05 hPa) and 543.17 hPa (14.01 hPa), respectively. The minimum value of CCL appeared at approximately 15:30 (UTC+8), which indicated that the overall cloud height continuously increased during the period of 8:00–16:00 (UTC+8). For LCL and LFC, a similar trend was observed except for the sampling time at approximately 17:50 (UTC+8). That is, from 08:00 (UTC+8) to 20:00 (UTC+8), both the LCL and LFC values decreased to the valley value (approximately 15:00, UTC+8) and generally increased to their maxima. This can be attributed to the daytime solar radiation and heating effect. The average LCL value of the sunny environment was almost consistent with the LFC value: 513.29 hPa and 515.38 hPa, respectively. For snowy days, the average value of LCL was 23.86 hPa greater than that of CCL because the surface temperature had not yet risen to a critical value, that is, the convective temperature, before the air parcel began to rise vertically due to positive buoyancy. The average LFC on snow was 50 hPa larger than that on sunny days, indicating that there exists a positive correlation between the probability of precipitation events and LFC. The LFCEL value given in Figure 6 (d) denotes the height difference between EL and LFC. There was little difference in LFCEL between sunny and snowy days, with averages of 236.62 hPa and 244.19 hPa during the daytime. However, there was obviously a difference between the rainy and sunny EL over the QTP during the summer monsoon [31]. In summer, the EL values on sunny and cloudy days were almost the same, less than those on rainy days.
In Figure 7, the statistical characteristics of four different stability indices, CAPE, DCAPE, CIN, and MVV, under different weather conditions during the EAWM, are presented. During the EAWM of the QTP, the CAPE, DACPE and MVV showed a trend of first increasing and then decreasing, and the corresponding moments of peak were 14:00, 15:30 and 13:30, respectively. The CAPE values under snowy conditions were larger than those on clear days, especially during the period of 13:00–19:00 (UTC+8). The average CAPEs under clear-sky and snowy-sky conditions were 818.79 J/kg and 851.79 J/kg, with corresponding peak values of 1349.11 J/kg and 1165.12 J/kg. The CAPE values during the EAWM were quite different from those at the same sampling site during the summer monsoon [31]. In summer, CAPE values reached their extremes at approximately 18:00–20:00 (UTC+8). In addition, the peak of CAPE values under rainy-sky conditions was approximately 1046.56 J/kg, and that for clear days was close to zero. The CAPE values were significantly larger in the winter on the QTP, especially on sky days. This indicates that the QTP weather system is changeable, and there is still high convective instability on sunny days. For DCAPE, namely, Downdraft CAPE, the layer-averaged downwards convection energy was remarkably higher on sky days than on snowy days. The average DCAPE values and corresponding RMSE bias were 221.16 J/kg and 82.2 J/kg (158.68 J/kg and 67.54 J/kg) for clear days (and snowy days), respectively. A comparison of CIN values between winter and summer showed that the CIN during the EAWM can be almost ignored. The relatively larger CIN values in the evening (18:00–19:00, UTC+8) may be due to the dry air advection in the lower atmosphere and the cooling of the surface air. This is because they may reduce the virtual temperature of air near the ground, so that the vertical temperature distribution appears an inversion structure near the lower layer. The air layer with a higher temperature above could hinder the upward movement of an air parcel near the ground. The MVV trend of the updraft that may generate convection was relatively similar, with corresponding average values of 38.88 m/s and 38.98 m/s.

3.3. Characteristics of the Water Vapour and Liquid Water

The integral water vapour content in the atmosphere and the liquid water content in the cloud can lead to refraction, scattering, and the attenuation of radio waves in the atmosphere. Therefore, the detection of water vapour and liquid water content in the atmosphere is not only of great significance in the fields of active detection, aerospace, and satellite communication, but also has guiding significance and application prospects in short-term weather forecasting and artificial modification. In Figure 8, the PWV had no obvious change during the daytime from 11:00 to 17:00 (UTC+8). The average PWV values for clear-sky and snowy-sky conditions were 0.40 cm and 0.44 cm, with related RMSE biases of 0.04 cm and 0.03 cm, respectively. For the time period before 11:00, the PWV continuously increased as the run raised, which can be attributed to water vapour condensing as longwave radiation spread outward from the ground during the daytime. As the sun went down, PWV values gradually decreased by approximately 0.1 cm. Compared with Wei et al. [31], the PWV values in sunny and precipitation (or snow) environments in winter only accounted for 26.70% and 18.33% of the corresponding values in the summer monsoon. Similarly, the LWC in winter was one order of magnitude lower than the average in summer. The peak value of LWC on snowy days appeared several hours after the sun rose and before the sun set, namely, 14:00 and 17:00 (UTC+8). The extreme LWC value on snowy days was approximately 0.11 mm.

4. Discussion

Based on the detection of potential water vapour or liquid water content in the cloud and atmospheric convective instability factors by MWR, two applications of winter snow forecasting and quantitative snowfall estimation are presented.

4.1. Short-Term Snow Forecast

Convective weather nowcasting refers to the detection of the occurrence, development, evolution, and extinction of convective weather systems within an hour. The method of short-term precipitation forecasting is mainly based on the MWR observations. However, this method is affected by the observation frequency and cannot be continuously observed. The time scale of atmospheric thermal structure changes caused by some short-term atmospheric activities is far less than that of RAOB. For rapidly developing weather systems, the lack of radiosonde detection frequency restricts the development of precipitation forecasts. Therefore, it is particularly important to obtain atmospheric data with high frequency and accuracy. In this section, MWR detection is applied to the approaching forecast of snow weather. Some scholars use instability indices, atmospheric instability indices, and water vapour parameters to predict the precipitation process [16,17,32,39,40]. Chakraborty et al. [41] found that concurrent changes in brightness temperatures (BTs) at 22 GHz and 58 GHz are suitable to nowcast rain, with a prediction efficiency of approximately 90% with alarms generated approximately 25 min in advance. Wei et al. [31] found that PWV and CAPE values may serve as a preliminary reference indicators for nowcasting. This section studies the critical conditions of short-term and imminent precipitation forecasts from brightness temperature, instability index (CAPE), and atmospheric precipitable water.
Figure 9 presents the temporal evolution of BT at the sampling channel from 22.2 GHz to 60.0 GHz for snowy day. According to the absorption spectra of water vapour and oxygen, BT responses of 22–30 GHz and 50–60 GHz bands are shown. In the microwave frequency range from 22.0 GHz to 30.0 GHz, the higher the frequency, the lower the BT values measured by MWR, except for 30. 0 GHz. The BT values and corresponding variation trend for frequencies of 26.234 GHz, 28.000 GHz and 30.000 GHz were largely consistent, especially near the BT peaks, approximately 40 K. For frequencies between 50 and 54.94 GHz, the measured BT values were positively correlated with the detection frequency. The corresponding peak BT was the range of 137 K to 266 K. When the detection frequency was greater than 54.94 GHz, the BT values did not change significantly with increasing frequency. Due to the resonance absorption of the atmosphere, the variations in radiation BT in 8 low-frequency BT curves and 14 high-frequency BT curves were to some extent related to the precipitation process near the ground, especially for 30.0 GHz and 51.24 GHz.
Figure 10 presents the temporal evolution of PWV, LWC, CAPE, DCAPE and R for snowy days. For a few hours before and after the occurrence of snowfall, the PWV value in the atmosphere generally showed an increasing trend. When it increased from 0.47 cm at 0.65 h to the extreme value at 0.90 h, namely, 0.52 cm, snow occurred in the next 0.1 h. As snowfall continued, it was found that the precipitable water in the atmosphere decreased to 0.48 cm at 1.35 h. The variation trend of LWC was almost synchronous with PWV with an increasing amplitude of 0.12 mm. The LWC during the no precipitation period was very low, only 0.01 mm; namely, snowfall can increase the LWC by 120%. At 0.6 h before the occurrence of snowfall, CAPE and DCAPE had maximum values at the same time, namely, 1071.29 J/kg and 280.26 J/kg, respectively. Then, CAPE and DCAPE started to decline until they reached the minimum value 0.1 h before the occurrence of snowfall, with corresponding decline amplitudes of 202.28 J/kg and 180.32 J/kg. Subsequently, CAPE and DCAPE increased significantly to the second peak at 0.1 h before the onset of precipitation, with the increase rates of 293.15 J/(kg·h) and 578.24 J/(kg·h). The variation trend of the convective instability factor is a potential method for precipitation forecasting.
Figure 11 further investigates the vertical structure of temperature, vapour density, liquid water content and relative humidity before and during the snow process. There was almost no change in the atmospheric temperature in the zenith direction of the field site within an hour before snowfall, but the average of the T profile in the 58 layers suddenly increased by 0.64 K when the snowfall occurred. Subsequently, the values of T decreased in the vertical direction after the beginning of precipitation, especially above 2 km. The mean values of the T profile at 58 layers, 20 min, 40 min, and 160 min after the occurrence of precipitation were 247.32 K, 247.27 K and 246.59 K. With the precipitation approaching, the vapour density near the ground (0–2 km) increased continuously until precipitation occurred, and the maximum value was 0.97 g/m3. The vapour density in the zenith direction after snowfall had a decreasing trend as a whole. This is due to the condensation of water vapour after the temperature decreased. For liquid density, its change trend was similar to the vapour density, namely, VD reached the maximum when precipitation occurred. At the beginning of precipitation, the peak value of liquid density in the zenith direction was approximately 0.035 g/m3 at H = 0.35 km from the ground. For the RH profile during snowfall events, there were two extreme values along the zenith detection direction, and the corresponding sampling heights were 0.7 km and 5 km. Before snowfall, the RH profile increased as a whole, with the average values changing from 37.12% to 42.21 during −60 min to −20 min. At snowfall, t(h) = 0 min occurred, and although the mean RH value along the detection height increased, its distribution structure changed. That is, the humidity below the sampling height of 1.9 km significantly increased by approximately 15.18%, while the humidity above 1.9 km slightly decreased. After the beginning of snowfall, the RH in the atmosphere quickly fell back to the value before precipitation.

4.2. Quantitative Snowfall Estimation

Snowfall estimation was investigated for near-ground MWR measurements. Figure 12 shows that the LWV in the zenith direction of the field site exponentially increased with PWV, especially on snowy days. For scattergrams of PWV and LWC against R, there was no clear relationship between PWV and R, but LWC generally increased with increasing R, which was also mentioned in the work of Jeoung et al. [42].

5. Conclusions

Based on ground-based multichannel microwave radiometer data, radiosonde observations and precipitation data from meteorological stations in the eastern QTP, the distribution characteristics and evolution laws of atmospheric vertical structure, convective instability indices and water vapour and liquid water content during the East Asian winter monsoon were studied, and the applications of MWR in short-term snow forecasting and quantitative snowfall estimation have been discussed. The main findings can be summarized as follows.
(1)
The average values of T deviation between MWR and RAOB were less than 0.5 K at most altitudes and sampling periods, meeting the deviation requirements of meteorological applications;
(2)
The CAPE values during the EAWM under snowy conditions were larger than those on clear days, especially during the period of 13:00–19:00 (UTC+8). For clear-sky, the CAPE during the EAWM was much larger than that during the summer monsoon. This indicates that the QTP weather system is changeable, and there is still high convective instability on sunny days;
(3)
The water vapour and liquid water in winter are much smaller than that of the summer monsoon. The winter LWC was an order of magnitude lower than the summer average;
(4)
PWV, LWC, CAPE, DCAPE and BT at the sampling channel of 30.0 GHz and 51.24 GHz had the potential to be used for quantitative precipitation forecasting.
The meteorological characteristics retrieved from ground-based MWR in this study are preliminary. More monitoring experiments will be carried out in the future to jointly reveal the atmospheric thermodynamic and dynamic characteristics of the QTP. For more accurate atmospheric detection, a Ka-band radar will be used to detect cloud information to improve sounding accuracy in the future.

Author Contributions

Conceptualization, J.W. and G.W.; methodology, J.W. and Y.S.; validation, J.W., Y.S. and Z.Q.; formal analysis, Y.S.; investigation, Y.S., J.Z. and Z.Q.; resources, J.W. and G.W.; data curation, J.W.; writing—original draft preparation, Y.S.; writing—review and editing, J.W. and Y.S.; supervision, J.W.; project administration, J.W.; funding acquisition, J.W. and G.W. All authors have read and agreed to the published version of the manuscript.

Funding

This research was funded by the National Key Research and Development Program (Grant No. 2017YFC0403600); the National Natural Science Foundation of China (Grant No. 52009059); Major Science and Technology Project of Qinghai Province(2021-SF-A6); Key Research and Development Program of Ningxia (2020BCF01002); the Fund Program of State key Laboratory of Hydroscience and Engineering (2022-KY-04) at Tsinghua University; and the State Key Laboratory of Plateau Ecology and Agriculture at Qinghai University.

Institutional Review Board Statement

Not applicable.

Informed Consent Statement

Not applicable.

Data Availability Statement

The data cannot be shared temporarily.

Acknowledgments

The authors would like to thank Yanzhang Wen, Wenwen Bai, Qiong Li, Jiongwei Cao, and all other members of the Research Group from Tsinghua University and Qinghai University for contributions to the field experiment, without whom this work would not be possible.

Conflicts of Interest

The authors declare no conflict of interest.

References

  1. Peng, S.Q.; Xiangde, X.U.; Shi, X.H.; Wang, D.X.; Zhu, Y.X. The early-warning effects of assimilation of the observations over the large-scale slope of the “World Roof” on its downstream weather forecasting. Chin. Sci. Bull. 2009, 54, 706–710. [Google Scholar] [CrossRef]
  2. Cadeddu, M.P.; Marchand, R.; Orlandi, E.; Turner, D.D.; Mech, M. Microwave passive ground-based retrievals of cloud and rain liquid water path in drizzling clouds: Challenges and possibilities. Trans. Geosci. Remote Sens. 2017, 55, 6468–6481. [Google Scholar] [CrossRef]
  3. Karavaev, D.M.; Shchukin, G.G. Status and prospects of application of microwave radiometry of the atmosphere. Atmos. Ocean. Opt. 2016, 29, 308–313. [Google Scholar] [CrossRef]
  4. Xu, G.; Yue, X.; Zhang, W.; Wan, X. Assessment of atmospheric wet profiles obtained from cosmic radio occultation observations over China. Atmosphere 2017, 8, 208. [Google Scholar] [CrossRef] [Green Version]
  5. Ohring, G.; Lord, S.; Derber, J.; Mitchell, K.; Ji, M. Applications of satellite remote sensing in numerical weather and climate prediction. Adv. Space Res. 2002, 30, 2433–2439. [Google Scholar] [CrossRef]
  6. Jeoung, H.; Liu, G.S.; Kim, K.; Lee, G.; Seo, E.K. Microphysical properties of three types of snow clouds: Implication for satellite snowfall retrievals. Atmos. Chem. Phys. 2020, 20, 14491–14507. [Google Scholar] [CrossRef]
  7. Kidd, C. Satellite rainfall climatology: A review. Int. J. Climatol. 2001, 21, 1041–1066. [Google Scholar] [CrossRef]
  8. Dietz, A.J.; Kuenzer, C.; Gessner, U.; Dech, S. Remote sensing of snow—A review of available methods. Int. J. Remote Sens. 2012, 33, 4094–4134. [Google Scholar] [CrossRef]
  9. Moisseev, D.; von Lerber, A.; Tiira, J. Quantifying the effect of riming on snowfall using ground-based observations. J. Geophys. Res. Atmos. 2017, 122, 4019–4037. [Google Scholar] [CrossRef] [Green Version]
  10. Araki, K.; Murakami, M.; Ishimoto, H.; Tajiri, T. Ground-based microwave radiometer variational analysis during no-rain and rain conditions. SOLA 2015, 11, 108–112. [Google Scholar] [CrossRef] [Green Version]
  11. Zhao, Y.X.; Yan, H.L.; Wu, P.; Zhou, D. Linear correction method for improved atmospheric vertical profile retrieval based on ground-based microwave radiometer. Atmos. Res. 2020, 232, 104678. [Google Scholar] [CrossRef]
  12. Ha, J.; Park, K.D.; Kim, K.; Kim, Y.H. Comparison of atmospheric water vapor profiles obtained by GPS, MWR, and radiosonde. Asia-Pac. J. Atmos. Sci. 2010, 46, 233–241. [Google Scholar] [CrossRef]
  13. Warner, J.; Drake, J. Field tests of an airborne remote sensing technique for measuring the distribution of liquid water in convective cloud. J. Atmos. Ocean. Technol. 1988, 5, 833–843. [Google Scholar] [CrossRef] [Green Version]
  14. Snider, J.B. Long-term observations of cloud liquid, water vapor, and cloud-base temperature in the North Atlantic Ocean. J. Atmos. Ocean. Technol. 2000, 17, 928–939. [Google Scholar] [CrossRef]
  15. Heggli, M.; Rauber, R.M.; Snider, J.B. Field evaluation of a dual-channel microwave radiometer designed for measurements of integrated water vapor and cloud liquid water in the atmosphere. J. Atmos. Ocean. Technol. 1987, 4, 204–213. [Google Scholar] [CrossRef] [Green Version]
  16. Madhulatha, A.; Rajeevan, M.; Venkat Ratnam, M.; Bhate, J.; Naidu, C.V. Nowcasting severe convective activity over southeast India using ground-based microwave radiometer observations. J. Geophys. Res. Atmos. 2013, 118, 1–13. [Google Scholar] [CrossRef] [Green Version]
  17. Gascón, E.; Sanchez, J.; Fernández-González, S.; Hermida, L.; López, L.; García-Ortega, E.; Merino, A. Monitoring a convective winter episode of the Iberian Peninsula using a multichannel microwave radiometer. J. Geophys. Res. Atmos. 2015, 120, 1565–1581. [Google Scholar] [CrossRef] [Green Version]
  18. Ware, R.; Cimini, D.; Herzegh, P.; Marzano, F.; Vivekanandan, J.; Westwater, E. Ground-based microwave radiometer measurements during precipitation. Environ. Sci. 2004, 1, 24–27. [Google Scholar]
  19. Xie, X.X.; Lohnert, U.; Kneifel, S.; Crewell, S. Snow particle orientation observed by ground-based microwave radiometry. J. Geophys. Res. Atmos. 2012, 117, 1–12. [Google Scholar] [CrossRef]
  20. Knupp, K.; Ware, R.; Cimini, D.; Vandenberghe, F.; Vivekanandan, J.; Westwater, E.; Coleman, T.; Phillips, D. Ground-based passive microwave profiling during dynamic weather conditions. J. Atmos. Ocean. Technol. 2009, 26, 1057–1073. [Google Scholar] [CrossRef]
  21. Zhang, W.; Xu, G.; Liu, Y.; Yan, G.; Wang, S. Uncertainties of ground-based microwave radiometer retrievals in zenith and off-zenith observations under snow conditions. Atmos. Meas. Tech. 2017, 10, 155–165. [Google Scholar] [CrossRef] [Green Version]
  22. Cadeddu, M.P.; Liljegren, J.C.; Turner, D.D. The Atmospheric radiation measurement (ARM) program network of microwave radiometers: Instrumentation, data, and retrievals. Atmos. Meas. Tech. 2013, 6, 2359–2372. [Google Scholar] [CrossRef] [Green Version]
  23. Liu, Y.; Ren, G.; Yu, H. Climatology of Snow in China. Sci. Geogr. Sin. 2012, 32, 1176–1185. [Google Scholar] [CrossRef]
  24. Hu, H.; Liang, L. Temporal and spatial variations of snowfall in the east of Qinghai-Tibet Plateau in the last 50 years. Acta Geogr. Sin. 2014, 69, 1002–1012. [Google Scholar] [CrossRef]
  25. Wang, S.J.; Zhou, L.Y.; Wei, Y.Q. Integrated risk assessment of snow disaster over the Qinghai-Tibet Plateau. Geom. Nat. Hazards Risk 2019, 10, 740–757. [Google Scholar] [CrossRef] [Green Version]
  26. Clough, S.A.; Shephard, M.W.; Mlawer, E.J.; Delamere, J.S.; Iacono, M.J.; Cady-Pereira, K.; Boukabara, S.; Brown, P.D. Atmospheric radiative transfer modeling: A summary of the AER codes. J. Quant. Spectrosc. Radiat. Transf. 2005, 91, 233–244. [Google Scholar] [CrossRef]
  27. Wanbiao, L. Atmospheric Physics: Basics of Thermodynamics and Radiation, 1st ed.; Peking University Press: Beijing, China, 2010. [Google Scholar]
  28. Iribarne, J.V.; Godson, W.L. Atmospheric Thermodynamics, 2nd ed.; Springer Science & Business Media: Toronto, ON, Canada, 2012. [Google Scholar]
  29. Liu, Y.; Mao, J.; Liu, J.; Li, F. Research of BP neural network for microwave radiometer remote sensing retrieval of temperature, relative humidity, cloud liquid water profiles. Plat. Meteorol. 2010, 29, 1514–1523. [Google Scholar]
  30. Wang, Z.H.; Li, Q.; Hu, F.C.; Cao, X.F.; Chu, Y.L. Remote sensing of lightning by a ground-based microwave radiometer. Atmos. Res. 2014, 150, 143–150. [Google Scholar] [CrossRef]
  31. Wei, J.; Shi, Y.; Ren, Y.; Li, Q.; Qiao, Z.; Cao, J.; Ayantobo, O.O.; Yin, J.; Wang, G. Application of ground-based microwave radiometer in retrieving meteorological characteristics of Tibet Plateau. Remote Sens. 2021, 13, 2527. [Google Scholar] [CrossRef]
  32. Cimini, D.; Nelson, M.; Güldner, J.; Ware, R. Forecast indices from a ground-based microwave radiometer for operational meteorology. Atmos. Meas. Tech. 2015, 8, 315–333. [Google Scholar] [CrossRef] [Green Version]
  33. Dang, Z.L. Research on Retrieval Methods and Application from Microwave Radiometer in Semi-Arid Area. Master’s Thesis, Lanzhou University, Lanzhou, China, 2018. [Google Scholar]
  34. Busen, R. Dropsondes and Radiosondes for Atmospheric Measurements. In Atmospheric Physics: Background–Methods–Trends, 1st ed.; Schumann, U., Ed.; Springer: Berlin, Germany, 2012; pp. 317–329. [Google Scholar] [CrossRef]
  35. Woods, C.; Stoelinga, M.; Locatelli, J.; Hobbs, P. Microphysical processes and synergistic interaction between frontal and orographic forcing of precipitation during the 13 December 2001 IMPROVE2 event over the Oregon Cascades. J. Atmos. Sci. 2005, 62, 3493–3519. [Google Scholar] [CrossRef]
  36. Fernández-González, S.; Valero, F.; Sanchez, J.L.; Gascón, E.; López, L.; García-Ortega, E.; Merino, A. Observation of a freezing drizzle episode: A case study. Atmos. Res. 2014, 149, 244–254. [Google Scholar] [CrossRef]
  37. Chan, W.S.; Lee, J.C.W. Vertical profile retrievals with warm-rain microphysics using the ground-based microwave radiometer operated by the Hong Kong observatory. Atmos. Res. 2015, 161–162, 125–133. [Google Scholar] [CrossRef]
  38. Xu, G.; Ware, R.; Zhang, W.; Feng, G.; Liao, K.; Liu, Y. Effect of off-zenith observations on reducing the impact of precipitation on ground-based microwave radiometer measurement accuracy. Atmos. Res. 2014, 140–141, 85–94. [Google Scholar] [CrossRef]
  39. Pan, Y.; Zhang, S.; Li, Q.; Ma, L.; Jiang, S.; Lei, L.; Lyu, W.; Wang, Z. Analysis of convective instability data derived from a ground-based microwave radiometer before triggering operations for artificial lightning. Atmos. Res. 2020, 243, 105005. [Google Scholar] [CrossRef]
  40. Kober, K.; Tafferner, A. Tracking and nowcasting of convective cells using remote sensing data from radar and satellite. Meteorol. Zeitsch. 2009, 1, 75–84. [Google Scholar] [CrossRef] [PubMed] [Green Version]
  41. Chakraborty, R.; Das, S.; Jana, S.; Maitra, A. Nowcasting of rain events using multi-frequency radiometric observations. J. Hydrol. 2014, 513, 467–474. [Google Scholar] [CrossRef]
  42. Zhu, Y. Retrieval of Cloud Parameters in Summer in Nagqu, Qinghai Tibet Plateau Based on Millimeter Wave Radar Data. Master’s Thesis, Nanjing University of Information Science & Technology, Nanjing, China, 2019. [Google Scholar]
Figure 1. Geographical location of the field site of meteorological observations, (ac) refer to position of field site, MWR and LUFFT weather station.
Atmosphere 13 00549 g001
Figure 2. Flow chart of remote sensing atmospheric detection by MWR.
Atmosphere 13 00549 g002
Figure 3. The framework of the article.
Atmosphere 13 00549 g003
Figure 4. Comparison of temperature (a,d), vapour density (b,e), and relative humidity (c,f) profiles obtained from MWR and RAOB under clear-sky and snowy-sky conditions.
Atmosphere 13 00549 g004aAtmosphere 13 00549 g004b
Figure 5. Comparison of temperature bias (a,d), vapour density bias (b,e), and relative humidity bias (c,f) profiles obtained from MWR and RAOB under clear-sky and snowy-sky conditions. RMSEs are marked by error bars.
Atmosphere 13 00549 g005aAtmosphere 13 00549 g005b
Figure 6. Statistical characteristics of parcel heights (from 8:00 to 20:00 monsoon seasons) under different weather conditions. (a) CCL, (b) LCL, (c) LFC, (d) LFCEL. The t(h) is expressed in UTC+8.
Atmosphere 13 00549 g006
Figure 7. Statistical characteristics of stability indices (from 8:00 to 20:00 monsoon) season under different weather conditions. (a) CAPE, (b) DCAPE, (c) CIN, (d) MVV. The t(h) is expressed in UTC+8.
Atmosphere 13 00549 g007
Figure 8. Statistical characteristics of vapour density and liquid water content (from 8:00 to 20:00 monsoon) under different weather conditions. (a) Precipitable water vapour (PWV), (b) integrated liquid water content (LWC). The t(h) is expressed in UTC+8.
Atmosphere 13 00549 g008
Figure 9. Temporal evolution of brightness temperatures at the sampling channel from 22.2 GHz to 60.0 GHz for snowy days. (a) 22.2–30.0 GHz and (b) 51.24–58.8 GHz.
Atmosphere 13 00549 g009
Figure 10. Temporal evolution of PWV, LWC, CAPE, DCAPE and RR for snowy days. The time instant t(h) = 0 h represents one hour before the precipitation process.
Atmosphere 13 00549 g010
Figure 11. Comparison of temperature (a), vapour density (b), liquid water content (c), and relative humidity (d) profiles before and during the snow process. The time instant t t(h) = 0 h represents one hour before the precipitation process.
Atmosphere 13 00549 g011
Figure 12. Scattergrams of LWC against PWV (a) and PWV (and LWC) against R (b) for snowy days.
Atmosphere 13 00549 g012
Table 1. Schedule of field experiments of meteorological observations.
No.DateTypePrecipitation
Start TimeDuration
119 October 2019Clear day//
221 October 2019Clear day//
322 October 2019Snowy day14:48:3801:08:30
423 October 2019Snowy day17:32:1300:52:10
524 October 2019Snowy day14:15:1501:34:55
625 October 2019Clear day//
731 October 2019Snowy day16:56:0800:47:55
84 November 2019Snowy day14:30:4900:16:25
95 November 2019Snowy day14:03:0202:17:20
1015 November 2019Clear day//
1116 November 2019Clear day//
1217 November 2019Clear day//
1318 November 2019Snowy day17:44:0400:26:25
1419 November 2019Snowy day15:35:3401:23:25
1524 November 2019Snowy day10:12:2302:15:50
1628 November 2019Clear day//
1729 November 2019Snowy day17:42:0000:49:55
1830 November 2019Snowy day12:34:1801:23:30
1914 December 2019Clear day//
2016 December 2019Clear day//
2125 December 2019Clear day//
228 January 2020Clear day//
Publisher’s Note: MDPI stays neutral with regard to jurisdictional claims in published maps and institutional affiliations.

