Abstract
CO2 is the main greenhouse gas. Urban spatial development, land use, and so on may be affected by CO2 and climate change. The main questions studied in this paper are as follows: What are the drivers of CO2 emissions of expanding megacities? How can they be analyzed from different perspectives? Do the results differ for megacities at different stages of development? Based on the XGBoost model, this paper explored the complex factors affecting CO2 emissions by using data of four Chinese megacities, Beijing, Tianjin, Shanghai, and Chongqing, from 2003 to 2017. The main findings are as follows: The XGBoost model has better applicability and accuracy in predicting carbon emissions of expanding megacities, with root mean square error (RMSE) as low as 0.036. Under the synergistic effect of multiple factors, population, land size, and gross domestic product are still the primary driving forces of CO2 emissions. Population density and population become more important in the single-factor analysis. The key drivers of CO2 emissions in megacities at respective developmental stages are different. This paper provides methods and tools for accurately predicting CO2 emissions and measuring the critical drivers. Furthermore, it could provide decision support for megacities to make targeted carbon-emission-reduction strategies based on their own developmental stages.
1. Introduction
Carbon dioxide (CO2) is recognized as the main greenhouse gas (GHG). CO2 emissions (CE) have become the main cause of global warming [1]. To address climate change, Japan, Britain, Canada, South Korea, and other countries have successively put forward political commitments to achieve the goal of carbon neutrality by 2050. Maintaining or reducing CE has become a challenging task for most countries [2]. On the basis of the International Energy Agency (IEA), global annual CE have increased by 12.8 gigatonnes (Gt) over the last 19 years [3]. As centers of human activities, 71% of global CE come from urban areas [4,5]. By 2030, K.C. Seto et al. predicted that more than 5.87 million km2 of land have a high probability of being converted to urban areas, with 20%of this having high potential for urban expansion [6]. The expansion of urban area leads to urban sprawl, which brings CE problems in industry, transportation, construction, infrastructure, and so on. More and more governments are emphasizing the hazards arising from CE caused by urban expansion. The transformation of the global environment will be affected by the initial regional changes that will gradually extend to larger regions [7].
In cities, there are many factors that have significant impacts on CE; the case in point is urban land use patterns [8], socioeconomic driving factors [9], urban forms [10], and so on. However, the process-based character of urban expansion is denied by such research [11].
It is known that population growth and the growing needs of the population living in a given area are the key driving factors for urban expansion [12]. Demands for residential, employment, and public service by humans are the force for urban expansion, which increase CE of residential areas and commuting [13]. Urban expansion caused by land-use growth affects people’s daily annual vehicle kilometers, resulting in a significant increase in CE of travel [14]. Research shows that the urban population growth rate is lower than or equal to the urban land expansion rate, which have the opposite impact on urban population density and residential density [15].
Meanwhile, when the urban population growth rates are less than or equal to urban land expansion rates, it could increase travel CE. The process of urban expansion is dominated by urban population, urban land use, and social and economic behavior [12]. Because urban expansion is a complicated process, learning about the role of urban expansion factors may provide an alternative way to predict CE and low-carbon cities.
Many studies have explored the theoretical and empirical relationships between urban sprawl and CE. It is a fact that expansion characteristics of many cities have a great impact on CE, for instance, the rapid expansion of urban populations, urban land use, economics, energy consumption, and so on. Subsequently, several studies have investigated the relationships between population density [16], land area [17], GDP per capita [18], economic development, technology, and CE from urban expansion [19]. However, the above opinions may be different when considering different areas [4], such as national- [20], regional- [21], provincial- [22], or city-level CO2 data [23]. Based on the foregoing, one of the most pressing issues in sustainable social and economic development is the effective investigation of the impact of urban expansion on CE [24]. Although several studies have looked into the impact of urbanization on CE, the majority of them concentrated on national-, regional-, provincial-, or city-level CO2 data. Simultaneously, CO2 data at the megacity level is rarely presented. Megacities have a higher level of urbanization than other cities, and the factors influencing carbon emissions are more complex. The study of megacities’ CE drivers can not only provide CE forecasting methods for similar megacities around the world, but also support carbon reduction policies.
This paper aims to provide a reasonable path for future urban expansion strategies by measuring the key influencing factors related to predicting the CE of urban expansion and thus guiding the principles of future urban planning. The contributions of this paper are summarized as follows:
- The authors collect the data of four megacities from 2003 to 2017 and make a detailed analysis about the critical factors of urban CE based on these data. These analysis results can be helpful to the governments.
- The authors discuss the impact of different factors on urban CE from both a single and synergistic view. The authors employ XGBoost to predict urban CE and compare it with ordinary linear regression (OLR) and multi-layer perception (MLP) algorithms.
- The authors further discuss the impact of different factors on CE of urban expansion under different urban development stages. The findings of this research could provide decision support for cities to make targeted strategies of carbon emissions reduction according to their own developmental stages.
This article’s basic structure is as follows. Section 2, following the introduction, incorporates relevant research from predecessors. Section 3 discusses the research topic, variable collection, and processing methods. The experimental results are discussed in Section 4. Section 5 delves deeper into the relationship between typical variables and CE from urban expansion. Section 6 concludes with a summary of this article.
2. Literature Review
The key to predicting total CE is to scientifically extract the driving force behind CE. [25]. Numerous factors have been used to predict total CE based on some methods, including total population, affluence, technology, energy, land use, and urban form. Many studies have developed models for predicting CE and have used various factors to simulate CE in various scenarios. The IPAT model, STIRPAT model, MARKAL model, LEAP model, coupled social-ecological systems model (CSES), social–ecological process model, socioeconomic factors, and spatial structure (CSS) models are linked via the urbanization energy consumption-CO2 Emission System Dynamics (UEC-SD) model, with the majority of them based on OLR or other models.
Population, energy, technology, and affluence have an obvious positive impact on CE [19]. Since the 1970s, IPAT identity has been a widely accepted method for analyzing population, the economy, and technology to identify the forces driving CE [26,27]. However, through empirical results, CE at the national level will be significantly affected by the economy, technology, and energy [19]. Therefore, rapid economic growth is the primary determinant that causes an increase in CE by a regional perspective [28], while the variable T in the IPAT model is usually incorrectly treated as a residual term encompassing everything that affects CE other than population or affluence. The model also allows for testing the effect of different variables, such as physical space, which can trigger CE [29].
Due to rapid urbanization, a large amount of energy is consumed by the city, which also leads to higher CE. As energy demand grows more than supply, it is essential for cities to improve energy efficiency. To reduce urban energy consumption, many scholars have studied low carbon transition of the key CE sectors in urban regions, especially building energy consumption. For example, some scholars have used dynamic emission scenarios to simulate the energy and emission peaks of China’s residential construction industry [30] and some researchers have shown that Heating Ventilation and Air Conditioning (HVAC) system plays a key role in decarbonization of existing buildings [31]. Since the mid-1970s, energy system analysts have been trying to reduce CE by using models. The MARKAL model is an energy and environmental system planning model with the lowest cost and can be used to explore medium and long-term responses to different CE [32]. According to the explanation of V. Bhatt et al., by using this model, the best strategies for climate change mitigation, design of long-term energy security, and environmental protection in fast-growing urban areas are selected, but this model cannot analyze the impact of other factors on CE [33]. The sources of CE in the energy sector and non-energy sectors can be explained by the Long-Range Energy Alternatives Planning System (LEAP) model. The system aims to identify and quantifying the impact of future energy consumption patterns on CE, and energy planners and decision makers will be helped [34]. Also, the LEAP model has a flexible data structure and requires low initial data. Likewise, the energy consumption, transformation, and CE are the main factors of its framework, but there are limitations in defining some variables [35].
The change in land use has directly or indirectly influenced CE in the past years [7]. The analytical results reveal that CE usually increased with the increases in urban-planned zones [22]. The assessment of land use’s influence will be one of the primary directions of CE prediction in the future [7]. For example, some scholars coupled the semi-distributed hydrological model (HYPE) and Land-Use Evolution and Impact Assessment model (LEAM) to quantify essential urbanization links, effects, and feedback of socioeconomically driven land-use changes and hydrological changes. They present a CSES model that can provide such support [36]. Some researchers presented a social-ecological process model (SES) and systems modelling framework for examining future GHG emissions (include CE) of various scenarios [37]. The advantage of the SES model is that it enhances land use on CE urban expansion. However, the application of different expansion modes in other cities needs further exploration.
Except for the socioeconomic attributes, some studies show that the relationship between urban form and CE have significant correlations [16]. The urban expansion process is very complicated. Urban planning should form the basis of the decisions or measures that create our environment and influence CE [38]. Some scholars have built the UEC-SD model using a system dynamics method to compare the CE change and rules in different urbanization rates [21]. System dynamics, cellular automata and support vector regression are combined by some researchers to evaluate the impacts of different socio-economic developments and urban spatial structure on CE. The CSS model found that the government should construct an ideal urban structure of compact and multiple-nuclei development through spatial optimization for building a low carbon city [9].
In conclusion, scholars mostly focus on national, provincial, and general cities in their research on the relationship between urban expansion and CE, ignoring megacities in the late stages of urbanization. The megacity development stage is relatively mature, and the factors influencing CE are more complex, necessitating more accurate research models as support. Studies on CE driving factors mostly analyze the driving factors of CE in a region from the perspective of multifactor synergy, ignoring the influence of a single factor, and rarely studying the differences of CE driving factors in cities at different development stages. To address the aforementioned research gap, this paper will examine the key influencing factors of megacities at various stages of development from the perspectives of multiple factors and single factors to provide support for similar megacities around the world to formulate carbon emission reduction policies.
Along with the technical development in the computer, the Particle Swarm Optimization (PSO) algorithm [20], supervised machine learning regression technique [39], and some other methods are applied for forecasting the CE. Unfortunately, these methods still have some problems, such as complex parameter adjustment and low convergence accuracy [40]. These methods are not suitable for the mechanism research and prediction of carbon emissions in megacities. Compared with the above methods, XGBoost has a faster training speed and higher accuracy, and can better deal with linear and nonlinear data. XGBoost belongs to an integrated learning model, which generates a model with high accuracy through continuous iterative fitting of residuals [41]. It has been widely used in the study of traffic flow forecasting [42], user behavior prediction [43], disease risk prediction [44], and so on. However, few researchers use the XGBoost model to predict carbon emissions. Therefore, this paper attempts to use the XGBoost model to explore the driving factors of CE of expanding megacities.
3. Materials and Methods
3.1. Study Area
Beijing, Shanghai, Tianjin, and Chongqing play a key role in promoting the economic development of Chinese cities, and they are also four municipalities directly under the direct management of the Chinese central government [45]. According to statistics in 2018, these four metropolitan areas accounted for 1.22% of Chinese land area. In addition, they have not only experienced economic growth and social development, but also the dramatic expansion of cities [46]. Some research indicates that annual GHG emission of these four cities exceed 500 million tons [47]. Based on this background, these four megacities have been selected as case studies. The impact of urban expansion on CE will be explored, and the results of the paper may have typical significance for other megaregions in other countries.
3.2. Methods and Models
The main steps of this research are listed below: (1) collecting the four megacities’ energy supply data to calculate CE; (2) the potential factors of CE that affect urban expansion are selected and quantified; (3) using regression analysis to analyze influencing factors; (4) the relative importance of the influencing factors will be evaluated, and the interaction between the factors will be calculated at the same time; (5) results are analyzed and interpreted. The workflow is shown in Figure 1. The XGBoost, OLR, and MLP model is used to evaluate the significance between CE and influence factors in step (4).
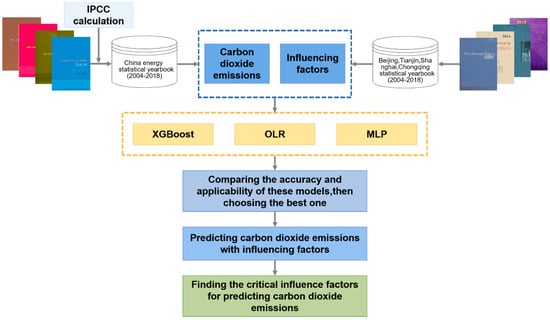
Figure 1.
Workflow for the detection of influencing factors related to CE of urban expansion.
3.2.1. XGBoost
XGBoost is a system for tree boosting that can scale machine learning. The system’s impact has been widely recognized, such as Kaggle and KDDCup. The runs of the course are compared with the existing popular solutions on a single machin; not only does it run more than ten times faster, but it can scale to billions of examples in distributed or memory-limited settings [48]. The trained XGBoost model can automatically calculate the feature importance of each factor in the prediction model and measure the relationship between each factor and CE by the feature importance of each factor. The forecast assessment process is as follows [49]:
First, given a sample {(xi, yi)} (1, 2, …, n), a regression tree is constructed for each sample, then there are n regression trees. The formula is as follows:
In the formula, xi is the sample i, is the predicted value of the sample i, is the regression equation corresponding to the regression tree k of the variable i, and F is the set of all regression trees.
Second, an objective function consisting of a loss function and a regularization term is constructed. The loss function is used to fit the training data and the regularization term is used to simplify the model:
In the formula, is the objective function, is the loss function, is the regularization term, and is the real value of the sample.
Then, the loss function is expanded by Taylor to approximate the true value, and the formula is as follows:
In the formula, is the loss value of t − 1 trees before sample i, is the first partial derivative of , and ½ is the second partial derivative of .
Finally, the objective function is:
3.2.2. Multi-Layer Perceptron
Artificial neural networks can solve a variety of complex prediction problems [50]. According to the prediction involved in the given current and previous conditions, the model can predict the future trend in the data series [51]. The MLP neural networks were observed to be better compared to predicting CE with regression models [52].
3.3. Data Collection and Preprocessing
3.3.1. Dependent Variable
This paper’s dependent variable was the total CE and CE per capita of the four megacities from 2003 to 2017. The population and CE are combined. This combination is of great significance for determining the share of CE reduction in the region [53]. The data acquisition method and process are as follows.
First, according to the 2006 IPCC [54], this paper used the four megacities’ energy supply data to calculate the CE from the combustion of mainly fossil fuels, which included Raw Coal, Crude Oil, Coke, Diesel Oil, Gasoline, Fuel Oil, Kerosene, and Natural Gas. The energy consumption data were obtained from the China Energy Statistical Yearbook of 2004 to 2018. Refer to “(5).” The computational formula is as follows:
where CE (tons) refers to annual total CE from the built-up environment; CE energy-i represents the quantity of CE from energy i; ADi is the quantity of energy consumption by energy i, NCVi, CCi, COFi and 44/12 are the net caloric value, carbon content, oxygenation efficiency of energy i and molecular weight ratio of CO2 to C. The energy supply data is in Table 1.

Table 1.
The energy supply data.
The CE per capita can be calculated to refer to “(6),” as follows:
where CEPC means CE per capita, CE stands for the amount of CE, and P (persons) represents Permanent Population. The permanent population data was from the four megacities’ Statistical Yearbook from 2004 to 2018.
3.3.2. Influencing Factors
According to relevant research in China and internationally, this paper extracts data from the four megacities’ Statistical Yearbook from 2004 to 2018, China Urban Statistical Yearbook from 2004 to 2018 and China Land and Resources Statistical Yearbook from 2004 to 2018. I there are eight influencing factors selected, which are from the four dimensions of the city’s size, economic development, technology, and the difference of regional space in urban areas as variables.
The size of the city involves population size and urban built-up area [1]. Population urbanization and land urbanization usually have a positive impact on CE. Therefore, this paper chooses the permanent population and land for construction in urban areas (L/Square kilometer (km2)) to measure city size. Economic growth can directly promote energy production and consumption, causing more CE [55]. Some research found strong positive correlation between CE and real GDP [56]. The present study used GDP and GDP per capita (GDPPC) to measure urban economic development. The technology has a positive impact on energy efficiency [42]. Usually, the more advanced technology is, the lower CE intensity, namely, energy consumption per GDP (CI). To clarify the impact of spatial urbanization on CE of urban expansion, this paper used the indicators of the population density (PD), residential density (RD), and the urban development model is reflected by the ratio of built-up area to urban area (BU) [57,58,59]. The descriptive statistics for the variables are in Table 2, Table 3, Table 4 and Table 5.
Table 2.
Descriptive statistics of variables in Beijing.
Table 3.
Descriptive statistics of variables in Tianjin.
Table 4.
Descriptive statistics of variables in Shanghai.
Table 5.
Descriptive statistics of variables in Chongqing.
4. Results
This paper fitted the data based on the XGBoost algorithm and compared it with OLR and MLP algorithms. The authors also select several standard evaluation indexes of regression algorithm, such as mean square error (MSE), mean absolute error (MAE), mean fundamental percentage error (MAPE), root mean square error (RMSE), and symmetrical mean absolute percentage error (SMAPE) to compare the regression effects of different models. The authors study the relationship between each influencing factor and CE, and the output and fitting results of the model are shown in Table 6, Table 7, Table 8 and Table 9.
Table 6.
Evaluation indexes of each algorithm in Beijing.
Table 7.
Evaluation indexes of each algorithm in Tianjin.
Table 8.
Evaluation indexes of each algorithm in Shanghai.
Table 9.
Evaluation indexes of each algorithm in Chongqing.
4.1. XGBoost Model
Generally speaking, when MSE, RMSE, MAE, MAPE and SMAPE are smaller, the fitting degree of the model to the data is better. Take the result of Shanghai for example, MSE, RMSE, MAE, MAPE and SMAPE are 0.001, 0.036, 0.034, 0.183 and 0.183 by XGBoost. Based on the above results, XGBoost algorithm has the best appropriate degree in each city’s data, which indicates that XGBoost algorithm is the best choice in explaining the impact of various factors on urban CE. Therefore, the authors conduct the following experimental analysis using the XGBoost model. And the relevant results of the relationship between influencing factor and CE/CE per capita are shown in Figure 2 and Figure 3.
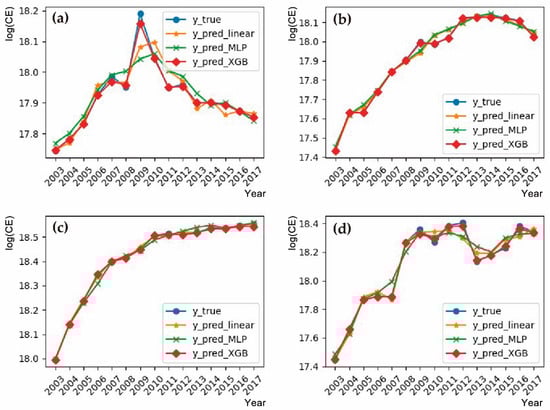
Figure 2.
CE and influence factors regression results using XGBoost. (a) Beijing; (b) Tianjin; (c) Shanghai; (d) Chongqing.
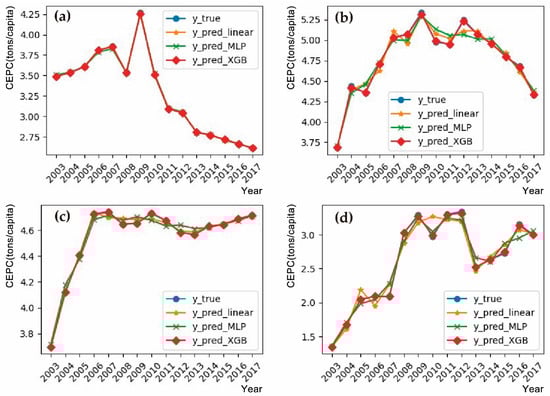
Figure 3.
CEPC and influence factors regression results using XGBoost. (a) Beijing; (b) Tianjin; (c) Shanghai; (d) Chongqing.
4.2. The Importance of the Influencing Factors in Synergy
4.2.1. CE
Figure 4 shows the results of the XGBoost model. In the fifteen years studied, at the CE scale, in Beijing, the relative importance of influence factors is in turn P, GDP, GDPPC, CI, PD, L, and BU, and the percentages are 27.52%, 26.84%, 23.49%, 9.40%, 6.04%, 6.04% and 0.67%. In Tianjin, the relative importance of influence factors is P, L, GDP, GDPPC, PD, and CI, and the percentages are 32.83%, 24.63%, 19.40%, 12.69%, 6.72%, 3.73%. In Shanghai, the relative importance of influence factors is P, GDP, GDPPC, CI, PD, L and BU, and the percentages are 36.74%, 25.17%, 19.05%, 11.56%, 3.40%, 3.40% and 0.68%. in Chongqing the relative importance of influence factors are in turn L, P, GDP, GDPPC, PD, RD, CI and BU, the percentages are 28.13%, 25.78%, 18.75%, 14.06%, 6.25%, 4.69%, 1.56% and 0.78%.
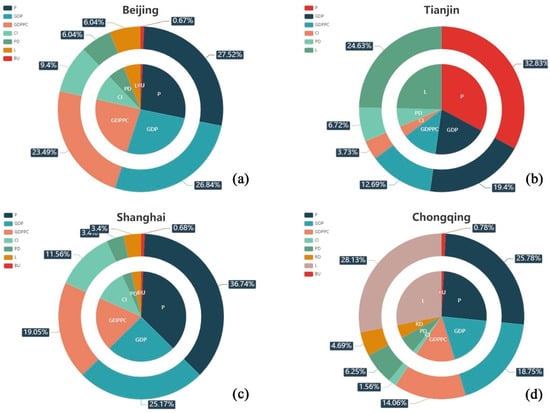
Figure 4.
CE and influence factors regression results using XGBoost. (a) Beijing; (b) Tianjin; (c) Shanghai; (d) Chongqing.
4.2.2. CEPC
Figure 5 shows the results of the XGBoost model. In the fifteen years studied, at the CEPC scale, in Beijing, the relative importance of influence factors is in turn P, L, GDP, GDPPC, CI, BU and RD, the percentages are 26.98%, 25.40%, 19.05%, 9.52%, 9.52%, 5.56%, and 3.97%. In Tianjin, the relative importance of influence factors is P, GDP, L, GDPPC and CI, and the percentages are 40%, 25.72%, 18.57%, 8.57%, and 7.14%. In Shanghai, the relative importance of influence factors is P, GDP, L, GDPPC, CI and PD, and the percentages are 35.09%, 24.56%, 19.30%, 10.52%, 7.02%, and 3.51%. In Chongqing, the relative importance of influence factors are, in turn P, L, GDP, GDPPC, RD, PD, BU, and CI, and the percentages are 28.68%, 23.26%, 20.93%, 14.73%, 6.20%, 4.65%, 0.78%, and 0.77%.
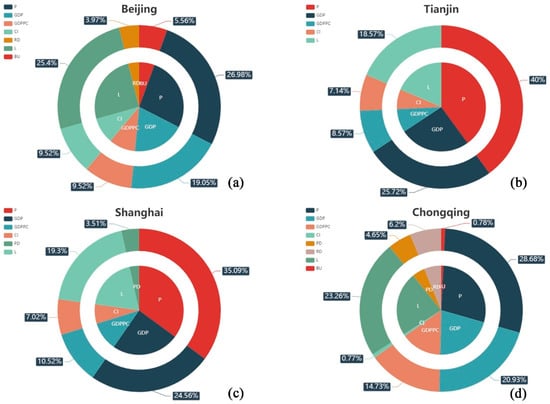
Figure 5.
CEPC and influence factors regression results using XGBoost. (a) Beijing; (b) Tianjin; (c) Shanghai; (d) Chongqing.
4.3. The Importance of the Influencing Factors in Single Factor
In order to further discuss the influence of various factors on the CE and CEPC in the regression analysis results of the total CE and CEPC model, the authors further consider the final model results by using a single feature for regression analysis and deleting a feature for regression analysis. The experimental results are shown in Figure 6.
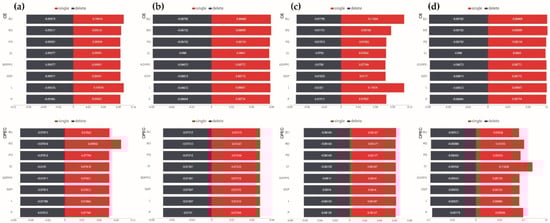
Figure 6.
The influence of various factors on the CE and CEPC in regression analysis results using XGBoost. (a) Beijing; (b) Tianjin; (c) Shanghai; (d) Chongqing.
4.3.1. CE
In CE, PD and P are the most critical factors affecting CE, followed by GDP, GDPPC, CI, and RD. The effects of L and BU were not significant in Beijing. CI, P, and PD are the most critical factors affecting CE, followed by GDPPC, GDP, and L. The effects of BU and RD were not significant in Tianjin. GDP and GDPPC are the most critical factors affecting CE, followed by CI, P, PD, and RD. The effects of L and BU were not significant in Shanghai. CI, PD, and P are the most critical factors affecting CE, followed by GDP, GDPPC, and L. The effects of BU and RD were not significant in Chongqing.
4.3.2. CEPC
In CEPC, P and PD are the most critical factors affecting CEPC, followed by GDP, GDPPC, and CI. The effects of L, BU, and RD were not significant in Beijing. P and PD are the most critical factors affecting CE, followed by L, GDPPC, GDP, and BU. The effects of CI and RD was not significant in Tianjin. P, PD, and RD are the most critical factors affecting CE, followed by GDP and GDPPC. The effects of CI, L, and BU were not significant in Shanghai. BU and L are the most critical factors affecting CE, followed by GDPPC, GDP, PD, and P. The effects of RD and CI were not significant in Chongqing.
5. Discussion
Based on XGBoost, the authors derive several meaningful conclusions about the relationship between CE of urban expansion and the influence factors’ growth rate. In the aspect of multi factors coordination and single factors prediction, different elements have different effects. Furthermore, the scale of total CE and per capita CE are different. The empirical results are shown in Figure 7.
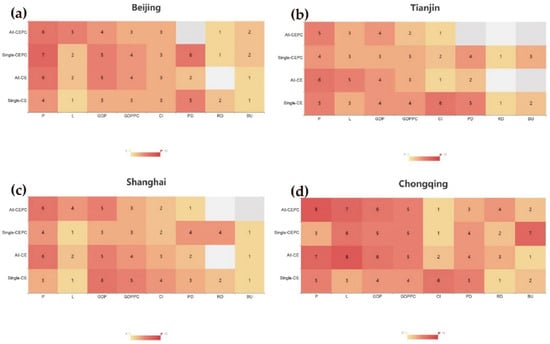
Figure 7.
Comparative analysis. (a) Beijing; (b) Tianjin; (c) Shanghai; (d) Chongqing.
The results show that under the influence of multiple factors, the CE scale of Beijing and Shanghai are greatly affected by P, GDP, and GDPPC, while those of Tianjin and Chongqing are greatly affected by P, L and GDP. The reason for this phenomenon is that Beijing and Shanghai, as the two major economic centers of China, are at a higher level of development and attract a large number of migrant workers for employment and migrant enterprises for investment every year with population growth and ecological development. As a result, traffic congestion, industrial pollution, and energy consumption are becoming increasingly serious, leading to more CE. For cities in the development stage, managers should take measures to increase the proportion of green travel in the city, improve the utilization of green energy, such as solar energy, and reduce CE from large-scale industrial production by changing the industrial structure. While Tianjin and Chongqing are in the rapid development of industrialization and urbanization period, the level of urban development is relatively low. In addition to population and ecological growth, the continued increase in construction land has brought about a large amount of infrastructure construction and growth in energy demand, resulting in an increase in carbon emissions. For cities at this stage of development, managers should focus on improving the intensive use of land and the mix of land functions. Thus, for more developed cities, population and economic growth drive the total amount of CE more effectively than the increase in urban land area in the progress of urban expansion. For generally developed cities, the increase of population, economy, and land area are the important driving factors of the total CE in the process of urban expansion. The CEPC scale of the above four cities is greatly influenced by P, L, and GDP. It indicates that population growth, land area expansion, and economic growth are important driving factors for the increase of per capita CE in megacities.
Under the influence of a single factor, the total carbon emissions of Tianjin and Chongqing have significant relevance with CI, P, and PD, and Beijing is relevant to P and PD, while Shanghai is significantly affected by GDP and GDPPC. The reason for this phenomenon is that Shanghai’s GDP growth has been at a high level in the process of urban expansion, and the external performance of economic development and the increase in total CE has the same change trend. The other three cities showed the same trend of population increase and total carbon emissions increase in the process of urban expansion. Meanwhile, the energy consumption per GDP shows significant correlation with total carbon emissions in generally developed cities. The per capita carbon emissions of Beijing, Tianjin, and Shanghai are significantly affected by P and PD, while those of Chongqing were significantly affected by BU and L. The reason is that the area increment of built-up areas is always at a high level in the process of urban expansion in Chongqing, and land area expansion and per capita carbon emissions increase, which have the same change trend in the external performance. The other three cities showed the same trend of population increase and per capita CE increase in the process of urban expansion.
The findings show that megacities’ CE are closely related to economic development, population growth, and the expansion of construction land area. The key drivers of carbon emissions differ in megacities at different development stages. When developing carbon-control strategies for megacities, it should consider the economy, population, and land use. Simultaneously, the focus of emission reduction direction is determined based on the different stages of different cities. The driving effect of land expansion on CE is more significant in megacities, such as Chongqing, where the urbanization rate still has room for improvement, and attention should be paid to controlling the scale of construction land, reasonable division of land functions, construction of low-carbon land use system, increased use of green buildings, and rational planning of road network structure to reduce the emission brought by urban construction land expansion. The growth of the economy, population, and land area in Tianjin, a more developed regional central city, has a greater impact on CE, which should be reflected in the formulation of carbon-control strategies. The driving effect of economic growth on CE is more significant for a highly developed national economic center similar to Shanghai, and the synergy between economic growth and CE reduction should be emphasized when formulating carbon-control strategies. Under the condition of stable economic development, the authors should improve resource efficiency and reduce energy consumption to reduce the impact of economic development on carbon emissions. For Beijing, the country’s most developed political center, the driving effect of population growth on CE is more significant, and when developing carbon-control strategies, the authors should focus on improving green and low-carbon awareness among the population and advocating green consumption, green travel, and green life of the low-carbon concept to reduce the impact of population growth on CE.
The contribution of urban expansion to regional carbon emissions has been studied by some researchers [60], the potential impacts of urban expansion on regional carbon storage [61], and the drivers of CE in international trade [62]. In contrast to these studies, the contribution of this paper is to measure the driving factors of CE in the process of urban expansion of megacities at different developmental stages. In the meantime, several XGBoost models and other variants have been developed for predicting a problem, for example, open-access data and machine learning are used to model and predict urban CE [63] and research on urban air quality prediction based on ensemble learning of XGBoost [64]. Compared with these studies, the contribution of this paper is to study the influence factors of total CE and per capita CE in the process of urban expansion from two different angles: multi-factor synergy and single-factor correlation. Along with the development of IoT and big data, different scales including neighborhood level, community level, etc., and more accurate data will be applied to the prediction of CE, especially the application of real-time data, which will provide a dynamic simulation platform for CE prediction and real-time control strategies.
6. Conclusions
Due to the completeness and availability of data, this paper collected data from four megacities (Beijing, Shanghai, Tianjin, and Chongqing) in China between 2003 and 2017. According to the data, the authors investigated the impacts of P, L, GDP, GDPPC, CI, PD, RD, and BU on CE of urban expansion by using the XGBoost model. The following are the main results.
First, compared with the traditional multiple linear regression and MLP algorithms, the XGBoost model has better applicability and accuracy in predicting total CE and CE per capita in urban expansion. The results show that the model is not only feasible but also achieves high predicting accuracy. The authors can use it to predict CE.
Second, under the synergistic effect of multiple factors, i.e., population, land size, and gross domestic product, are still the core, driving force of total CE and CE per capita of urban expansion. Similarly, this is consistent with existing research that shows that population, land, and economic growth are the main drivers of CE for megacities’ city expansion [65].
Third, in the single-factor analysis, population density, population, and carbon emission intensity play a more prominent role. This paper reveals that the spatial development pattern of megacities also has a dramatic impact on CE. Global CE can be significantly mitigated through technological innovation [66].
Finally, the authors also found that the factors affecting urban CE are different for different megacities at different developmental stages. For those cities that are still in a rapid expansion stage of urban land area expansion, the increasing trend of per capita carbon emission is more consistent with the increasing trend of construction land area. For megacities with higher levels of economic development, population and economic growth are more significant driving factors of total CE, and the trend of increase in total CE is more consistent with the trend of economic development.
CO2 is the most important greenhouse gas, and it is of great significance to accurately predict the CE in the process of urban expansion. The paper is instructive to formulate carbon emissions reduction strategies and targets of megacities according to local conditions. It needs to be pointed out that although the contribution degree of different driving factors to urban carbon emissions is calculated in this paper, how much carbon emissions can be increased or decreased by the change of driving factors has not been calculated yet, for example, how much carbon emissions can be reduced by reducing a certain percentage of construction land area. Further exploration using other methods and data is needed in the future.
Author Contributions
Conceptualization: H.Z. and R.W.; methodology: J.Z.; software: J.Z.; validation: M.Z.; formal analysis: J.Z.; investigation: Y.H.; resources: J.H.; data curation: J.P.; writing—original draft preparation: J.Z.; writing—review and editing: M.Z.; visualization: R.W.; supervision: H.Z.; project administration: H.Z.; funding acquisition: H.Z. All authors have read and agreed to the published version of the manuscript.
Funding
This research was funded by National Natural Science Foundation of China, grant number 52078328 and National Key Research and Development Project of China, grant number 2018YFC0704701.
Institutional Review Board Statement
Not applicable.
Informed Consent Statement
Not applicable.
Data Availability Statement
If anyone who is interested in the paper can contact me by zhang_jianxun36@tju.edu.cn for the data.
Conflicts of Interest
The authors declare no conflict of interest.
References
- Yi, Y.; Ma, S.; Guan, W.; Li, K. An Empirical Study on the Relationship between Urban Spatial Form and CO2 in Chinese Cities. Sustainability 2017, 9, 672. [Google Scholar] [CrossRef]
- Lee, Z.H.; Sethupathi, S.; Lee, K.T.; Bhatia, S.; Mohamed, A.R. An overview on global warming in Southeast Asia: CO 2 emission status, efforts done, and barriers. Renew. Sustain. Energy Rev. 2013, 28, 71–81. [Google Scholar] [CrossRef]
- IEA. Energy Related CO2 Emissions, 1990–2019; IEA: Paris, France, 2020; Available online: https://www.iea.org/data-and-statistics/charts/energy-related-co2-emissions-1990-2019 (accessed on 15 May 2020).
- Shi, K.; Xu, T.; Li, Y.; Chen, Z.; Gong, W.; Wu, J.; Yu, B. Effects of urban forms on CO2 emissions in China from a multi-perspective analysis. J. Environ. Manag. 2020, 262, 110300. [Google Scholar] [CrossRef] [PubMed]
- Cai, B.; Zhang, L. Urban CO2 emissions in China: Spatial boundary and performance comparison. Energy Policy 2014, 66, 557–567. [Google Scholar] [CrossRef]
- Seto, K.C.; Güneralp, B.; Hutyra, L.R. Global forecasts of urban expansion to 2030 and direct impacts on biodiversity and carbon pools. Proc. Natl. Acad. Sci. USA 2012, 109, 16083–16088. [Google Scholar] [CrossRef]
- Deng, X.; Zhao, C.; Yan, H. Systematic Modeling of Impacts of Land Use and Land Cover Changes on Regional Climate: A Review. Adv. Meteorol. 2013, 2013, 1–11. [Google Scholar] [CrossRef]
- Chen, Y.; Li, X.; Zheng, Y.; Guan, Y.; Liu, X. Estimating the relationship between urban forms and energy consumption: A case study in the Pearl River Delta, 2005–2008. Landsc. Urban Plan. 2011, 102, 33–42. [Google Scholar] [CrossRef]
- Liu, X.; Ou, J.; Chen, Y.; Wang, S.; Li, X.; Jiao, L.; Liu, Y. Scenario simulation of urban energy-related CO2 emissions by coupling the socioeconomic factors and spatial structures. Appl. Energy 2019, 238, 1163–1178. [Google Scholar] [CrossRef]
- Liu, X.; Ou, J.; Li, X.; Chen, Y. Quantifying the relationship between urban forms and carbon emissions using panel data analysis. Landsc. Ecol. 2013, 28, 1889–1907. [Google Scholar] [CrossRef]
- Fang, C.; Wang, S.; Li, G. Changing urban forms and carbon dioxide emissions in China: A case study of 30 provincial capital cities. Appl. Energy 2015, 158, 519–531. [Google Scholar] [CrossRef]
- Li, L.; Sato, Y.; Zhu, H. Simulating spatial urban expansion based on a physical process. Landsc. Urban Plan. 2003, 64, 67–76. [Google Scholar] [CrossRef]
- Fang, C.; Wang, J. A theoretical analysis of interactive coercing effects between urbanization and eco-environment. Chin. Geogr. Sci. 2013, 23, 147–162. [Google Scholar] [CrossRef]
- Hankey, S.; Marshall, J.D. Impacts of urban form on future US passenger-vehicle greenhouse gas emissions. Energy Policy 2010, 38, 4880–4887. [Google Scholar] [CrossRef]
- Seto, K.C.; Fragkias, M.; Güneralp, B.; Reilly, M.K. A Meta-Analysis of Global Urban Land Expansion. PLoS ONE 2011, 6, e23777. [Google Scholar] [CrossRef] [PubMed]
- Liu, C.; Shen, Q. An empirical analysis of the influence of urban form on household travel and energy consumption. Comput. Environ. Urban Syst. 2011, 35, 347–357. [Google Scholar] [CrossRef]
- Cervero, R.; Murakami, J. Effects of Built Environments on Vehicle Miles Traveled: Evidence from 370 US Urbanized Areas. Environ. Plan. A Econ. Space 2010, 42, 400–418. [Google Scholar] [CrossRef]
- Bai, Y.; Deng, X.; Gibson, J.; Zhao, Z.; Xu, H. How does urbanization affect residential CO2 emissions? An analysis on urban agglomerations of China. J. Clean. Prod. 2019, 209, 876–885. [Google Scholar] [CrossRef]
- Wen, L.; Li, Z. Driving forces of national and regional CO2 emissions in China combined IPAT-E and PLS-SEM model. Sci. Total Environ. 2019, 690, 237–247. [Google Scholar] [CrossRef]
- Sangeetha, A.; Amudha, T. A Novel Bio-Inspired Framework for CO2 Emission Forecast in India. Procedia Comput. Sci. 2018, 125, 367–375. [Google Scholar] [CrossRef]
- Li, F.; Dong, S.; Li, S.; Li, Z.; Li, Y. Measurement and scenario simulation of effect of urbanisation on regional CO2 emissions based on UEC-SD model: A case study in Liaoning Province, China. Chin. Geogr. Sci. 2015, 25, 350–360. [Google Scholar] [CrossRef][Green Version]
- Wang, S.; Huang, S.; Huang, P. Can spatial planning really mitigate carbon dioxide emissions in urban areas? A case study in Taipei, Taiwan. Landsc. Urban Plan. 2018, 169, 22–36. [Google Scholar] [CrossRef]
- Makido, Y.; Dhakal, S.; Yamagata, Y. Relationship between urban form and CO2 emissions: Evidence from fifty Japanese cities. Urban Clim. 2012, 2, 55–67. [Google Scholar] [CrossRef]
- Xie, H.; Zhang, Y.; Duan, K. Evolutionary overview of urban expansion based on bibliometric analysis in Web of Science from 1990 to 2019. Habitat Int. 2020, 95, 102100. [Google Scholar] [CrossRef]
- Qian, Y.; Sun, L.; Qiu, Q.; Tang, L.; Shang, X.; Lu, C. Analysis of CO2 Drivers and Emissions Forecast in a Typical Industry-Oriented County: Changxing County, China. Energies 2020, 13, 1212. [Google Scholar] [CrossRef]
- Ehrlich, P.R.; Holdren, J.P. Impact of Population Growth. Science 1971, 171, 1212–1217. [Google Scholar] [CrossRef]
- Chontanawat, J. Decomposition analysis of CO2 emission in ASEAN: An extended IPAT model. Energy Procedia 2018, 153, 186–190. [Google Scholar] [CrossRef]
- Yue, T.; Long, R.; Chen, H.; Zhao, X. The optimal CO2 emissions reduction path in Jiangsu province: An expanded IPAT approach. Appl. Energy 2013, 112, 1510–1517. [Google Scholar] [CrossRef]
- Vélez-Henao, J.-A.; Vivanco, D.F.; Hernández-Riveros, J.-A. Technological change and the rebound effect in the STIRPAT model: A critical view. Energy Policy 2019, 129, 1372–1381. [Google Scholar] [CrossRef]
- Ma, M.; Ma, X.; Cai, W.; Cai, W. Low carbon roadmap of residential building sector in China: Historical mitigation and prospective peak. Appl. Energy 2020, 273, 115247. [Google Scholar] [CrossRef]
- Vainio, T.; Nippala, E.; Kauppinen, T. HVAC’s Role in the Decarbonisation of the Existing Building Stock-case Finland. In E3S Web of Conferences; EDP Sciences: Les Ulis, France, 2021; Volume 246, p. 13005. [Google Scholar] [CrossRef]
- Goldstein, G. MARKAL-MACRO: A Methodology for Informed Energy, Economy and Environmental Decision Making. Informal Report; Brookhaven National Lab.: Upton, NY, USA, 1995. [Google Scholar]
- Bhatt, V.; Friley, P.; Lee, J. Integrated energy and environmental systems analysis methodology for achieving low carbon cities. J. Renew. Sustain. Energy 2010, 2, 31012. [Google Scholar] [CrossRef]
- Nieves, J.A.; Aristizábal, A.J.; Dyner, I.; Báez, O.; Ospina, D.H. Energy demand and greenhouse gas emissions analysis in Colombia: A LEAP model application. Energy 2019, 169, 380–397. [Google Scholar] [CrossRef]
- Emodi, N.V.; Emodi, C.C.; Murthy, G.P.; Emodi, A.S.A. Energy policy for low carbon development in Nigeria: A LEAP model application. Renew. Sustain. Energy Rev. 2017, 68, 247–261. [Google Scholar] [CrossRef]
- Kalantari, Z.; Santos Ferreira, C.S.; Page, J.; Goldenberg, R.; Olsson, J.; Destouni, G. Meeting sustainable development challenges in growing cities: Coupled social-ecological systems modeling of land use and water changes. J. Environ. Manag. 2019, 245, 471–480. [Google Scholar] [CrossRef] [PubMed]
- Pan, H.; Page, J.; Zhang, L.; Cong, C.; Ferreira, C.; Jonsson, E.; Näsström, H.; Destouni, G.; Deal, B.; Kalantari, Z. Understanding interactions between urban development policies and GHG emissions: A case study in Stockholm Region. Ambio 2020, 49, 1313–1327. [Google Scholar] [CrossRef]
- Holden, E. Ecological footprints and sustainable urban form. Neth. J. Hous. Built Environ. 2004, 19, 91–109. [Google Scholar] [CrossRef]
- Kadam, P.; Vijayumar, S. Prediction Model: CO2 Emission Using Machine Learning. In Proceedings of the 2018 3rd International Conference for Convergence in Technology (I2CT), Pune, India, 6–8 April 2018; pp. 1–3. [Google Scholar]
- Wang, L.; Zhao, C.; Liu, X.; Chen, X.; Li, C.; Wang, T.; Wu, J.; Zhang, Y. Non-Linear Effects of the Built Environment and Social Environment on Bus Use among Older Adults in China: An Application of the XGBoost Model. Int. J. Environ. Res. Public Health 2021, 18, 9592. [Google Scholar] [CrossRef]
- Fan, J.; Wu, L.; Zheng, J.; Zhang, F. Medium-range forecasting of daily reference evapotranspiration across China using numerical weather prediction outputs downscaled by extreme gradient boosting. J. Hydrol. 2021, 601, 126664. [Google Scholar] [CrossRef]
- Chen, Z.; Fan, W. A Freeway Travel Time Prediction Method Based on an XGBoost Model. Sustainability 2021, 13, 8577. [Google Scholar] [CrossRef]
- Song, P.; Liu, Y. An XGBoost Algorithm for Predicting Purchasing Behaviour on E-Commerce Platforms. Teh. Vjesn. 2020, 27, 1467–1471. [Google Scholar] [CrossRef]
- Liu, J.; Wu, J.; Liu, S.; Li, M.; Hu, K.; Li, K. Predicting mortality of patients with acute kidney injury in the ICU using XGBoost model. PLoS ONE 2021, 16, e0246306. [Google Scholar] [CrossRef]
- Zhong, Z.; He, L.; Wang, Z. Geographic sources and the structural decomposition of emissions embodied in trade by Chinese megacities: The case of Beijing, Tianjin, Shanghai, and Chongqing. J. Clean. Prod. 2017, 158, 59–72. [Google Scholar] [CrossRef]
- Zheng, H.; Li, A.; Meng, F.; Liu, G.; Hu, Y.; Zhang, Y.; Casazza, M. Ecological network analysis of carbon emissions from four Chinese metropoles in multiscale economies. J. Clean. Prod. 2021, 279, 123226. [Google Scholar] [CrossRef]
- Liu, Z.; Liang, S.; Geng, Y.; Xue, B.; Xi, F.; Pan, Y.; Zhang, T.; Fujita, T. Features, trajectories and driving forces for energy-related GHG emissions from Chinese mega cites: The case of Beijing, Tianjin, Shanghai and Chongqing. Energy 2012, 37, 245–254. [Google Scholar] [CrossRef]
- Sheridan, R.P.; Wang, M.; Liaw, A.; Ma, J.; Gifford, E. Correction to Extreme Gradient Boosting as a Method for Quantitative Structure-Activity Relationships. J. Chem. Inf. Model. 2020, 60, 1910. [Google Scholar] [CrossRef] [PubMed]
- Chen, T.; Guestrin, C. XGBoost: A Scalable Tree Boosting System. In Proceedings of the 22nd ACM SIGKDD International Conference on Knowledge Discovery and Data Mining, San Francisco, CA, USA, 13–17 August 2016; pp. 785–794. [Google Scholar] [CrossRef]
- Allamsetty, S.; Mohapatro, S. Prediction of NO and NO2 Concentrations in NTP Treated Diesel Exhaust Using Multilayer Perceptrons. Energy Procedia 2019, 158, 4566–4571. [Google Scholar] [CrossRef]
- Gardner, M.W.; Dorling, S.R. Artificial neural networks (the multilayer perceptron)—A review of applications in the atmospheric sciences. Atmos. Environ. 1998, 32, 2627–2636. [Google Scholar] [CrossRef]
- Thompson, S.; Li, K. A MLP Prediction Model for Power Plant NOx Emission. IFAC Proc. Vol. 2000, 33, 117–122. [Google Scholar] [CrossRef]
- Li, S.; Zhou, C.; Wang, S.; Hu, J. Dose urban landscape pattern affect CO2 emission efficiency? Empirical evidence from megacities in China. J. Clean. Prod. 2018, 203, 164–178. [Google Scholar] [CrossRef]
- Treanton, K. Reference Approach. In 2006 IPCC Guidelines for National Greenhouse Gas Inventories; Eggleston, S., Buendia, L., Miwa, K., Ngara, T., Tanabe, K., Eds.; IGES: Kanagawa, Japan, 2006; Volume 2, pp. 5–6. [Google Scholar]
- Son, C.; Baek, J.; Ban, Y. Structural Impact Relationships Between Urban Development Intensity Characteristics and Carbon Dioxide Emissions in Korea. Sustainability 2018, 10, 1838. [Google Scholar] [CrossRef]
- Zhang, J.; Xie, Y.; Luan, B.; Chen, X.; Jie, Z.; Yang, X.; Bo, L.; Xiao, C. Urban macro-level impact factors on Direct CO2 Emissions of urban residents in China. Energy Build. 2015, 107, 131–143. [Google Scholar] [CrossRef]
- Travisi, C.M.; Camagni, R.; Nijkamp, P. Impacts of urban sprawl and commuting: A modelling study for Italy. J. Transp. Geogr. 2010, 18, 382–392. [Google Scholar] [CrossRef]
- Zeng, J.; Han, G.; Wu, Q.; Tang, Y. Effects of agricultural alkaline substances on reducing the rainwater acidification: Insight from chemical compositions and calcium isotopes in a karst forests area. Agric. Ecosyst. Environ. 2020, 290, 106782. [Google Scholar] [CrossRef]
- Zeng, J.; Yue, F.-J.; Li, S.-L.; Wang, Z.-J.; Wu, Q.; Qin, C.-Q.; Yan, Z.-L. Determining rainwater chemistry to reveal alkaline rain trend in Southwest China: Evidence from a frequent-rainy karst area with extensive agricultural production. Environ. Pollut. 2020, 266, 115166. [Google Scholar] [CrossRef] [PubMed]
- Svirejeva-Hopkins, A.; Schellnhuber, H.J. Urban expansion and its contribution to the regional carbon emissions: Using the model based on the population density distribution. Ecol. Model. 2008, 216, 208–216. [Google Scholar] [CrossRef]
- He, C.; Zhang, D.; Huang, Q.; Zhao, Y. Assessing the potential impacts of urban expansion on regional carbon storage by linking the LUSD-urban and InVEST models. Environ. Model. Softw. 2016, 75, 44–58. [Google Scholar] [CrossRef]
- Li, Q.; Wen, B.; Wang, G.; Cheng, J.; Zhong, W.; Dai, T.; Liang, L.; Han, Z. Study on calculation of carbon emission factors and embodied carbon emissions of iron-containing commodities in international trade of China. J. Clean. Prod. 2018, 191, 119–126. [Google Scholar] [CrossRef]
- Li, Y.; Sun, Y. Modeling and predicting city-level CO2 emissions using open access data and machine learning. Environ. Sci. Pollut. Res. 2021, 28, 19260–19271. [Google Scholar] [CrossRef]
- Jing, H.; Wang, Y. Research on Urban Air Quality Prediction Based on Ensemble Learning of XGBoost. E3S Web Conf. 2020, 165, 2014. [Google Scholar] [CrossRef]
- Xu, G.; Schwarz, P.; Yang, H. Determining China’s CO2 emissions peak with a dynamic nonlinear artificial neural network approach and scenario analysis. Energy Policy 2019, 128, 752–762. [Google Scholar] [CrossRef]
- Chen, Y.; Lee, C. Does technological innovation reduce CO2 emissions? Cross-country evidence. J. Clean. Prod. 2020, 263, 121550. [Google Scholar] [CrossRef]


Publisher’s Note: MDPI stays neutral with regard to jurisdictional claims in published maps and institutional affiliations. |
© 2022 by the authors. Licensee MDPI, Basel, Switzerland. This article is an open access article distributed under the terms and conditions of the Creative Commons Attribution (CC BY) license (https://creativecommons.org/licenses/by/4.0/).