Article

Construction and Application of Hydrometeorological Comprehensive Drought Index in Weihe River

1
College of Water Resources and Hydropower, Hebei University of Engineering, Handan 056000, China
2
Hanjiang to Weihe River Valley Water Diversion Project Construction Co., Ltd., Xi’an 710024, China
*
Authors to whom correspondence should be addressed.
Atmosphere 2022, 13(4), 610; https://doi.org/10.3390/atmos13040610
Submission received: 16 March 2022 / Revised: 31 March 2022 / Accepted: 1 April 2022 / Published: 10 April 2022
(This article belongs to the Special Issue Assessing Hydrological and Environmental Impacts of Climate Change)

Abstract

:
In response to the national strategy of ecological protection in the Yellow River Basin, a more comprehensive assessment of the basin drought is made. Based on the meteorological data of 20 meteorological stations and the hydrological data of 5 hydrological stations in Weihe River from 1960 to 2010, the base flow data are obtained by digital filtering method. A new comprehensive drought index (CPBI) about base flow and precipitation is constructed based on Copula function, and the applicability of CPBI is discussed, the drought characteristics of Weihe River Basin are analyzed by using this index. The results show that CPBI can capture both meteorological and hydrological drought events and comprehensively characterize their drought characteristics; CPBI has a downward trend at all scales, and the drought situation is becoming more and more serious. After the identification of run length theory, CPBI can more accurately reflect the severe drought situation of five hydrological stations in Weihe River, and can better provide drought early warning. There is variation in CPBI. The variation on the annual scale is generally concentrated in the 1970s and 1990s, and there is a large gap in the variation on the seasonal scale. CPBI is an effective drought monitoring index in Weihe River, which can provide reference for drought early warning and response of Weihe River.

1. Introduction

Global climate change is likely increasing the severity and frequency of droughts [1]. Water resources shortage is a common problem in China. As a typical extreme event, drought is a poorly understood and complex progressive natural hazard that causes substantial damage to the environment, society and economy including agricultural output around the world [2]. Especially in areas seriously affected by drought, it is increasingly important to ensure that a certain flow can be maintained in rivers, that is, to ensure the long-term existence of base flow [3]. Baseflow is a very important component of streamflow generated from groundwater inflow or discharge [4]. Therefore, it is still necessary to take the base flow as the factor to evaluate and monitor the drought risk in the areas seriously affected by drought.
There are few studies on base flow drought. Hellwig, J et al. [5] performed groundwater model experiments using three different generic stress tests to estimate the groundwater and baseflow drought sensitivity to changes in recharge; Zhou You and others [6] calculated the base flow of Baoji section of Weihe River under extreme drought conditions, and showed that the base flow is of great significance to seasonal rivers under extreme drought conditions. For the research of drought, many scholars at home and abroad have established many drought indexes to assess the severity of drought, but the factors affecting drought are extremely complex. In order to make a more accurate prediction of drought, we need to establish a drought index combined with a variety of drought influencing factors to make a comprehensive assessment of drought. In recent years, many scholars have established a variety of comprehensive meteorological, hydrological and agricultural drought indexes [7,8,9] through different methods. Standardized Precipitation Index (SPI) has been extensively used to monitor meteorological droughts [10,11,12] (Faiz et al., 2021; Liu et al., 2021; Kalisa et al., 2020). Shukla et al. [13] used the surface runoff R simulated by the VIC model as an input to calculate Standardized Runoff Index (SRI) for characterizing hydrological drought in the U.S. region and validated it against SPI. In the construction of comprehensive meteorological and hydrological index, for example, Zhang Ying et al. [14] established a new meteorological and hydrological drought index (MSDIp) based on runoff and precipitation, and judged the drought situation in the Weihe River; Su Xiaoling et al. [15] developed the meteorological and hydrological comprehensive drought index (MHDI) combining SPEI and SDI based on Gumbel Copula function; Azhdari [16] considered canonical correlation analysis (CCA), principal component analysis (PCA), and copula-based method to construct three composite hydro-meteorological indices, namely, JDHMI-CCA, JDHMI-PCA, and JDHMI-Copula. The above comprehensive meteorological and hydrological drought indexes are on the basis of runoff and precipation, and the base flow is a very important part of runoff and one of the important hydrological characteristics. In arid regions, the recharge of precipitation to runoff is basically terminated, and the base flow supplemented by groundwater becomes the main source of runoff in dry season. Therefore, this paper uses the base flow and precipitation to construct the drought index. In recent decades, drought has become one of the most serious disasters in the Weihe River Basin, which has brought irreversible harm to the local residents, livestock, economy and culture. More accurate prediction and prevention of drought is an urgent task for all departments, and the establishment of more appropriate and accurate drought index is the basis for predicting drought. The comprehensive drought index established in this paper aims to play a positive role in the prediction of drought in Weihe River Basin, and try to help government departments make an accurate prediction of drought events.

2. Materials and Methods

2.1. Study Area

Weihe River (Figure 1) is the largest tributary of the Yellow River. It originates in Gansu Province, flows through the three provinces of Gansu, Ningxia and Shaanxi, and flows into the Yellow River in Tongguan County, Shaanxi Province. Weihe River Basin (103°50′–110°50′ E, 33°50′–37°50′ N) belongs to temperate continental monsoon climate. The flood season is concentrated in summer, the annual average temperature is 7.8~13.5 ℃, and the annual precipitation is about 500~800 mm. In recent years, due to the impact of global warming, the precipitation of Weihe River has decreased significantly.
The Wei River is defined as upstream above Linjiacun station, midstream from Linjiacun station to Xianyang station, and downstream below Xianyang station [17]. In this paper, the Weihe River basin stations (Figure 1) Linjiacun (107°05′ E, 34°38′ N), Xianyang (108°70′ E, 34°32′ N), Lintong (109°20′ E, 34°43′ N), Huaxian (109°46′ E, 34°35′ N) and Zhangjiashan (108°59′ E, 34°64′ N) are used to study the drought in the Weihe River Basin.

2.2. Data Sources

The precipitation data used in this paper are the monthly precipitation data of 20 national meteorological stations (Table 1) in the Weihe River basin, including Yan’an, Huashan and Zhen’an et al., from 1960 to 2010, provided by the China Meteorological Data Network (http://data.cma.cn (accessed on 26 December 2021)).The surface precipitation is calculated using the mean value method. The mean method [18] is the simplest method of surface averaging rainfall, which is a simple average of rainfall records of all stations. When the watershed area is small, the precipitation distribution in the area is more uniform, and the arrangement of measuring stations is reasonable, this method can become more satisfactory results. The runoff data were obtained by using the measured daily runoff volumes from 1960–2010 at Linjiacun, Xianyang, Lintong, Huaxian and Zhangjiashan stations (Table 2) in the Hydrologic Data Year Book (Yellow River Basin Hydrological Information), and the monthly runoff depths were calculated by cumulative daily base flow ( i = 1 n a i = a 1 + a 2 + a n   n = 28 , 29 , 30 , 31 .

2.3. Research Method

In this paper, precipitation and runoff data from 1960 to 2010 at Linjiacun, Xianyang, Lintong, Huaxian and Zhangjiashan stations of the Weihe River were selected. Firstly, the required baseflow data were segmented using the digital filtering method, and then the appropriate marginal distribution function and Copula function were selected by the goodness-of-fit test. Then, the Comprehensive Precipitation Baseflow Index (CPBI) was constructed by normalizing joint distribution probability and the drought evaluation model of SPI [19], and its drought class classification rules were determined. The drought situation of the Weihe River was analyzed by the Kendall trend test, the ordered clustering method and the run length theory.

2.3.1. Digital Filtering Method (F3)

The digital filter method is a baseflow segmentation method first proposed by Nathan and Mcmahon [20] in 1990. The principle is to treat runoff as a high-frequency signal and baseflow as a low-frequency signal, and to separate the high-frequency signal from the low-frequency signal by means of a digital filter, so as to segment the baseflow from the daily runoff. This paper uses the F3 method [21] of digital filtering to split baseflow at the Huaxian station in the Weihe River basin. This method is an improvement of the F1 method proposed by Nathanand Mcmahon [20] in 1999 by Champan in 1991, the method takes a weighted average of the surface runoff at the same moment and the baseflow at the previous moment, and is calculated as:
Q b t = f 1 2 f 1 Q b ( t 1 ) + 1 f 1 2 f 1 Q t
where: f1 is the recession coefficient, taken as 0.95; Qbt is the surface runoff at time t; Qb(t−1) is the surface runoff at time t − 1; Qt is the runoff at time t; Q(t–1) is the runoff at time t − 1; Qbt is the final separated base flow.

2.3.2. Copula Function

Copula is a multi-dimensional joint distribution function with uniform distribution defined as [0, 1]. It can connect the marginal distributions of multiple random variables to obtain their joint distribution [22].
Sklar theorem [23]: if H is an n-dimensional distribution function, and its margin distribution is F 1 , F 2 , , F n , then there exists an n-Copula function C, such that for any x R n , there exists a C:
H x 1 , x 2 , , x n = C F 1 x 1 , F 2 x 2 , , F n x n
If F 1 , F 2 , , F n is continuous, then C is unique. Conversely, if C is an n-Copula, and F 1 , F 2 , , F n is a distribution function, then the function H defined in the above formula is an n-dimensional distribution function, and its margin distribution is F 1 , F 2 , , F n [23].
According to the root mean square error Criterion (RMSE), Akaike Information Criterion (AIC) and Bayesian Information Criterion (BIC), the Copula function with the smallest value is selected as the application function, and the calculation formula is as follows [24]:
M S E = 1 n 1 i = 1 n P e i P i 2
R M S E = M S E
A I C = n ln M S E + 2 l
B I C = n ln M S E + ln n l
where l is consistent with the number of parameters of Copula function; P e i and P i is the empirical frequency and the theoretical frequency of the joint distribution; n is the length of the sequence [24].

2.3.3. Kendall Trend Test Method

Given a time series X t = x 1 , x 2 , x n , M-K trend test values [25] are calculated as follows:
s g n θ = 1 , θ > 0 0 , θ = 0 1 , θ < 0
S = i = 1 n 1 k = i + 1 n s g n X k X i
V = n n 1 2 n + 5 / 18
U = S 1 V , S > 0 0 , S = 0 S + 1 V , S < 0
where s g n is the test function, V is the calculated variance, and U is statistic parameter.

3. Construction of the Composite Drought Index CPBI

The correlation between rainfall and baseflow in the Weihe River basin was determined using Pearson’s correlation coefficient. It was found that the correlation coefficient between the corresponding monthly data was 0.49, which was weakly correlated. The correlation coefficient between the annual data was 0.86, which was strongly correlated. Both data series passed the confidence interval test of 0.05 and were positively correlated, so the Copula function could be used for the joint distribution function The Copula function can be used to construct the joint distribution function.
Applying the monthly precipitation and baseflow data of Huaxian station in the Weihe River basin from 1960 to 2010, the parameter estimation of the two variables was first carried out using the great likelihood method to obtain the best marginal distribution of each variable. Three Copula functions were used to fit the joint distribution of the two variables. The joint distribution function with the best fit was obtained by the goodness-of-fit test [26].

3.1. Determination of the Best Margin Distribution Function

The parameters of precipitation and base flow obtained by maximum-likelihood method are shown in Table 3.
The margin distribution fitting excellence test was carried out by Akaike Information Criterion and Root Mean Square Error criterion [27], and the test results are shown in Table 4.
The marginal distribution functions for precipitation and baseflow corresponding to the smallest RMSE and AIC are the generalized Pareto and lognormal distributions.

3.2. Determination of Copula Function

The Akaike information criterion (AIC) and the Bayesian Information Criterions (BIC) were used to test the fitting excellence of the Copula function, and selected the optimal Copula function [26]. The results are shown in Table 5.
Based on the information minimization criterion, it can be seen that the joint precipitation-basis flow distribution uses the Frank Copula function.
In water science research, the Frank Copula function belongs to the Archimedean Copula (Archimedean family) of Copula functions with the following expressions:
C ( u , v , θ ) = 1 θ ln [ 1 1 e θ u 1 e θ v 1 e θ ]
where u, v are the marginal distributions, respectively; θ is the parameter to be estimated.

3.3. Establishment of the Comprehensive Drought Index CPBI

With the precipitation Q and base flow depth B as random variables, q and b as a value of precipitation and base flow, assuming that F(q) and G(b) are edge distributions of two random variables, their combined distribution H can be expressed as:
H q Q , b B = C F q , G b = p
The expression of CPBI is:
C P B I = φ 1 p
where φ is the standard normal distribution function and p is the cumulative joint probability.
CPBI can reflect the characteristics of meteorological and hydrological drought simultaneously by combining precipitation (meteorology) and base flow (hydrology). Based on the severity of drought and referring to the SPI drought classification method, the CPBI drought grade is determined as Table 6 shows:

4. Results and Analysis

SPI can be used to characterize the probability of occurrence of precipitation at a certain time. SPI has multiple scales, is simple to calculate, and is suitable for drought monitoring and assessment in various regions, and SRI is similar to SPI [13]. Based on the studies of Lai-Li [28] on the sensitivity of agricultural drought to meteorological drought response, the monthly-scale SPI and SRI were selected for comparison with CPBI in this study. The superiority of CPBI is verified by comparing SPI, SRI and CPBI, and the comprehensive drought characteristics of meteorological and hydrological in the WeiHe River are analyzed.

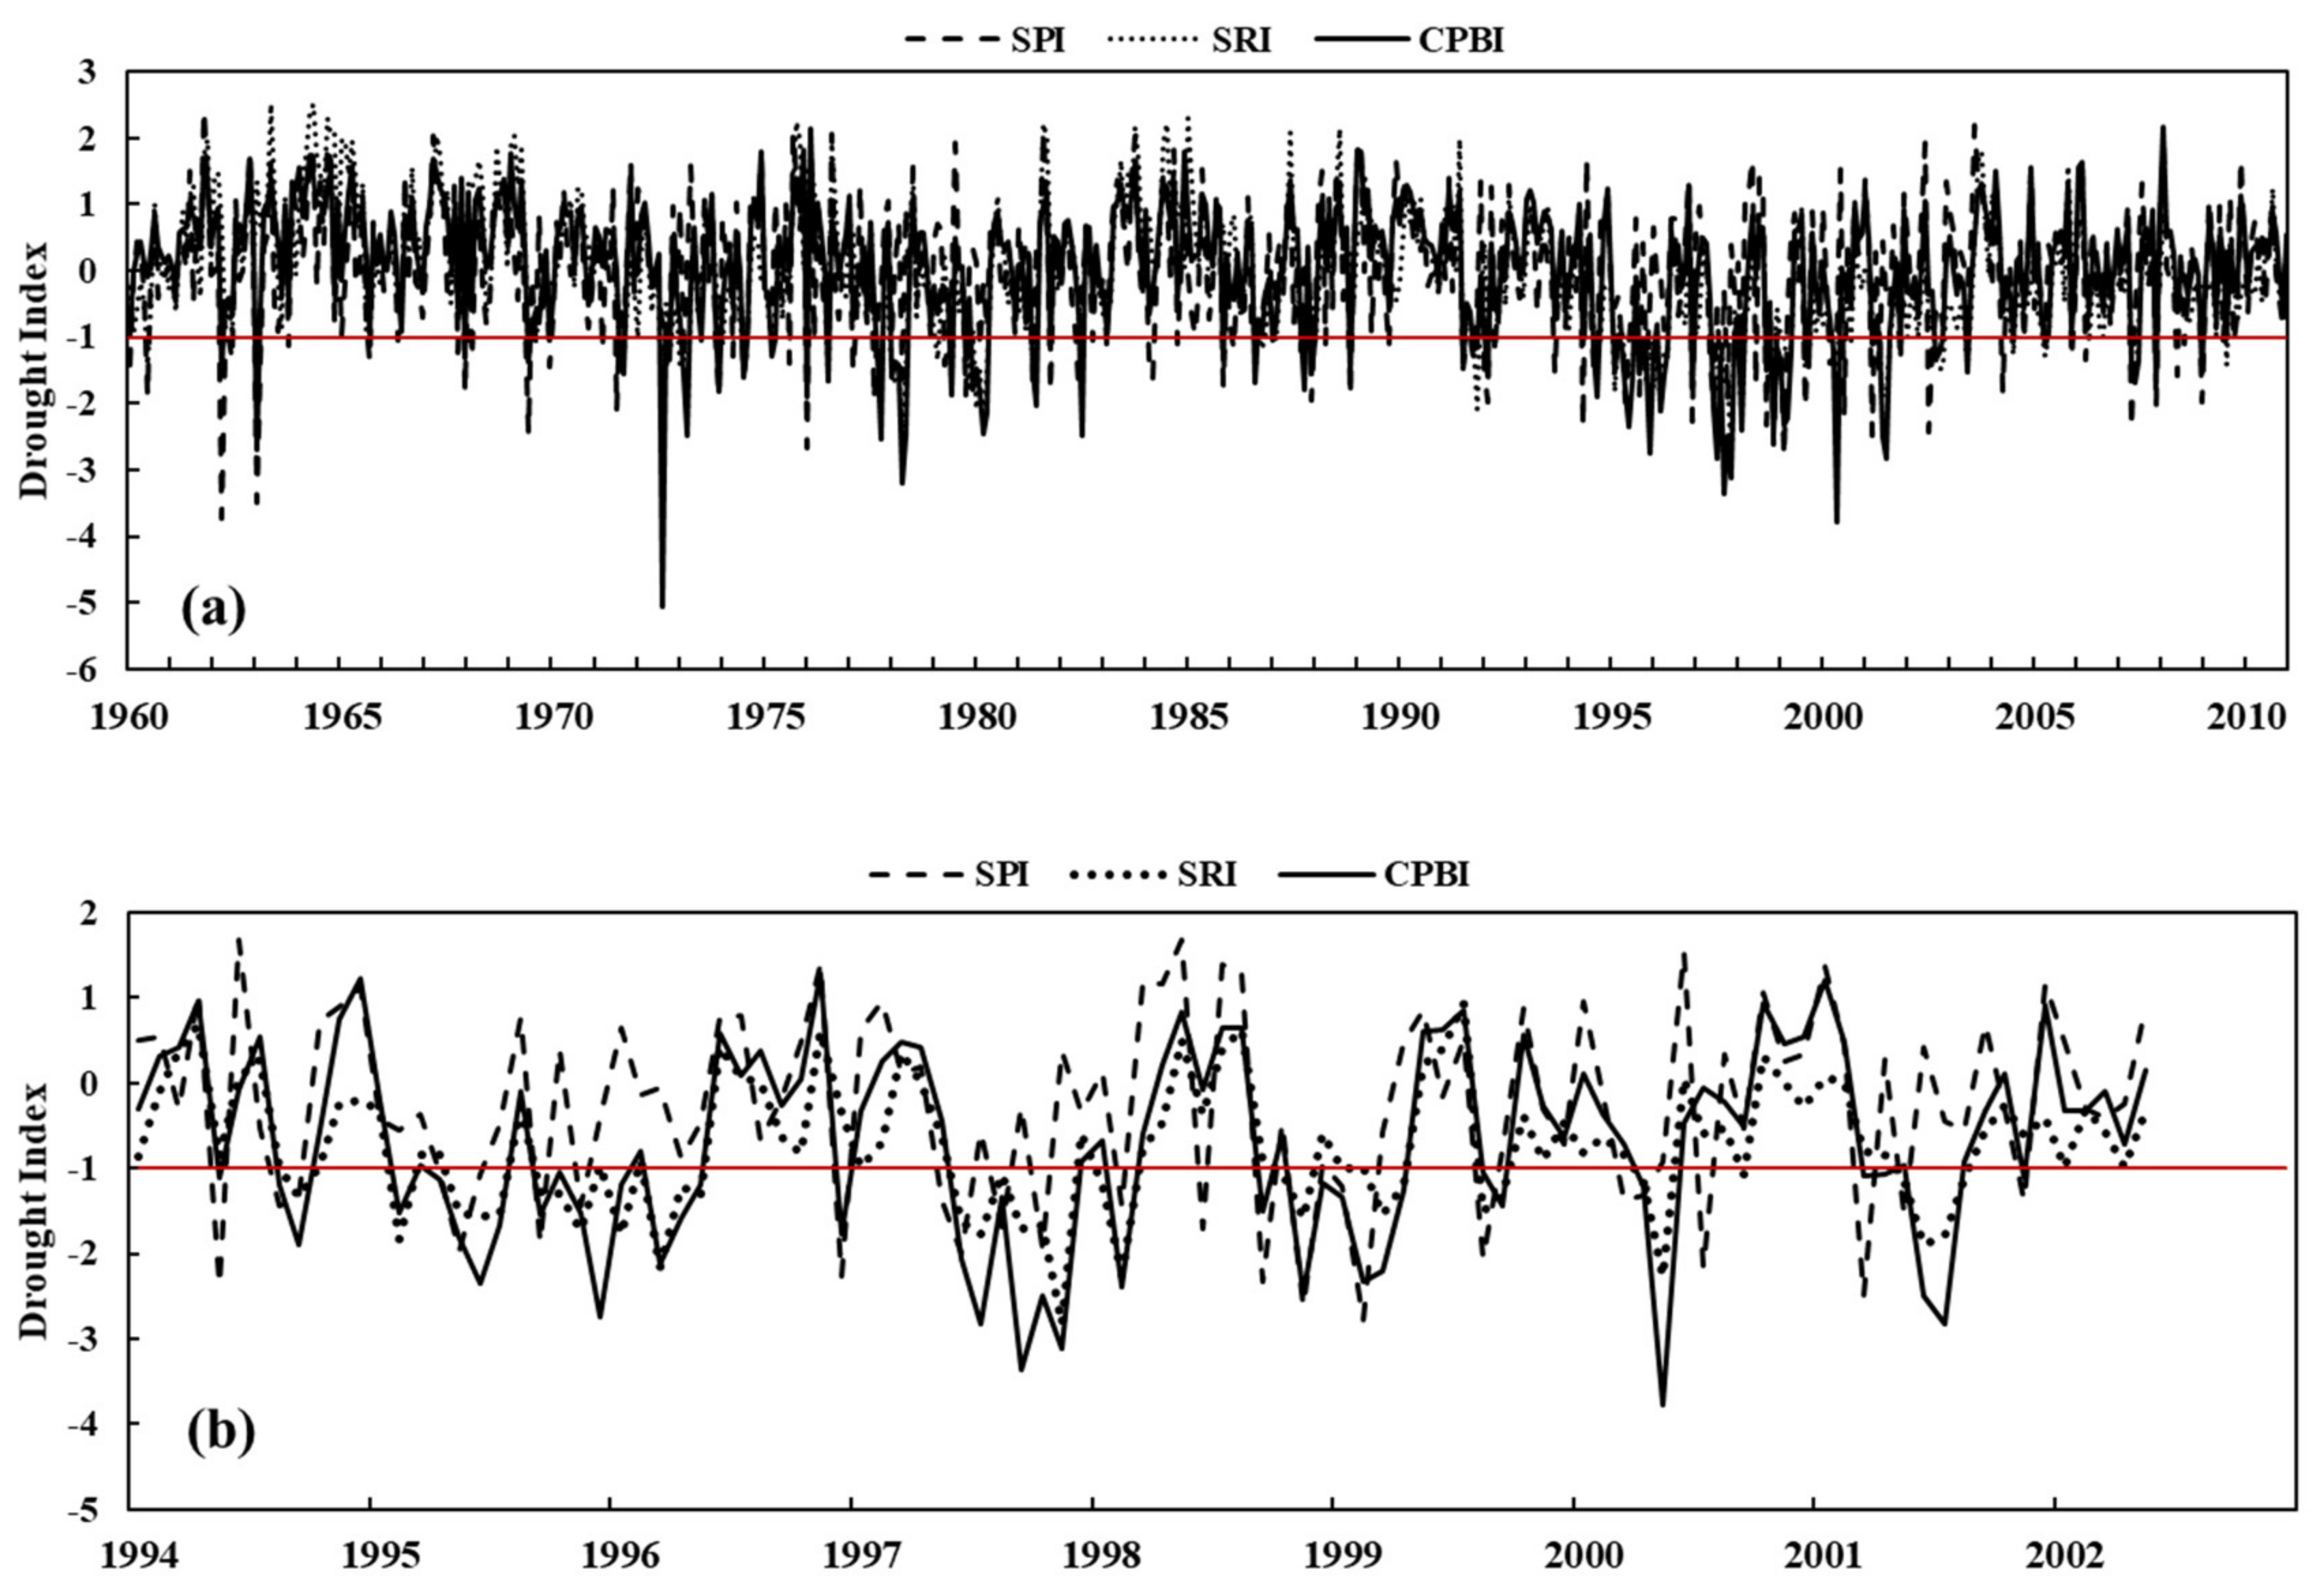
4.1. Applicability of CPBI

Figure 2 shows the changes of the three indexes at the monthly scale at Huaxian station. It can be seen from the Figure 2 that the change curve of CPBI under the monthly scale has a high similarity with SPI and SRI, showing a good consistency. The Pearson correlation coefficients of CPBI, SPI and SRI are all above 0.65, showing a strong correlation.
By amplifying the 1994–2001 change curve, the similarities and differences between the three curves can be seen more intuitively. The change rule and trend of CPBI are similar to SPI and SRI. But CPBI integrates the characteristics of SPI and SRI index, which can capture the effects of meteorological factors on drought such as the SPI index determined by precipitation,. It can identify the hydrological elements such as the SRI index determined by runoff. Figure 2b shows that the SPI index was greater than the threshold of drought occurrence by 0.1 in 1996, late 1997 and mid-2001, but the SRI index is smaller than the threshold of drought occurrence. This indicated that the hydrological drought occurred during these two periods but the meteorological drought did not occur, while CPBI could effectively identify the occurrence of drought. It also can be found that SPI can predict the occurrence of drought earlier than SRI and SRI can predict the end of drought later than SPI, but CPBI can catch the occurrence of drought before SRI and catch the end of drought after SPI. The above shows that CPBI has the advantages of SPI and SRI, and can effectively capture the occurrence of drought. So CPBI is more suitable for this study than SRI and SPI.
As can be seen from Figure 2a, the CPBI change curve shows that droughts occurred more frequently and severely in the 1970s, late 1980s, 1990s and early 2000s. According to the Table 7, it shows that CPBI has a large Pearson correlation coefficient with SPI and SRI, which indicates that CPBI has some accuracy. In addition, this conclusion can be demonstrated from other literature: at first, according to the Chinese Meteorological Disasters Ceremony (Shaanxi Volume) [29]: in the 1970s, the Weinan area where Huaxian Station is located was one of the most severe drought areas in 1970. In 1971, the Weinan area suffered severe drought due to high temperature, and 40% of the farmland has been damaged. In 1973, 403,000 hectares of Weinan were affected and 232,000 hectares were affected by drought in summer and autumn. From the winter of 1976 to the spring of 1978, there was a serious continuous drought throughout the year. In the 1990s, from 1995 to 2000, nearly 2 billion tons of artificial rainfall has been implemented for many years to alleviate the impact of drought. Among them, the drought lasted more than 200 days in 1995; in 1997, Huaxian station cut off for three consecutive days in flood season for the first time; in 1998, the flow of Weihe River was close to the driest flow in the same period in history, and many small and medium-sized rivers dried up. Next, some scholars’ papers can also demonstrate the correctness of the research results of this paper: (a) Zhao et al. [30] selected three stations of Weihe River to calculate SPI and SRI, and obtained the following conclusions as the majority drought occurred in Huaxian Station from 1977 to 1980, and in 1996, 1998, and 2001–2003, especially in 1997, moreover, Huaxian station has the most obvious downward trend. (b) Chang et al. [31] used the precipitation data (1960–2010) of 21 meteorological stations to calculate the SPI. The results show that 1999–2000 is a dry period. (c) Using the SRI calculated based on the time-varying parameter scheme, Ren et al. [32] found that there were frequent droughts in the 1970s and 1990s, and identified drought years such as 1971–1972, 1982, 1986, 1994–1995, 1997, 1999, 2002 and 2011. (d) Xing [33] obtained that the maximum water shortage of Huaxian station from 1976 to 1980 was 5.3 billion/year, which was equivalent to the self-produced runoff of Weihe River Basin in Shaanxi Province by using the negative wheel theory. The above literature results can verify the accuracy of the results of this study.
In summary, the comprehensive drought index CPBI obtained by the Frank Copula function jointly has certain validity, superiority and accuracy, and the CPBI index can provide some theoretical support for the prediction of drought conditions in the lower Weihe River.

4.2. Drought Characterisation

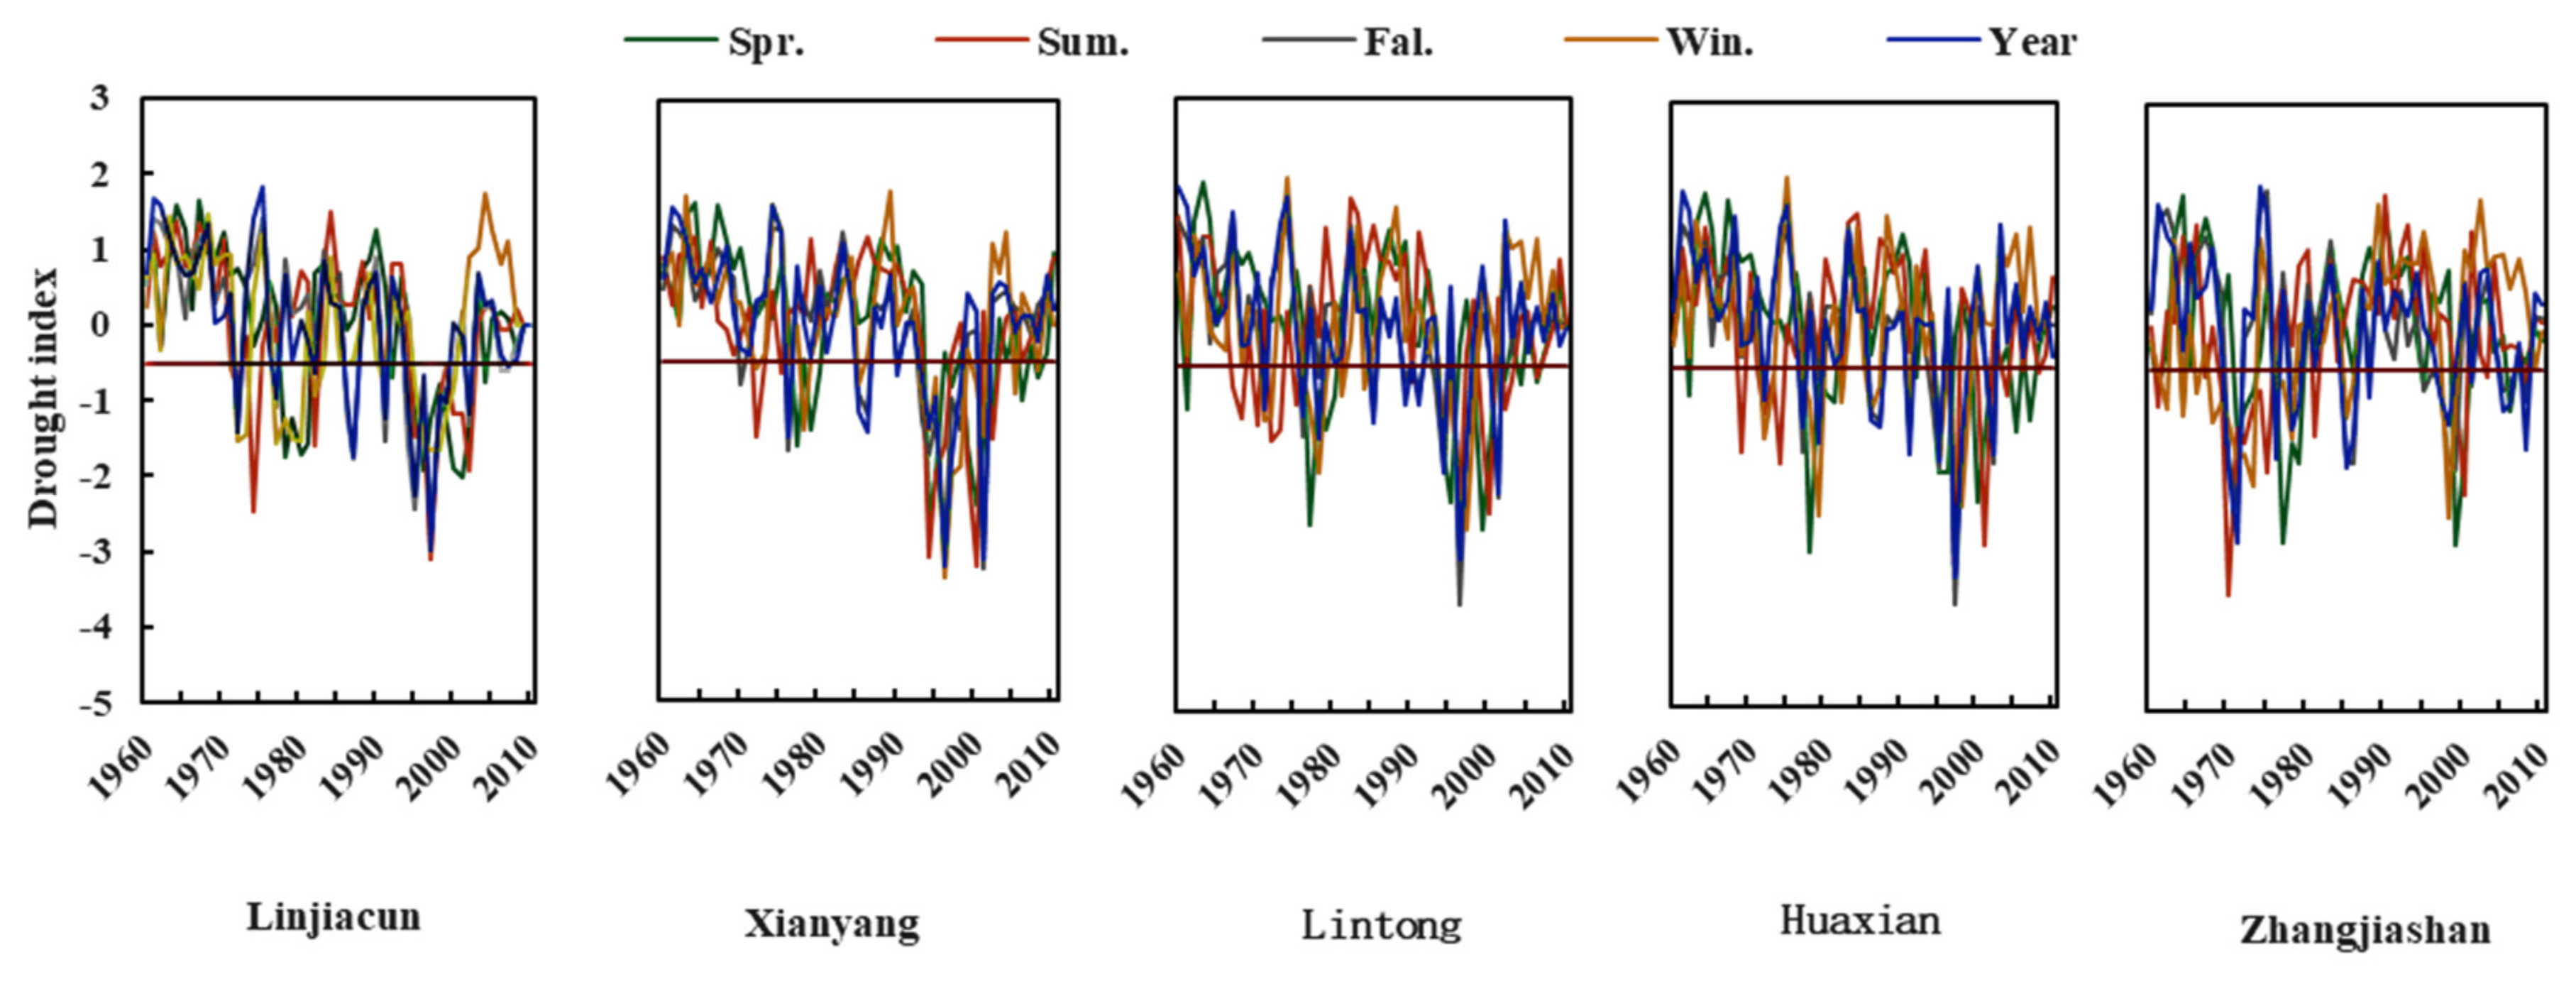
4.2.1. Annual and Seasonal Variation of CPBI

Figure 3 shows the annual and quarterly drought indexes of the five hydrological stations on the Wei River from 1960 to 2010. On an annual scale, the drought indexes of the stations fluctuate between −4 and 2, with the lowest being −3.30 at the Huaxian station, and the more severe droughts are concentrated in the late 1990s. On a seasonal scale, the more severe spring droughts at Linjiacun and Xianyang stations in the middle and upper reaches were in the late 1990s and early 2000s, respectively, while those at Lintong, Huaxian and Zhangjiashan stations in the lower reaches were in the late 1970s and late 1990s. In the late 1990s and early 2000s, both meteorological and hydrological droughts occurred. In summer, except for the extreme drought at Zhangjiashan Station in the early 1970s, the severe droughts at all stations occurred between the 1990s and the 2000s, with no meteorological drought occurring in the early 2000s. In autumn, droughts occurred under the same conditions as summer droughts. The comparatively severe winter droughts occurred in the late 1990s at all stations, but the hydrology did not fluctuate significantly and no severe droughts occurred, probably due to baseflow supplementing runoff, and the main cause of drought was precipitation. The three main periods of drought from 1960 to 2010 are the 1970s, 1990s and 2000s, with the comparatively severe droughts occurring around the 1970s mainly caused by spring, the late 1990s were in severe drought conditions in almost all seasons, and the early 2000s were in severe drought except for winter.
In the past 51 years, the proportion of droughts occurring in all seasons at the five hydrological stations on the Wei River was less than 50% (Table 8), with mild and moderate droughts dominating in all seasons and light droughts occurring most frequently. The percentage of droughts that occurred in moderate, severe, extreme droughts, Linjiacun station had the highest percentage in spring and autumn (22.45%), Xianyang station had the highest percentage in spring (17.65%), Lintong station had the highest percentage in summer (20.00%), Huaxian station had the highest percentage in autumn (15.68%) and Zhangjiashan station had the highest percentage in winter (20.00%). Extreme droughts mainly occurred in spring at the middle and upper reaches of the station, and in spring and winter at the downstream and tributary stations, mainly because winter is a period of high incidence of extreme droughts and precipitation is low in winter compared with other four seasons.

4.2.2. CPBI Sequence Trends and Mutation Site Identification

The trend test of the CPBI series at annual and seasonal scales for the five hydrological stations in the Weihe River (Table 9), the Kendall rank order correlation test values at significance level α = 0.05, passed the significance test if the test value |U| ≥ 1.96, showed an increasing trend if U > 0 and a decreasing trend if U < 0.
Kendall trend test is used to analyze the trend of the CPBI series in the Weihe River basin, which shows a decreasing trend in CPBI at the middle and upper reaches, except for Linjiacun station, which shows a non-significant decreasing trend in winter. The stations in the lower reaches are all on a downward trend. The mutation points of the CPBI series are identified using the sequential clustering method (Table 10), and the 51-year annual mutation points of the middle and upper reaches of the Weihe River basin occurred in the late 1990s, while the mutations of the two downstream stations occurred in the 1970s, except for the Lintong station in the 1990s. According to relevant literature, the mutations in precipitation and runoff both occurred around 1976 [34], and as the main influencing factors of CPBI, the mutations in precipitation and runoff have a great influence on the mutations in CPBI. From the scale of four seasons, the mutations in spring at Linjiacun and Xianyang stations in the middle and upper reaches are slightly earlier than the other seasons, while the mutations at Lintong and Huaxian stations in the lower reaches are scattered in all seasons except spring, and the mutations occured in different years. In 1986, a major drought affected an area of 1.484 million hm2 with a direct economic loss of 946 million yuan, and from 1994 to 1995, three consecutive droughts in winter, spring, and summer caused an economic loss of 6.675 billion yuan [7].

5. Conclusions and Discussion

5.1. Conclusions

In this paper, based on the hydro-meteorological data of five stations in the Weihe River from 1960 to 2010, the Copula joint distribution function was applied to construct a comprehensive drought index CPBI. A single index was selected to compare with it to verify the reliability of CPBI, based on which the drought characteristics of the Weihe River were analyzed, with the following main conclusions.
(1)
The new integrated drought index CPBI constructed by combining precipitation and baseflow can characterize both meteorological drought and hydrological drought. The correlation coefficients between CPBI and SPI and SRI are larger, and the CPBI shows stronger drought severity over a longer period of time after analyzed by run length theory, which can be better used for drought monitoring and early warning under the Weihe River.
(2)
The severe drought events that occurred from 1960–2010 were mainly caused by the spring drought around 1978, the drought in 1997, and the winter drought around 2000. Due to seasonal reasons, severe drought and above at the middle and upper reaches sites mainly occurred in spring, downstream sites occur mainly in the summer and fall, and at the tributary sites mainly in winter.
(3)
The CPBI of the Weihe River has variability during 1960–2010, with annual variability concentrated in the 1970s and 1990s and a large difference in variability between the four seasons. During 1960–2010, except for the tributary sites, the annual and four-season CPBI of the upper and middle and lower reaches showed a decreasing trend, and the decreasing trend was more obvious in the middle and upper reaches than in the lower reaches. This indicates that the drought trend of the Weihe River is still developing in a serious direction and that the prevention of extreme drought events should be strengthened.
This paper analyzes the drought characteristics of the Weihe River more accurately and constructs a comprehensive drought index that is of practical value in drought monitoring of the Weihe River. It also provides a way to evaluate drought in other watersheds, which helps guide disaster prevention and mitigation in the study area and provides a more reliable basis for decision making for the relevant departments to achieve the purpose of drought prevention and control and helps promote the sustainable development of the region.

5.2. Discussion

The CPBI constructed in this paper was formed based on meteorological and hydrological data without considering agricultural and socio-economic droughts The baseflow data used in this paper were segmented based on the digital filtering method without verifying the validity of the baseflows segmented by other methods. The applicability of the constructed index in the Weihe River Huaxian Station was verified in this paper, and the applicability can be further verified in other basins.

Author Contributions

J.F.: Investigation, formal analysis, writing—original draft. F.X.: Conceptualization, methodology. X.S.: investigation, formal analysis. W.D., X.M., G.L. and Y.C.: validation. H.W.: methodology, supervision. All authors have read and agreed to the published version of the manuscript.

Funding

This research was funded by [State Key Laboratory of Ecological Water Resources in the Northwest Arid Zone] grant number (2019KFKT-4), [Hebei Provincial Natural Science Foundation Project] grant number (E2019402432), [National Natural Science Foundation of China] grant number (52009053) and [National Natural Science Foundation of China] grant number (U1802241).

Institutional Review Board Statement

Not applicable.

Informed Consent Statement

Not applicable.

Data Availability Statement

The datasets analyzed during the current study are available from the corresponding author on reasonable request.

Acknowledgments

This work was financially supported by the Basic Research Program of Natural Science in Shaanxi province (No. 2019JLM-60).

Conflicts of Interest

The authors declare that they have no known competing financial interest or personal relationships that could have appeared to influence the work reported in this paper.

References

  1. Wilhite, D.A.; Sivakumar, M.V.; Pulwarty, R. Managing drought risk in a changing climate: The role of national drought policy. Weather Clim. Extrem. 2014, 3, 4–13. [Google Scholar] [CrossRef] [Green Version]
  2. Elhag, K.; Zhang, W. Monitoring and assessment of drought focused on its impact on sorghum yield over Sudan by using meteorological drought indices for the period 2001–2011. Remote Sens. 2018, 10, 1231. [Google Scholar] [CrossRef] [Green Version]
  3. Yan, D.H.; Wang, H.; Wang, F.; Tang, Y. Research system and key research topics of ecological water demand in China. J. Hydraul. Eng. 2007, 38, 267–273. (In Chinese) [Google Scholar]
  4. Zhang, Y.Q.; Laurent, A.; Bernard, E.; Junmin, L. Regression Modeling of Baseflow and Baseflow Index for Michigan USA. Water 2013, 5, 1797–1815. (In Chinese) [Google Scholar] [CrossRef] [Green Version]
  5. Hellwig, J.; Stoelzle, M.; Stahl, K. Groundwater and baseflow drought responses to synthetic recharge stress tests. Hydrol. Earth Syst. Sci. 2021, 25, 1063–1068. [Google Scholar] [CrossRef]
  6. Zhou, Y.; Zhou, Q.; Li, M. Study on river ecological base flow under extreme drought conditions. Water Sav. Irrig. 2017, 42, 77–79. (In Chinese) [Google Scholar]
  7. Yuan, M.; Chang, J.X.; Li, Y.Y. Temporal and spatial analysis of drought in Weihe River Basin Based on comprehensive drought index. Eng. J. Wuhan Univ. 2018, 51, 401–408. (In Chinese) [Google Scholar]
  8. Hao, Z.C.; Aghakouchak, A. Multivariate Standardized Drought Index: A parametric multi-index model. Adv. Water Resour. 2013, 57, 12–18. [Google Scholar] [CrossRef] [Green Version]
  9. Guo, S.M.; Su, X.L.; Wu, H.J.; Jiang, T.L.; Liang, Z.; Feng, K. Construction and application of comprehensive drought index based on nuclear entropy component analysis—Taking the middle and upper reaches of Heihe River Basin as an example. Agric. Resour. Arid Areas 2021, 39, 48–157. (In Chinese) [Google Scholar]
  10. Faiz, M.A.; Zhang, Y.Q.; Ma, N.; Baig, F.; Naz, F.; Niaz, Y. Drought indices: Aggregation is necessary or it is only the researcher’s choice. Water Supply 2021, 21, 3987–4002. [Google Scholar] [CrossRef]
  11. Liu, C.; Yang, C.; Yang, Q.; Wang, J. Spatiotemporal drought analysis by the standardized precipitation index (SPI) and standardized precipitation evapotranspiration index (SPEI) in Sichuan Province, China. Sci. Rep. 2021, 11, 1280. [Google Scholar] [CrossRef]
  12. Kalisa, W.; Zhang, J.; Igbawua, T.; Ujoh, F.; Ebohon, O.J.; Namugize, J.N.; Yao, F. Spatio-temporal analysis of drought and return periods over the East African region using Standardized Precipitation Index from 1920 to 2016. Agric. Water Manag. 2020, 237, 106195. [Google Scholar] [CrossRef]
  13. Shukla, S.; Wood, A.W. Use of a standardized runoff index for characterizing hydrologic drought. Geophys. Res. Lett. 2008, 35, L02405. [Google Scholar] [CrossRef] [Green Version]
  14. Zhang, Y.; Huang, S.Z.; Huang, Q.; Li, P.; Ma, L. Construction and application of a new comprehensive drought index based on Copula function. J. Hydraul. Eng. 2018, 49, 703–714. [Google Scholar]
  15. Su, X.L.; Liang, Z. Comprehensive meteorological and hydrological drought index and temporal and spatial characteristics of drought in Guanzhong Area. Water. Resour. Prot. 2019, 35, 17–23. [Google Scholar]
  16. Azhdari, Z.; Bazrafshan, O.; Zamani, H.; Shekari, M.; Singh, V.P. Hydro-meteorological drought risk assessment using linear and nonlinear multivariate methods. Phys. Chem. Earth 2021, 123, 103046. [Google Scholar] [CrossRef]
  17. Zhang, H.N.; Ren, Y.X.; Zhang, X.D.; Zhou, Q. Differences in extreme temperatures between the upper and middle reaches of the Weihe River basin from 1981 to 2016. Acta Agric. Jiangxi 2020, 32, 113–118. [Google Scholar]
  18. Cheng, X.H. Exploration of Surface Rainfall Calculation Method and Its Impact on Hydrological Simulation. Master’s Thesis, Hohai University, Nanjing, China, 2005. [Google Scholar]
  19. Mckee, T.B.; Doesken, N.J.; Kleist, J. The relationship of drought frequency and duration to time scales. Bull. Am. Meteorol. Soc. 1993, 17, 79–183. [Google Scholar]
  20. Nathan, R.J.; Mcmanon, T.A. Evaluation of automated techniques for baseflow and recession analyses. Water Resour. Res. 1990, 26, 1465–1473. [Google Scholar] [CrossRef]
  21. Xu, L.L.; Liu, J.L.; Jin, C.J.; Wang, A.Z.; Guan, D.X.; Wu, J.B.; Yuan, F.H. Research progress of baseflow partitioning method for hydrological process. Chin. J. Appl. Ecol. 2011, 22, 3073–3080. [Google Scholar]
  22. Yu, Y.; Song, S.B.; Ma, M.W. Application of Archimedean copulas function in multivariate drought characteristic analysis. J. China Hydrol. 2011, 31, 6–10. [Google Scholar]
  23. Sklar, A. Fonctions de Repartition an Dimensions et Leurs Marges. Publ. Inst. Statist. Univ. Paris 1959, 8, 229–231. [Google Scholar]
  24. Zhang, X.M.; Su, X.L.; Zhang, G.X. Hydrological drought classification and characteristic analysis of Heihe River Basin Based on SRI and copula function. J. Irrig. Drain. 2019, 38, 107–113. [Google Scholar]
  25. Zhang, Y.H.; Song, X.F. Methods of hydro-meteorological series trend analysis and variance diagnosis and their comparison. Arid Land Geogr. 2015, 38, 652–665. [Google Scholar]
  26. Zhang, G.F.; Du, Z.P. Study on the dependence between pork price fluctuation and inflation. Commerical Resour. 2015, 58, 23–27. [Google Scholar]
  27. Favre, A.C. Multivariate hydrological frequency analysis using copulas. Water Resour. Res. 2004, 40, W01101. [Google Scholar] [CrossRef] [Green Version]
  28. Lai, L.; Su, X.L.; Feng, K. Response of agricultural drought to multi-scale meteorological drought in Gansu Province. Water Sav. Irrig. 2020, 45, 102–108. [Google Scholar]
  29. Zhai, Y.A. The Chinese Meteorological Disasters Dictionary (Shaanxi Volume), 1st ed.; Meteorological Publishing House: Beijing, China, 2005; pp. 1–4. [Google Scholar]
  30. Zhao, P.P.; Lü, H.S.; Wang, W.C.; Fu, G.B. From meteorological droughts to hydrological droughts: A case study of the Weihe River Basin, China. Arab. J. Geosci. 2018, 36, 9–13. [Google Scholar] [CrossRef]
  31. Chang, J.X.; Li, Y.Y.; Ren, Y.; Wang, Y.M. Assessment of precipitation and drought variability in the Weihe River Basin, China. Arab. J. Geosci. 2016, 9, 14. [Google Scholar] [CrossRef]
  32. Ren, L.L.; Shen, H.R.; Yuan, F.; Zhao, C.X.; Yang, X.L.; Zheng, P.L. Analysis of hydrological and drought evolution characteristics of Weihe River Basin under changing environment. Prog. Water Sci. 2016, 27, 492–500. [Google Scholar]
  33. Xing, D.W. Hydrological drought analysis of Weihe River Basin in Shaanxi. J. Northwest Water Resour. Water Eng. 1996, 7, 1–9; 15. [Google Scholar]
  34. Zhang, S.W. Yellow River Annual Runoff Analysis and Its Forecast. Ph.D. Thesis, Sichuan University, Chengdu, China, 2005. [Google Scholar]
Figure 1. The location of the Weihe River basin.
Atmosphere 13 00610 g001
Figure 2. The drought index of SPI, SRI and CPBI in Huaxian station of Weihe River. (a) 1960−2010 in monthly; (b) 1994−2010 in monthly.
Atmosphere 13 00610 g002
Figure 3. Annual and seasonal scale drought index variation curves by site.
Atmosphere 13 00610 g003
Table 1. 20 National Meteorological Stations in the Wei River Basin.
Meteorological StationsLatitudeLongitudeMeteorological StationsLatitudeLongitude
Lintao35.35103.85Tongchuan35.08109.07
Huajialing35.38105.00Minxian34.43104.02
Wuqi36.92108.17Tianshui34.58105.75
Guyuan36.00106.27Baoji34.35107.13
Huanxian36.58107.30Wugong34.25108.22
Yan’an36.60109.50Xi’an34.30108.93
Xiji35.97105.72Huashan34.48110.08
Pingliang35.55106.67Foping33.52107.98
Xifeng Town35.73107.63Shangzhou33.43109.15
Changwu35.20107.80Zhenan33.87109.97
Table 2. 5 National Hydrological Stations in the Wei River Basin.
Hydrological StationsLatitudeLongitude
Linjiacun34.38107.05
Xianyang34.32108.70
Lintong34.43109.20
Huaxian34.35109.46
Zhangjiashan34.64108.59
Table 3. Estimation of precipitation and base flow distribution parameters.
GEVLog-NormalGDPNormalGamma
K s i g m a m u E y δ y s i g m a m u Means δ y αβ
LinjiacunPrecipitation0.7918.4914.802.951.74−0.0645.6442.9541.780.7457.83
Base flow1.460.550.33−0.501.980.620.992.012.750.533.82
XianyangPrecipitation0.5723.0820.183.181.52−0.1656.5748.3344.460.8457.38
Base flow0.681.261.270.611.130.162.773.293.871.003.30
LintongPrecipitation0.5323.5321.033.211.50−0.1857.7748.6344.290.8756.08
Base flow0.571.011.220.540.930.052.522.652.811.302.03
HuaxianPrecipitation0.5323.8321.263.211.50−0.1858.3349.1144.780.8656.86
Base flow0.560.971.060.381.060.102.182.422.721.132.15
ZhangjiashanPrecipitation0.8416.8613.052.742.280.1336.0841.3344.250.6266.25
Base flow0.590.490.49−0.411.170.161.011.201.430.981.23
where K is morphological parameters, s i g m a is scale parameter, m u is positional parameters, E y is mathematical expectation, δ y is mean square error, α is morphological parameters, β is scale parameter.
Table 4. Precipitation and base flow edge distribution model fitting excellence test results.
GEVLog-NormalGDPGammaNormal
LinjiacunPrecipitationRMSE0.05940.06320.07800.03560.0587
AIC5775.195798.276060.935563.215600.70
Base flowRMSE0.06720.06060.12540.03560.0587
AIC2021.121885.222862.081788.061900.07
XianyangPrecipitationRMSE0.05280.06210.04750.03320.0724
AIC6152.356143.495965.705962.056384.34
Base flowRMSE0.02060.01130.02140.03850.1189
AIC2677.152641.122669.652685.323394.93
LintongPrecipitationRMSE0.05060.06130.04400.03170.0717
AIC6032.776039.695854.295856.656254.62
Base flowRMSE0.01500.01170.04370.04590.1166
AIC2294.112272.832369.912347.822944.93
HuaxianPrecipitationRMSE0.05020.06170.04380.03140.0717
AIC6179.846180.295992.405994.166401.85
Base flowRMSE0.01470.00960.03020.03690.1171
AIC2285.092268.142302.822304.492965.57
ZhangjiashanPrecipitationRMSE0.05040.08410.04810.02640.0896
AIC5935.236096.155777.955673.356378.64
Base flowRMSE0.01600.02430.02130.03360.1231
AIC1466.011434.781438.611455.372174.20
Table 5. The fitting excellence test of the Copula function.
ClaytonFrankGumbel
LinjiacunAIC−95.3769−144.848−160.441
BIC−95.3695−144.841−160.434
XianyangAIC−60.7108−117.498−118.469
BIC−60.7036−117.491−118.461
LintongAIC−133.66−221.278−207.045
BIC−133.652−221.27−207.038
HuaxianAIC−61.2024−161.314−169.382
BIC−61.1952−161.307−169.375
ZhangjiashanAIC−86.108−183.307−169.611
BIC−86.101−183.300−169.604
Table 6. CPBI drought classification.
Value of CPBIDrought Grade
(−0.5, +∞]No drought
(−1, −0.5]Light drought
(−1.5, −1]Moderate drought
(−2, −1.5]Severe drought
(−∞, −2]Extreme drought
Table 7. Statistical tables of Pearson correlation coefficients for the three drought indices at Huaxian station.
Drought IndexCPBI—−SPICPBI−SRI
correlation coefficient0.6729590.75942
Table 8. Drought levels occurring in all seasons at the Weihe Huaxian station.
SitesDegree of DroughtSpr.Sum.Fal.Win.
Number of YearsPercentageNumber of YearsPercentageNumber of YearsPercentageNumber of YearsPercentage
LinjiacunNo3571.43%3673.47%3469.39%3266.67%
Mild36.12%510.20%48.16%612.50%
Moderate 510.20%48.16%612.24%36.25%
Severe510.20%24.08%36.12%714.58%
Extreme12.04%24.08%24.08%00.00%
XianyangNo3976.47%4384.31%3976.47%3672.00%
Mild35.88%11.96%47.84%816.00%
Moderate 35.88%11.96%47.84%36.00%
Severe35.88%47.84%23.92%12.00%
Extreme35.88%23.92%23.92%24.00%
LintongNo3774.00%3570.00%3876.00%3673.47%
Mild 612.00%510.00%510.00%510.20%
Moderate 24.00%714.00%36.00%48.16%
Severe24.00%12.00%24.00%24.08%
Extreme36.00%24.00%24.00%24.08%
HuaxianNo2752.94%3058.82%3160.78%2854.90%
Mild1733.33%1529.41%1223.53%1631.37%
Moderate 35.88%11.96%35.88%35.88%
Severe23.92%35.88%47.84%11.96%
Extreme23.92%23.92%11.96%35.88%
ZhangjiashanNo3874.51%3772.55%3466.67%3264.00%
Mild59.80%815.69%1019.61%816.00%
Moderate 47.84%35.88%11.96%612.00%
Severe23.92%11.96%59.80%24.00%
Extreme23.92%23.92%11.96%24.00%
Table 9. CPBI trend test.
Sites Spr.Sum.Fal.Win.Year
LinjiacunU-value−3.791−3.18−3.957−1.036−3.729
TrendsSignificant declineSignificant declineSignificant declineNo significant declineSignificant decline
XianyangU-value−3.553−2.123−3.47−2.165−3.045
TrendsSignificant declineSignificant declineSignificant declineSignificant declineSignificant decline
LintongU-value−3.108−1.243−3.149−0.207−2.279
TrendsSignificant declineNo significant declineSignificant declineNo significant declineSignificant decline
HuaxianU-value−3.149−1.637−2.88−0.195−2.248
TrendsSignificant declineSignificant declineSignificant declineNo significant declineSignificant decline
ZhangjiashanU-value−0.880.466−2.2743.439−1.823
TrendsNo significant declineNo significant increaseSignificant declinesignificant increaseNo significant increase
Table 10. CPBI trend test at Huaxian station of Weihe.
YearSpr.Sum.Fal.Win
Linjiacun1994 *1993 *1985 *1971 *1975 *
Xianyang1993 *1992 *1984 *1992 *1975 *
Lintong1993 *1993 *1984 *2001 *1974 *
Huaxian1975 *1994 *1993 *1985 *1999
Zhangjiashan1970 *1975 *1969 *1986 *1968 *
* Is significant for mutation sites.
Publisher’s Note: MDPI stays neutral with regard to jurisdictional claims in published maps and institutional affiliations.

