Article

Determination of Gaseous and Particulate Secondary Amines in the Atmosphere Using Gas Chromatography Coupled with Electron Capture Detection

1
Interdisciplinary Graduate Program in Environmental and Biomedical Convergence, Kangwon National University, 1 Gangwondaehak-gil, Chuncheon 24341, Gangwon-do, Korea
2
School of Natural Resource and Environmental Science, Kangwon National University, 1 Gangwondaehak-gil, Chuncheon 24341, Gangwon-do, Korea
*
Author to whom correspondence should be addressed.
Atmosphere 2022, 13(5), 664; https://doi.org/10.3390/atmos13050664
Submission received: 7 March 2022 / Revised: 14 April 2022 / Accepted: 19 April 2022 / Published: 22 April 2022
(This article belongs to the Section Atmospheric Techniques, Instruments, and Modeling)

Abstract

:
The aim of this study was to develop and optimize methods for the determination of gaseous and particulate (PM2.5) secondary amines (SAs) in the atmosphere using gas chromatography coupled with electron capture detection (GC-ECD) following chemical derivatization. The methods employed the liquid–liquid extraction (LLE) of pentafluorobenzenesulfonyl derivatives of the SAs before analytical samples were injected into GC-ECD. The optimized methods were applied to the determination of SAs in gaseous and particulate samples at two sites (urban and rural areas) from June to September in 2021. Gaseous samples were collected into an SPE cartridge containing a mixture of silica gel and sulfamic acid at a flow rate of 2 L·min−1 for 48 h. Particulate samples were collected onto 47 mm filters by a cyclone sampler at a flow rate of 16.7 L·min−1 for 48 h. The linearity of calibration curves, accuracy, and precision of the methods were satisfactory. In most of the field samples, dimethylamine (DMA), methylethylamine (MEA), diethylamine (DEA), and dipropylamine (DPA) were found to be the most frequently encountered compounds at the sampling sites.

1. Introduction

Ambient reactive nitrogen species are mixtures of nitrogen-containing organic and inorganic compounds. These various compounds are found in both gaseous and particulate phases with oxidized and reduced forms of nitrogen. The addition of nitrogen to an organic structure can lead to an increase in potential mutagenic and carcinogenic effects [1]. It can also increase the hygroscopicity of aerosols and thereby the ability to act as cloud condensation nuclei because several organic nitrogen groups are highly water soluble [2,3,4].
Among a variety of organic nitrogen compounds, amines are unique in their base-stabilization capacity. In particular, low molecular weight organic amines, such as dimethylamine (DMA) and diethylamine (DEA), can further contribute to the nucleation and initial growth of new particles, as well as secondary organic aerosol formation through the formation of aminium salts, preventing coagulation from pre-existing particles and influencing the radiant energy balance of the Earth’s atmosphere [5,6,7,8]. Reactive uptake of amines and subsequent displacement of aminium salts on the particles provide an additional pathway for gas-to-particle conversion of amines [9,10]. Gas-phase amines can undergo oxidation by hydroxyl radicals, nitrogen oxides, and ozone, producing nitrogen-containing organics that can condense on or be partitioned into the particle phase, as well as engage in heterogeneous reactions with acidic or carbonyl compounds to facilitate the formation and growth of atmospheric aerosols [6,11]. A previous study suggested that secondary amines (SAs) such as DMA and DEA are even more potent nucleating agents than primary amines [12]. The chemical structures of the most found secondary amines, including DMA, methylethylamine (MEA), DEA, dipropylamine (DPA), pyrrolidine (PYR), morpholine (MOR), piperidine (PIP), and dibutylamine (DBA), are presented in Figure 1.
SAs are emitted from a variety of anthropogenic sources, including automobile emissions, agricultural operations, waste treatment facilities, biomass burning, and industrial processes [6,11]. A recent study indicated that the substantial drop in on-road vehicular traffic and manufacturing activities during the COVID-19 lockdown (LCD) could be attributed to the reduced emission of amines during the LCD and post-LCD [13]. It also suggested that automobile exhausts contribute to amines in urban atmosphere [14]. However, emission rates of aliphatic amines from catalyst-equipped cars have been found to be low [15]. In addition, in urban areas, sources of gaseous phase amines could be derived from municipal waste treatment [16] or from agriculture [17]. In particular, a recent study also suggested that emissions from ceiling ducts can contribute to significant levels of amines in urban areas [18]. Though emission estimates vary widely, SAs have been detected in marine, rural, and urban atmosphere in gaseous and particulate phases, and within aqueous fog and rain drops [19]. Therefore, SAs can easily leach into the environment over time and migrate to the human body through three major pathways: air inhalation, dermal contact, and oral intake.
On the other hand, SAs are important precursors of corresponding N-nitrosamines (NAs) that have been classified as extremely potential human carcinogens by the International Agency for Research on Cancer (IARC) [20]. NAs can be formed through reactions between the precursor SAs (e.g., DMA and DEA) in the atmosphere and nitrosating agents (e.g., nitrous acid, nitrite). Because of the serious impact of NAs on human health and the ecosystem, IARC has classified six NAs, including N-nitrosomethylethylamine (NMEA), N-nitrosodipropylamine (NDPA), N-nitrosomorpholine (NMOR), N-nitrosopyrrolidine (NPYR), N-nitrosopiperidine (NPIP), and N-nitrosodibutylamine (NDBA), as being possibly carcinogenic to humans (group 2B), and N-nitrosodimethylamine (NDMA) and N-nitrosodiethylamine (NDEA) as being probably carcinogenic to humans (group 2A).
A number of online mass spectrometric techniques have been employed to study the chemical compositions, mixing states, and formation process of amine-containing particles, including aerosol time-of-flight mass spectrometry (ATOFMS) [21,22], chemical ionization mass spectrometry (CIMS) [23,24], compact time-of-fight mass spectrometry (C-TOF-AMS) [25], proton-transfer-reaction mass spectrometry (PTR-MS), and Fourier transform infrared spectroscopy (FTIR) [26]. Novel techniques are usually promising methods for rapid analysis, but they are often costly, and require sophisticated laboratory conditions and labor-intensive data processing. Furthermore, the online mass spectrometric observations cannot provide the quantitative determination of specific amines.
In recent years, chromatographic methods such as gas chromatography (GC) [27,28], liquid chromatography (LC) [29,30], and ion chromatography (IC) [31,32] have been used to quantitatively determine organic amines. One of the most commonly used analytical techniques for volatile amines is GC because of its inherent advantages of simplicity, high resolving power, high sensitivity, short analysis time, and low cost [33]. However, the use of GC has the disadvantages that the low-molecular-mass amines are not easily separated from water because of their high water solubility and high polarity. Furthermore, polar organic amines tend to be decomposed on the analytical column and adsorbed onto the exposed surfaces of the instruments used. This may result in peak tailings and losses of the target analytes. To decrease the absorption, these surfaces and the GC columns need to be deactivated to obtain good peak shapes [34]. Despite of proper columns for amines, bad peak shapes can still be obtained with water matrices [35].
Chemical transformation is an alternative to this limitation. The change of the amino groups to less polar moieties improves selectivity, sensitivity, and lowering of the detection limit in the instrument analysis [36]. Therefore, chemical derivatization reactions may be a good solution for the determination of low-molecular-mass organic amines in different aqueous matrices. A previous study showed that some reagents, such as trifluoroacetylimidazole, can react with hydroxyl groups and primary or secondary amines to generate relatively stable halogenated derivatives [37]. In addition, fluorinated and chlorinated substituted reactants are popular among acylating reagents, which can form compounds capable of capturing electrons and producing negatively charged ions in the reaction with analytes [37,38]. For this purpose, an electron capture detector (ECD) is used because it shows high selectivity and sensitivity for halogenated derivatives [38,39]. The detector’s response to halogen-containing compounds decreases in the order of I > Br > Cl >> F [39]. However, fluorinated derivatizing reagents are the most frequently used in analyzing low-molecular-mass amines because of their high volatility and stability [37,38]. Furthermore, the detector’s sensitivity increases with the increase in the number of fluorine atoms in the analyte molecule [38]. Many reagents have been used for amine derivatization, including ethyl chloroformate, 9-fluorenylmethyl chloroformate, and isobutyl chloroformate [40,41,42]. However, pentafluorobenzenesulfonyl chloride (PFBSC) has mainly been used for the derivatization of biogenic amines in drugs to form halogenated derivatives with high sensitivity of ECD detection (the detection limit ≤ 1 pg) [43,44].
In this study, new methods for the determination of SAs in gaseous and particulate phase samples using GC-ECD after their modification to fluorine-containing derivatives using PFBSC as a derivatizing reagent were introduced. The methods were optimized for operating conditions and validated for linearity, sensitivity, accuracy, and precision. The developed methods were tested for field application to airborne SAs in a rural area and an urban area in Chuncheon, Gangwon-do, Korea.

2. Materials and Methods

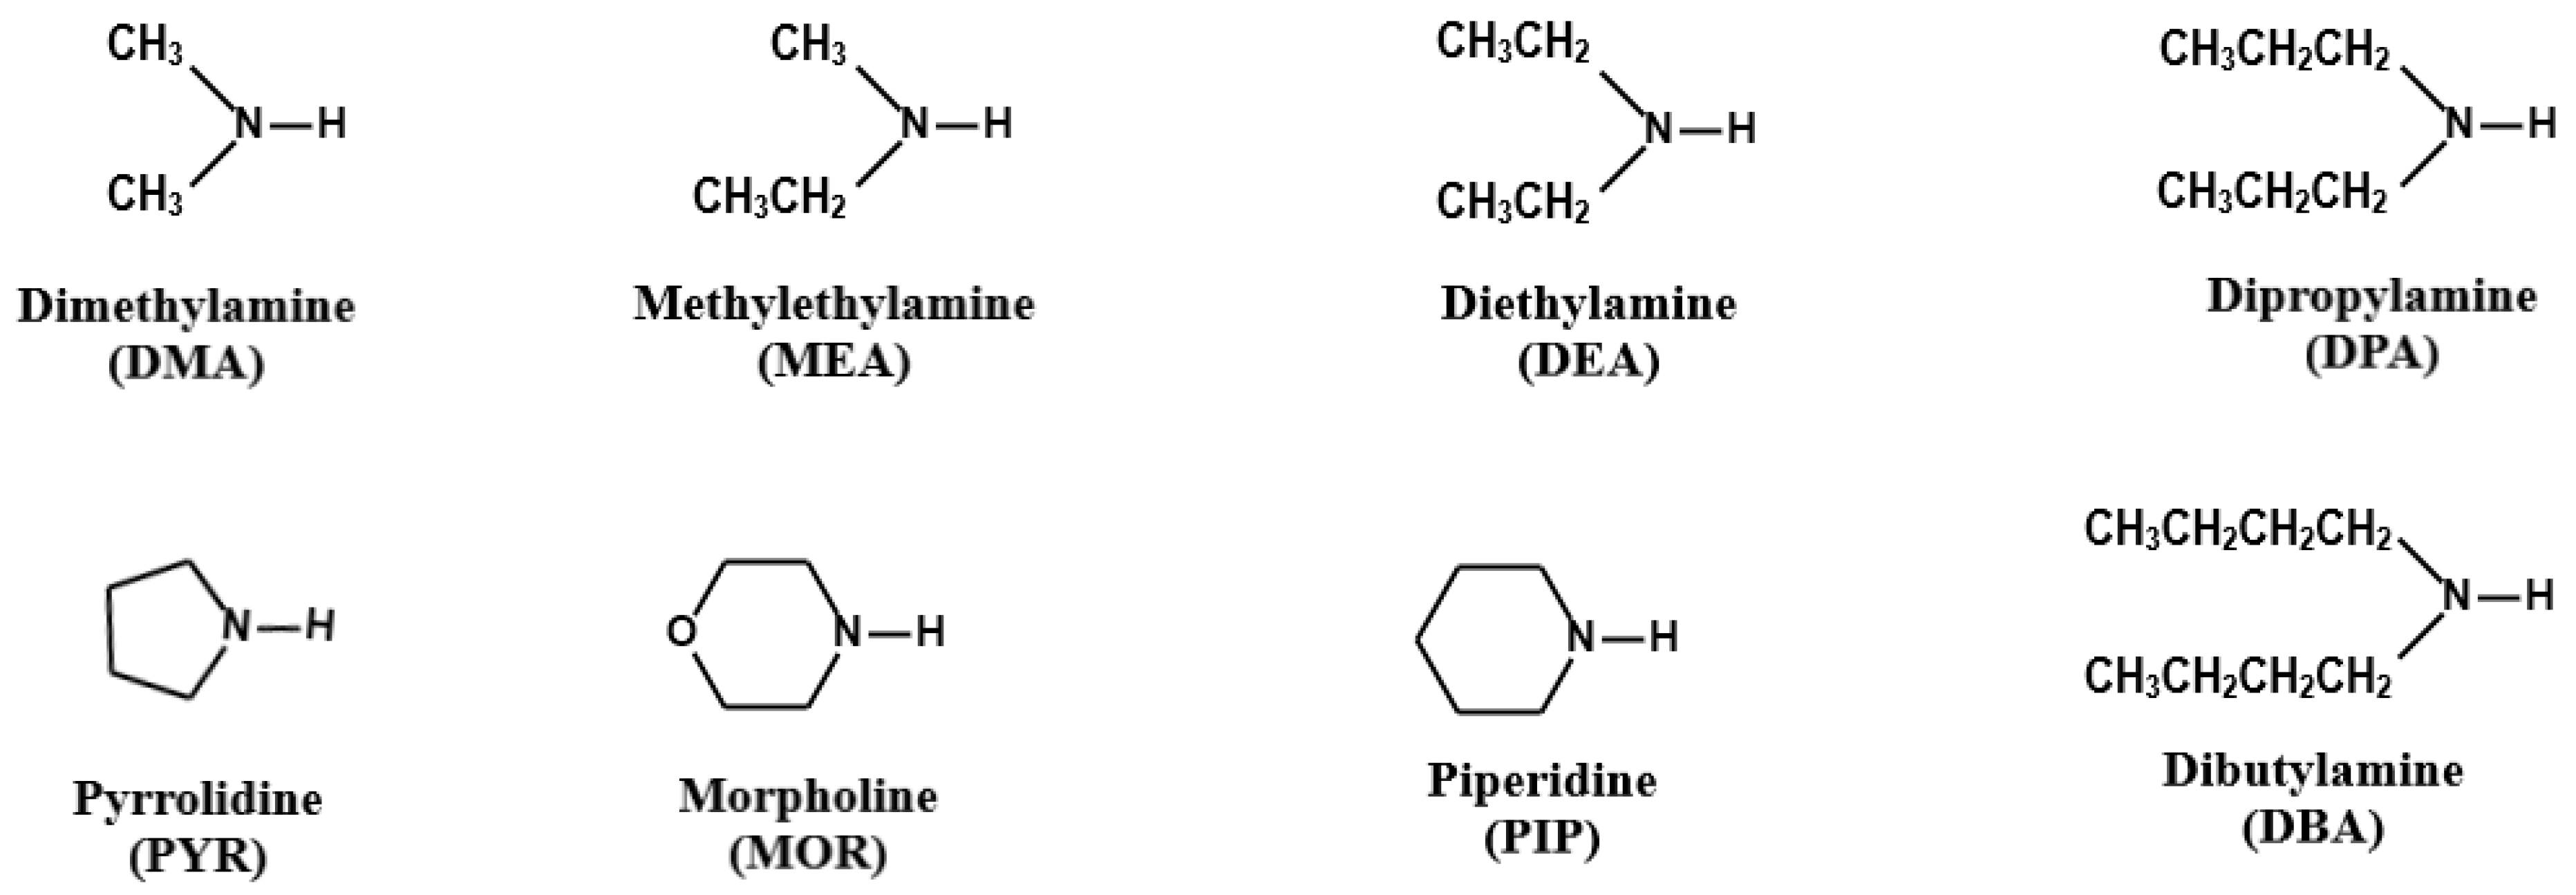
2.1. Chemicals and Reagents

Standard chemicals, such as DMA hydrochloride (99.0%), DEA (≥99.5%), PYR (≥99.0%), MOR (≥99.0%), DBA (≥99.5%), N-ethylbutylamine (EBA, as a surrogate standard, SS, ≥98.0%), and PFBSC (99.0%), were purchased from Sigma-Aldrich (St. Louis, MO, USA). MEA (≥98%), DPA (≥99.0%), and PIP (≥99.0%) were obtained from Alfa Aesar (Heysham, England), Merck KGaA (Darmstadt, Germany), and Fluka Analytical (St. Louis, MO, USA), respectively. Methyl tert-butyl ether (MTBE, ≥99.8%), hexane (≥99.8%), ethyl acetate (≥99.8%), and acetonitrile (≥99.9%) were obtained from Tedia (Fairfield, OH, USA). Sodium hydroxide (≥98.0%) and sodium sulfate (≥99.0%) were purchased from Daejung Chemicals & Metals (Siheung, Korea), and sulfuric acid (97.0%) was purchased from Showa Denko (Tokyo, Japan).
A standard stock solution (25 mL) of eight SAs was prepared by dissolving each standard in methanol to a concentration of 1000 mg·L−1. Afterward, an aliquot of the stock solution was diluted in methanol to yield a working standard solution (10 mg·L−1). A solution of EBA as a surrogate with a concentration of 10 mg·L−1 in methanol was prepared as stated above. All solutions were stored at 4 °C. A NaOH solution (1 M, 100 mL) was prepared by dissolving 4 g of NaOH in water. A sulfuric acid solution (0.1 N, 250 mL) was prepared by dissolving 680 µL of sulfuric acid (98%) in water.

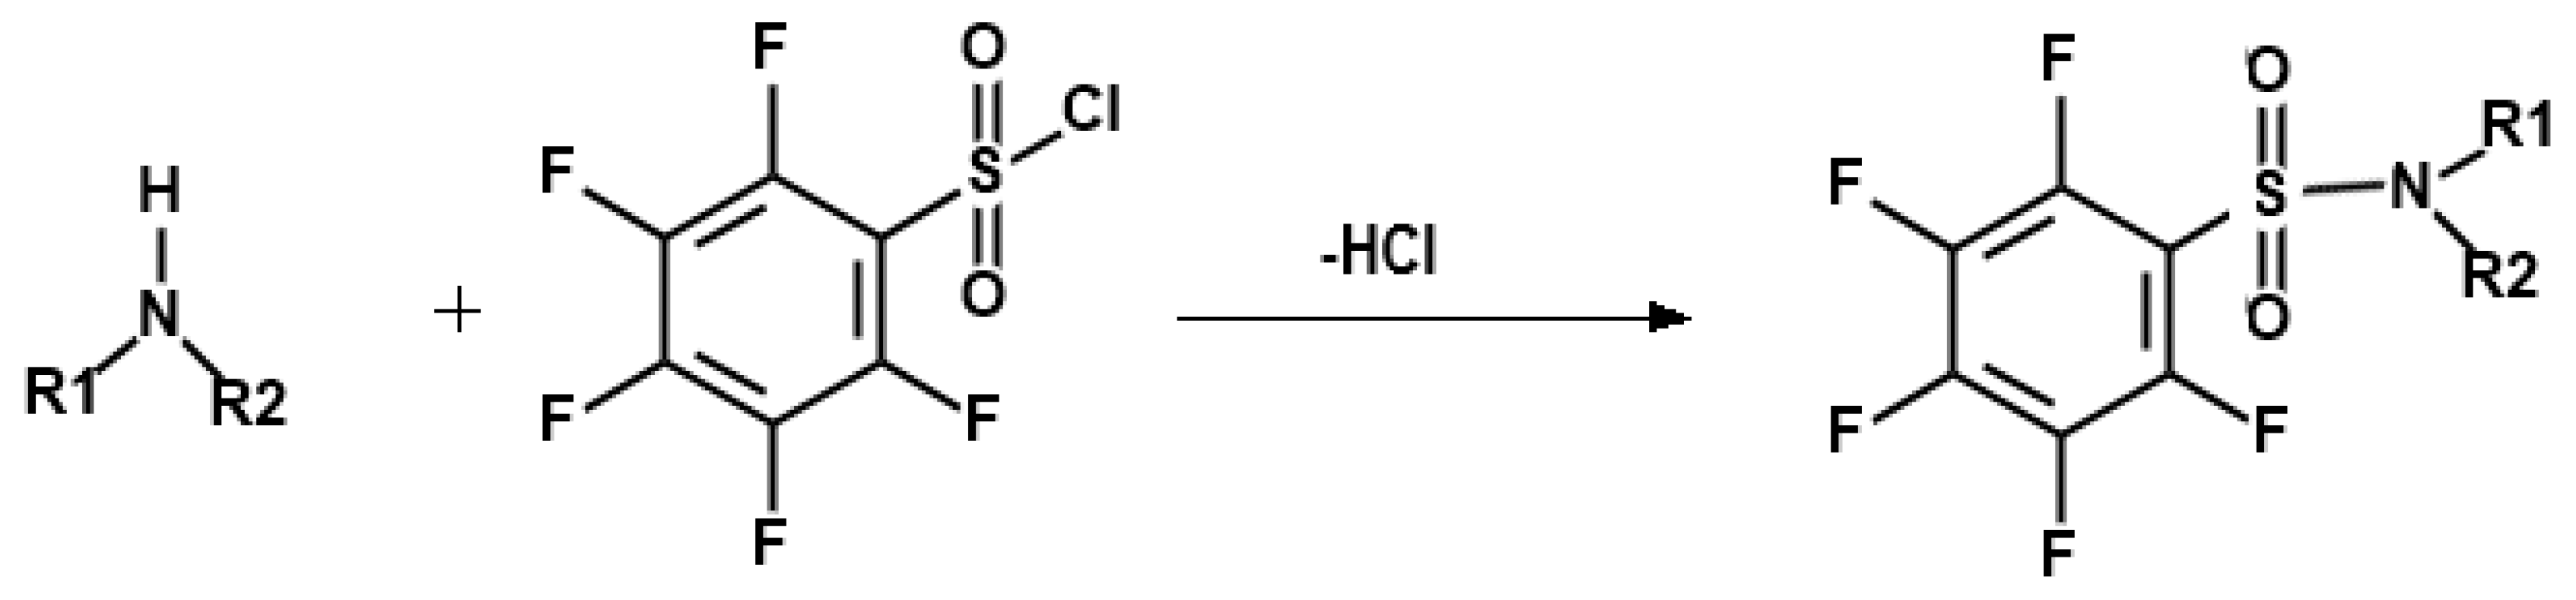
2.2. Derivatization and Extraction

The analytical method used in this study was a modification of one employed in a previous study in which SAs were derivatized with isobutyl chloroformate [42]. The derivatization reagent was replaced by PFBSC in this study. Method optimizations were carried out for derivatization and extraction.
First, 18 mL of an extracted sample in a 40 mL glass vial was spiked with 30 pg of the surrogate solution (EBA 10 mg·L−1). Then, 2 mL of 1 M NaOH solution, 180 µL of acetonitrile, and 20 µL of PFBSC were added to the vial. The mixture was shaken and then incubated at 40 °C to produce fluorine-containing derivatives of the secondary amines. The choice of derivatization reaction time is critical; thus, three different durations (5, 10, and 20 min) were compared following three repetitions for each time setting. Afterward, 3 g of sodium sulfate and 2 mL of an organic solvent were added to extract the derivative of the SAs. The mixture was vigorously shaken for 10 min using a mechanical shaker (SR-2DS, Taitec Co., Koshigaya, Japan), and then 1.2 µL of the upper layer was injected into the GC-ECD system. After the optimized reaction time for derivatization was selected, the choice of a solvent for the pentafluorobenzenesulfonyl derivatives of the SAs was investigated. Three organic solvents, namely MTBE, hexane, and ethyl acetate, were tested with three repetitions for each.

2.3. GC-ECD Parameters

GC analysis was carried out using an Agilent 8890 GC equipped with an ECD (Santa Clara, CA, USA). A silica capillary column (30 m × 0.25 mm, 0.32 µm) of cross-linked DB-5MS UI (J&W; Folsom, CA, USA) was used to separate eight SAs and EBA (SS). The prepared sample (1.2 µL) was injected using an Agilent 7693A Autosampler in splitless mode. Nitrogen (99.999%) was used as a carrier gas and constantly flowed at 1.5 mL·min−1. Oven temperature programming was as follows: The initial temperature was set at 50 °C and kept for 2 min, raised linearly to 140 °C at a rate of 5 °C·min−1, and kept for 3 min. Then, it was increased to 200 °C at a rate of 10 °C·min−1, further increased to 240 °C at a rate of 20 °C·min−1, and held at the final temperature for 10 min. Nitrogen was also used as a makeup gas. The peak areas of SAs were used to calculate the peak response ratios of analytes to SS peak area.
Instrumental conditions were also investigated with the aim of achieving a short separation time, and high selectivity and sensitivity. The GC-ECD parameters included injection port temperature, detector temperature, and makeup gas flow rate. Injector temperatures of 240, 280, and 300 °C, and detector temperatures of 280, 300, and 320 °C were tested for sensitivity. Makeup gas flow rates of 30, 45, 60, and 75 mL·min−1 were also tested to achieve high instrumental sensitivity. Each experiment was carried out in triplicate at an injected amount of 30 pg.

2.4. Method Validation
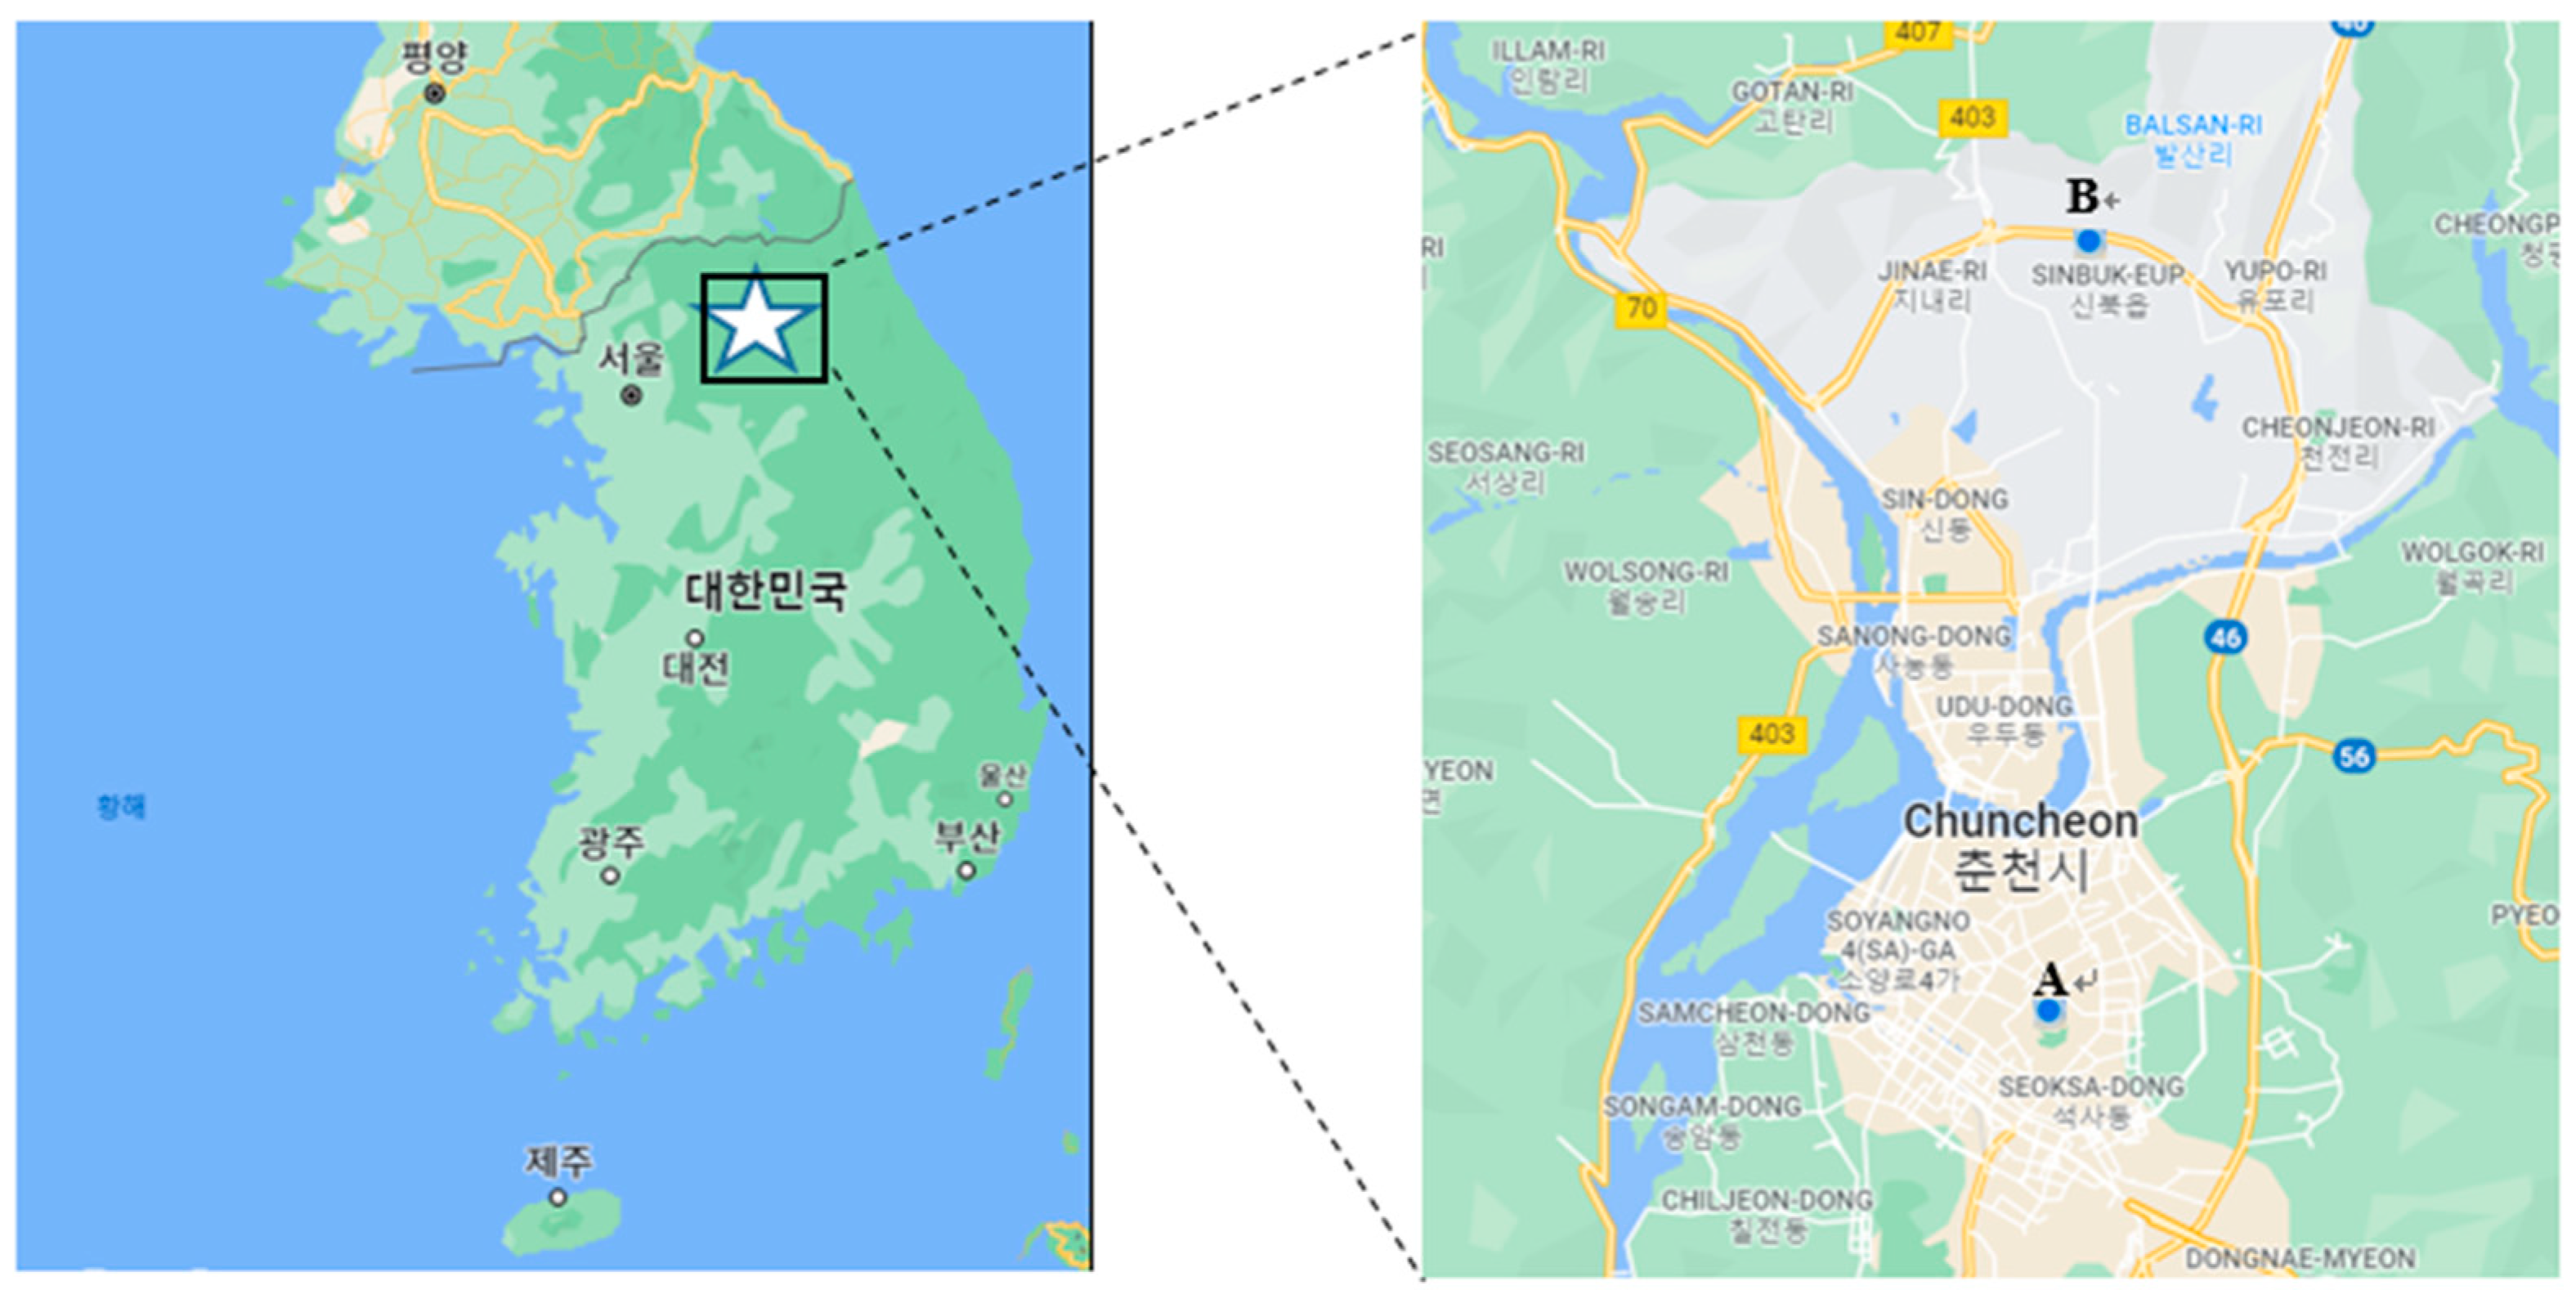
Sampling and extraction efficiencies for gas-phase SAs and extraction efficiency for particulate phase SAs were also investigated. Validation of the method was performed by evaluating the linearity of calibration curves, sensitivity, accuracy, and precision. Calibration curves were prepared in the range from 30 to 210 pg, and a mixture of eight standards and 30 pg of the surrogate standard were used. Each calibration curve was drawn by plotting the ratio of the integrated peak area ratio of the target analyte to that of the internal standard against the amount of each compound. Curves with coefficients of determination of 0.990 or greater were considered to be acceptable. The method detection limit (MDL) for each compound was determined by multiplying 3.14 by the standard deviation (SD) of the seven replicated for 30 pg. The accuracy and precision of each compound were investigated based on the percent recovery and repeatability measured by the relative standard deviation of seven measurements at three levels (30, 120, and 210 pg).

2.5. Field Sampling

Gaseous phase samples and particulate matter samples with an aerodynamic diameter equal to or less than 2.5 µm (PM2.5) were separately collected at urban and rural sites in Chuncheon, Gangwon-do, Korea. The urban site is located on the rooftop of Natural Sciences Building #2 on the campus of Kangwon National University in Hyoja-dong, Chuncheon, while the rural site is on the rooftop of a research building located on the campus of Kangwon National University farm in Sinbuk-myeon, Chuncheon (Figure 2). Both types of samples were typically collected once or twice a week (on weekdays). A total of 25 PM2.5 samples and 25 gaseous phase samples were collected at both sites from June to September 2021.
Gaseous phase samples were collected by withdrawing ambient air through a cartridge containing a mixture of 0.3 g of silica gel and 0.03 g of sulfamic acid. Each sample was collected for 48 h at a flow rate of 2 L·min−1. After sampling, cartridges were tightly closed with Luer lock tips, put in a plastic bag, and stored in a refrigerator until analysis within 4 weeks. PM2.5 samples were collected onto 47 mm Whatman glass microfiber filters for 48 h at a flow rate of 16.7 L·min−1 using a URG cyclone sampler (URG-2000-30EH). The filters were wrapped in aluminum foil, placed in a plastic bag, and stored in a freezer until analysis.

2.6. Sample Pretreatment

For the analysis of gaseous samples, the cartridge tubes, each of which was spiked with 30 pg of SS, were mounted onto a SPE vacuum manifold (Supelco). SAs were eluted from the cartridges with 18 mL of a 0.1 N sulfuric acid solution. The eluates were transferred to 40 mL vials for derivatization. For the analysis of PM2.5 samples, half of each filter was placed into a 40 mL vial, into which 30 pg of SS was spiked. SAs were extracted with 18 mL of a 0.1 N sulfuric acid solution by ultrasonication at room temperature for 20 min. The extracts were filtered through a 0.45 µm PTFE syringe filter and then derivatized as follows.
To each extract, 2 mL of 1 M sodium hydroxide, 180 µL of acetonitrile, and 20 µL of PFBSC were added in a 40 mL glass vial. The mixture was mixed well and then incubated at 40 °C for 10 min to generate fluorine-containing derivatives of SAs. Afterward, 3 g of sodium sulfate and 2 mL of MTBE were added to the vial, and the resulting mixture was shaken for 10 min using a mechanical shaker (SR-2DS, Taitec Co., Koshigaya, Japan). In total, 1 mL of the upper layer was transferred to a GC vial, and 1.2 µL was used for GC-ECD analysis.

2.7. Data Analysis

For data analysis, values less than each (MDL) were regarded as half of each MDL [45]. IBM SPSS Statistics (version 24.0, IBM Co., Armonk, NY, USA) was used for statistical analysis. Student’s t-test was conducted to compare the concentrations of SAs between urban and rural areas, and the difference between the gaseous phase and particulate phase.

3. Results and Discussion

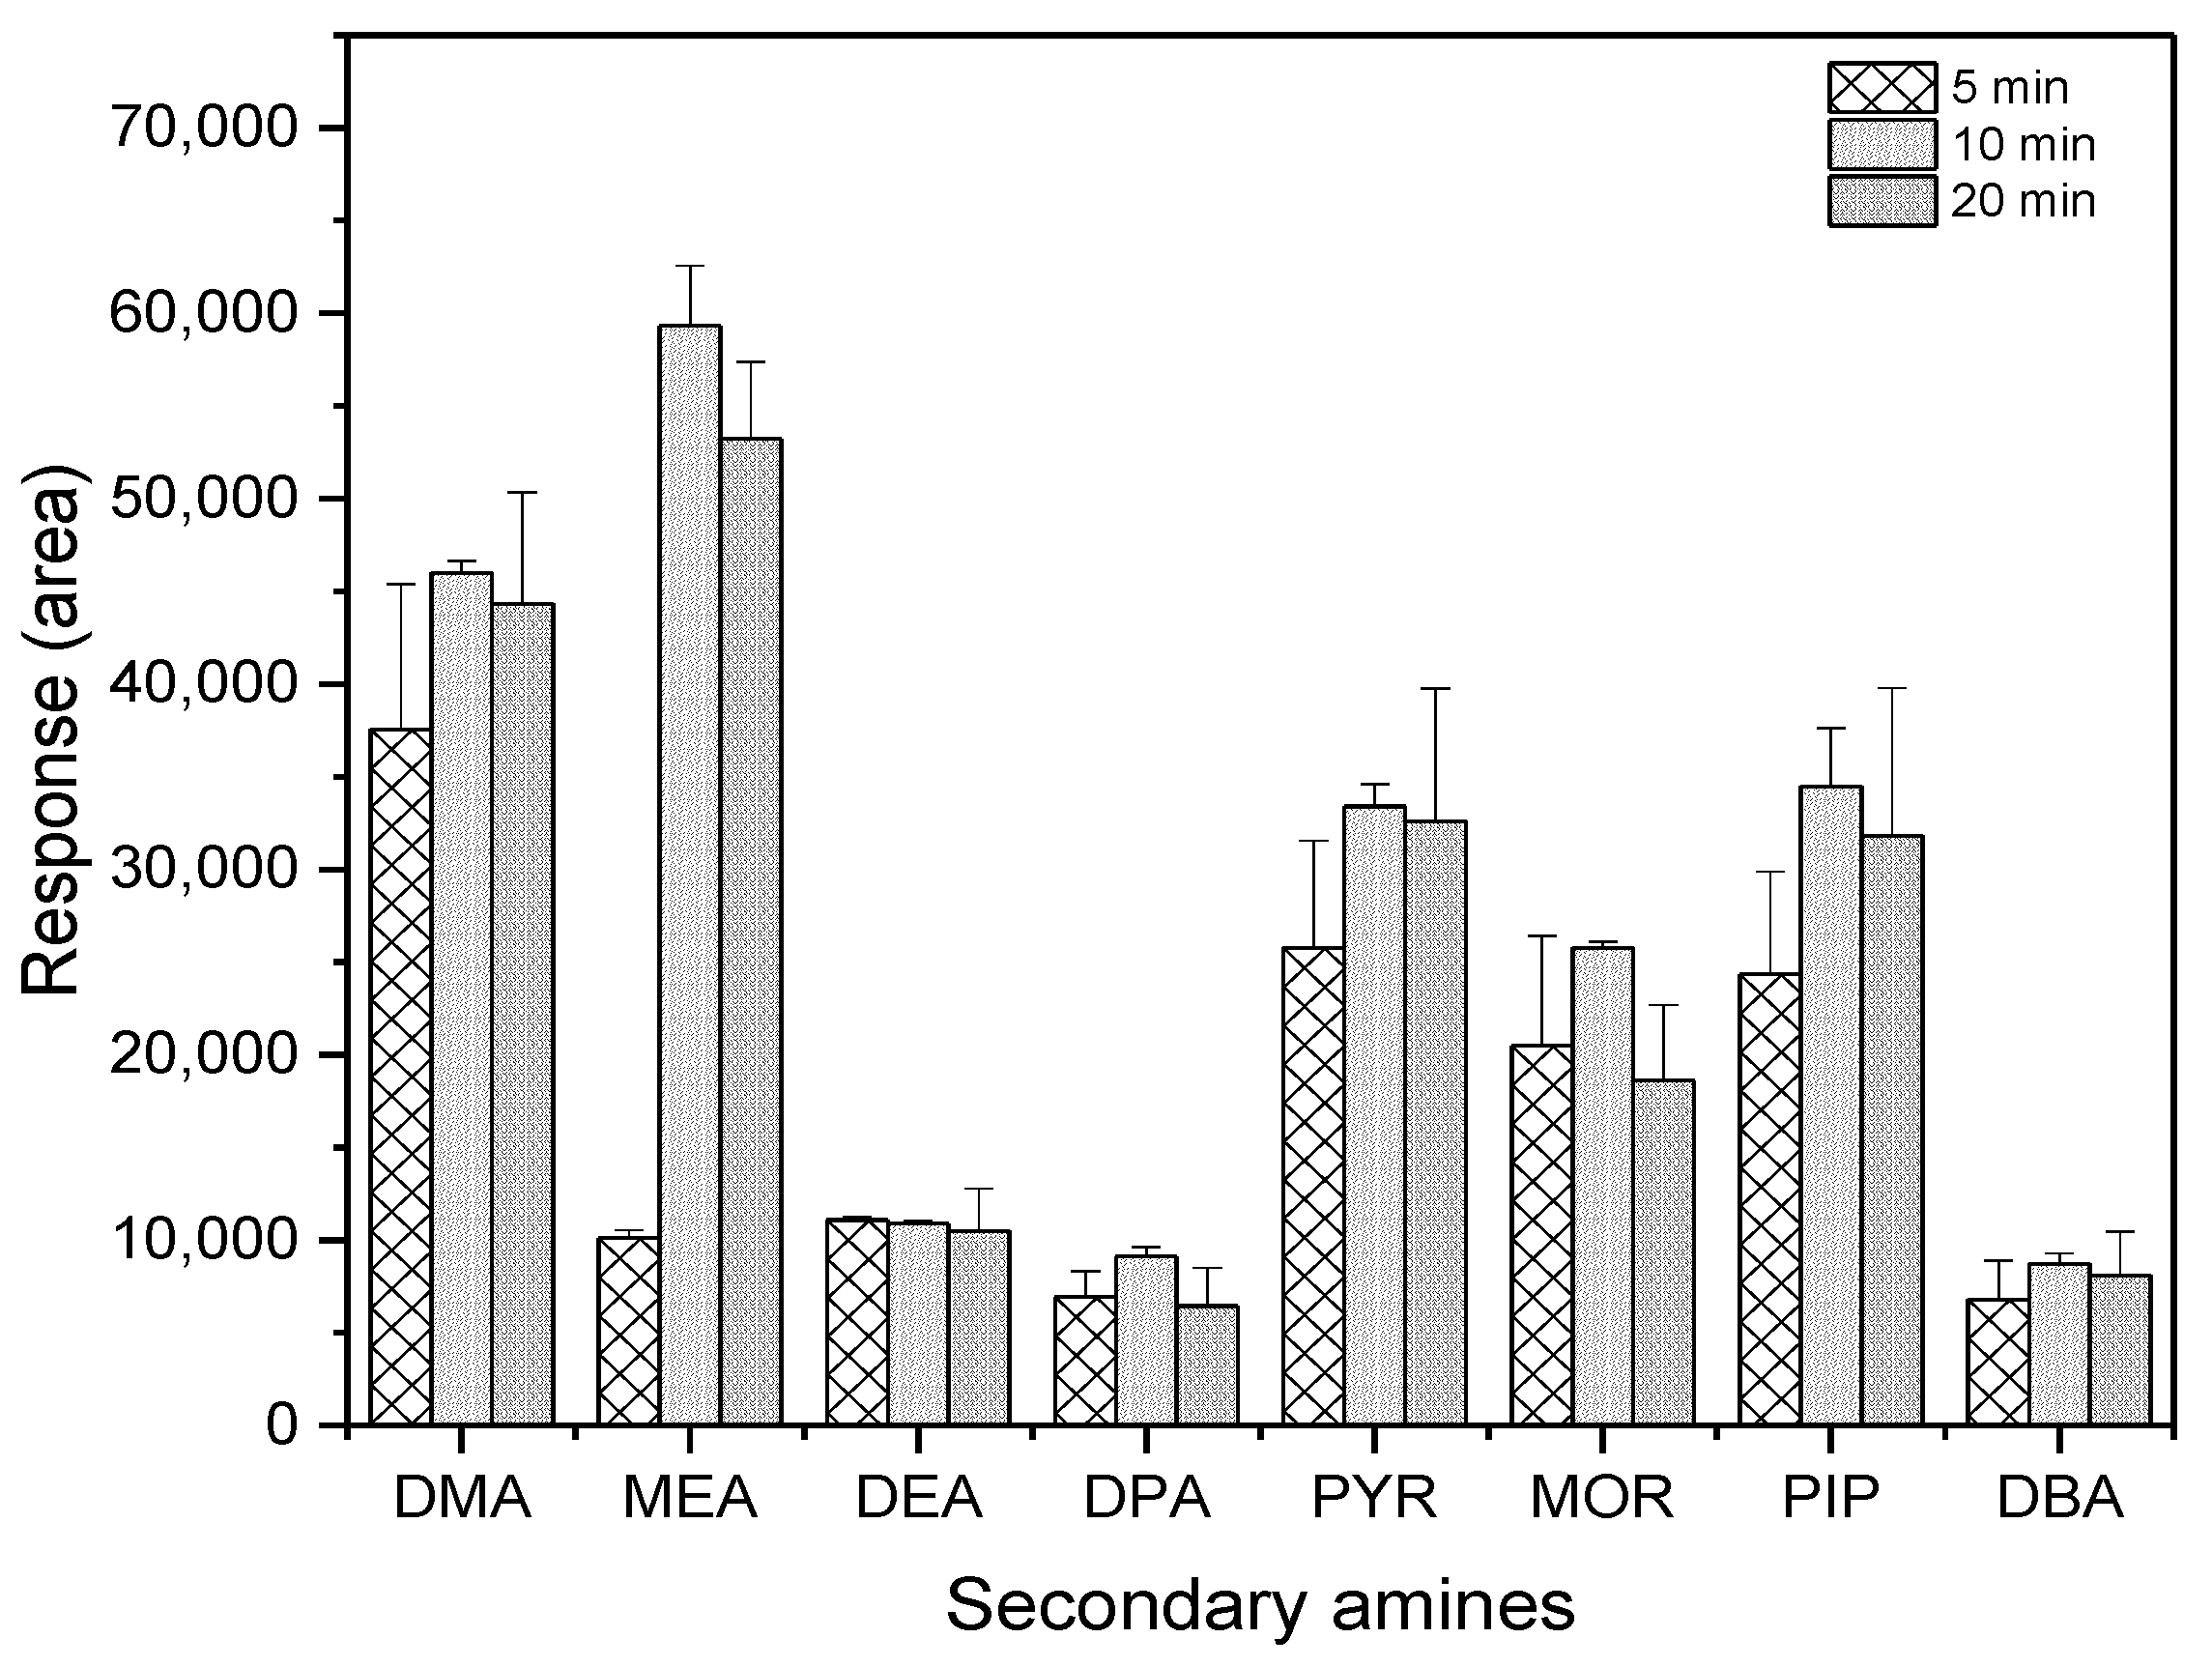
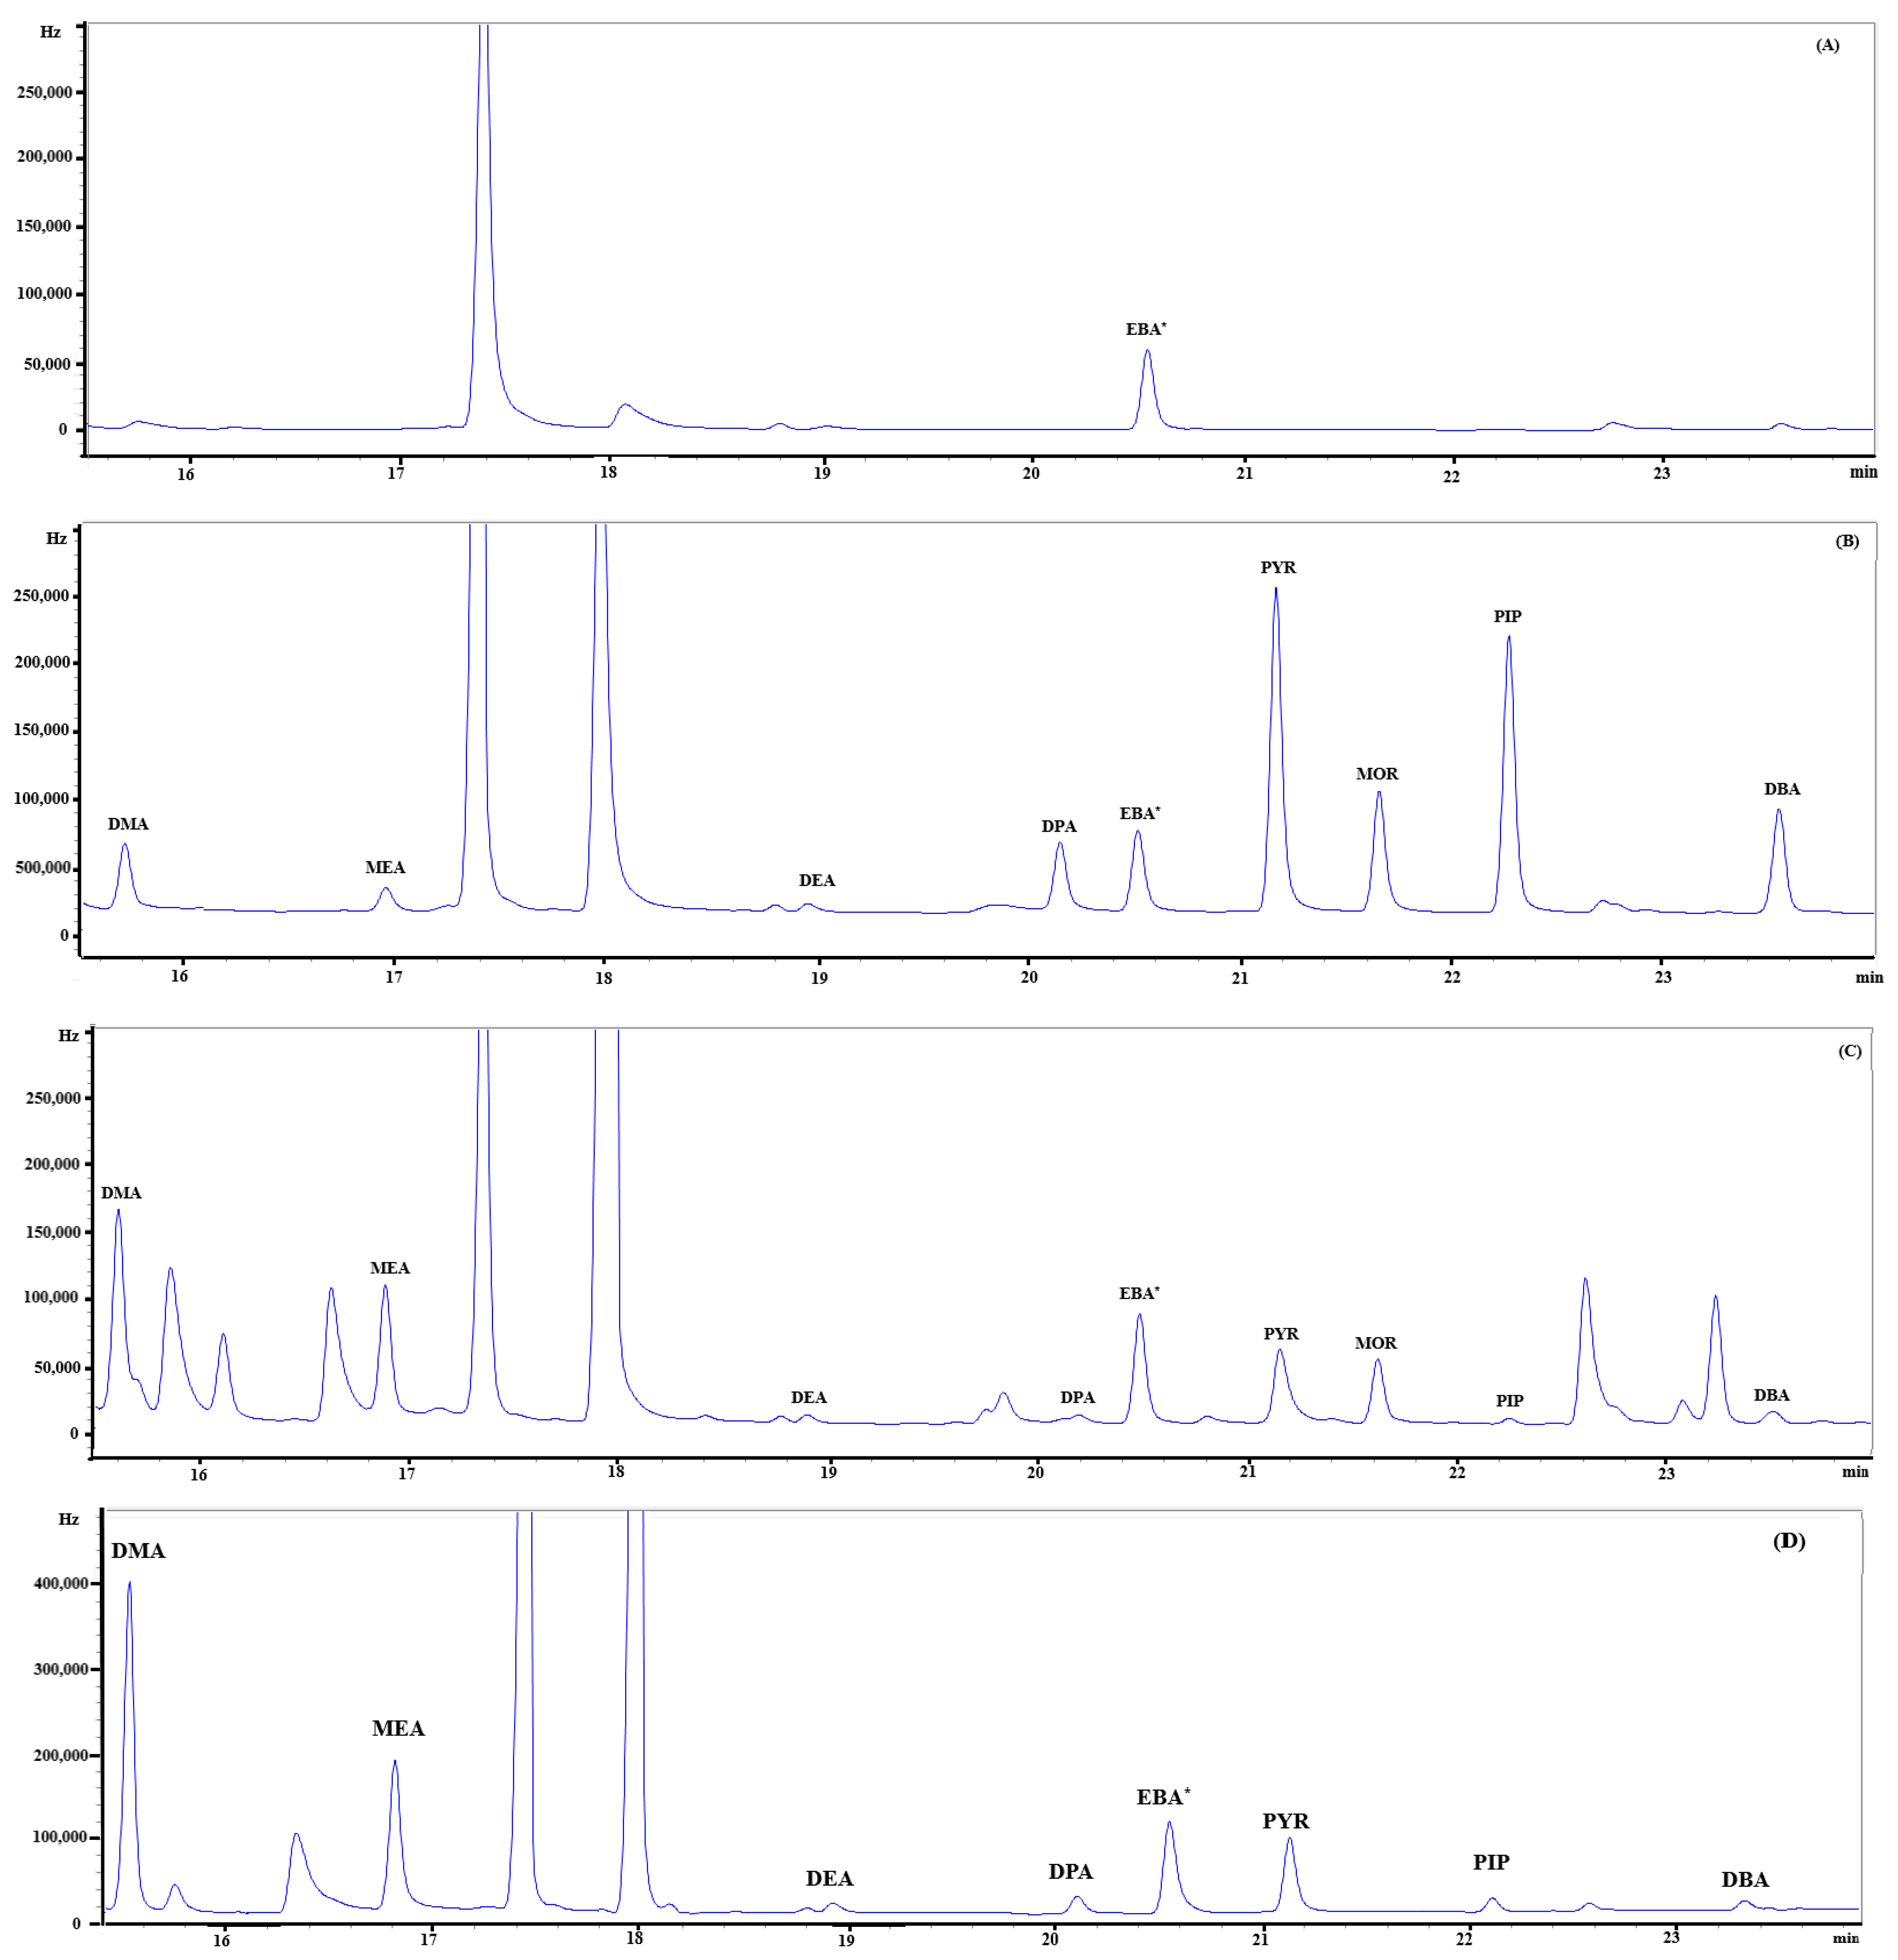
3.1. Optimization of the Analytical Procedure

Secondary amines are not easily extracted into an organic phase from water because of their high hydrophilicity. Furthermore, they tend to be decomposed on the GC capillary column, resulting in peak tailing and losses. Therefore, derivatization is a necessary step to decrease polarities and increase the volatility of SAs, and improve the selectivity, sensitivity, and resolution in the GC analysis. Previous studies have confirmed that PFBSC can be conjugated with amines to form amine derivatives [37,43,44]. The reaction is represented in Figure 3. The use of PFBSC provided favorable conditions for GC-ECD analysis by avoiding any interference from organic solvent peaks and having high selectivity and sensitivity.
As shown in Figure 4, the highest extraction efficiency was achieved at the reaction time of 10 min among the three tested durations.
The extraction efficiency of the target compounds using the three different solvents was compared at an amount of 30 pg. MTBE and ethyl acetate were the recommended solvents because their layer separation from water was more readily completed than hexane following the addition of sodium sulfate. As shown in Figure 5, MTBE and ethyl acetate showed similar results for DMA, MEA, DPA, and PYR. However, MTBE had higher responses to DEA, MOR, and DBA than ethyl acetate, whereas the opposite was true for PIP. Therefore, MTBE was chosen as a solvent for extracting PFBS derivatives of SAs from water in subsequent experiments.

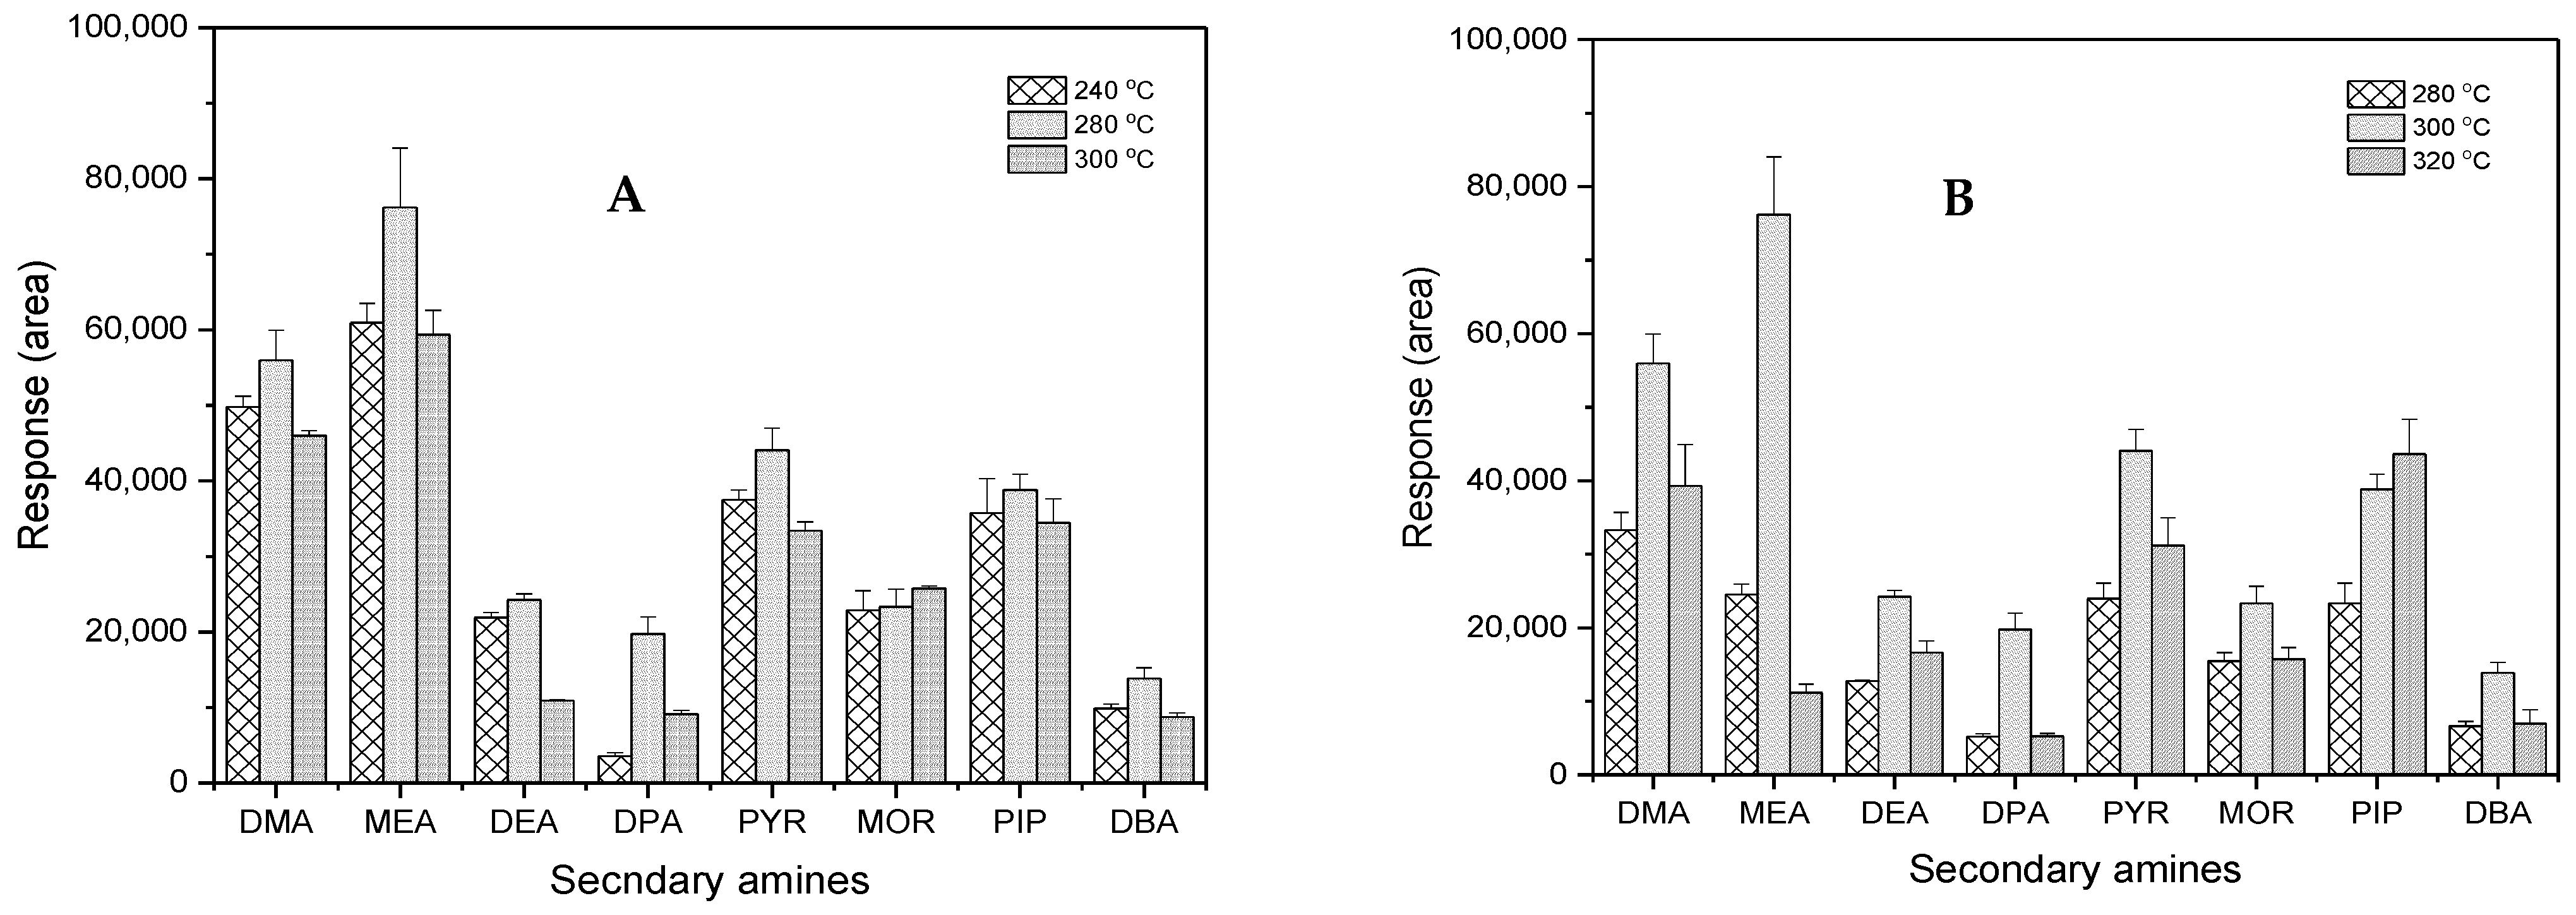
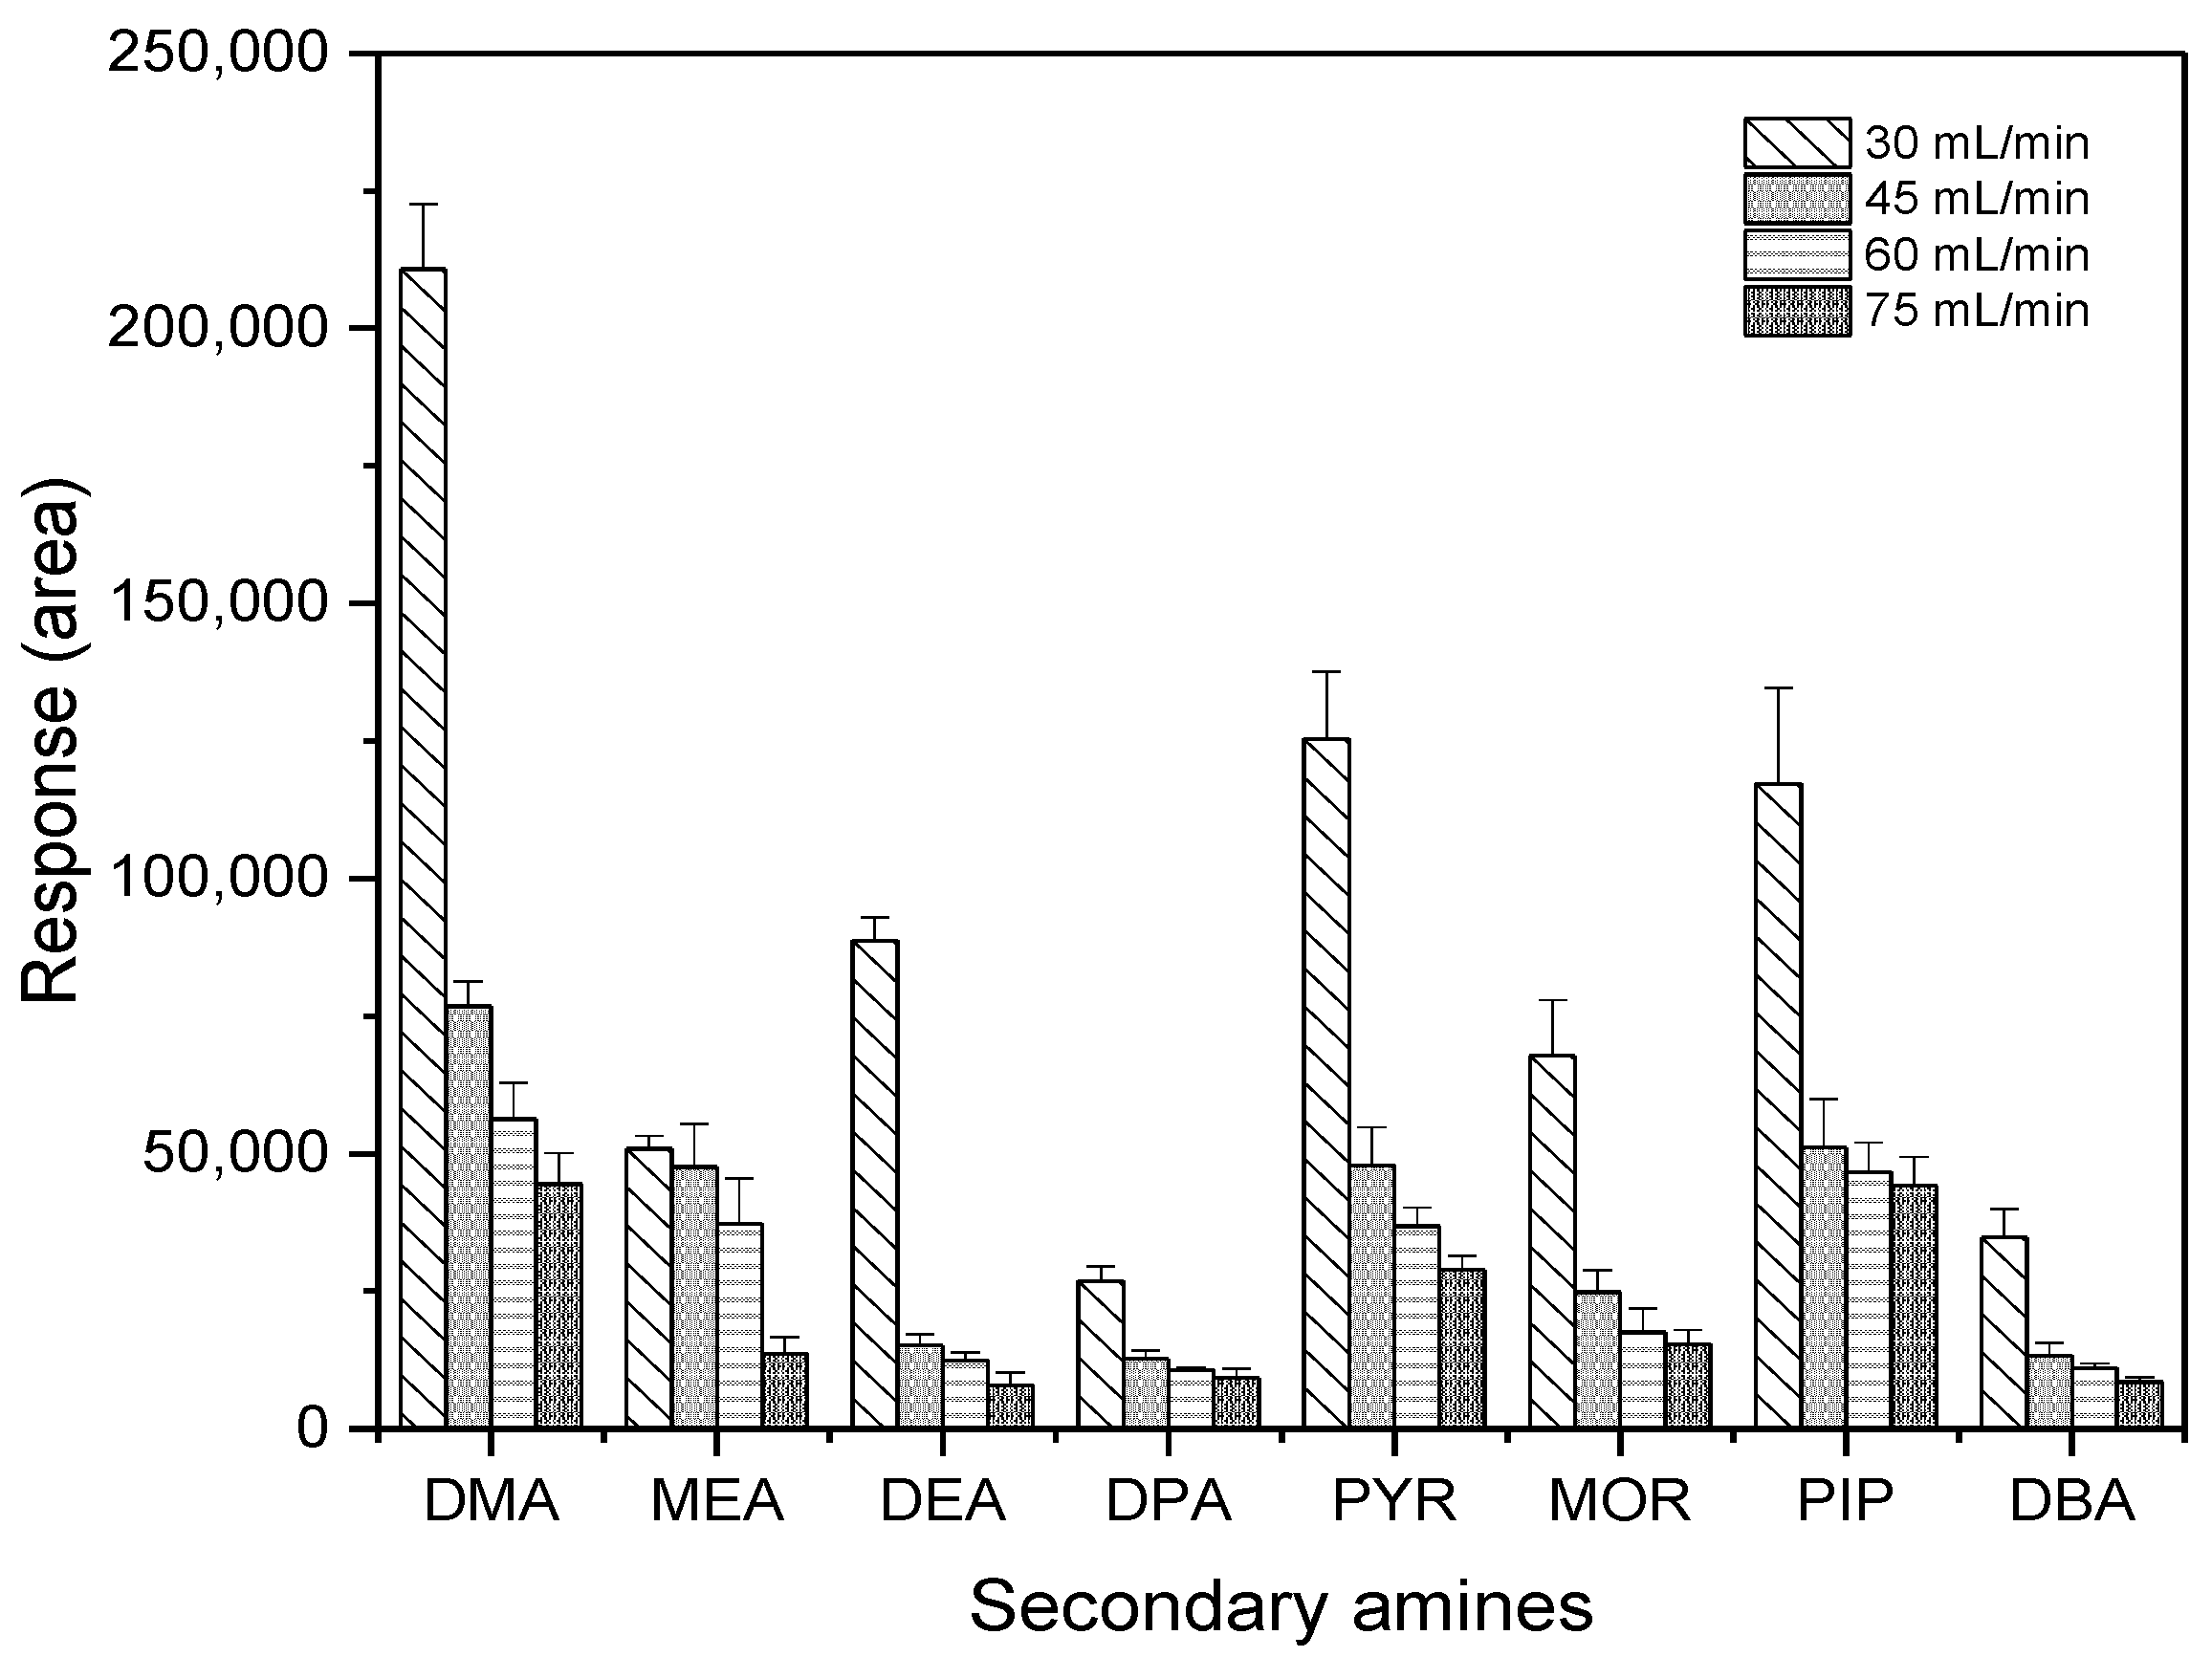
3.2. Optimization of GC-ECD Parameters

Good chromatographic separation is essential to differentiate compounds that are similar in chemical structure and molecular weight. The temperature program, a critical factor in GC separation, can be optimized to achieve high selectivity. Thus, the optimization of temperature programming was undertaken to enhance the selectivity of the analysis, and the ultimate oven program is shown in Section 2.3. The inlet and detector (ECD) temperatures were also optimized. As shown in Figure 6, the change in inlet and detector temperatures greatly influenced the peak responses, resulting in 280 °C and 300 °C as the optimum temperatures, respectively.
Another critical parameter in GC-ECD measurement, makeup gas flow rate, was investigated to obtain the highest sensitivity of measurement. An amount of 30 pg of each SA was injected at the optimized temperature program, which was selected at 280 °C in the inlet temperature, and at 300 °C in the detector temperature using different makeup gas flow rates. As shown in Figure 7, as the makeup gas flow rate decreased, the detector’s response gradually increased. In particular, there was a dramatic change from 45 mL·min−1 to 30 mL·min−1 for most target compounds, with the exception of MEA. In this study, peak responses of PFBS derivatives at 30 mL·min−1 were two-times higher than those at other flow rates or more. Therefore, 30 mL·min−1 was chosen as a makeup gas flow rate.

3.3. Sampling and Extraction Efficiencies

To determine the collection efficiency of gaseous samples, two cartridges (front and backup cartridges) were connected in series. The front cartridge was spiked with 120 pg of SAs, and air was withdrawn at a flow rate of 2 L·min−1. Each cartridge was extracted twice using 0.1 N sulfuric acid. For all SAs, the collection efficiencies of gaseous phase SAs in the front cartridges were greater than 98% including two extractions (Table 1), indicating no breakthrough problem in gas-phase sampling.
For the extraction of SAs, 0.1 N sufuric acid solution was used for both types of samples. The extraction efficiencies of SAs in the gaseous and PM2.5 phases are shown in Table 1 and Table 2, respectively. The results showed that the average extraction efficiencies were greater than 94% for the first extraction, with the exception of DBA (88%). Therefore, 0.1 N sulfuric acid solution was found to be appropriate for extracting SAs from the sampling media.

3.4. Method Validation

Figure 8 shows chromatograms of a blank (A), standard (B, 30 pg of each), PM2.5 sample (C), and gaseous sample (D), respectively. Eight SAs were clearly separated from other neighboring peaks, except DMA, whose peak was slightly overlapped with a small peak on the right-hand side in a sample. Each compound was identified on the basis of retention time compared to a standard. The retention time of each target compound is shown in Table 3.
The coefficients of determination (r2) for the linear calibration curves were all greater than 0.990, as shown in Table 3. The MDLs for eight SAs in PM2.5 ranged from 0.023 to 0.053 ng·m−3, while those in the gaseous phase ranged from 0.189 to 0.442 ng·m−3. The proposed analytical methods showed MDLs similar to or lower than those presented in previous studies (Table 4) [41,42,46]. Therefore, our methods can be applied to the determination of particulate and gaseous SAs in the atmosphere, though they took 48 h for sampling.
Percent recoveries at three different amounts (30 pg, 120 pg, and 210 pg for each target compound) using the developed methods measured in triplicate were all higher than 80% on average and lower than 120% for both types of samples, indicating satisfactory accuracy (Table 5). The relative standard deviations of each SAs measuring repeatability were satisfactory, ranging from 2.0 to 8.3%.

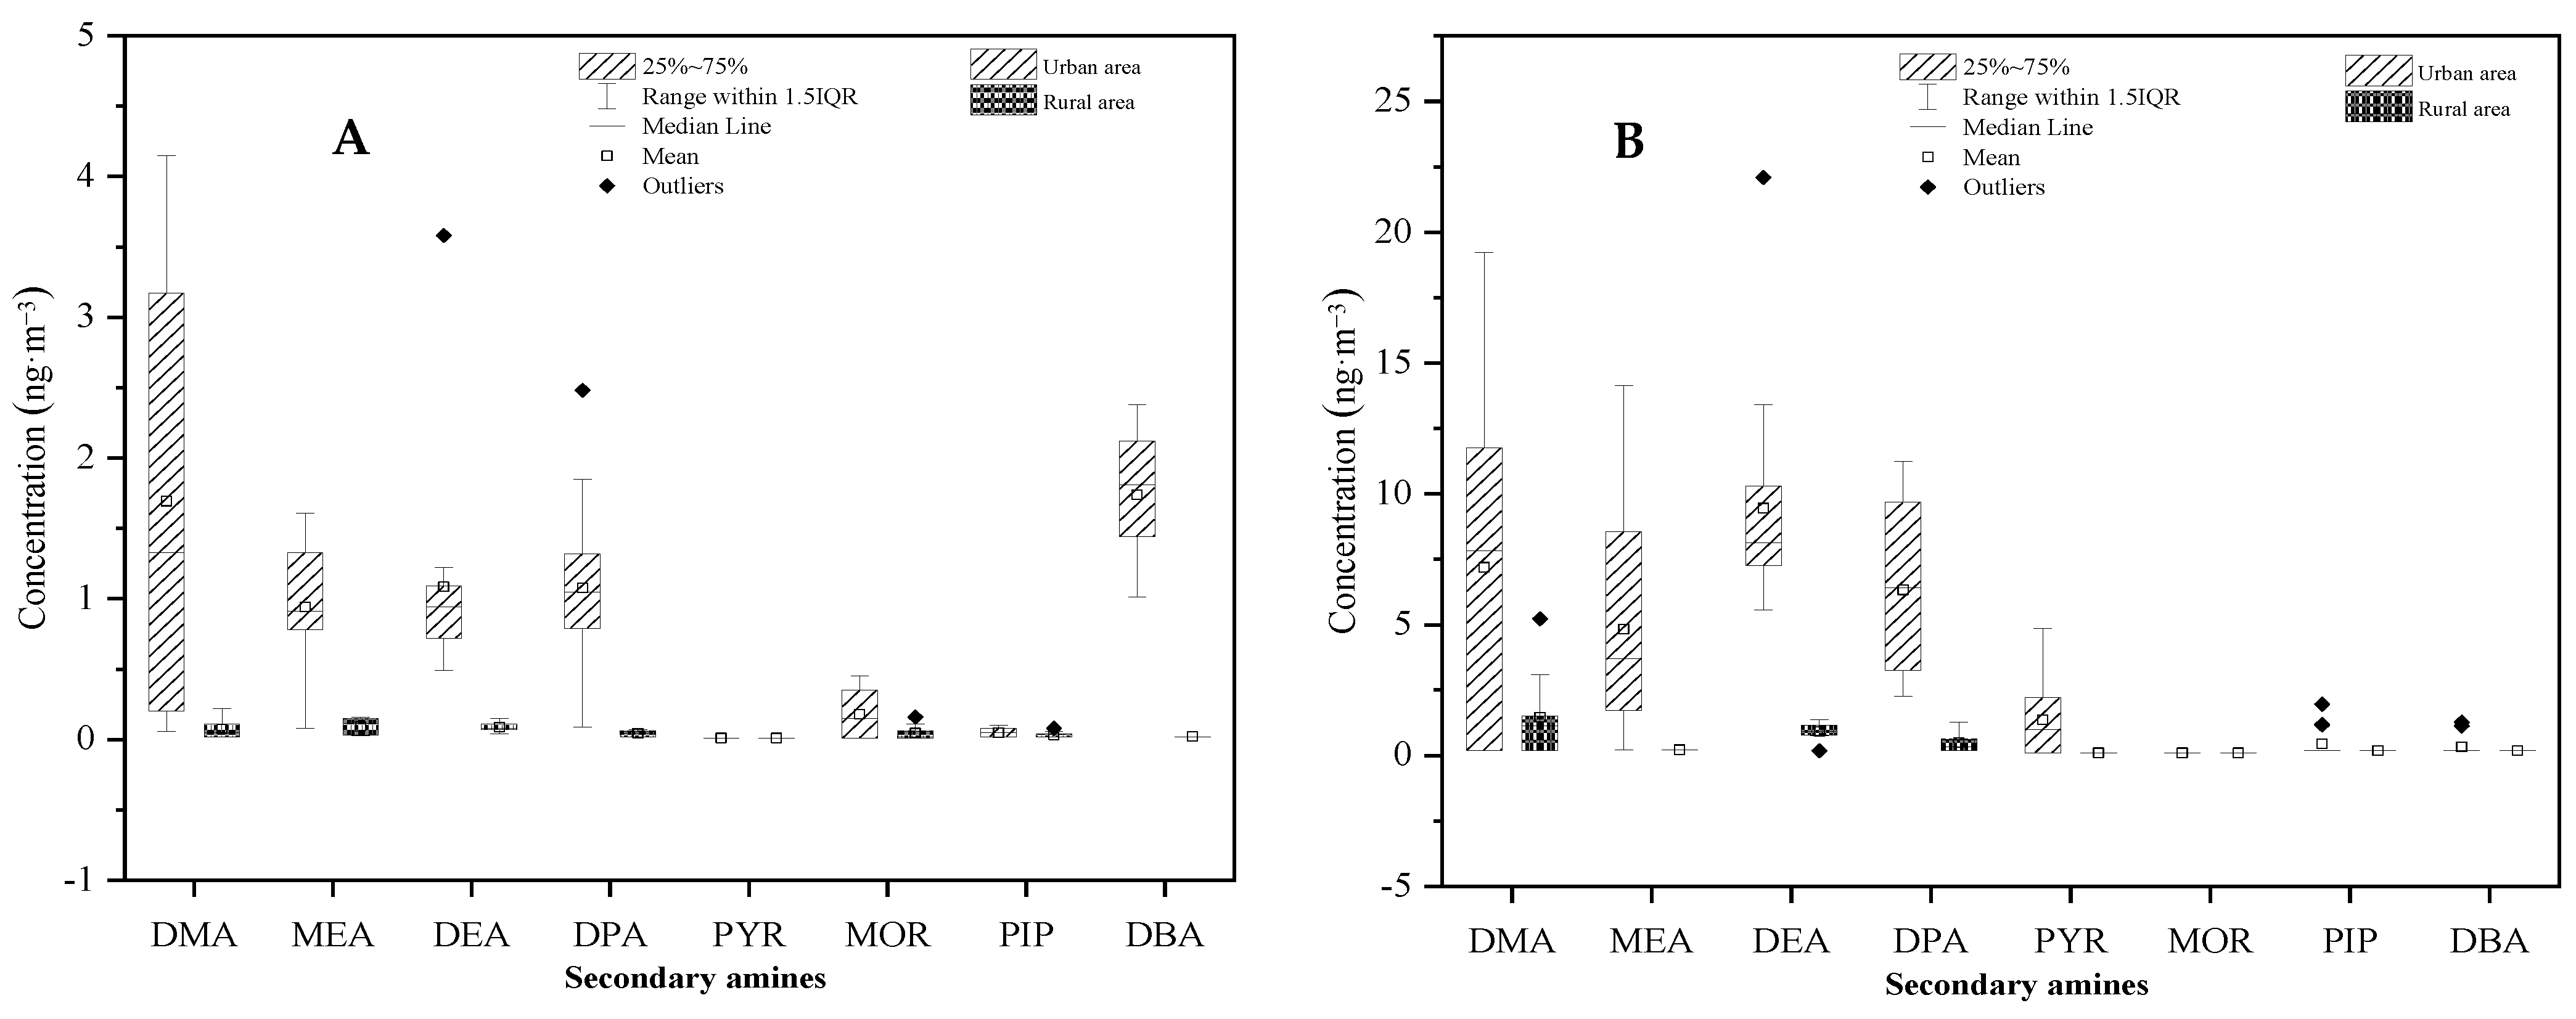
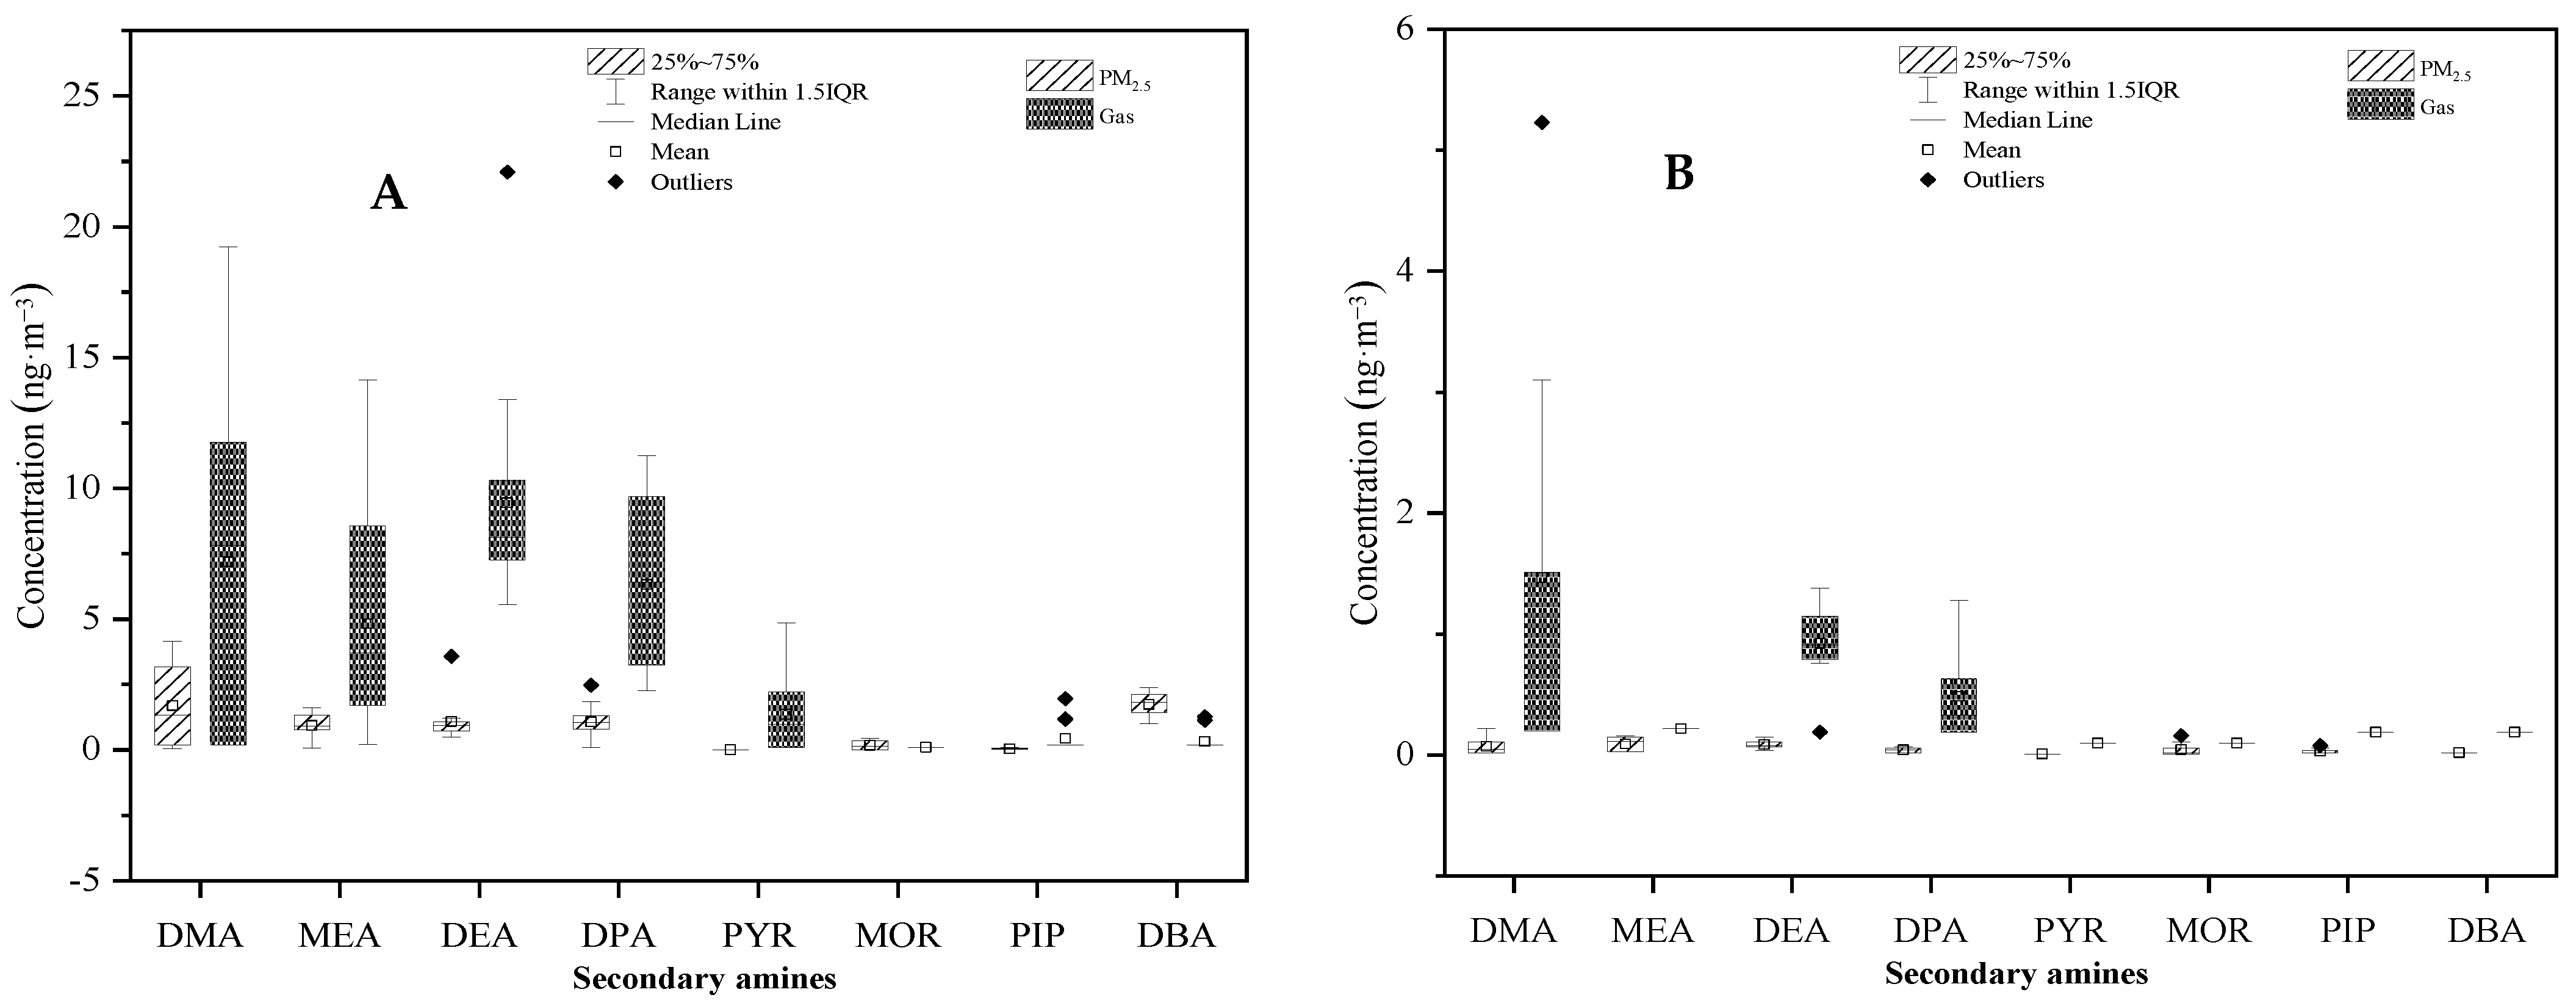
3.5. Analysis of Real Samples

Chromatograms of SAs are shown in Figure 8, and peak identification was based on the direct comparison of retention times between a standard and the samples. Clearly, the peak areas of SAs in the gaseous samples were higher than those in the PM2.5 sample, although the gaseous samples were collected at a flow rate lower than the particulate samples (2 L·min−1 vs. 16.7 L·min−1). For individual species, the percentages of SA detection (>MDL) are shown in Table 6. Most SAs in the gaseous and particulate phases were found in urban samples, except PYR, MOR, and PIP, while DMA, DEA, and DPA were the most frequently observed SAs in rural areas.
As shown in Table 7, gaseous SAs were the dominant species, especially in urban areas. This is because SAs are relatively volatile and have high vapor pressure. The mean concentrations ± standard deviations of gaseous DMA, MEA, DEA, and DPA in the urban area were (in ng·m−3) 7.19 ± 6.59, 4.83 ± 3.95, 9.46 ± 4.04, and 6.33 ± 3.12, respectively (Table 7), while those in the rural area were (in ng·m−3) 1.47 ± 1.59, < MDL, 0.92 ± 0.33, and 0.49 ± 0.39, respectively (Table 7). The mean concentration ± standard deviations of DMA, MEA, DEA, and DPA in the PM2.5 samples in the urban atmosphere were (in ng·m−3) 1.69 ± 1.54, 0.94 ± 0.45, 1.08 ± 0.72, and 1.08 ± 0.52, respectively (Table 7). Those measured in the rural atmosphere were (in ng·m−3) 0.07 ± 0.06, 0.09 ± 0.06, 0.08 ± 0.04, and 0.04 ± 0.02, respectively (Table 7). The total detected SA concentration in gaseous phase was 29.9 ±20.1 ng·m−3 in the urban atmosphere, and 2.88 ± 2.31 ng·m−3 in the rural site. These measured in PM2.5 samples was 6.90 ± 4.17 ng·m−3 in the urban atmosphere, and 0.33 ± 0.23 ng·m−3 in the rural site. It is clearly shown that DMA, MEA, DEA, and DPA were the greatest contributors to the total concentration of SAs in the atmosphere, accounting for 70% of the total concentration.
Table 8 compares the concentrations of SAs in particulate and gaseous samples in this study with previous studies. The concentrations of DMA measured in gaseous samples at urban sites in Shanghai, China and Helsinki, Finland were 5- to 10-times higher than that observed in the urban environment in this study [47,48]. However, at other locations, such as downtown Toronto, Canada, the mean concentration of DMA measured in gaseous samples of the urban atmosphere in this study was much higher than that reported by a previous study [49]. The concentrations of gaseous DMA observed in the urban and rural areas in this study were lower than that measured in gaseous samples in a rural (agricultural) area of Egbert, Canada in 2010 [50]. Furthermore, the average concentration of DMA in PM2.5 samples obtained in the urban area in this study was less than half of that found in PM2.5 in other cities in China measured in 2015–2016 and Singapore in 2014 [41,51,52], but was similar to that in Seoul (2.72 ± 1.49 ng·m−3) [28].
Gaseous SAs have short lifetimes (4.3 h for DMA) in the air [53]; thus, they can limit the transfer of collected samples to the laboratory. In addition, because there is not a substantial number of plants in urban areas, the major source of gaseous SAs in this study would be direct emission from vehicle exhaust and residential activities [54]. Furthermore, they participate in aerosol formation, contributing to new particle formation and growth via the nucleation and accumulation stages [55,56,57].
Student’s t-tests were conducted to determine the differences in mean SAs concentrations between the urban and rural areas, and between PM2.5 and the gaseous phase. As shown in Figure 9, SAs concentrations measured in the urban atmosphere were significantly higher than those measured in the rural atmosphere with p < 0.01. In addition, it was clearly demonstrated that SAs concentrations between PM2.5 and gaseous phases were significantly different, with p < 0.01 for both urban and rural areas (Figure 10). The higher concentration in the urban area than the rural area could be attributed to more emission sources, such as vehicles, in the area. A more sophisticated design is necessary to determine the causal relationship of SAs concentration with other factors, including meteorology parameters (temperature, humidity, and light intensity) and precursors (HONO and hydroxyl radical).

4. Conclusions

Chemical transformation of secondary amines to halogen-containing derivatives using pentafluorobenzenesulfonyl chloride greatly improved the selectivity and sensitivity of the gas chromatographic analysis. Furthermore, temperature programs of the inlet and detector, and the makeup gas flow rate additionally contributed to the enhancement of analytical efficiency. Moreover, using a mixture of silica gel and sulfamic acid was found to be suitable for collecting gaseous secondary amines in the air. The experimental results indicated that the proposed methods are satisfactorily applicable to the qualitative and quantitative determination of SAs at the levels of ng·m−3 in the atmosphere due to their effective selectivity, higher sensitivity, and resolution in comparison to previous studies. Based on the results obtained from the analysis of field samples, DMA, MEA, DEA, and DPA in both phases were the most frequently encountered compounds in urban and rural areas. Secondary amine concentrations detected in gaseous phase samples were significantly higher than those measured in PM2.5, possibly because of their high vapor pressures. In addition, their concentrations were found to be higher in the urban area than in the rural area, indicating the existence of more significant sources in urban areas.

Author Contributions

T.T.H.M. worked on sample collection, analysis, and writing of the original draft; H.K. managed the research work and revised the draft. All authors have read and agreed to the published version of the manuscript.

Funding

This work was supported by the National Research Foundation of Korea (NRF) grant funded by the Korean government (MSIT) (No. 2019R1F1A105908013). This work was also supported by the Ministry of Environment as ‘the Graduate School of Particulate Matter Specialization.’ The authors would like to give thanks for the funding.

Conflicts of Interest

The authors declare no conflict of interest.

References

  1. Kameda, T. Atmospheric Chemistry of Polycyclic Aromatic Hydrocarbons and Related Compounds. J. Health Sci. 2011, 57, 504–511. [Google Scholar] [CrossRef] [Green Version]
  2. Liu, P.; Song, M.; Zhao, T.; Gunthe, S.S.; Ham, S.; He, Y.; Qin, Y.M.; Gong, Z.; Amorim, J.C.; Bertram, A.K.; et al. Resolving the Mechanisms of Hygroscopic Growth and Cloud Condensation Nuclei Activity for Organic Particulate Matter. Nat. Commun. 2018, 9, 4076. [Google Scholar] [CrossRef] [PubMed] [Green Version]
  3. Müller, A.; Miyazaki, Y.; Tachibana, E.; Kawamura, K.; Hiura, T. Evidence of a Reduction in Cloud Condensation Nuclei Activity of Water-Soluble Aerosols Caused by Biogenic Emissions in a Coolerate Forest. Sci. Rep. 2017, 7, 1–9. [Google Scholar] [CrossRef] [PubMed]
  4. Duan, J.; Lyu, R.; Wang, Y.; Xie, X.; Wu, Y.; Tao, J.; Cheng, T.; Liu, Y.; Peng, Y.; Zhang, R.; et al. Particle Liquid Water Content and Aerosol Acidity Acting as Indicators of Aerosol Activation Changes in Cloud Condensation Nuclei (CCN) during Pollution Eruption in Guangzhou of South China. Aerosol Air Qual. Res. 2019, 19, 2662–2670. [Google Scholar] [CrossRef]
  5. Angeling, S.; Suess, D.T.; Prather, K.A. Formation of Aerosol Particles from Reactions of Secondary and Tertiary Alkylamines: Characterization by Aerosol Time-of-Flight Mass Spectrometry. Environ. Sci. Technol. 2001, 35, 3130–3138. [Google Scholar] [CrossRef]
  6. Murphy, S.M.; Sorooshian, A.; Kroll, J.H.; Ng, N.L.; Chhabra, P.; Tong, C.; Surratt, J.D.; Knipping, E. Secondary Aerosol Formation from Atmospheric Reactions of Aliphatic Amines. Atmos. Chem. Phys. 2007, 7, 2313–2337. [Google Scholar] [CrossRef] [Green Version]
  7. Wang, Y.; Xin, J.; Li, Z.; Wang, S.; Wang, P.; Hao, W.M.; Nordgren, B.L.; Chen, H.; Wang, L.; Sun, Y. Seasonal Variations in Aerosol Optical Properties over China. J. Geophys. Res. Atmos. 2011, 116, 1–14. [Google Scholar] [CrossRef]
  8. Smith, J.N.; Barsantia, K.C.; Friedlia, H.R.; Ehnd, M.; Kulmala, M.; Collins, D.R.; Scheckman, J.H.; Williams, B.J.; McMurry, P.H. Observations of Aminium Salts in Atmospheric Nanoparticles and Possible Climatic Implications. Proc. Natl. Acad. Sci. USA 2010, 107, 6634–6639. [Google Scholar] [CrossRef] [Green Version]
  9. Qiu, C.; Zhang, R. Multiphase Chemistry of Atmospheric Amines. Phys. Chem. Chem. Phys. 2013, 15, 5738–5752. [Google Scholar] [CrossRef]
  10. Chan, L.P.; Chan, C.K. Displacement of Ammonium from Aerosol Particles by Uptake of Triethylamine. Aerosol Sci. Technol. 2012, 46, 236–247. [Google Scholar] [CrossRef] [Green Version]
  11. Ge, X.; Wexler, A.S.; Clegg, S.L. Atmospheric Amines-Part I. A Review. Atmos. Environ. 2011, 45, 524–546. [Google Scholar] [CrossRef]
  12. Jen, C.N.; Bachman, R.; Zhao, J.; Mcmurry, P.H.; Hanson, D.R. Diamine-Sulfuric Acid Reactions Are a Potent Source of New Particle Formation. Geophys. Res. Lett. 2016, 43, 867–873. [Google Scholar] [CrossRef] [Green Version]
  13. Li, Z.; Zhou, R.; Wang, Y.; Wang, G.; Chen, M.; Li, Y.; Wang, Y.; Yi, Y.; Hou, Z.; Guo, Q.; et al. Characteristics and Sources of Amine-Containing Particles in the Urban Atmosphere of Liaocheng, a Seriously Polluted City in North China during the COVID-19 Outbreak. Environ. Pollut. 2021, 289, 117887. [Google Scholar] [CrossRef] [PubMed]
  14. Westerholm, R.; Li, H.; Almén, J. Estimation of Aliphatic Amine Emissions in Automobile Exhausts. Chemosphere 1993, 27, 1381–1384. [Google Scholar] [CrossRef]
  15. Cadle, S.H.; Mulawa, P.A. Low-Molecular-Weight Aliphatic Amines in Exhaust from Catalyst-Equipped Cars. Environ. Sci. Technol. 1980, 14, 718–723. [Google Scholar] [CrossRef]
  16. Ábalos, M.; Bayona, J.M.; Ventura, F. Development of a Solid-Phase Microextraction GC-NPD Procedure for the Determination of Free Volatile Amines in Wastewater and Sewage-Polluted Waters. Anal. Chem. 1999, 71, 3531–3537. [Google Scholar] [CrossRef]
  17. Schade, G.W.; Crutzen, P.J. Emission of Aliphatic Amines from Animal Husbandry and Their Reactions: Potential Source of N2O and HCN. J. Atmos. Chem. 1995, 22, 319–346. [Google Scholar] [CrossRef]
  18. Chang, Y.; Gao, Y.; Lu, Y.; Qiao, L.; Kuang, Y.; Cheng, K.; Wu, Y.; Lou, S.; Jing, S.; Wang, H.; et al. Discovery of a Potent Source of Gaseous Amines in Urban China. Environ. Sci. Technol. Lett. 2021, 8, 725–731. [Google Scholar] [CrossRef]
  19. Zhang, Q.; Anastasio, C. Free and Combined Amino Compounds in Atmospheric Fine Particles (PM2.5) and Fog Waters from Northern California. Atmos. Environ. 2003, 37, 2247–2258. [Google Scholar] [CrossRef]
  20. U.S. Department of Health and Human Services. Report on Carcinogens, 12th ed.; National Toxicology Program; U.S. Department of Health and Human Services, Public Health Service, National Institutes of Health: Research Triangle Park, NC, USA, 2011; pp. 1–498.
  21. Huang, Y.; Chen, H.; Wang, L.; Yang, X.; Chen, J. Single Particle Analysis of Amines in Ambient Aerosol in Shanghai. Environ. Chem. 2012, 9, 202–210. [Google Scholar] [CrossRef] [Green Version]
  22. Gunsch, M.J.; Liu, J.; Moffett, C.E.; Sheesley, R.J.; Wang, N.; Zhang, Q.; Watson, T.B.; Pratt, K.A. Diesel Soot and Amine-Containing Organic Sulfate Aerosols in an Arctic Oil Field. Environ. Sci. Technol. 2020, 54, 92–101. [Google Scholar] [CrossRef] [PubMed]
  23. You, Y.; Kanawade, V.P.; De Gouw, J.A.; Guenther, A.B.; Madronich, S.; Sierra-Hernández, M.R.; Lawler, M.; Smith, J.N.; Takahama, S.; Ruggeri, G.; et al. Atmospheric Amines and Ammonia Measured with a Chemical Ionization Mass Spectrometer (CIMS). Atmos. Chem. Phys. 2014, 14, 12181–12194. [Google Scholar] [CrossRef] [Green Version]
  24. Smith, J.; Stark, H.; Browne, E.; Hanson, D. HI-SCALE Nanoparticle Composition and Precursors Field Campaign Report; DOE/SC-ARM-17-023; Stafford, R., ARM Climate Research Facility, Eds.; DOE Office of Science Atmospheric Radiation Measurement (ARM) Program: Barrow, Alaska, 2017.
  25. Sorooshian, A.; Murphy, S.M.; Hersey, S.; Gates, H.; Padro, L.T.; Nenes, A.; Brechtel, F.J.; Jonsson, H.; Flagan, R.C.; Seinfeld, J.H. Comprehensive Airborne Characterization of Aerosol from a Major Bovine Source. Atmos. Chem. Phys. 2008, 8, 5489–5520. [Google Scholar] [CrossRef] [Green Version]
  26. Chen, T.; Ge, Y.; Liu, Y.; He, H. N-Nitration of Secondary Aliphatic Amines in the Particle Phase. Chemosphere 2022, 293, 133639. [Google Scholar] [CrossRef]
  27. Parshintsev, J.; Rönkkö, T.; Helin, A.; Hartonen, K.; Riekkola, M.L. Determination of Atmospheric Amines by On-Fiber Derivatization Solid-Phase Microextraction with 2,3,4,5,6-Pentafluorobenzyl Chloroformate and 9-Fluorenylmethoxycarbonyl Chloride. J. Chromatogr. A 2015, 1376, 46–52. [Google Scholar] [CrossRef]
  28. Choi, N.R.; Lee, J.Y.; Ahn, Y.G.; Kim, Y.P. Determination of Atmospheric Amines at Seoul, South Korea via Gas Chromatography/Tandem Mass Spectrometry. Chemosphere 2020, 258, 127367. [Google Scholar] [CrossRef]
  29. Liu, X.; Wang, H.; Liang, S.; Zhang, H. Determination of Primary and Secondary Aliphatic Amines by Reversed-Phase High-Performance Liquid Chromatography. Anal. Chim. Acta 2001, 441, 45–52. [Google Scholar] [CrossRef]
  30. Huang, X.; Deng, C.; Zhuang, G.; Lin, J.; Xiao, M. Quantitative Analysis of Aliphatic Amines in Urban Aerosols Based on Online Derivatization and High Performance Liquid Chromatography. Environ. Sci. Process. Impacts 2016, 18, 796–801. [Google Scholar] [CrossRef]
  31. Zhou, S.; Lin, J.; Qin, X.; Chen, Y.; Deng, C. Determination of Atmospheric Alkylamines by Ion Chromatography Using 18-Crown-6 as Mobile Phase Additive. J. Chromatogr. A 2018, 1563, 154–161. [Google Scholar] [CrossRef]
  32. Hermans, C.; Jonkers, A.C.A.; De Bokx, P.K. Determination of Amines in the Presence of Excess Ammonia by Ion Chromatography-Mass Spectrometry. J. Chromatogr. Sci. 2010, 48, 544–548. [Google Scholar] [CrossRef] [Green Version]
  33. Kataoka, H. Derivatization Reactions for the Determination of Amines by Gas Chromatography and Their Applications in Environmental Analysis. J. Chromatogr. A 1996, 733, 19–34. [Google Scholar] [CrossRef]
  34. de Zeeuw, J.; Luong, J. Developments in Stationary Phase Technology for Gas Chromatography. TrAC-Trends Anal. Chem. 2002, 21, 594–607. [Google Scholar] [CrossRef]
  35. de Zeeuw, J.; Stricek, R.; Stidsen, G. An Advanced Base-Deactivated Capillary Column for Analysis of Volatile Amines, Ammonia, and Alcohols. Am. Lab. 2011, 43, 37–40. [Google Scholar]
  36. Ferreira, A.M.C.; Laespada, M.E.F.; Pavón, J.L.P.; Cordero, B.M. In Situ Aqueous Derivatization as Sample Preparation Technique for Gas Chromatographic Determinations. J. Chromatogr. A 2013, 1296, 70–83. [Google Scholar] [CrossRef] [PubMed]
  37. Danielson, N.D.; Gallagher, P.A.; Bao, J.J. Chemical Reagents and Derivatization Procedures in Drug Analysis. Encycl. Anal. Chem. 2008, 7042–7076. [Google Scholar] [CrossRef]
  38. Płotka-Wasylka, J.M.; Morrison, C.; Biziuk, M.; Namieśnik, J. Chemical Derivatization Processes Applied to Amine Determination in Samples of Different Matrix Composition. Chem. Rev. 2015, 115, 4693–4718. [Google Scholar] [CrossRef] [Green Version]
  39. Poole, C.F. Derivatization Reactions for Use with the Electron-Capture Detector. J. Chromatogr. A 2013, 1296, 15–24. [Google Scholar] [CrossRef]
  40. Tao, X.; Liu, Y.; Wang, Y.; Qiu, Y.; Lin, J.; Zhao, A.; Su, M.; Jia, W. GC-MS with Ethyl Chloroformate Derivatization for Comprehensive Analysis of Metabolites in Serum and Its Application to Human Uremia. Anal. Bioanal. Chem. 2008, 391, 2881–2889. [Google Scholar] [CrossRef]
  41. Cheng, G.; Hu, Y.; Sun, M.; Chen, Y.; Chen, Y.; Zong, C.; Chen, J.; Ge, X. Characteristics and Potential Source Areas of Aliphatic Amines in PM2.5 in Yangzhou, China. Atmos. Pollut. Res. 2020, 11, 296–302. [Google Scholar] [CrossRef]
  42. Akyüz, M. Simultaneous Determination of Aliphatic and Aromatic Amines in Ambient Air and Airborne Particulate Matters by Gas Chromatography-Mass Spectrometry. Atmos. Environ. 2008, 42, 3809–3819. [Google Scholar] [CrossRef]
  43. Rittenbach, K.; Sloley, B.D.; Ling, L.; Coutts, R.T.; Shan, J.; Baker, G.B. A Rapid, Sensitive Electron-Capture Gas Chromatographic Procedure for Analysis of Metabolites of N-Methyl,N-Propargylphenylethylamine, a Potential Neuroprotective Agent. J. Pharmacol. Toxicol. Methods 2005, 52, 373–378. [Google Scholar] [CrossRef] [PubMed]
  44. Asghar, S.J.; Baker, G.B.; Rauw, G.A.; Silverstone, P.H. A Rapid Method of Determining Amphetamine in Plasma Samples Using Pentafluorobenzenesulfonyl Chloride and Electron-Capture Gas Chromatography. J. Pharmacol. Toxicol. Methods 2001, 46, 111–115. [Google Scholar] [CrossRef]
  45. Hornung, R.W.; Reed, L.D. Nondetectable Values Estimation of Average Concentration in the Presence of Nondetectable Values. Appl. Occup. Environ. Hyg. 1990, 5, 46–51. [Google Scholar] [CrossRef]
  46. Verriele, M.; Plaisance, H.; Depelchin, L.; Benchabane, S.; Locoge, N.; Meunier, G. Determination of 14 Amines in Air Samples Using Midget Impingers Sampling Followed by Analysis with Ion Chromatography in Tandem with Mass Spectrometry. J. Environ. Monit. 2012, 14, 402–408. [Google Scholar] [CrossRef]
  47. Yao, L.; Wang, M.Y.; Wang, X.K.; Liu, Y.J.; Chen, H.F.; Zheng, J.; Nie, W.; Ding, A.J.; Geng, F.H.; Wang, D.F.; et al. Detection of Atmospheric Gaseous Amines and Amides by a High-Resolution Time-of-Flight Chemical Ionization Mass Spectrometer with Protonated Ethanol Reagent Ions. Atmos. Chem. Phys. 2016, 16, 14527–14543. [Google Scholar] [CrossRef] [Green Version]
  48. Hellén, H.; Kieloaho, A.J.; Hakola, H. Gas-Phase Alkyl Amines in Urban Air; Comparison with a Boreal Forest Site and Importance for Local Atmospheric Chemistry. Atmos. Environ. 2014, 94, 192–197. [Google Scholar] [CrossRef]
  49. Vandenboer, T.C.; Petroff, A.; Markovic, M.Z.; Murphy, J.G. Size Distribution of Alkyl Amines in Continental Particulate Matter and Their Online Detection in the Gas and Particle Phase. Atmos. Chem. Phys. 2011, 11, 4319–4332. [Google Scholar] [CrossRef] [Green Version]
  50. VandenBoer, T.C.; Markovic, M.Z.; Petroff, A.; Czar, M.F.; Borduas, N.; Murphy, J.G. Ion Chromatographic Separation and Quantitation of Alkyl Methylamines and Ethylamines in Atmospheric Gas and Particulate Matter Using Preconcentration and Suppressed Conductivity Detection. J. Chromatogr. A 2012, 1252, 74–83. [Google Scholar] [CrossRef]
  51. Shen, W.; Ren, L.; Zhao, Y.; Zhou, L.; Dai, L.; Ge, X.; Kong, S.; Yan, Q.; Xu, H.; Jiang, Y.; et al. C1-C2 Alkyl Aminiums in Urban Aerosols: Insights from Ambient and Fuel Combustion Emission Measurements in the Yangtze River Delta Region of China. Environ. Pollut. 2017, 230, 12–21. [Google Scholar] [CrossRef]
  52. Majedi, S.M.; Lee, H.K. Combined Dispersive Solid-Phase Extraction-Dispersive Liquid–Liquid Microextraction-Derivatization for Gas Chromatography–Mass Spectrometric Determination of Aliphatic Amines on Atmospheric Fine Particles. J. Chromatogr. A 2017, 1486, 86–95. [Google Scholar] [CrossRef]
  53. Tzitzikalaki, E.; Kalivitis, N.; Kanakidou, M. Observations of Gas-Phase Alkylamines at a Coastal Site in the East Mediterranean Atmosphere. Atmosphere 2021, 12, 1454. [Google Scholar] [CrossRef]
  54. Ge, X.; Wexler, A.S.; Clegg, S.L. Atmospheric Amines e Part II. Thermodynamic Properties and Gas/Particle Partitioning Total: 187. Atmos. Environ. 2011, 45, 561–577. [Google Scholar] [CrossRef]
  55. Kulmala, M.; Kontkanen, J.; Junninen, H.; Lehtipalo, K.; Manninen, H.E.; Nieminen, T.; Petäjä, T.; Sipilä, M.; Schobesberger, S.; Rantala, P.; et al. Direct Observations of Atmospheric Aerosol Nucleation. Science 2013, 339, 943–946. [Google Scholar] [CrossRef] [PubMed]
  56. Yu, H.; McGraw, R.; Lee, S.H. Effects of Amines on Formation of Sub-3 Nm Particles and Their Subsequent Growth. Geophys. Res. Lett. 2012, 39, 3–7. [Google Scholar] [CrossRef] [Green Version]
  57. Zhang, R.; Khalizov, A.; Wang, L.; Hu, M.; Xu, W. Nucleation and Growth of Nanoparticles in the Atmosphere. Chem. Rev. 2012, 112, 1957–2011. [Google Scholar] [CrossRef] [PubMed]
Figure 1. Chemical structures of eight secondary amines.
Atmosphere 13 00664 g001
Figure 2. Sites for collecting gaseous phase and particulate phase samples in the SA analyses: (A) urban area, and (B) rural area.
Atmosphere 13 00664 g002
Figure 3. Process for derivatization of secondary amines.
Atmosphere 13 00664 g003
Figure 4. Comparison of reaction time for derivatization (n = 3).
Atmosphere 13 00664 g004
Figure 5. Comparison of chromatographic responses to the derivatives of SAs among three different solvents (n = 3).
Atmosphere 13 00664 g005
Figure 6. Comparison of temperature to the selectivity of GC-ECD: (A) inlet and (B) detector.
Atmosphere 13 00664 g006
Figure 7. Effect of the makeup gas flow rate on the sensitivity of ECD.
Atmosphere 13 00664 g007
Figure 8. Chromatogram of eight secondary amines and a surrogate standard (EBA) in (A) a blank, (B) a standard (30 pg), (C) a PM2.5 sample, and (D) a gaseous sample. EBA* stands for ethylbutylamine used as a surrogate standard.
Atmosphere 13 00664 g008
Figure 9. Comparison of secondary amine concentrations between urban and rural areas in (A) PM2.5 and (B) the gaseous phase.
Atmosphere 13 00664 g009
Figure 10. Comparison of secondary amine concentrations between PM2.5 and the gaseous phase in (A) urban and (B) rural areas.
Atmosphere 13 00664 g010
Table 1. Sampling and extraction efficiencies of gaseous SAs (unit: %).
Secondary AminesFront CartridgeBackup Cartridge
The First ExtractionThe Second ExtractionThe First ExtractionThe Second Extraction
DMA99.5 ± 0.70.06 ± 0.080.41 ± 0.580
MEA97.5 ± 1.20.95 ± 0.250.81 ± 0.010.71 ± 1.00
DEA99.2 ± 1.20.25 ± 0.350.49 ± 0.700.11± 0.15
DPA98.3 ± 2.40.66 ± 0.941.06 ± 1.500
PYR100000
MOR100000
PIP97.8 ± 2.71.51 ± 2.130.73± 0.610
DBA82.2 ± 3.717.7± 3.6900
The values are expressed as mean ± standard deviation.
Table 2. Extraction efficiencies of PM2.5 SAs (unit: %).
Secondary AminesThe First ExtractionThe Second Extraction
DMA1000
MEA1000
DEA93.9 ± 2.56.10 ± 2.5
DPA1000
PYR98.1 ± 2.21.94 ± 2.19
MOR95.8 ± 7.34.23 ± 7.33
PIP99.0 ± 1.81.05 ± 1.81
DBA87.7 ± 3.912.3 ± 3.96
The values are expressed as mean ± standard deviation.
Table 3. Linearity, method detection limit (MDL), and limit of quantification (LOQ) of secondary amines.
Secondary Amines PM2.5Gas
Retention Timer2MDL
(ng·m−3)
LOQ
(ng·m−3)
MDL
(ng·m−3)
LOQ
(ng·m−3)
DMA15.6210.99790.0470.1490.3951.241
MEA16.9430.99470.0530.1660.4421.389
DEA18.9420.99540.0460.1440.3841.206
DPA20.1350.99330.0450.1400.3721.167
PYR21.1580.99810.0230.0710.1890.594
MOR21.6460.99290.0240.0770.2040.641
PIP22.2620.99110.0450.1420.3791.190
DBA23.5400.99230.0560.1440.3831.203
Table 4. MDLs of SAs in this study compared to those presented in previous studies.
PhaseSiteSamplerExtraction MethodDerivatizationInstrumentMethod ValidationReference
Gas-Glass impingers
(distilled water)
-No derivatizationIC-MS
(mass spectrometry)
MDL:
50 ng·m−3 (DMA)
10 ng·m−3 (DEA)
3 ng·m−3 (DPA)
Recovery:-
[46]
-Glass impingers
(distilled water)
-No derivatizationIC-CD
(conductivity cell)
MDL:
1200 ng·m−3 (DMA)
1050 ng·m−3 (DPA)
Recovery:-
[46]
Urban and rural, Chuncheon, South KoreaSPE cartridge
(silica gel and sulfamic acid)
SPE
(H2SO4 0.1 N)
PFBSCGC-ECDMDL:0.19~0.44 ng·m−3
Recovery: 91.2~117%
This study
PM2.5
or PM10
Urban Yangzhou, ChinaHigh volume air samplerDLE
(sonication, distilled water)
9-fluorenylmethyl chloroformate (FMOC)HPLC-FLD
(fluorescence detection)
MDL:0.41–0.82 ng·m−3 (DMA)
Recovery: 82.8~98.4%
[41]
Zonguldak, TurkeySequential air samplerDLE
(sonication, HCl 0.1 M)
Isobutyl chloroformateGC-MS
(mass spectrometry)
MDL: 0.015~0.0049 ng·m−3
Recovery: 88.0~97.2%
[42]
Urban and rural, Chuncheon, South KoreaCyclone samplerDLE
(sonication, H2SO4 0.1 N)
PFBSCGC-ECDMDL:0.02~0.05 ng·m−3
Recovery: 81.2~106%
This study
Table 5. Proficiency testing-based recovery and repeatability of SAs using GC-ECD.
Secondary AminesPM2.5Gas
Percent Recovery *RSD
(%)
(n = 7)
Percent Recovery *RSD
(%)
(n = 7)
30 pg
(n = 3)
120 pg
(n = 3)
210 pg
(n = 3)
30 pg
(n = 3)
120 pg
(n = 3)
210 pg
(n = 3)
DMA83.2 ± 2.082.5 ± 4.684.4 ± 3.12.8112 ± 299.6 ± 4.580.4 ± 2.32.0
MEA81.2 ± 2.182.2 ± 0.281.5 ± 2.94.394.3 ± 3.693.1 ± 3.782.1 ± 2.73.1
DEA89.2 ± 3.0110 ± 2106 ± 32.795.0 ± 3.7106 ± 4116 ± 46.9
DPA86.7 ± 1.5114 ± 3101 ± 35.0117 ± 4103 ± 494.1 ± 3.36.0
PYR94.9 ± 3.294.2 ± 3.495.8 ± 13.891.2 ± 1.097.5 ± 4.882.9 ± 2.72.2
MOR103 ± 4.0104 ± 4109 ± 42.4105 ± 496.8 ± 3.6100 ± 56.8
PIP101 ± 4.2113 ± 1108 ± 52.195.3 ± 3.0105 ± 1112 ± 38.3
DBA106 ± 3.6101 ± 492.6 ± 2.80.7104 ± 4102 ± 293.1 ± 4.55.5
*: The values are expressed as mean ± standard deviation.
Table 6. Percentages of SAs detection in the air samples collected.
Secondary AminesUrban Area (15)Rural Area (10)
GasPM2.5GasPM2.5
DMA93.310010070
MEA93.3100_60.0
DEA10010090.0100
DPA10010050.070.0
PYR60.026.7__
MOR_60.0_60.0
PIP20.053.3__
DBA13.3100__
_: Not detected in all samples.
Table 7. Secondary amines concentration (ng·m−3) in the atmosphere.
CompoundUrban Area (15)Rural Area (10)
GasPM2.5GasPM2.5
DMA7.19 ± 6.59
<MDL–19.2
1.69 ± 1.54
0.06–4.15
1.47 ± 1.59
0.49–5.23
0.07 ± 0.06
<MDL–0.12
MEA4.83 ± 3.95
<MDL–9.93
0.94 ± 0.45
0.08–1.61
<MDL0.09 ± 0.06
<MDL–0.16
DEA9.46 ± 4.04
5.56–22.1
1.08 ± 0.72
0.49–3.58
0.92 ± 0.33
<MDL–1.38
0.08 ± 0.04
0.04–0.15
DPA6.33 ± 3.12
2.27–11.24
1.08 ± 0.58
0.09–2.48
0.49 ± 0.39
<MDL–1.28
0.04 ± 0.02
<MDL–0.07
PYR1.37 ± 1.46
<MDL–4.85
0.14 ± 0.17
<MDL–0.4
<MDL<MDL
MOR<MDL0.18 ± 0.17
<MDL–0.45
<MDL0.05 ± 0.05
<MDL–0.16
PIP0.44 ± 0.54
<MDL–1.96
0.05 ± 0.03
<MDL–0.10
<MDL<MDL
DBA0.32 ± 0.36
<MDL–1.27
1.74 ± 0.51
1.01–2.38
<MDL<MDL
The values are expressed as mean ± standard deviation and range.
Table 8. The mean concentrations of SAs found in previous studies.
PhaseSampling SiteNumber of SamplesConcentrationReference
GasUrban area in Shanghai, China
(July–August 2015)
-73.6 ± 26.3 ng·m−3 (DMA)
46.0 ± 23.6 ng·m−3 (DEA)
[47]
Urban in Helsinki, Finland
(May–August 2011)
-43.4 ng·m−3 (DMA)
0.90 ng·m−3 (DEA)
[48]
Downtown Toronto, Canada
(June–July 2009)
8<4.97 ng·m−3 (DMA)[49]
Chuncheon, Korea
(urban)
(June–September 2021)
157.19 ± 6.6 ng·m−3 (DMA)
9.46 ± 4.04 ng·m−3 (DEA)
This study
Egbert, ON, Canada
(rural area)
(October–November 2010)
-11.9 ± 3.9 ng·m−3 (DMA)[50]
Chuncheon, Korea
(rural)
(June–September 2021)
101.47 ± 1.59 ng·m−3 (DMA)
0.92 ± 0.33 ng·m−3 (DEA)
This study
PM2.5Urban in Yangzhou, China
(April–November 2016)
1283.62 ± 3.9 ng·m−3 (DMA)[41]
Urban in Yangtze River Delta region, China
(November 2015–May 2016)
1034.3 ± 2.4 ng·m−3 (DMA)[51]
Urban in Singapore
(September 2014)
-4.16 ng·m−3 (DMA)
1.52 ng·m−3 (DEA)
[52]
Metropolitan Area, Seoul, Korea
(January–December 2018)
1172.72 ± 1.49 ng·m−3 (DMA)
1.31 ± 0.49 ng·m−3 (DEA)
[28]
Chuncheon, Korea
(urban)
(June–July 2009)
151.69 ± 1.54 ng·m−3 (DMA)
1.08 ± 0.72 ng·m−3 (DEA)
This study
Chuncheon, Korea
(rural)
(June–July 2009)
100.07 ± 0.06 ng·m−3 (DMA)
0.08 ± 0.04 ng·m−3 (DEA)
This study
Publisher’s Note: MDPI stays neutral with regard to jurisdictional claims in published maps and institutional affiliations.

