
Source Apportionment and Toxic Potency of PM2.5-Bound Polycyclic Aromatic Hydrocarbons (PAHs) at an Island in the Middle of Bohai Sea, China

Abstract
:1. Introduction
2. Materials and Methods
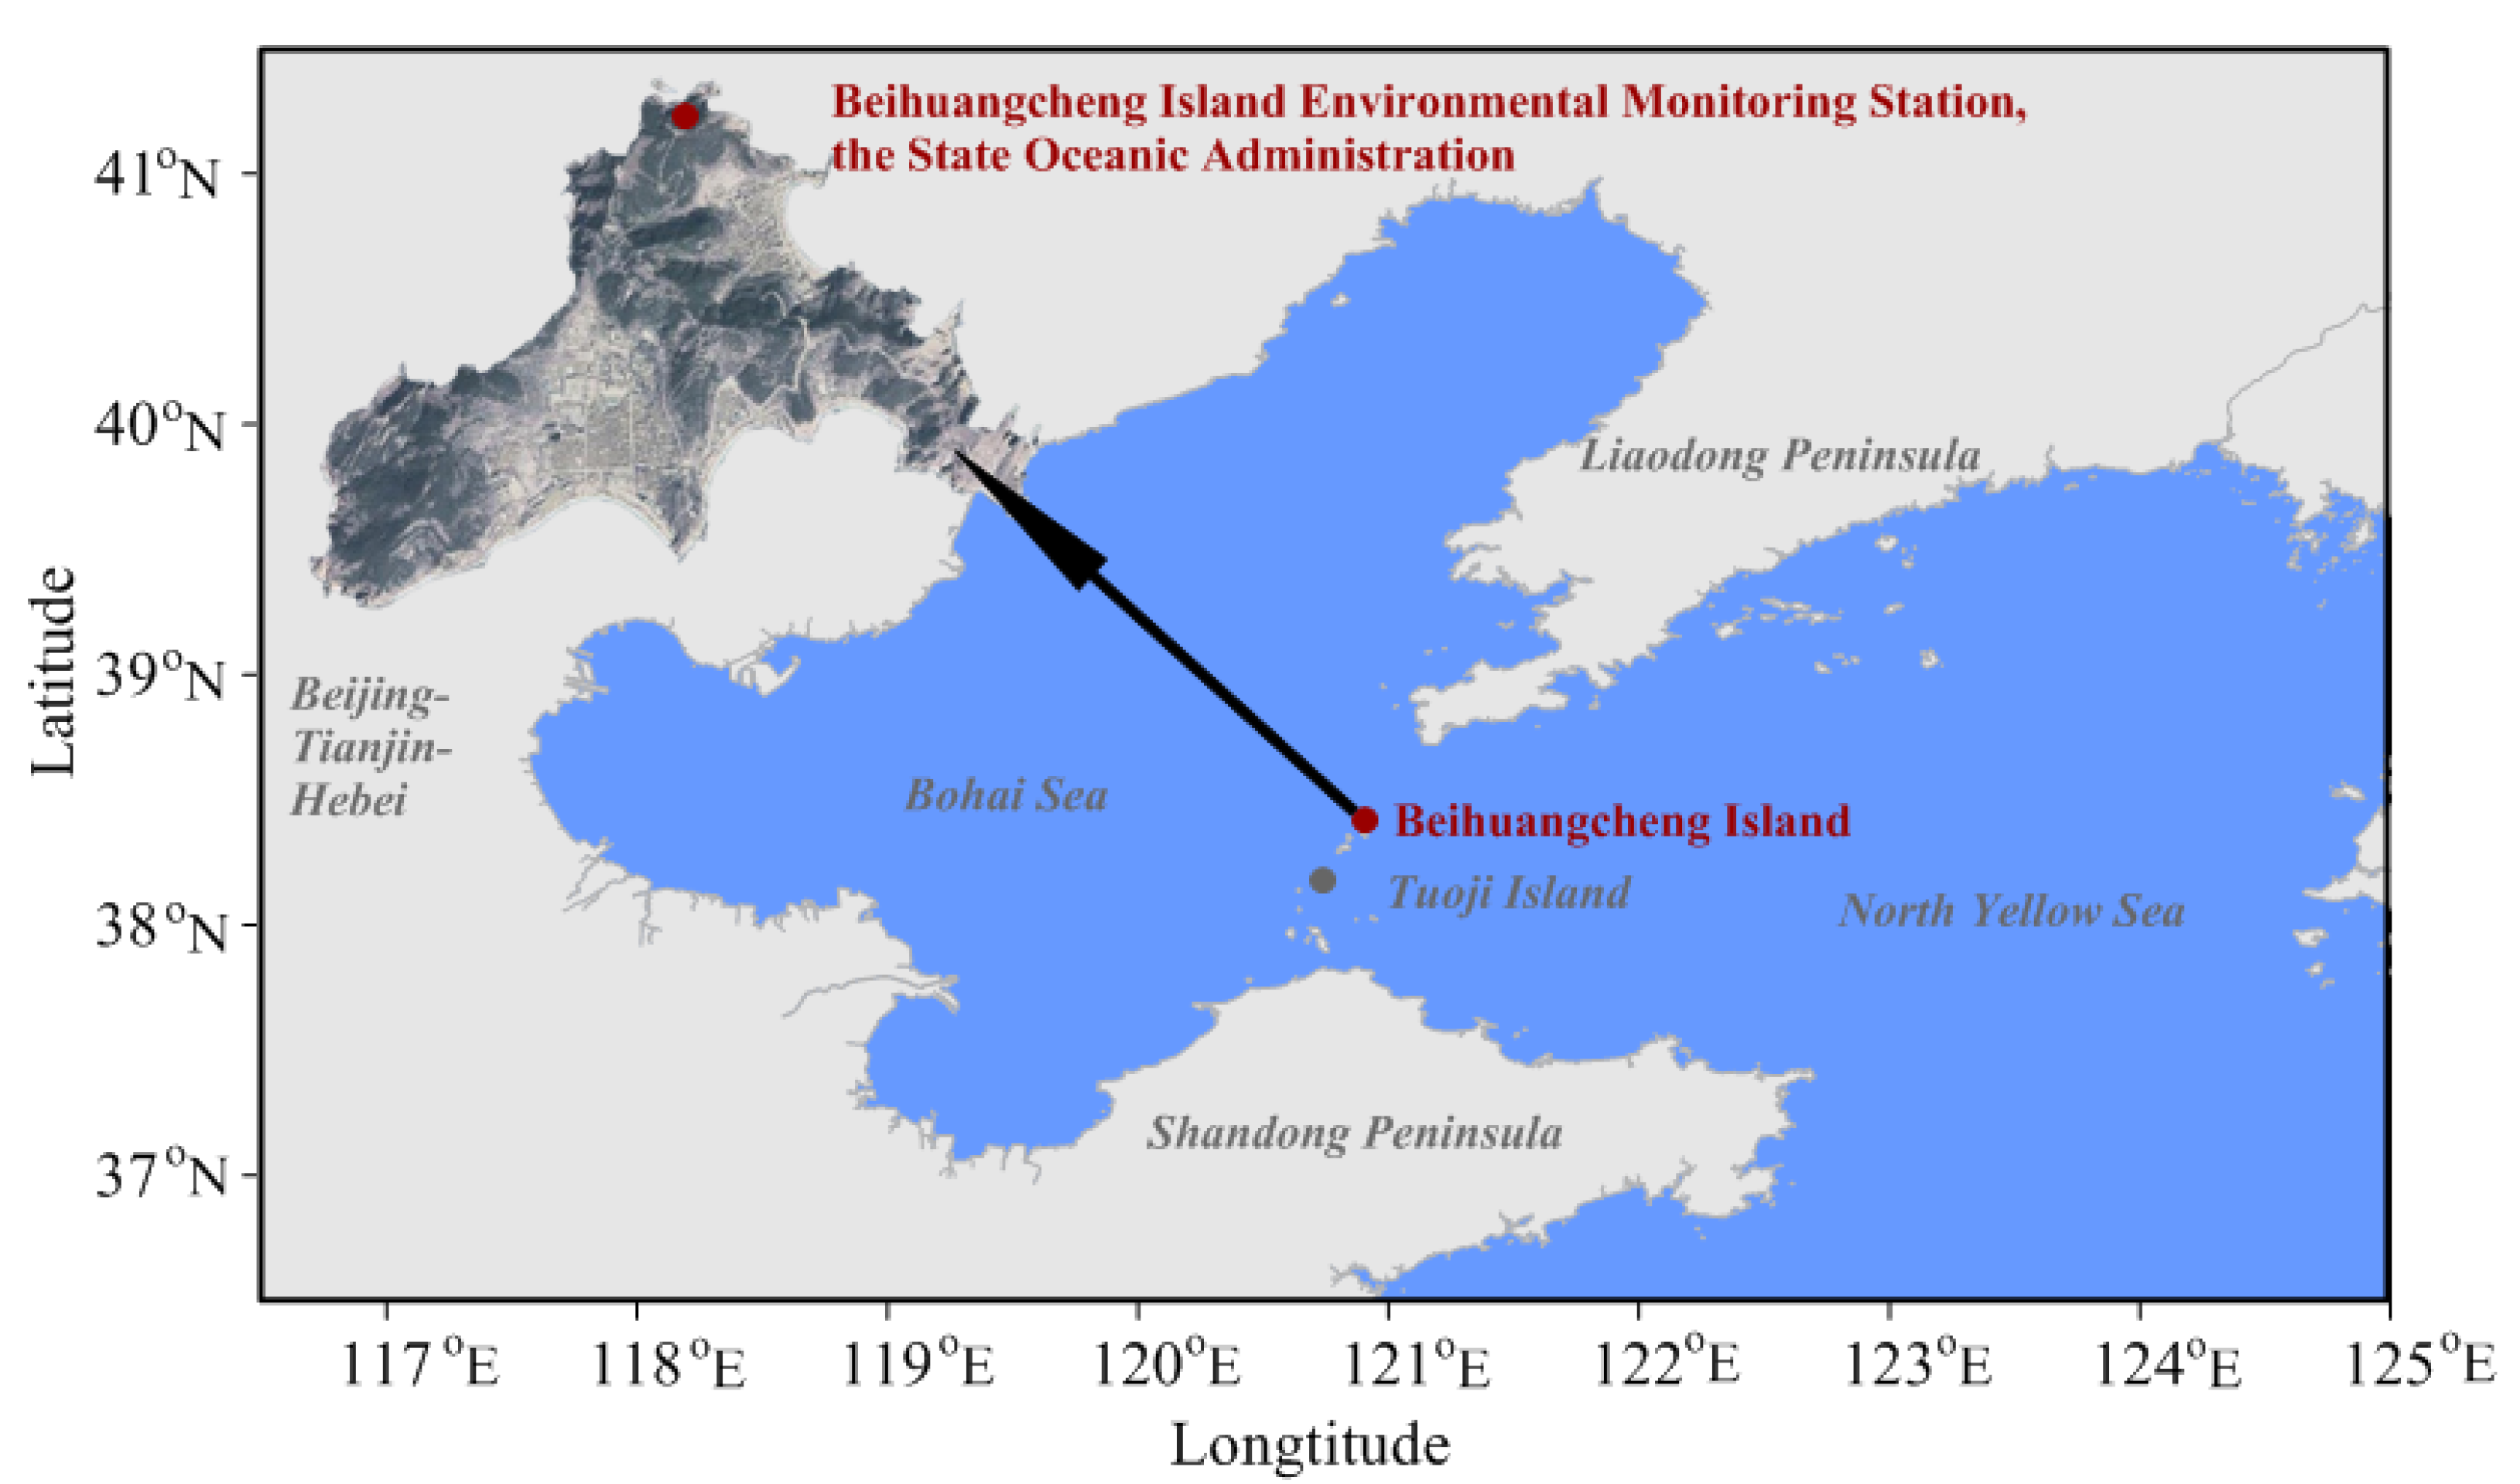
2.1. Site Description and Sample Collection
2.2. Extraction and Analysis of PAHs
2.3. Quality Assurance and Quality Control
2.4. Methods of Source Apportionment
2.5. HYSPLIT Model
2.6. Toxic Potency Assessment of PAHs
3. Results and Discussion
3.1. Concentrations and Compositions of PAHs
3.2. Source Apportionment of PAHs in the Atmosphere
3.3. Toxic Potency of PAHs and Source Contribution
4. Conclusions
Author Contributions
Funding
Institutional Review Board Statement
Informed Consent Statement
Data Availability Statement
Acknowledgments
Conflicts of Interest
References
- Yan, D.; Wu, S.; Zhou, S.; Tong, G.; Li, F.; Wang, Y.; Li, B. Characteristics, sources and health risk assessment of airborne particulate PAHs in Chinese cities: A review. Environ. Pollut. 2019, 248, 804–814. [Google Scholar] [CrossRef] [PubMed]
- Gamboa-Loira, B.; López-Carrillo, L.; Mar-Sánchez, Y.; Stern, D.; Cebrián, M.E. Epidemiologic evidence of exposure to polycyclic aromatic hydrocarbons and breast cancer: A systematic review and meta-analysis. Chemosphere 2022, 290, 133237. [Google Scholar] [CrossRef] [PubMed]
- Nisbet, I.C.T.; Lagoy, P.K. Toxic equivalency factors (TEFs) for polycyclic aromatic hydrocarbons (PAHs). Regul. Toxicol. Pharmacol. 1992, 16, 290–300. [Google Scholar] [CrossRef]
- Ma, L.; Li, B.; Liu, Y.; Sun, X.; Fu, D.; Sun, S.; Thapa, S.; Geng, J.; Qi, H.; Zhang, A.; et al. Characterization, sources and risk assessment of PM2.5-bound polycyclic aromatic hydrocarbons (PAHs) and nitrated PAHs (NPAHs) in Harbin, a cold city in Northern China. J. Clean. Prod. 2020, 264, 121673. [Google Scholar] [CrossRef]
- Wang, X.; Zong, Z.; Tian, C.; Chen, Y.; Luo, C.; Tang, J.; Li, J.; Zhang, G. Assessing on toxic potency of PM2.5-bound polycyclic aromatic hydrocarbons at a national atmospheric background site in North China. Sci. Total Environ. 2018, 612, 330–338. [Google Scholar] [CrossRef]
- Cui, S.; Song, Z.; Zhang, L.; Zhang, Z.; Hough, R.; Fu, Q.; An, L.; Shen, Z.; Li, Y.-F.; Liu, D.; et al. Polycyclic aromatic hydrocarbons in fresh snow in the city of Harbin in northeast China. Atmos. Environ. 2019, 215, 116915. [Google Scholar] [CrossRef]
- Ma, S.; Lin, M.; Tang, J.; Liu, R.; Yang, Y.; Yu, Y.; Li, G.; An, T. Occurrence and fate of polycyclic aromatic hydrocarbons from electronic waste dismantling activities: A critical review from environmental pollution to human health. J. Hazard. Mater. 2022, 424, 127683. [Google Scholar] [CrossRef]
- Shen, H.; Huang, Y.; Wang, R.; Zhu, D.; Li, W.; Shen, G.; Wang, B.; Zhang, Y.; Chen, Y.; Lu, Y.; et al. Global Atmospheric Emissions of Polycyclic Aromatic Hydrocarbons from 1960 to 2008 and Future Predictions. Environ. Sci. Technol. 2013, 47, 6415–6424. [Google Scholar] [CrossRef] [Green Version]
- Zhang, Y.; Tao, S.; Shen, H.; Ma, J. Inhalation exposure to ambient polycyclic aromatic hydrocarbons and lung cancer risk of Chinese population. Proc. Natl. Acad. Sci. USA 2009, 106, 21063–21067. [Google Scholar] [CrossRef] [Green Version]
- Liang, X.; Tian, C.; Zong, Z.; Wang, X.; Jiang, W.; Chen, Y.; Ma, J.; Luo, Y.; Li, J.; Zhang, G. Flux and source-sink relationship of heavy metals and arsenic in the Bohai Sea, China. Environ. Pollut. 2018, 242, 1353–1361. [Google Scholar] [CrossRef]
- Xu, S.; Liu, W.; Tao, S. Emission of Polycyclic Aromatic Hydrocarbons in China. Environ. Sci. Technol. 2006, 40, 702–708. [Google Scholar] [CrossRef] [PubMed]
- Wang, J.-Z.; Zhu, C.-Z.; Chen, T.-H. PAHs in the Chinese environment: Levels, inventory mass, source and toxic potency assessment. Environ. Sci. Process. Impacts 2013, 15, 1104–1112. [Google Scholar] [CrossRef] [PubMed]
- Lian, L.; Huang, T.; Ling, Z.; Li, S.; Li, J.; Jiang, W.; Gao, H.; Tao, S.; Liu, J.; Xie, Z.; et al. Interprovincial trade driven relocation of polycyclic aromatic hydrocarbons and lung cancer risk in China. J. Clean. Prod. 2021, 280, 124368. [Google Scholar] [CrossRef]
- Wang, Y.; Zhang, Q.; Zhang, Y.; Zhao, H.; Tan, F.; Wu, X.; Chen, J. Source apportionment of polycyclic aromatic hydrocarbons (PAHs) in the air of Dalian, China: Correlations with six criteria air pollutants and meteorological conditions. Chemosphere 2019, 216, 516–523. [Google Scholar] [CrossRef] [PubMed]
- Liu, H.; Li, B.; Qi, H.; Ma, L.; Xu, J.; Wang, M.; Ma, W.; Tian, C. Source Apportionment and Toxic Potency of Polycyclic Aromatic Hydrocarbons (PAHs) in the Air of Harbin, a Cold City in Northern China. Atmosphere 2021, 12, 297. [Google Scholar] [CrossRef]
- Katsoyiannis, A.; Sweetman, A.J.; Jones, K.C. PAH Molecular Diagnostic Ratios Applied to Atmospheric Sources: A Critical Evaluation Using Two Decades of Source Inventory and Air Concentration Data from the UK. Environ. Sci. Technol. 2011, 45, 8897–8906. [Google Scholar] [CrossRef]
- Dvorská, A.; Lammel, G.; Klanova, J. Use of diagnostic ratios for studying source apportionment and reactivity of ambient polycyclic aromatic hydrocarbons over Central Europe. Atmos. Environ. 2011, 45, 420–427. [Google Scholar] [CrossRef]
- Belis, C.A.; Karagulian, F.; Larsen, B.R.; Hopke, P.K. Critical review and meta-analysis of ambient particulate matter source apportionment using receptor models in Europe. Atmos. Environ. 2013, 69, 94–108. [Google Scholar] [CrossRef]
- Hopke, P.K. A review of receptor modeling methods for source apportionment. J. Air Waste Manag. Assoc. 2016, 66, 237–259. [Google Scholar] [CrossRef]
- Norris, G.; Duvall, R. EPA Positive Matrix Factorization (PMF) 5.0 Fundamentals and User Guide; EPA/600/R-14/108; U.S. Environmental Protection Agency National Exposure Research Laboratory: Washington, DC, USA, 2014; pp. 1–124.
- Zong, Z.; Wang, X.; Tian, C.; Chen, Y.; Fu, S.; Qu, L.; Ji, L.; Li, J.; Zhang, G. PMF and PSCF based source apportionment of PM2.5 at a regional background site in North China. Atmos. Res. 2018, 203, 207–215. [Google Scholar] [CrossRef] [Green Version]
- Zong, Z.; Wang, X.; Tian, C.; Chen, Y.; Fang, Y.; Zhang, F.; Li, C.; Sun, J.; Li, J.; Zhang, G. First Assessment of NOx Sources at a Regional Background Site in North China Using Isotopic Analysis Linked with Modeling. Environ. Sci. Technol. 2017, 51, 5923–5931. [Google Scholar] [CrossRef]
- Wang, X.; Chen, Y.; Tian, C.; Huang, G.; Fang, Y.; Zhang, F.; Zong, Z.; Li, J.; Zhang, G. Impact of agricultural waste burning in the Shandong Peninsula on carbonaceous aerosols in the Bohai Rim, China. Sci. Total Environ. 2014, 481, 311–316. [Google Scholar] [CrossRef]
- Liu, D.; Xu, Y.; Chaemfa, C.; Tian, C.; Li, J.; Luo, C.; Zhang, G. Concentrations, seasonal variations, and outflow of atmospheric polycyclic aromatic hydrocarbons (PAHs) at Ningbo site, Eastern China. Atmos. Pollut. Res. 2014, 5, 203–209. [Google Scholar] [CrossRef] [Green Version]
- Liu, R.; Ma, S.; Li, G.; Yu, Y.; An, T. Comparing pollution patterns and human exposure to atmospheric PBDEs and PCBs emitted from different e-waste dismantling processes. J. Hazard. Mater. 2019, 369, 142–149. [Google Scholar] [CrossRef] [PubMed]
- Paatero, P.; Eberly, S.; Brown, S.G.; Norris, G.A. Methods for estimating uncertainty in factor analytic solutions. Atmos. Meas. Tech. 2014, 7, 781–797. [Google Scholar] [CrossRef] [Green Version]
- Saba, T.; Su, S. Tracking polychlorinated biphenyls (PCBs) congener patterns in Newark Bay surface sediment using principal component analysis (PCA) and positive matrix factorization (PMF). J. Hazard. Mater. 2013, 260, 634–643. [Google Scholar] [CrossRef] [PubMed]
- Stein, A.F.; Draxler, R.R.; Rolph, G.D.; Stunder, B.J.B.; Cohen, M.D.; Ngan, F. NOAA’s HYSPLIT Atmospheric Transport and Dispersion Modeling System. Bull. Am. Meteorol. Soc. 2015, 96, 2059–2077. [Google Scholar] [CrossRef]
- Callén, M.S.; Iturmendi, A.; López, J.M. Source apportionment of atmospheric PM2.5-bound polycyclic aromatic hydrocarbons by a PMF receptor model. Assessment of potential risk for human health. Environ. Pollut. 2014, 195, 167–177. [Google Scholar] [CrossRef]
- Hong, W.-J.; Jia, H.; Yang, M.; Li, Y.-F. Distribution, seasonal trends, and lung cancer risk of atmospheric polycyclic aromatic hydrocarbons in North China: A three-year case study in Dalian city. Ecotoxicol. Environ. Saf. 2020, 196, 110526. [Google Scholar] [CrossRef]
- Liu, W.; Xu, Y.; Zhao, Y.; Liu, Q.; Yu, S.; Liu, Y.; Wang, X.; Liu, Y.; Tao, S.; Liu, W. Occurrence, source, and risk assessment of atmospheric parent polycyclic aromatic hydrocarbons in the coastal cities of the Bohai and Yellow Seas, China. Environ. Pollut. 2019, 254, 113046. [Google Scholar] [CrossRef]
- Feng, B.; Li, L.; Xu, H.; Wang, T.; Wu, R.; Chen, J.; Zhang, Y.; Liu, S.; Ho, S.S.H.; Cao, J.; et al. PM2.5-bound polycyclic aromatic hydrocarbons (PAHs) in Beijing: Seasonal variations, sources, and risk assessment. J. Environ. Sci. 2019, 77, 11–19. [Google Scholar] [CrossRef] [PubMed]
- Jiang, N.; Li, L.; Wang, S.; Li, Q.; Dong, Z.; Duan, S.; Zhang, R.; Li, S. Variation tendency of pollution characterization, sources, and health risks of PM2.5-bound polycyclic aromatic hydrocarbons in an emerging megacity in China: Based on three-year data. Atmos. Res. 2019, 217, 81–92. [Google Scholar] [CrossRef]
- Feng, J.L.; Guo, Z.G.; Zhang, T.R.; Yao, X.H.; Chan, C.K.; Fang, M. Source and formation of secondary particulate matter in PM2.5 in Asian continental outflow. J. Geophys. Res. Earth Surf. 2012, 117, D03302. [Google Scholar] [CrossRef] [Green Version]
- Gao, Y.; Ji, H. Characteristics of polycyclic aromatic hydrocarbons components in fine particle during heavy polluting phase of each season in urban Beijing. Chemosphere 2018, 212, 346–357. [Google Scholar] [CrossRef] [PubMed]
- Zhang, L.; Xu, H.; Fang, B.; Wang, H.; Yang, Z.; Yang, W.; Hao, Y.; Wang, X.; Wang, Q.; Wang, M. Source Identification and Health Risk Assessment of Polycyclic Aromatic Hydrocarbon-Enriched PM 2.5 in Tangshan, China. Environ. Toxicol. Chem. 2020, 39, 458–467. [Google Scholar] [CrossRef]
- Jia, J.; Deng, L.; Bi, C.; Jin, X.; Zeng, Y.; Chen, Z. Seasonal variations, gas-PM2.5 partitioning and long-distance input of PM2.5-bound and gas-phase polycyclic aromatic hydrocarbons in Shanghai, China. Atmos. Environ. 2021, 252, 118335. [Google Scholar] [CrossRef]
- Wang, Q.; Liu, M.; Yu, Y.; Li, Y. Characterization and source apportionment of PM2.5-bound polycyclic aromatic hydrocarbons from Shanghai city, China. Environ. Pollut. 2016, 218, 118–128. [Google Scholar] [CrossRef]
- Lu, H.; Wang, S.; Li, Y.; Gong, H.; Han, J.; Wu, Z.; Yao, S.; Zhang, X.; Tang, X.; Jiang, B. Seasonal variations and source apportionment of atmospheric PM2.5-bound polycyclic aromatic hydrocarbons in a mixed multi-function area of Hangzhou, China. Environ. Sci. Pollut. Res. 2017, 24, 16195–16205. [Google Scholar] [CrossRef]
- Mo, Z.; Wang, Z.; Mao, G.; Pan, X.; Wu, L.; Xu, P.; Chen, S.; Wang, A.; Zhang, Y.; Luo, J.; et al. Characterization and health risk assessment of PM2.5-bound polycyclic aromatic hydrocarbons in 5 urban cities of Zhejiang Province, China. Sci. Rep. 2019, 9, 7296. [Google Scholar] [CrossRef]
- Chen, C.; Xia, Z.; Wu, M.; Zhang, Q.; Wang, T.; Wang, L.; Yang, H. Concentrations, Source Identification, and Lung Cancer Risk Associated with Springtime PM2.5-Bound Polycyclic Aromatic Hydrocarbons (PAHs) in Nanjing, China. Arch. Environ. Contam. Toxicol. 2017, 73, 391–400. [Google Scholar] [CrossRef]
- Liu, J.; Man, R.; Ma, S.; Li, J.; Wu, Q.; Peng, J. Atmospheric levels and health risk of polycyclic aromatic hydrocarbons (PAHs) bound to PM2.5 in Guangzhou, China. Mar. Pollut. Bull. 2015, 100, 134–143. [Google Scholar] [CrossRef] [PubMed]
- Gao, B.; Guo, H.; Wang, X.-M.; Zhao, X.-Y.; Ling, Z.-H.; Zhang, Z.; Liu, T.-Y. Polycyclic aromatic hydrocarbons in PM2.5 in Guangzhou, southern China: Spatiotemporal patterns and emission sources. J. Hazard. Mater. 2012, 239-240, 78–87. [Google Scholar] [CrossRef] [PubMed]
- Shen, R.; Liu, Z.; Chen, X.; Wang, Y.; Wang, L.; Liu, Y.; Li, X. Atmospheric levels, variations, sources and health risk of PM2.5-bound polycyclic aromatic hydrocarbons during winter over the North China Plain. Sci. Total Environ. 2019, 655, 581–590. [Google Scholar] [CrossRef] [PubMed]
- Chen, P.; Liang, J. Polycyclic aromatic hydrocarbons in green space soils in Shanghai: Source, distribution, and risk assessment. J. Soils Sediments 2021, 21, 967–977. [Google Scholar] [CrossRef]
- Yunker, M.B.; Macdonald, R.W.; Vingarzan, R.; Mitchell, R.H.; Goyette, D.; Sylvestre, S. PAHs in the Fraser River basin: A critical appraisal of PAH ratios as indicators of PAH source and composition. Org. Geochem. 2002, 33, 489–515. [Google Scholar] [CrossRef]
- Tobiszewski, M.; Namiesnik, J. PAH diagnostic ratios for the identification of pollution emission sources. Environ. Pollut. 2012, 162, 110–119. [Google Scholar] [CrossRef]
- Wang, X.; Zong, Z.; Tian, C.; Chen, Y.; Luo, C.; Li, J.; Zhang, G.; Luo, Y. Combining Positive Matrix Factorization and Radiocarbon Measurements for Source Apportionment of PM2.5 from a National Background Site in North China. Sci. Rep. 2017, 7, 10648. [Google Scholar] [CrossRef] [Green Version]
- Lin, T.; Hu, L.; Guo, Z.; Qin, Y.; Yang, Z.; Zhang, G.; Zheng, M. Sources of polycyclic aromatic hydrocarbons to sediments of the Bohai and Yellow Seas in East Asia. J. Geophys. Res. Earth Surf. 2011, 116, D23305. [Google Scholar] [CrossRef]
- Lu, W.; Yang, L.; Chen, J.; Wang, X.; Li, H.; Zhu, Y.; Wen, L.; Xu, C.; Zhang, J.; Zhu, T.; et al. Identification of concentrations and sources of PM2.5-bound PAHs in North China during haze episodes in 2013. Air Qual. Atmos. Health 2016, 9, 823–833. [Google Scholar] [CrossRef]
- Garrido, A.; Jiménez-Guerrero, P.; Ratola, N. Levels, trends and health concerns of atmospheric PAHs in Europe. Atmos. Environ. 2014, 99, 474–484. [Google Scholar] [CrossRef]
- He, J.; Fan, S.; Meng, Q.; Sun, Y.; Zhang, J.; Zu, F. Polycyclic aromatic hydrocarbons (PAHs) associated with fine particulate matters in Nanjing, China: Distributions, sources and meteorological influences. Atmos. Environ. 2014, 89, 207–215. [Google Scholar] [CrossRef]
- Tian, C.; Ma, J.; Liu, L.; Jia, H.; Xu, D.; Li, Y.-F. A modeling assessment of association between East Asian summer monsoon and fate/outflow of α-HCH in Northeast Asia. Atmos. Environ. 2009, 43, 3891–3901. [Google Scholar] [CrossRef]
- Xu, Y.; Tian, C.; Zhang, G.; Ming, L.; Wang, Y.; Chen, Y.; Tang, J.; Li, J.; Luo, C. Influence of monsoon system on α-HCH fate in Asia: A model study from 1948 to 2008. J. Geophys. Res. Atmos. 2013, 118, 6764–6770. [Google Scholar] [CrossRef]


| Component | Average | Summer | Autumn | Winter | Spring |
|---|---|---|---|---|---|
| Nap | 0.41 ± 0.16 | 0.38 ± 0.20 | 0.46 ± 0.11 | 0.38 ± 0.20 | 0.33 ± 0.09 |
| Acy | 0.13 ± 0.05 | 0.10 ± 0.02 | 0.10 ± 0.03 | 0.16 ± 0.05 | 0.15 ± 0.02 |
| Ace | 0.12 ± 0.03 | 0.14 ± 0.06 | 0.10 ± 0.02 | 0.12 ± 0.02 | 0.13 ± 0.01 |
| Flu | 0.69 ± 0.37 | 0.90 ± 0.31 | 0.53 ± 0.37 | 0.83 ± 0.34 | 0.81 ± 0.13 |
| Phe | 5.04 ± 3.59 | 3.69 ± 1.06 | 3.80 ± 3.33 | 7.20 ± 3.95 | 5.48 ± 1.75 |
| Ant | 1.24 ± 1.56 | 0.83 ± 0.58 | 1.10 ± 0.85 | 1.18 ± 1.29 | 2.11 ± 3.27 |
| Flua | 6.45 ± 6.39 | 1.10 ± 0.67 | 4.53 ± 5.56 | 10.1 ± 7.22 | 8.53 ± 3.25 |
| Pyr | 5.30 ± 5.98 | 0.97 ± 0.71 | 4.34 ± 6.90 | 7.37 ± 5.28 | 6.80 ± 2.43 |
| BaA | 1.49 ± 2.88 | 0.18 ± 0.19 | 1.40 ± 3.86 | 1.85 ± 1.66 | 1.83 ± 0.56 |
| Chr | 2.95 ± 3.38 | 0.40 ± 0.46 | 2.65 ± 3.42 | 4.01 ± 3.73 | 3.24 ± 2.22 |
| BbF | 4.79 ± 7.83 | 0.64 ± 0.70 | 4.33 ± 8.84 | 5.64 ± 7.93 | 7.15 ± 4.12 |
| BkF | 3.34 ± 4.30 | 0.49 ± 0.51 | 2.74 ± 4.12 | 4.47 ± 5.09 | 4.80 ± 2.76 |
| BaP | 1.18 ± 3.09 | 0.01 ± 0.01 | 1.39 ± 4.14 | 1.21 ± 1.82 | 1.04 ± 1.11 |
| InP | 0.90 ± 4.09 | 0.01 ± 0.00 | 1.42 ± 5.76 | 0.37 ± 1.06 | 0.73 ± 0.94 |
| DahA | 0.01 ± 0.03 | 0.00 ± 0.00 | 0.01 ± 0.05 | 0.01 ± 0.01 | 0.01 ± 0.00 |
| BghiP | 1.25 ± 5.04 | 0.01 ± 0.00 | 1.85 ± 6.99 | 0.93 ± 2.07 | 0.56 ± 0.88 |
| 2-ring | 0.66 ± 0.19 | 0.62 ± 0.27 | 0.67 ± 0.15 | 0.67 ± 0.24 | 0.63 ± 0.12 |
| 3-ring | 6.97 ± 4.44 | 5.43 ± 1.17 | 5.44 ± 4.03 | 9.22 ± 4.28 | 8.41 ± 4.85 |
| 4-ring | 16.2 ± 17.9 | 2.66 ± 2.00 | 12.9 ± 19.4 | 23.3 ± 17.4 | 20.4 ± 8.02 |
| 5-ring | 9.33 ± 14.7 | 1.17 ± 1.22 | 8.48 ± 16.7 | 11.3 ± 14.5 | 13.0 ± 7.79 |
| 6-ring | 2.15 ± 9.10 | 0.03 ± 0.01 | 3.27 ± 12.7 | 1.31 ± 3.04 | 1.29 ± 1.68 |
| Σ16PAHs | 35.3 ± 41.8 | 9.93 ± 3.89 | 30.8 ± 48.9 | 45.9 ± 38.0 | 43.7 ± 19.8 |
| ΣBaPeq | 2.32 ± 4.95 | 0.18 ± 0.16 | 2.47 ± 6.49 | 2.54 ± 3.31 | 2.60 ± 1.84 |
| Trajectory Clusters | Summer | Autumn | Winter | Spring | Total |
|---|---|---|---|---|---|
| Cluster 1 | 12 | 40 | 10 | 12 | 74 |
| Cluster 2 | 5 | 26 | 10 | 8 | 49 |
| Cluster 3 | 3 | 26 | 22 | 8 | 59 |
| Cluster 4 | 0 | 11 | 12 | 4 | 27 |
| Cluster 5 | 0 | 13 | 18 | 0 | 31 |
| Study Area | Sample Period | N | Mean ± SD | Ref. |
|---|---|---|---|---|
| Beihuangcheng Island | August 2017–March 2018 | 60 | 35.3 ± 41.8 | This study |
| Beijing | September 2015–August 2016 | 16 | 77.48 ± 6.83 | [35] |
| Beijing | November 2014–June 2015 | 227 | 58.3 | [32] |
| Tangshan | April 2014–February 2015 | 39 | 190 | [36] |
| Dalian | November 2016–November 2017 | 63 | 52.4 ± 24.0 | [14] |
| Zhengzhou | December 2013–October 2016 | 180 | 37.8–115.2 | [33] |
| Tuoji Island | November 2011–January 2013 | 76 | 15.34 ± 8.87 | [5] |
| Shanghai | October 2016–July 2017 | 101 | 7.14 | [37] |
| Shanghai | April 2014–January 2015 | 230 | 6.90 ± 6.86 | [38] |
| Hangzhou | March 2015–February 2016 | 84 | 2.27–13.6 | [39] |
| Hangzhou | January and December 2015 | 97 | 17.8 ± 15.8 | [40] |
| Ningbo | January and December 2015 | 97 | 13.5 ± 10.0 | [40] |
| Jinhua | January and December 2015 | 97 | 18.3 ± 16.0 | [40] |
| Lishui | January and December 2015 | 97 | 16.9 ± 15.2 | [40] |
| Zhoushan | January and December 2015 | 97 | 7.5 ± 4.0 | [40] |
| Nanjing | 16 March–5 June 2016 | 9 | 3.98 ± 1.01 | [41] |
| Guangzhou | June 2012–May 2013 | 36 | 33.9 | [42] |
| Guangzhou | November–December 2009 | 136 | 17.2 ± 3.33 | [43] |
| Season | Factor 1 | Factor 2 | Factor 3 | Factor 4 | Modeled Conc. | Measured Conc. |
|---|---|---|---|---|---|---|
| Summer | 5.52 | 2.87 | 0.76 | 2.91 | 12.1 | 9.93 |
| Autumn | 5.41 | 10.5 | 10.7 | 2.57 | 29.2 | 30.8 |
| Winter | 13.4 | 24.0 | 9.40 | 1.75 | 48.6 | 45.9 |
| Spring | 14.2 | 19.8 | 9.68 | 1.49 | 45.2 | 43.8 |
| Average | 8.81 | 14.7 | 8.44 | 2.18 | 34.1 | 35.4 |
| Season | Ant/(Ant + Phe) | Flua/(Flua + Pyr) | BaA/(BaA + Chr) | InP/(InP + BghiP) |
|---|---|---|---|---|
| Summer | 0.19 ± 0.16 | 0.53 ± 0.07 | 0.43 ± 0.12 | 0.58 ± 0.21 |
| Autumn | 0.26 ± 0.17 | 0.53 ± 0.08 | 0.29 ± 0.16 | 0.31 ± 0.21 |
| Winter | 0.15 ± 0.15 | 0.58 ± 0.02 | 0.36 ± 0.15 | 0.31 ± 0.20 |
| Spring | 0.19 ± 0.18 | 0.55 ± 0.01 | 0.45 ± 0.19 | 0.45 ± 0.23 |
| Average | 0.21 ± 0.17 | 0.55 ± 0.07 | 0.34 ± 0.17 | 0.35 ± 0.23 |
| Season | Factor 1 | Factor 2 | Factor 3 | Factor 4 | Modeled Conc. | Measured Conc. |
|---|---|---|---|---|---|---|
| Summer | 0.11 | 0.13 | 0.11 | 0.07 | 0.42 | 0.18 |
| Autumn | 0.11 | 0.47 | 1.54 | 0.06 | 2.18 | 2.47 |
| Winter | 0.28 | 1.07 | 1.36 | 0.04 | 2.75 | 2.55 |
| Spring | 0.30 | 0.88 | 1.40 | 0.03 | 2.61 | 2.60 |
| Average | 0.18 | 0.65 | 1.22 | 0.05 | 2.11 | 2.32 |
Publisher’s Note: MDPI stays neutral with regard to jurisdictional claims in published maps and institutional affiliations. |
© 2022 by the authors. Licensee MDPI, Basel, Switzerland. This article is an open access article distributed under the terms and conditions of the Creative Commons Attribution (CC BY) license (https://creativecommons.org/licenses/by/4.0/).
Share and Cite
Qu, L.; Yang, L.; Zhang, Y.; Wang, X.; Sun, R.; Li, B.; Lv, X.; Chen, Y.; Wang, Q.; Tian, C.; et al. Source Apportionment and Toxic Potency of PM2.5-Bound Polycyclic Aromatic Hydrocarbons (PAHs) at an Island in the Middle of Bohai Sea, China. Atmosphere 2022, 13, 699. https://doi.org/10.3390/atmos13050699
Qu L, Yang L, Zhang Y, Wang X, Sun R, Li B, Lv X, Chen Y, Wang Q, Tian C, et al. Source Apportionment and Toxic Potency of PM2.5-Bound Polycyclic Aromatic Hydrocarbons (PAHs) at an Island in the Middle of Bohai Sea, China. Atmosphere. 2022; 13(5):699. https://doi.org/10.3390/atmos13050699
Chicago/Turabian StyleQu, Lin, Lin Yang, Yinghong Zhang, Xiaoping Wang, Rong Sun, Bo Li, Xiaoxue Lv, Yuehong Chen, Qin Wang, Chongguo Tian, and et al. 2022. "Source Apportionment and Toxic Potency of PM2.5-Bound Polycyclic Aromatic Hydrocarbons (PAHs) at an Island in the Middle of Bohai Sea, China" Atmosphere 13, no. 5: 699. https://doi.org/10.3390/atmos13050699
APA StyleQu, L., Yang, L., Zhang, Y., Wang, X., Sun, R., Li, B., Lv, X., Chen, Y., Wang, Q., Tian, C., & Ji, L. (2022). Source Apportionment and Toxic Potency of PM2.5-Bound Polycyclic Aromatic Hydrocarbons (PAHs) at an Island in the Middle of Bohai Sea, China. Atmosphere, 13(5), 699. https://doi.org/10.3390/atmos13050699