Abstract
To date, there are limited data on the thermal properties of secondary organic aerosol (SOA) components. In this study, we employed an experimental method to evaluate the physical properties of some atmospherically relevant compounds. We estimated the thermodynamic properties of SOA components, in particularly some carboxylic acids. The molar heat capacity, melting point and enthalpy, and vaporization enthalpy of the samples were determined via differential scanning calorimetry and thermogravimetric analysis, and their vaporization enthalpy (ΔHvap) was estimated using Clausius–Clapeyron and Langmuir equations based on their thermogravimetric profiles. The thermodynamic properties of benzoic acid as a reference compound agree well with the reported values. The obtained specific heat capacities of benzoic acid, phthalic acid, pinic acid, ketopinic acid, cis-pinonic acid, terpenylic acid and diaterpenylic acid acetate (DTAA) are 118.1, 169.4, 189.9, 223.9, 246.1, 223.2, and 524.1 J mol−1 K−1, respectively. The ΔHvap of benzoic acid, phthalic acid, ketopinic acid, DTAA, and 3-methylbutane-1,2,3-tricarboxylic acid (3-MBTCA) are 93.2 ± 0.4, 131.6, 113.8, and 124.4 kJ mol−1, respectively. The melting and vaporization enthalpies of the SOA components range from 7.3 to 29.7 kJ mol−1.
1. Introduction
Atmospheric aerosol is a complex mixture of organic and inorganic compounds and has significant effects on human health, visibility, and climate [1,2,3]. Primary aerosol is composed of particles directly emitted to the atmosphere from various sources, such as biomass burning and vehicle exhausts [4,5]. Secondary aerosols are formed in the air via chemical reactions. Secondary organic aerosol (SOA) is formed by the oxidation of volatile organic compounds with O3, OH, and NO3 [6,7]. SOA consists of hundreds of semi-volatile compounds constantly partitioned between the particle and gas phases as a function of temperature, relative humidity, and their concentrations [8]. The physical properties of SOA are related to the contribution of the individual compounds [9]. Monoterpene (e.g., α- and β-pinene) is a typical biogenic precursor for SOA [10,11]. SOA products from the photooxidation and ozonolysis of α-pinene have been reported [12,13,14]. Abundant α-pinene SOA constituents, such as pinic acid, oxopinonic acid, hydroxyl-pinonic acid, terpenylic acid, and pinalic acid, account for approximately 58–72% of the mass of α-pinene SOA [15]. Similarly, 3-methylbutane-1,2,3-tricarboxylic acid (3-MBTCA) and terpenylic acid are products of further reactions of pinonaldehyde and nopinone at a later stage in α- and β-pinene photooxidation [16]. Diaterpenylic acid acetate (DTAA) has been observed in SOA obtained from the ozonolysis and photooxidation of both α- and β-pinene [17]. Many of these compounds are also found in the SOA of other monoterpene species, such as d-limonene [18,19]. Polyaromatic hydrocarbons (PAHs) are common anthropogenic organics released from combustion and vehicle exhausts [20]. Aromatic carboxylic acids might be formed by the photochemical oxidation of PAHs via an oxidative ring-cleavage and can be used as a tracer of anthropogenic SOA [21,22]. Carboxylic acids contribute a substantial portion of total SOA mass [23]. Michoud et al. (2021) [24] reported that PM2.5 from the western Mediterranean Basin (France) in 2013 contained 49% and 15% of dicarboxylic acids and tricarboxylic acids of biogenic origin, respectively. Carboxylic acids are highly soluble in water under high relative humidity, affecting the chemical and radiative properties of ambient particles [25,26].
In the past few decades, significant efforts have been made to predict ambient aerosol concentration using air quality models. These models have uncertainties in predicting atmospheric aerosol concentrations. One of the major sources of the uncertainties comes from the poor understanding of important aerosol properties such as vapor pressure and vaporization enthalpy. Chemical transport models (CTMs) such as Community Multiscale Air Quality (CMAQ), Goddard Earth Observing System (GEOS-CHEM) and Particulate Matter Comprehensive Air Quality Models (PMCAMx) are implemented with thermodynamic properties and absorptive partitioning framework [27,28,29,30,31]. Phase partitioning between the condensed and vapor phases governs organic aerosol concentrations in the atmosphere. Thermodynamic properties (i.e., saturation vapor pressure and vaporization enthalpy) play an important role in the temporal and spatial distribution of atmospheric aerosol between gas and particle phases [32,33]. The enthalpy of vaporization (amount of energy required to change one mole of a substance from solid to the gaseous state) and saturation vapor pressure are temperature-dependent properties. Vaporization enthalpy varies inversely, whereas saturation vapor pressure changes directly with temperature [34]. Volatility parameters of multicomponent organic aerosols need to consider the wide range of volatility associated with the multicomponent composition. However, the estimation of volatility parameters for individual SOA components is relatively easy. Gas-particle partitioning can be predicted using the composition and volatility data of individual components (such as the volatility basis set) in atmospheric OA. The partition coefficient Kom,i in the models is inversely related to effective saturation concentration Ci* of specie i (Equation (S1)). Effective saturation concentrations as a function of vaporization enthalpy and temperature can be estimated in a modified form of Clausius–Clapeyron equation (Equation (S2)) [35,36]. The functionality of carboxylic acid dramatically reduces the vapor pressure [23].
Over the last few decades, some modeling and experimental techniques have been developed to probe the volatility properties of low-volatility organic species present in atmospheric aerosols [32]. Pankow et al. (2007) [37] developed SIMPOL.1 that is a group contribution method to predict liquid vapor pressure and vaporization enthalpy of organic compounds based on their chemical structures. Similarly, Acree et al. (2003) [38] has developed a database for phase change enthalpy of organic compounds based on their associated functional groups. Ribeiro et al. (1999) [39] employed the Knudsen mass-loss effusion method to estimate the vapor pressures and enthalpies and entropies of vaporization of dicarboxylic acids. Salo et al. (2010) [9] estimated the enthalpy of vaporization for various cyclic and straight-chain dicarboxylic acids using a volatility tandem differential mobility analyzer (VTDMA). Saleh et al. (2010b) [8] estimated the enthalpy of vaporization of adipic acid and pimelic acid at 25 °C using the integrated volume method (IVM). In addition, the combination of thermal gravimetric analysis (TGA) and differential scanning calorimetry (DSC) is a well-established technique for estimating the thermal properties of chemical species [40,41,42]. In TGA and DSC analyses, changes in mass and heat are measured simultaneously as functions of temperature. Thermogravimetry is a convenient and rapid technique for estimating vapor pressure curves and vaporization enthalpies even with a small sample quantity. Booth et al. (2011) [43] reported the enthalpy of vaporization for some carboxylic acids using the Clausius–Clapeyron equation based on thermogravimetric data.
Although many studies have reported the composition of α-pinene SOA, there are limited experimental data on the thermal properties. In this study, we estimated the molar heat capacity, melting point, saturation vapor pressure, and enthalpy of melting and vaporization for biogenic SOA components, in particular, straight-chain dicarboxylic acids, cyclic dicarboxylic acids, and anthropogenic SOA components such as aromatic organic acids using an integrated TGA-DSC analysis system. This provides the thermal properties of biogenic and anthropogenic SOA species, which can serve as a good reference for yield and partitioning in chemical transport models.
2. Materials and Methods
2.1. Material
Five dicarboxylic acids (malonic acid (>99%, C3H4O4, Sigma-Aldrich), succinic acid (≥99%, C4H6O4, Sigma-Aldrich), adipic acid (99%, C6H10O4, Sigma-Aldrich), and suberic acid (>99%, C8H14O4, Sigma-Aldrich)), three aromatic organic acids (benzoic acid (98%, C7H6O2, Sigma-Aldrich), phthalic acid (98%, C8H6O4, Sigma-Aldrich), 4-hydroxybenzoic acid (>99%, C7H6O3, Sigma-Aldrich)), phenol (catechol (98%, C6H6O2, Sigma-Aldrich)), six α-pinene SOA species (pinic acid (99%, C9H14O4, Sigma-Aldrich), ketopinic acid (99%, C10H14O3, Sigma-Aldrich), cis-pinonic acid (≥98%, C10H16O3, Sigma-Aldrich), 3-methylbutane-1,2,3-tricarboxylic acid (3-MBTCA) (98%, C8H12O6, Synthesized), terpenylic acid (72%, C8H14O5, Synthesized), and DTAA (77%, C10H16O6, Synthesized)) were used in the thermogravimetric analysis. All commercial compounds with high-purity reagents were purchased from Sigma-Aldrich, St. Louis, MO, USA. All the synthesized SOA species were prepared in the laboratory of authors. For the synthesis 3-MBTCA, a solution of dimethyl maleate was mixed with a solution of methyl isobutyrate containing tetrahydrofuran to form trimethyl 3-methylbutane-1,2,3-tricarboxylate (triester). Then. triester was mixed with a solution of NaOH in water and MeOH followed by acidification with HCL and drying to yield 3-MBTCA (triacid). For the synthesis of terpenylic acid, cis-pinonic acid was dissolved in H2SO4 solution and saturated with (NH4)2SO4 followed by drying to yield homoterpenyl methyl ketone. The homoterpenyl methyl ketone was dissolved in KOH and KMnO4 solution and filtered to remove precipitates. The filtrate was acidified with H2SO4 solution and extracted with diethyl ether followed by drying over Na2SO4, and recrystallization to give terpenylic acid. To synthesize DTAA, CH3MgBr solution was added to ethyl cyclopent-3-ene-1-carboxylate and NH4Cl, and processed to form 2-(cyclopent-3-en-1-yl)propan-2-ol (tertiary alcohol). 4-Dimethylaminopyridine was added to tertiary alcohol in pyridine and acetic anhydride, and processed to yield 2-(cyclopent-3-en-1-yl)propan-2-yl acetate. Oxone and sodium periodate were added to acetate solution in acetonitrile/H2O. The mixture was filtered, extracted with diethyl ether, and dried over Na2SO4 followed by evaporation and recrystallization to form DTAA. The laboratory-scale synthesis procedure of the aforementioned SOA species was discussed in detail by Babar et al. (2020b) [11].
2.2. Heat Capacity Analysis
Heat capacity measurements were performed using a TA Instrument SDT Q600, New Castle, DE, USA. A sapphire disc (α-aluminum oxide) was taken as a reference disc for isothermal flow as used in various references (ASTM E1269-1). DSC data were acquired in the heating mode over the temperature range of −30 °C to 120 °C with a heating rate of 20 °C/min. The heat flow of the blank and sapphire samples was measured in consecutive runs.
2.3. TGA/DSC Analysis
TGA-DSC analysis was performed using a TA Instrument SDT Q600, New Castle, DE, USA. For all SOA species, the initial mass was approximately 20 mg. The ramping temperature was from 25 °C to 300 °C at a rate of 2.5 °C/min. The purge gas flow of N2 was maintained at 100 mL/min. Before the experiment, the instrument for heat flow was calibrated from 100 °C to 388 °C using aluminum as a standard.
2.4. Estimation of Specific Heat Capacity
Specific heat capacity is the amount of energy required to raise the temperature of 1 mole of a substance by 1 K. ASTM E1269-11 [44] provides a detailed method for estimating the specific heat of a substance using DSC [24]. The specific heat capacity of a sample is calculated using Equation (1).
where Cp(s) is the specific heat capacity of the specimen (J g−1 K−1), Cp(st) the specific heat capacity of the sapphire standard (J g−1 K−1), D(s) the vertical displacement between the specimen holder and the specimen DSC thermal curves at a given temperature (mW), D(st) the vertical displacement between the specimen holder and the sapphire DSC thermal curves at a given temperature (mW), W(s) the mass of the specimen (mg), and W(st) the mass of sapphire standard (mg). Bernardes et al. (2020) [40] developed a more accurate method to correct the deviation of heat capacities measured using different instruments. From the heat flow curves of DSC data, heat capacity, Cp,m(T), at a given temperature, T, can be calculated as follows;
where m and M are the mass (g) and molar mass (g mol−1) of the compound, respectively; β the heating rate (°C min−1), and Δϕ(T) the difference in heat flow rate (mW) between the sample and blank runs at a given temperature. k(T) is a temperature-dependent correction factor, expressed as;
where Cp,m(α-Al2O3,T)Ref represents the recommended heat capacity of sapphire at temperature T (provided by ASTM E1269-11) [44] and Cp,m(α-Al2O3,T)Obs is the corresponding experimental value calculated using Equation (2). To estimate Cp,m(α-Al2O3,T)Ref as a function of temperature, an empirical equation is used as follows:
where A, B, C, D, and E are constants and equal to 102.43, 38.75, −15.91, 2.63, and −3.00, respectively. Equation (4) is just an empirical equation with no physical application.
2.5. Estimation of the Melting Point and Enthalpy
For all samples, the melting temperature Tm was determined using the respective DSC curves. During a phase change, the heat supplied by the instrument is absorbed by the sample as latent heat of fusion. This results in an endothermic dip in the DSC heat curve of the sample at a certain temperature. According to the International Confederation for Thermal Analysis and Calorimetry standard, the melting point for pure compounds is the onset of the melting peaks. Similarly, for compounds with high impurities or amorphous structures (like polymers), the melting point is the minima of the melting peak. Molar enthalpy of fusion ΔHfus (kJ mol−1) at Tm was determined to be the peak area of the endothermic heat curve per number of moles corresponding to mass in the melting range [45]. The melting enthalpy at 298 K was estimated using Sidwicks equation [46]:
2.6. Estimation of Saturation Vapor Pressure and Vaporization Enthalpy
The saturation vapor pressure of all SOA species was estimated using the Langmuir equation [47]:
where (dm/dt) (1/a) is the rate of mass loss per unit area (kg s−1 m−2), p the vapor pressure (Pa), M the molecular mass of sample (kg mol−1), R the gas constant (kJ mol−1 K−1), α the vaporization coefficient, and T the absolute temperature (K). Rearranging the Langmuir equation, we obtain
where and . The values of k and v depend on the instrument and sample, respectively. The vapor pressure of a reference compound is estimated using Antoine’s equation:
where p (Pa) and T (K) are the vapor pressure and absolute temperature, respectively, and A, B, and C are Antoine’s constants. To calculate the instrument-dependent k values, a linear relationship between p and v was plotted using Equation (7). For SOA species with unknown Antoine constants, the vapor pressure values were calculated using the instrument-dependent k values, which were estimated using the reference compound (benzoic acid in this study). The enthalpy of vaporization was calculated from the vapor pressure and temperature data using the Clausius–Clapeyron equation:
where p (Pa), ΔHvap (kJ mol−1), R (kg m2 K−1 mol−1 s−2), T (K), and A are the estimated vapor pressure, enthalpy of vaporization, gas constant, absolute temperature, and y-intercept, respectively. ΔHvap is the slope of the line when ln(p) against 1/T. In this study, replicate analyses were carried out for benzoic acid and catechol with standard deviations less than 3% for the estimation of ΔHvap.
3. Results and Discussion
3.1. Specific Heat Capacity
Figure 1a shows the heat flow of pan, sapphire, and benzoic acid as a function of temperature. In the first and last four minutes of Cp measurement, the isothermal condition was maintained at the lowest and highest temperatures of −30 °C and 115 °C, respectively.
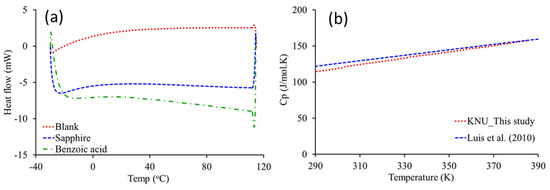
Figure 1.
(a) Heat flow of pan, sapphire, and benzoic acid as a function of temperature. (b) Specific heat capacity of benzoic acid as a function of temperature.
The specific heat of benzoic acid was calculated using Equation (2) and plotted as a function of temperature (Figure 1b). The heat capacity of benzoic acid at room temperature (298.15 K) was 118.1 J mol−1 K−1, which is consistent with the reported value (125.1 J mol−1 K−1) [48]. The specific heat capacity of SOA species was calculated using the abovementioned method and summarized in Table 1. In most cases, the specific capacity increased by less than 1% with a 1 °C change in temperature. This indicates that the specific heat capacity of SOA species varies with temperature. This temperature-dependence of specific heat capacity has been reported with Equation (4). Herein, for SOA species, the coefficients in Equation (4) were estimated using linear regression and are listed in Table 1.

Table 1.
Heat capacities of biogenic and anthropogenic SOA species.
Limited experimental data for molar heat capacities of SOA species is available in the literature. Fukai et al. (1991) [49] used an automatic adiabatic calorimeter to estimate the specific heat capacity of malonic acid at a wide range of temperatures with a heating rate of 2.3 °C min−1. They reported a specific heat capacity of 128.1 J mol−1 K−1 for malonic acid at 299.1 K, which is approximately 6% lower than the value obtained in this study (137.1 J mol−1 K−1), attributed to the difference in the heating rate; a lower heat capacity is obtained at a lower heating rate [52]. The specific heat capacity of phthalic acid at 298 K is 187.1 J mol−1 K−1, as obtained using an aneroid calorimeter [50]. Bret-Dibat et al. (1989) [51] estimated the thermodynamic properties of some aromatic species using Kirchhoff’s equation (Equation (11)).
where To is a common reference temperature (usually 298.15 K), and ΔCp is Cp(vapor) − Cp(solid) for vaporization or Cp(vapor) − Cp(liquid) for evaporation. For catechol, Cp of 135.9 J mol−1 K1 is obtained, which agrees with the reported value (140.2 J mol−1 K−1) at 298 K. To date, the specific heat capacities of suberic acid, pinic acid, ketopinic acid, cis-pinonic acid, terpenylic acid, and DTAA have not been reported. Thus, the values obtained here would be good references for the thermodynamic properties of these SOA species.
3.2. Melting Point
TGA and DSC profiles of the SOA species in a temperature range of 25 °C to 300 °C at a heating rate of 2.5 °C min−1 are shown in the Supplementary Materials Figure S1. For all the charts, the blue solid and red striped lines represent the mass and heat curves of TGA/DSC, respectively. In most cases, a strong endothermic peak on the heat curve indicates the melting of SOA species. Herein, the rate of evaporation of the SOA species increased after fusion.
The change in calorific value as a function of temperature was steady but very rapid when a phase change occurred. The DSC profiles of adipic acid, catechol, cis-pinonic acid, ketopinic acid, benzoic acid, succinic acid, terpenylic acid, and 4-hrdroxybenzoic acids show only two endothermic peaks. The first peaks at 151.4 °C, 108.1 °C, 108.1 °C, 103.2 °C, 122.7 °C, 183.8 °C, 81.5 °C, and 214.2 °C, correspond to the respective Tm, and they are consistent with the reported values. For all the SOA species, a second endothermic peak occurred when the samples were completely vaporized (i.e., sample pan emptied), except for 4-hydroxy benzoic acid, which showed a second peak when 13% of the initial mass was remaining. All the SOA species showed typical TGA profiles with insignificant mass loss till Tm, indicating a vaporization phase (i.e., mass transfer from solid to gas phase). In addition, a rapid mass loss was observed after Tm, which is identified as the evaporation phase of molten samples.
For the case of malonic acid, pinic acid, and suberic acid, the first peaks were observed at 89.8 °C, 32.2 °C, and 133.9 °C, respectively, which are attributed to the thermal decomposition of the respective species. The second peaks at 132.8 °C, 94.9 °C, and 141.1 °C, respectively, corresponded to Tm. Similarly, for 3-MTBCA, the first endothermic peak with a little mass loss appeared at 38.4 °C, corresponding to the evaporation of impurity or volatile fractions due to decomposition. The second peak of 3-MTBCA corresponding to Tm was detected at 136.4 °C. For DTAA, three endothermic peaks were observed. The first peak at 110.0 °C indicates evaporation of volatile reagents used in the synthesis of DTAA. As DTAA was synthesized using multiple chemical species, an increase in temperature results in the decomposition of volatile fractions. The second peak corresponds to the melting of DTAA with an onset melting point (Tm) of 147.1 °C. The third endothermic peak between 205–260 °C corresponds to the temperature at which SOA species was completely evaporated. The thermogram of phthalic acid shows two endothermic peaks very close to each other. The first peak has an onset (Tm) of 193.2 °C and minima of 214.1 °C, and the second endothermic dip at 218.7 °C indicates complete vaporization. The TG curve shows that phthalic acid started to evaporate as it melted. The evaporation phase occurred at 26 °C. However, pure evaporation occurred only from 217 °C to 223 °C. All the samples were sublimated during the heating process. The melting points and enthalpies of the samples are listed in Table 2.
Table 2.
Melting temperatures and melting enthalpies at melting and room temperature of biogenic and anthropogenic SOA species.
3.3. Vaporization Enthalpy
In this study, benzoic acid was used as a reference compound to estimate the instrument-dependent k value. The thermogravimetric data, calorimetric data, and Antoine’s constants of benzoic acid are available in the literature [47,65,66,67,68]. Antoine’s constants A, B, and C in the temperature range of 132 °C–250 °C for benzoic acid are 7.80, 2776.12, and −43.97, respectively [69]. For each organic compound, the rate of mass loss (dm/dt) was calculated from the respective TGA curves. The vapor pressure of benzoic acid was estimated as a function of temperature using Antoine’s equation (Equation 8). A linear plot of p versus v in a temperature range of 135–165 °C (vaporization phase) is shown in Figure S2. From the plot, the mean k-value kavg was calculated equal to 4,453,444.50 kg0.5 s−1 m K−0.5 mol−0.5. Table S1 lists ki, kavg, and coefficient of determination (R2) for all samples at various temperature ranges.
The vapor pressure of benzoic acid was estimated as the product k and sample-dependent mass change v (observed in the TG profile). Antoine’s constant for SOA species is only available for the vaporization phase; thus, the TGA/DSC method cannot be used to accurately estimate the vapor pressure in the sublimation period. Therefore, we used the same k-value to estimate the vapor pressure of the SOA species for the sublimation and vaporization. Wright et al. (2002) [47] employed the same approach to estimate the enthalpies of sublimation and vaporization.
Figure 2a compares the estimated vapor pressure of benzoic acid (the product of kavg and v) in this study and the reported values obtained using Antoine’s constant in the NIST [69] database. The values are in good agreement, showing a linear regression of 98.3% for the evaporation regime. This indicates that the vapor pressure estimated beyond the fusion point of benzoic agrees well with the reported value. Figure S3 shows that the vapor pressure as a function of temperature for adipic acid and suberic acid are also in good agreement. In SOA study vapor pressure at room temperature might be appropriate and useful. The estimation of vapor pressure (P°298K) at room temperature using TGA/DSC data of this study is too uncertain because samples in our TGA/DSC analysis began to evaporate at a much higher temperature above room temperature. We obtained some preliminary data by extrapolation, but we determined not to report the data because of large uncertainties.
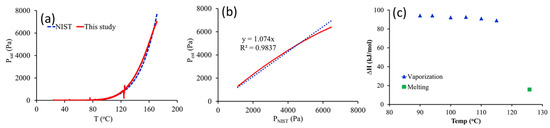
Figure 2.
For benzoic acid (a) Saturation vapor pressure as a function of temperature, (b) correlation of saturation vapor pressure estimated in this study and that reported by NIST, and (c) estimated enthalpies of sublimation, melting, and vaporization as a function of temperature.
The molar enthalpy of vaporization was calculated from the slope of the linear curve of ln(p) versus T−1. Table 3 compares the enthalpies of vaporization obtained in this study and the reported values in the literature. For the molar enthalpy of vaporization, the effect of temperature was negligible due to an insignificant mass-loss rate during vaporization (Figure S2).
Table 3.
Vaporization enthalpies of biogenic and anthropogenic SOA species.
The molar enthalpy values of vaporization for dicarboxylic acids, including malonic acid, succinic acid, adipic acid, and suberic acid were estimated as 132.7, 116.1, 99.0, and 94.12 kJ mol−1, respectively. For benzoic acid, phthalic acid, catechol, and 4-hydroxybenzoic acid, ΔHvap was estimated to be 93.2 ± 0.4, 131.6, 93.0 ± 2.5, and 119.5 kJ mol−1, respectively, and that of ketopinic acid, DTAA, and 3-MBTCA was 113.8, 130.2, and 67.2 kJ mol−1, respectively. ΔHvap was not reported for pinic acid and cis-pinoic acid. Cappa et al. (2008) [70] used the temperature-programmed desorption method to estimate the temperature-dependent vaporization of malonic acid and reported ΔHvap of 132.1 ± 5 kJ mol−1, which agrees well value obtained here (132.7 kJ mol−1). Using VTDMA, Salo et al. (2010) [9] estimated ΔHvap for succinic, adipic, and suberic acids as 112 ± 12, 97 ± 8, and 101 ± 10 kJ mol−1, respectively, which are consistent values obtained here (116.1, 99.0, and 94.1 92 kJ mol−1, respectively). Soonsin et al. (2010) [71] reported ΔHvap of 101 ± 10 and 101 ± 10 kJ mol−1 for malonic and succinic acids, respectively, which are approximately 15% and 5% lower than the values obtained here. The variation in the evaporation rate in the electrodynamic balance method is attributed to the transition of crystals to the amorphous state and vice versa. Ortiz-Montalvo et al. (2012) [78] has estimated ΔHvap of succinic acid to be 71.3 kJ mol−1 using SIMPOL.1. It is significantly lower than the experimental ΔHvap of 116.1, 112 ± 12, 125 ± 8, 119.5 kJ mol−1 of this study and earlier studies [9,71,72]. For adipic acid, Booth et al. (2010) [53] has reported ΔHvap of 119 ±1 8 kJ mol−1 based on DSC, which is approximately 30% higher than the 99 kJ mol−1 obtained in this study. This difference is attributed to the difference in the heating rate, N2 purging flow rate, and sample structure [47]. Furthermore, the variation in ΔHvap for adipic acid could also be attributed to its thermal decomposition to valeric acid [76]. Benzoic acid is used as a reference compound to estimate the thermodynamic properties of organic and SOA species. Using the DSC method, Murray et al. (1980) [65], and Gau-Yi et al. (2010) [74] estimated ΔHvap of benzoic acid as 89.7 ± 3 and 91.4 kJ mol−1, respectively, which are consistent with the value (93.2 ± 0.4 kJ mol−1) estimated in this study. For phthalic acid, ΔHvap of 129.8 and 135.9 ± 3.1 kJ mol−1 reported by Babar et al. (2020a) [76], and Sabbah et al. (1999) [61] respectively, agree well with the value obtained here. For ketopinic acid, ΔHvap of 113.8 kJ mol−1 in this study is comparable to 136.6 ± 3.5 kJ mol−1 of Babar et al. (2020a) using IVM [76]. For 3-MBTCA, the ΔHvap of 124.4 kJ mol−1 of this study is approximately 3% and 20% lower than the value of 128.4 ± 4.7 and 150 ± 15 kJ mol−1 reported by Babar et al. (2020b) [11], and Kostenidou et al. (2018) [64], respectively. The difference with the value obtained using the DMT method is because the accommodation coefficient α was assumed to be 1 by Kostenidou et al. (2018) [64], but it should range from 0.1 to 0.8 [79]. For DTAA, Babar et al. (2020b) [11] reported ΔHvap of 135.4 ± 3.7 kJ mol−1, which is comparable to 130.2 kJ mol−1 of this study. For cis-pinonic acid and pinic acid, a negligible evaporation rate was measured, indicating the low volatility of the compounds. ΔHvap of these compounds is likely to be similar to or greater than that of the other SOA components examined, given their relatively lower evaporation rates. The estimated value of ΔHvap for straight-chain and aromatic carboxylic acids are comparable with modeled and experimental data. A little discrepancy in the estimation of vaporization enthalpy in IVM, TDMA, VTDMA, and TGA-DSC might be attributed to the uncertainties in the measurement. As mentioned, replicate analyses of benzoic acid and catechol might imply minimal uncertainties in the estimation of thermodynamic properties of other examined compounds in this study.
Atmospheric modeling tools, such as volatility basis set, have provided a much better understanding of atmospheric chemistry by considering the decrease in OA volatility with aging. However, they underestimate OA concentrations due to the lack of understanding of the emission inventory and thermodynamic properties of OA [80]. A more accurate database for gas–particle partitioning parameters (such as C∗ and ΔHvap) may reduce the uncertainties in atmospheric models, such as CMAQ and PMCAMx [27,28,81,82,83]. Our experimental vaporization enthalpies are in the range of 93–135 kJ mol−1 for biogenic and anthropogenic SOA species. Kostenidou et al. (2018) [64] reported experimental ΔHvap of 150 ± 15 kJ mol−1 for 3-MBTCA. Zhang et al. (2022) [28] employed this value in CMAQ model for SOA formation in southwest China during June–August 2012. Boyd et al. (2017) [84] measured a very high ΔHvap of 237 kJ mol−1 for α-pinene SOA that is around 3 times higher than the 40–70 kJ mol−1 typically used in the atmospheric model [85]. Therefore, it needs more experimental data for the improvement of CTM in SOA formation. Our experimental data can improve the prediction of vapor pressure and SOA formation. There is still a need for more experimental data for accurate prediction of the gas–particle partitioning of OA.
4. Conclusions
In this study, we obtained a thermogravimetric profile to estimate the specific heat capacity (Cp), melting point (Tm), melting enthalpy (ΔHfus), and vaporization enthalpy (ΔHvap) of atmospherically relevant compounds. The Cp of malonic acid, suberic acid, benzoic acid, phthalic acid, catechol, pinic acid, ketopinic acid, cis-pinonic acid, terpenylic acid, and DTAA are 137.1, 221.5, 118.1, 169.4, 135.9,189.9, 223.9, 246.1, 223.2, and 524.1 J mol−1 K−1, respectively. Tm of malonic acid, succinic acid, adipic acid, suberic acid, benzoic acid, phthalic acid, catechol, pinic acid, ketopinic acid, cis-pinonic acid, terpenylic acid, DTAA, and 3-MBTCA are 132.8 °C, 183.8 °C, 151.4 °C, 141.1 °C, 122.7 °C, 193.9 °C, 108.1 °C, 94.9 °C, 103.1 °C, 107.1 °C, 81.5 °C, 131.1 °C, and 136.4 °C, and their ΔHfus is 22.7, 63.5, 35.0, 28.2, 14.2 ± 1.5, 102.4, 22.1 ± 0.8, 7.3, 13.9, 29.7, 7.9, 20.5, and 130.0 kJ mol−1, respectively. ΔHvap of malonic acid, succinic acid, adipic acid and suberic acid, benzoic acid, phthalic acid, catechol and 4-hydroxybenzoic acid, ketopinic acid, DTAA, and 3-MBTCA are 132.7, 116.1, 99.0, 94.12, 93.2 ± 0.4, 119.5, 131.6, 93.0 ± 2.5, 113.8, 130.2, and 124.4 kJ mol−1, respectively.
The obtained thermodynamic properties of the dicarboxylic acids agree well with the reported data. The difference between the estimated ΔHvap and the reported values is attributed to the difference in the experimental methods. A further investigation is needed to answer the insufficient evaporation rate for cyclic dicarboxylic acids. This study paves the way for understanding SOA in the atmosphere and serves as a good reference for developing new methods or techniques for predicting the variation of ΔHvap with temperature in the tropospheric temperature range.
Supplementary Materials
The following supporting information can be downloaded at: https://www.mdpi.com/article/10.3390/atmos13050709/s1, Figure S1: TGA and DSC profiles for (a) Malonic acid, (b) Succinic acid, (c) Adipic acid, (d) Suberic acid, (e) Benzoic acid, (f) Phthalic acid, (g) Catechol, (h) Pinic acid, (i) Ketopinic acid, (j) cis-Pinonic acid, (k) 3-MBTCA, (l) Terpenylic acid, (m) DTAA, and (n) 4-Hydroxybenzoic acid.; Figure S2: Estimated kavg for benzoic acid at 135 °C to 160 °C (vaporization phase) with a step change of 5 °C.; Table S1: Estimated ki-values and coefficient of determination at corresponding temperature ranges using benzoic acid as a reference compound; Figure S3: Correlation of the estimated saturation vapor pressure with that reported in NIST for (a) adipic acid. (b) suberic acid. (c) Catechol.; Figure S4: A Saturation vapor pressure as a function of time for (a) Malonic acid, (b) Succinic acid, (c) Adipic acid, (d) Suberic acid, (e) Phthalic acid, (f) Catechol, (g) Pinic acid, (h) Ketopinic acid, (i) cis-Pinonic acid, (j) 3-MBTCA, (k) Terpenylic acid, and (l) DTAA.
Author Contributions
F.A.: Methodology, Investigation, Formal analysis, Writing—original draft. Z.B.B.: Methodology, Investigation. J.-H.P.: Resources. P.D.Q.D.: Resources. C.S.C.: Resources. H.-J.L.: Conceptualization, Writing—review and editing, Supervision. All authors have read and agreed to the published version of the manuscript.
Funding
This research was supported by the FRIEND (Fine Particles Research Initiative in East Asia Considering National Differences) Project through National Research Foundation of Korea (NRF) funded by the Ministry of Science and ICT (NRF-2020M3G1A1114560).
Institutional Review Board Statement
Not applicable.
Informed Consent Statement
Not applicable.
Data Availability Statement
Data are available after request to corresponding author.
Conflicts of Interest
The authors declare no conflict of interest.
References
- Anderson, J.O.; Thundiyil, J.G.; Stolbach, A. Clearing the Air: A Review of the Effects of Particulate Matter Air Pollution on Human Health. J. Med. Toxicol. 2012, 8, 166–175. [Google Scholar] [CrossRef] [PubMed]
- Rao, X.; Zhong, J.; Brook, R.D.; Rajagopalan, S. Effect of Particulate Matter Air Pollution on Cardiovascular Oxidative Stress Pathways. Antioxid. Redox Signal. 2018, 28, 797–818. [Google Scholar] [CrossRef] [PubMed]
- Pöschl, U. Atmospheric aerosols: Composition, transformation, climate and health effects. Angew. Chem. Int. Ed. 2005, 44, 7520–7540. [Google Scholar] [CrossRef] [PubMed]
- Hallquist, M.; Wenger, J.C.; Baltensperger, U.; Rudich, Y.; Simpson, D.; Claeys, M.; Dommen, J.; Donahue, N.M.; George, C.; Goldstein, A.H.; et al. The formation, properties and impact of secondary organic aerosol: Current and emerging issues. Atmos. Chem. Phys. 2009, 9, 5155–5236. [Google Scholar] [CrossRef]
- Zhang, Q.; Jimenez, J.L.; Canagaratna, M.R.; Ulbrich, I.M.; Ng, N.L.; Worsnop, D.R.; Sun, Y. Understanding atmospheric organic aerosols via factor analysis of aerosol mass spectrometry: A review. Anal. Bioanal. Chem. 2011, 401, 3045–3067. [Google Scholar] [CrossRef]
- D’Ambro, E.L.; Schobesberger, S.; Gaston, C.J.; Lopez-Hilfiker, F.D.; Lee, B.H.; Liu, J.; Zelenyuk, A.; Bell, D.; Cappa, C.D.; Helgestad, T.; et al. Chamber-based insights into the factors controlling epoxydiol (IEPOX) secondary organic aerosol (SOA) yield, composition, and volatility. Atmos. Chem. Phys. 2019, 19, 11253–11265. [Google Scholar] [CrossRef]
- Shilling, J.E.; Zawadowicz, M.A.; Liu, J.; Zaveri, R.A.; Zelenyuk, A. Photochemical Aging Alters Secondary Organic Aerosol Partitioning Behavior. ACS Earth Space Chem. 2019, 3, 2704–2716. [Google Scholar] [CrossRef]
- Saleh, R.; Khlystov, A.; Shihadeh, A. Effect of aerosol generation method on measured saturation pressure and enthalpy of vaporization for dicarboxylic acid aerosols. Aerosol Sci. Technol. 2010, 44, 302–307. [Google Scholar] [CrossRef]
- Salo, K.; Jonsson, Å.M.; Andersson, P.U.; Hallquist, M. Aerosol volatility and enthalpy of sublimation of carboxylic acids. J. Phys. Chem. A 2010, 114, 4586–4594. [Google Scholar] [CrossRef]
- Lamb, B.; Grosjean, D.; Pun, B.; Seigneur, C. Review of the Emissions, Atmospheric Chemistry, and Gas/Particle Partition of Biogenic Volatile Organic Compounds and Reaction Products. Final Rep. 1999, NTIS PB2000, 192875. [Google Scholar]
- Babar, Z.B.; Ashraf, F.; Park, J.-H.; Duy, P.; Dao, Q.; Cho, C.S.; Lim, H.-J.; Quang Dao, P.D.; Cho, C.S.; Lim, H.-J. Exploring Volatility Properties of Discrete Secondary Organic Aerosol Constituents of α-Pinene and Polycyclic Aromatic Hydrocarbons. ACS Earth Space Chem. 2020, 4, 2299–2311. [Google Scholar] [CrossRef]
- Kołodziejczyk, A.; Pyrcz, P.; Pobudkowska, A.; Błaziak, K.; Szmigielski, R. Physicochemical Properties of Pinic, Pinonic, Norpinic, and Norpinonic Acids as Relevant α-Pinene Oxidation Products. J. Phys. Chem. B 2019, 123, 8261–8267. [Google Scholar] [CrossRef] [PubMed]
- Park, J.H.; Babar, Z.B.; Baek, S.J.; Kim, H.S.; Lim, H.J. Effects of NOx on the molecular composition of secondary organic aerosol formed by the ozonolysis and photooxidation of A-pinene. Atmos. Environ. 2017, 166, 263–275. [Google Scholar] [CrossRef]
- Fick, J.; Pommer, L.; Nilsson, C.; Andersson, B. Effect of OH radicals, relative humidity, and time on the composition of the products formed in the ozonolysis of α-pinene. Atmos. Environ. 2003, 37, 4087–4096. [Google Scholar] [CrossRef]
- Grayson, J.W.; Zhang, Y.; Mutzel, A.; Renbaum-Wolff, L.; Böge, O.; Kamal, S.; Herrmann, H.; Martin, S.T.; Bertram, A.K. Effect of varying experimental conditions on the viscosity of α-pinene derived secondary organic material. Atmos. Chem. Phys. Discuss. 2015, 15, 32967–33002. [Google Scholar] [CrossRef]
- Mutzel, A.; Rodigast, M.; Iinuma, Y.; Böge, O.; Herrmann, H. Monoterpene SOA–contribution of first-generation oxidation products to formation and chemical composition. Atmos. Environ. 2016, 130, 136–144. [Google Scholar] [CrossRef]
- Emanuelsson, E.U.; Hallquist, M.; Kristensen, K.; Glasius, M.; Bohn, B.; Fuchs, H.; Kammer, B.; Kiendler-Scharr, A.; Nehr, S.; Rubach, F.; et al. Formation of anthropogenic secondary organic aerosol (SOA) and its influence on biogenic SOA properties. Atmos. Chem. Phys. 2013, 13, 2837–2855. [Google Scholar] [CrossRef]
- Jaoui, M.; Corse, E.; Kleindienst, T.E.; Offenberg, J.H.; Lewandowski, M.; Edney, E.O. Analysis of secondary organic aerosol compounds from the photooxidation of d-limonene in the presence of NOx and their detection in ambient PM2.5. Environ. Sci. Technol. 2006, 40, 3819–3828. [Google Scholar] [CrossRef]
- Yasmeen, F.; Szmigielski, R.; Vermeylen, R.; Gõmez-González, Y.; Surratt, J.D.; Chan, A.W.H.; Seinfeld, J.H.; Maenhaut, W.; Claeys, M. Mass spectrometric characterization of isomeric terpenoic acids from the oxidation of α-pinene, β-pinene, d-limonene, and Î" 3-carene in fine forest aerosol. J. Mass Spectrom. 2011, 46, 425–442. [Google Scholar] [CrossRef]
- Tang, G.; Liu, M.; Zhou, Q.; He, H.; Chen, K.; Zhang, H.; Hu, J.; Huang, Q.; Luo, Y.; Ke, H. Microplastics and polycyclic aromatic hydrocarbons (PAHs) in Xiamen coastal areas: Implications for anthropogenic impacts. Sci. Total Environ. 2018, 634, 811–820. [Google Scholar] [CrossRef]
- Srivastava, D.; Daellenbach, K.R.; Zhang, Y.; Bonnaire, N.; Chazeau, B.; Perraudin, E.; Gros, V.; Lucarelli, F.; Villenave, E.; Prévôt, A.S.H.; et al. Comparison of five methodologies to apportion organic aerosol sources during a PM pollution event. Sci. Total Environ. 2021, 757, 143168. [Google Scholar] [CrossRef] [PubMed]
- Ho, K.F.; Ho, S.S.H.; Lee, S.C.; Kawamura, K.; Zou, S.C.; Cao, J.J.; Xu, H.M. Summer and winter variations of dicarboxylic acids, fatty acids and benzoic acid in PM2.5 in Pearl Delta River Region, China. Atmos. Chem. Phys. 2011, 11, 2197–2208. [Google Scholar] [CrossRef]
- Chhabra, P.S.; Lambe, A.T.; Canagaratna, M.R.; Stark, H.; Jayne, J.T.; Onasch, T.B.; Davidovits, P.; Kimmel, J.R.; Worsnop, D.R. Application of high-resolution time-of-flight chemical ionization mass spectrometry measurements to estimate volatility distributions of α-pinene and naphthalene oxidation products. Atmos. Meas. Tech. 2015, 8, 1–18. [Google Scholar] [CrossRef]
- Michoud, V.; Hallemans, E.; Chiappini, L.; Leoz-Garziandia, E.; Colomb, A.; Dusanter, S.; Fronval, I.; Gheusi, F.; Jaffrezo, J.L.; Léonardis, T.; et al. Molecular characterization of gaseous and particulate oxygenated compounds at a remote site in Cape Corsica in the western Mediterranean Basin. Atmos. Chem. Phys. 2021, 21, 8067–8088. [Google Scholar] [CrossRef]
- Gao, X.; Zhang, Y.; Liu, Y. Temperature-dependent hygroscopic behaviors of atmospherically relevant water-soluble carboxylic acid salts studied by ATR-FTIR spectroscopy. Atmos. Environ. 2018, 191, 312–319. [Google Scholar] [CrossRef]
- Jia, L.; Xu, Y. Effects of relative humidity on ozone and secondary organic aerosol formation from the photooxidation of benzene and ethylbenzene. Aerosol. Sci. Technol. 2014, 48, 1–12. [Google Scholar] [CrossRef]
- Ciarelli, G.; Haddad, I.E.; Bruns, E.; Aksoyoglu, S.; Möhler, O.; Baltensperger, U.; Prévôt, A.S.H. Constraining a hybrid volatility basis-set model for aging of wood-burning emissions using smog chamber experiments: A box-model study based on the VBS scheme of the CAMx model (v5.40). Geosci. Model Dev. 2017, 10, 2303–2320. [Google Scholar] [CrossRef]
- Zhang, J.; He, X.; Ding, X.; Yu, J.Z.; Ying, Q. Modeling Secondary Organic Aerosol Tracers and Tracer-to-SOA Ratios for Monoterpenes and Sesquiterpenes Using a Chemical Transport Model. Environ. Sci. Technol. 2022, 56, 804–813. [Google Scholar] [CrossRef]
- Pennington, E.A.; Seltzer, K.M.; Murphy, B.N.; Qin, M.; Seinfeld, J.H.; Pye, H.O.T. Modeling secondary organic aerosol formation from volatile chemical products. Atmos. Chem. Phys. 2021, 21, 18247–18261. [Google Scholar] [CrossRef]
- Lane, T.E.; Donahue, N.M.; Pandis, S.N. Effect of NOx on secondary organic aerosol concentrations. Environ. Sci. Technol. 2008, 42, 6022–6027. [Google Scholar] [CrossRef]
- Weagle, C.L.; Snider, G.; Li, C.; Van Donkelaar, A.; Philip, S.; Bissonnette, P.; Burke, J.; Jackson, J.; Latimer, R.; Stone, E.; et al. Global Sources of Fine Particulate Matter: Interpretation of PM2.5 Chemical Composition Observed by SPARTAN using a Global Chemical Transport Model. Environ. Sci. Technol. 2018, 52, 11670–11681. [Google Scholar] [CrossRef] [PubMed]
- Bilde, M.; Barsanti, K.; Booth, M.; Cappa, C.D.; Donahue, N.M.; Emanuelsson, E.U.; McFiggans, G.; Krieger, U.K.; Marcolli, C.; Topping, D.; et al. Saturation Vapor Pressures and Transition Enthalpies of Low-Volatility Organic Molecules of Atmospheric Relevance: From Dicarboxylic Acids to Complex Mixtures. Chem. Rev. 2015, 115, 4115–4156. [Google Scholar] [CrossRef] [PubMed]
- Saleh, R.; Walker, J.; Khlystov, A. Determination of saturation pressure and enthalpy of vaporization of semi-volatile aerosols: The integrated volume method. J. Aerosol Sci. 2008, 39, 876–887. [Google Scholar] [CrossRef]
- Alibakhshi, A. Enthalpy of vaporization, its temperature dependence and correlation with surface tension: A theoretical approach. Fluid Phase Equilib. 2017, 432, 62–69. [Google Scholar] [CrossRef]
- Donahue, N.M.; Robinson, A.L.; Stanier, C.O.; Pandis, S.N. Coupled partitioning, dilution, and chemical aging of semivolatile organics. Environ. Sci. Technol. 2006, 40, 2635–2643. [Google Scholar] [CrossRef]
- Donahue, N.M.; Kroll, J.H.; Pandis, S.N.; Robinson, A.L. A two-dimensional volatility basis set-Part 2: Diagnostics of organic-aerosol evolution. Atmos. Chem. Phys. 2012, 12, 615–634. [Google Scholar] [CrossRef]
- Pankow, J.F.; Asher, W.E. SIMPOL.1: A simple group contribution method for predicting vapor pressures and enthalpies of vaporization of multifunctional organic compounds. Atmos. Chem. Phys. 2008, 8, 2773–2796. [Google Scholar] [CrossRef]
- Chickos, J.S.; Acree, W.E. Enthalpies of vaporization of organic and organometallic compounds, 1880-2002. J. Phys. Chem. Ref. Data 2003, 32, 519–878. [Google Scholar] [CrossRef]
- Ribeiro Da Silva, M.A.V.; Monte, M.J.S.; Ribeiro, J.R. Vapour pressures and the enthalpies and entropies of sublimation of five dicarboxylic acids. J. Chem. Thermodyn. 1999, 31, 1093–1107. [Google Scholar] [CrossRef]
- Bernardes, C.E.S.; Joseph, A.; da Piedade, M.E.M. Some practical aspects of heat capacity determination by differential scanning calorimetry. Thermochim. Acta 2020, 687, 178574. [Google Scholar] [CrossRef]
- Giani, S.; Riesen, R.; Schawe, J.E.K. An Indirect Method for Vapor Pressure and Phase Change Enthalpy Determination by Thermogravimetry. Int. J. Thermophys. 2018, 39, 84. [Google Scholar] [CrossRef]
- Ramos, F.; Ledo, J.M.; Flores, H.; Camarillo, E.A.; Carvente, J.; Amador, M.P. Evaluation of sublimation enthalpy by thermogravimetry: Analysis of the diffusion effects in the case of methyl and phenyl substituted hydantoins. Thermochim. Acta 2017, 655, 181–193. [Google Scholar] [CrossRef]
- Booth, A.M.; Montague, W.J.; Barley, M.H.; Topping, D.O.; McFiggans, G.; Garforth, A.; Percival, C.J. Solid state and sub-cooled liquid vapour pressures of cyclic aliphatic dicarboxylic acids. Atmos. Chem. Phys. 2011, 11, 655–665. [Google Scholar] [CrossRef]
- ASTM E1269-11; Standard Test Method for Determining Specific Heat Capacity by Differential Scanning Calorimetry. ASTM International: West Conshohocken, PA, USA, 2018.
- Mourad, A.H.I.; Akkad, R.O.; Soliman, A.A.; Madkour, T.M. Characterisation of thermally treated and untreated polyethylene- polypropylene blends using DSC, TGA and IR techniques. Plast. Rubber Compos. 2009, 38, 265–278. [Google Scholar] [CrossRef]
- Chickos, J.S.; Hosseini, S.; Hesse, D.G.; Liebman, J.F. Heat capacity corrections to a standard state: A comparison of new and some literature methods for organic liquids and solids. Struct. Chem. 1993, 4, 271–278. [Google Scholar] [CrossRef]
- Wright, S.F.; Phang, P.; Dollimore, D.; Alexander, K.S. An overview of calibration materials used in thermal analysis—Benzoic acid. Thermochim. Acta 2002, 392–393, 251–257. [Google Scholar] [CrossRef]
- Santos, L.M.N.B.F.; Rocha, M.A.A.; Gomes, L.R.; Schröder, B.; Coutinho, J.A.P. Gaseous phase heat capacity of benzoic acid. J. Chem. Eng. Data 2010, 55, 2799–2808. [Google Scholar] [CrossRef]
- Fukai, M.; Matsuo, T.; Suga, H. Thermodynamic properties of phase transitions in malonic acid and its deuterated analogue. Thermochim. Acta 1991, 183, 215–243. [Google Scholar] [CrossRef]
- Parks, G.S.; West, T.J.; Moore, G.E. Thermal Data on Organic Compounds. XXI. Some Heat Capacity, Entropy and Free Energy Data for the Four Methylnonanes. J. Am. Chem. Soc. 1941, 63, 1133–1135. [Google Scholar] [CrossRef]
- Bret-Dibat, P.; Lichanot, A. Proprietes thermodynamiques des isomeres de position de benzenes disubstitues en phase condensee. Thermochim. Acta 1989, 147, 261–271. [Google Scholar] [CrossRef]
- Iten, M.; Liu, S.; Shukla, A.; Silva, P.D. Investigating the impact of Cp-T values determined by DSC on the PCM-CFD model. Appl. Therm. Eng. 2017, 117, 65–75. [Google Scholar] [CrossRef]
- Booth, A.M.; Barley, M.H.; Topping, D.O.; McFiggans, G.; Garforth, A.; Percival, C.J. Solid state and sub-cooled liquid vapour pressures of substituted dicarboxylic acids using Knudsen Effusion Mass Spectrometry (KEMS) and Differential Scanning Calorimetry. Atmos. Chem. Phys. 2010, 10, 4879–4892. [Google Scholar] [CrossRef]
- Bilde, M.; Svenningsson, B.; Mønster, J.; Rosenørn, T. Even-odd alternation of evaporation rates and vapor pressures of C3-C9 dicarboxylic acid aerosols. Environ. Sci. Technol. 2003, 37, 1371–1378. [Google Scholar] [CrossRef]
- Acree, W.E. Thermodynamic properties of organic compounds: Enthalpy of fusion and melting point temperature compilation. Thermochim. Acta 1991, 189, 37–56. [Google Scholar] [CrossRef]
- Roux, M.V.; Temprado, M.; Chickos, J.S. Vaporization, fusion and sublimation enthalpies of the dicarboxylic acids from C4 to C14 and C16. J. Chem. Thermodyn. 2005, 37, 941–953. [Google Scholar] [CrossRef]
- Sharma, B.L.; Kant, R.; Sharma, R.; Tandon, S. Deviations of binary organic eutectic melt systems. Mater. Chem. Phys. 2003, 82, 216–224. [Google Scholar] [CrossRef]
- Brittain, H.G. Vibrational spectroscopic studies of cocrystals and salts. 2. The benzylamine-benzoic acid system. Cryst. Growth Des. 2009, 9, 3497–3503. [Google Scholar] [CrossRef]
- Gracin, S.; Rasmuson, Å.C. Solubility of phenylacetic acid, p-hydroxyphenylacetic acid, p-aminophenylacetic acid, p-hydroxybenzoic acid, and ibuprofen in pure solvents. J. Chem. Eng. Data 2002, 47, 1379–1383. [Google Scholar] [CrossRef]
- Nordström, F.L.; Rasmuson, Å.C. Phase equilibria and thermodynamics of p-hydroxybenzoic acid. J. Pharm. Sci. 2006, 95, 748–760. [Google Scholar] [CrossRef]
- Sabbah, R.; Perez, L. Thermodynamic study of phthalic, isophthalic, and terephthalic acids. Can. J. Chem. Can. Chim. 1999, 77, 1508–1513. [Google Scholar] [CrossRef]
- Lee, M.J.; Chang, Y.K.; Lin, H.M.; Chen, C.H. Solid-liquid equilibria for 4-methoxyphenol with catechol, ethylenediamine, or piperazine. J. Chem. Eng. Data 1997, 42, 349–352. [Google Scholar] [CrossRef]
- Verevkin, S.P.; Kozlova, S.A. Di-hydroxybenzenes: Catechol, resorcinol, and hydroquinone. Enthalpies of phase transitions revisited. Thermochim. Acta 2008, 471, 33–42. [Google Scholar] [CrossRef]
- Kostenidou, E.; Karnezi, E.; Kolodziejczyk, A.; Szmigielski, R.; Pandis, S.N. Physical and Chemical Properties of 3-Methyl-1,2,3-butanetricarboxylic Acid (MBTCA) Aerosol. Environ. Sci. Technol. 2018, 52, 1150–1155. [Google Scholar] [CrossRef] [PubMed]
- Murray, J.P.; Cavell, K.J.; Hill, J.O. A DSC study of benzoic acid: A suggested calibrant compound. Thermochim. Acta 1980, 36, 97–101. [Google Scholar] [CrossRef]
- Chatterjee, K.; Dollimore, D.; Alexander, K.S. Calculation of vapor pressure curves for hydroxy benzoic acid derivatives using thermogravimetry. Thermochim. Acta 2002, 392, 107–117. [Google Scholar] [CrossRef]
- Chatterjee, K.; Hazra, A.; Dollimore, D.; Alexander, K.S. Estimating vapor pressure curves by thermogravimetry: A rapid and convenient method for characterization of pharmaceuticals. Eur. J. Pharm. Biopharm. 2002, 54, 171–180. [Google Scholar] [CrossRef]
- Roy, S.; Riga, A.T.; Alexander, K.S. Experimental design aids the development of a differential scanning calorimetry standard test procedure for pharmaceuticals. Thermochim. Acta 2002, 392–393, 399–404. [Google Scholar] [CrossRef]
- National Institute of Standards and Technology (2021) Benzoic acid. Available online: https://webbook.nist.gov/cgi/cbook.cgi?ID=C65850&Mask=4&Type=ANTOINE&Plot=on (accessed on 3 April 2021).
- Cappa, C.D.; Lovejoy, E.R.; Ravishankara, A.R. Evidence for liquid-like and nonideal behavior of a mixture of organic aerosol components. Proc. Natl. Acad. Sci. USA 2008, 105, 18687–18691. [Google Scholar] [CrossRef]
- Soonsin, V.; Zardini, A.A.; Marcolli, C.; Zuend, A.; Krieger, U.K. The vapor pressures and activities of dicarboxylic acids reconsidered: The impact of the physical state of the aerosol. Atmos. Chem. Phys. 2010, 10, 11753–11767. [Google Scholar] [CrossRef]
- Chattopadhyay, S.; Ziemann, P.J. Vapor pressures of substituted and unsubstituted monocarboxylic and dicarboxylic acids measured using an improved thermal desorption particle beam mass spectrometry method. Aerosol Sci. Technol. 2005, 39, 1085–1100. [Google Scholar] [CrossRef]
- Tao, Y.; Mcmurry, P.H. Vapor Pressures and Surface Free Energies of C14-C18 Monocarboxylic Acids and C5 and C6 Dicarboxylic Acids. Environ. Sci. Technol. 1989, 23, 1519–1523. [Google Scholar] [CrossRef]
- Gao, G.-Y.; Lin, S.-Y. Thermodynamic investigations of nitroxoline sublimation by simultaneous DSC-FTIR method and isothermal TG analysis. J. Pharm. Sci. 2010, 99, 255–261. [Google Scholar] [CrossRef] [PubMed]
- Heath, E.A.; Singh, P.; Ebisuzaki, Y. Structure of p-hydroxybenzoic acid and p-hydroxybenzoic acid-acetone complex (2/1). Acta Crystallogr. Sect. C Cryst. Struct. Commun. 1992, 48, 1960–1965. [Google Scholar] [CrossRef]
- Babar, Z.B.; Ashraf, F.; Park, J.-H.H.; Lim, H.-J.J. Volatility parameters of secondary organic aerosol components determined using a thermal denuder. Atmos. Environ. 2020, 226, 117405. [Google Scholar] [CrossRef]
- Chen, X.; Oja, V.; Chan, W.G.; Hajaligol, M.R. Vapor pressure characterization of several phenolics and polyhydric compounds by Knudsen effusion method. J. Chem. Eng. Data 2006, 51, 386–391. [Google Scholar] [CrossRef]
- Ortiz-Montalvo, D.L.; Lim, Y.B.; Perri, M.J.; Seitzinger, S.P.; Turpin, B.J. Volatility and yield of glycolaldehyde SOA formed through aqueous photochemistry and droplet evaporation. Aerosol Sci. Technol. 2012, 46, 1002–1014. [Google Scholar] [CrossRef]
- Saha, P.K.; Grieshop, A.P. Exploring Divergent Volatility Properties from Yield and Thermodenuder Measurements of Secondary Organic Aerosol from α-Pinene Ozonolysis. Environ. Sci. Technol. 2016, 50, 5740–5749. [Google Scholar] [CrossRef]
- Sato, K.; Fujitani, Y.; Inomata, S.; Morino, Y.; Tanabe, K.; Hikida, T.; Shimono, A.; Takami, A.; Fushimi, A.; Kondo, Y.; et al. A study of volatility by composition, heating, and dilution measurements of secondary organic aerosol from 1,3,5-trimethylbenzene. Atmos. Chem. Phys. 2019, 19, 14901–14915. [Google Scholar] [CrossRef]
- Carlton, A.G.; Bhave, P.V.; Napelenok, S.L.; Edney, E.O.; Sarwar, G.; Pinder, R.W.; Pouliot, G.A.; Houyoux, M.; Agency, U.S.E.P.; Carolina, N.; et al. Model representation of secondary organic aerosol in CMAQv4.7. Environ. Sci. Technol. 2010, 44, 8553–8560. [Google Scholar] [CrossRef]
- Sakulyanontvittaya, T.; Guenther, A.; Helmig, D.; Milford, J.; Wiedinmyer, C. Secondary organic aerosol from sesquiterpene and monoterpene emissions in the United States. Environ. Sci. Technol. 2008, 42, 8784–8790. [Google Scholar] [CrossRef][Green Version]
- Bian, F.; Bowman, F.M. A lumping model for composition- and temperature-dependent partitioning of secondary organic aerosols. Atmos. Environ. 2005, 39, 1263–1274. [Google Scholar] [CrossRef]
- Boyd, C.M.; Nah, T.; Xu, L.; Berkemeier, T.; Ng, N.L. Secondary Organic Aerosol (SOA) from Nitrate Radical Oxidation of Monoterpenes: Effects of Temperature, Dilution, and Humidity on Aerosol Formation, Mixing, and Evaporation. Environ. Sci. Technol. 2017, 51, 7831–7841. [Google Scholar] [CrossRef] [PubMed]
- Tsigaridis, K.; Daskalakis, N.; Kanakidou, M.; Adams, P.J.; Artaxo, P.; Bahadur, R.; Balkanski, Y.; Bauer, S.E.; Bellouin, N.; Benedetti, A. The AeroCom evaluation and intercomparison of organic aerosol in global models. Atmos. Chem. Phys. 2014, 14, 10845–10895. [Google Scholar] [CrossRef]


Publisher’s Note: MDPI stays neutral with regard to jurisdictional claims in published maps and institutional affiliations. |
© 2022 by the authors. Licensee MDPI, Basel, Switzerland. This article is an open access article distributed under the terms and conditions of the Creative Commons Attribution (CC BY) license (https://creativecommons.org/licenses/by/4.0/).