
The Effects of Local Pollution and Transport Dust on Aerosol Properties in Typical Arid Regions of Central Asia during DAO-K Measurement

 ,
,  ,
,  ,
,  , , and
Abstract
:1. Introduction
2. Materials and Methods
2.1. Materials
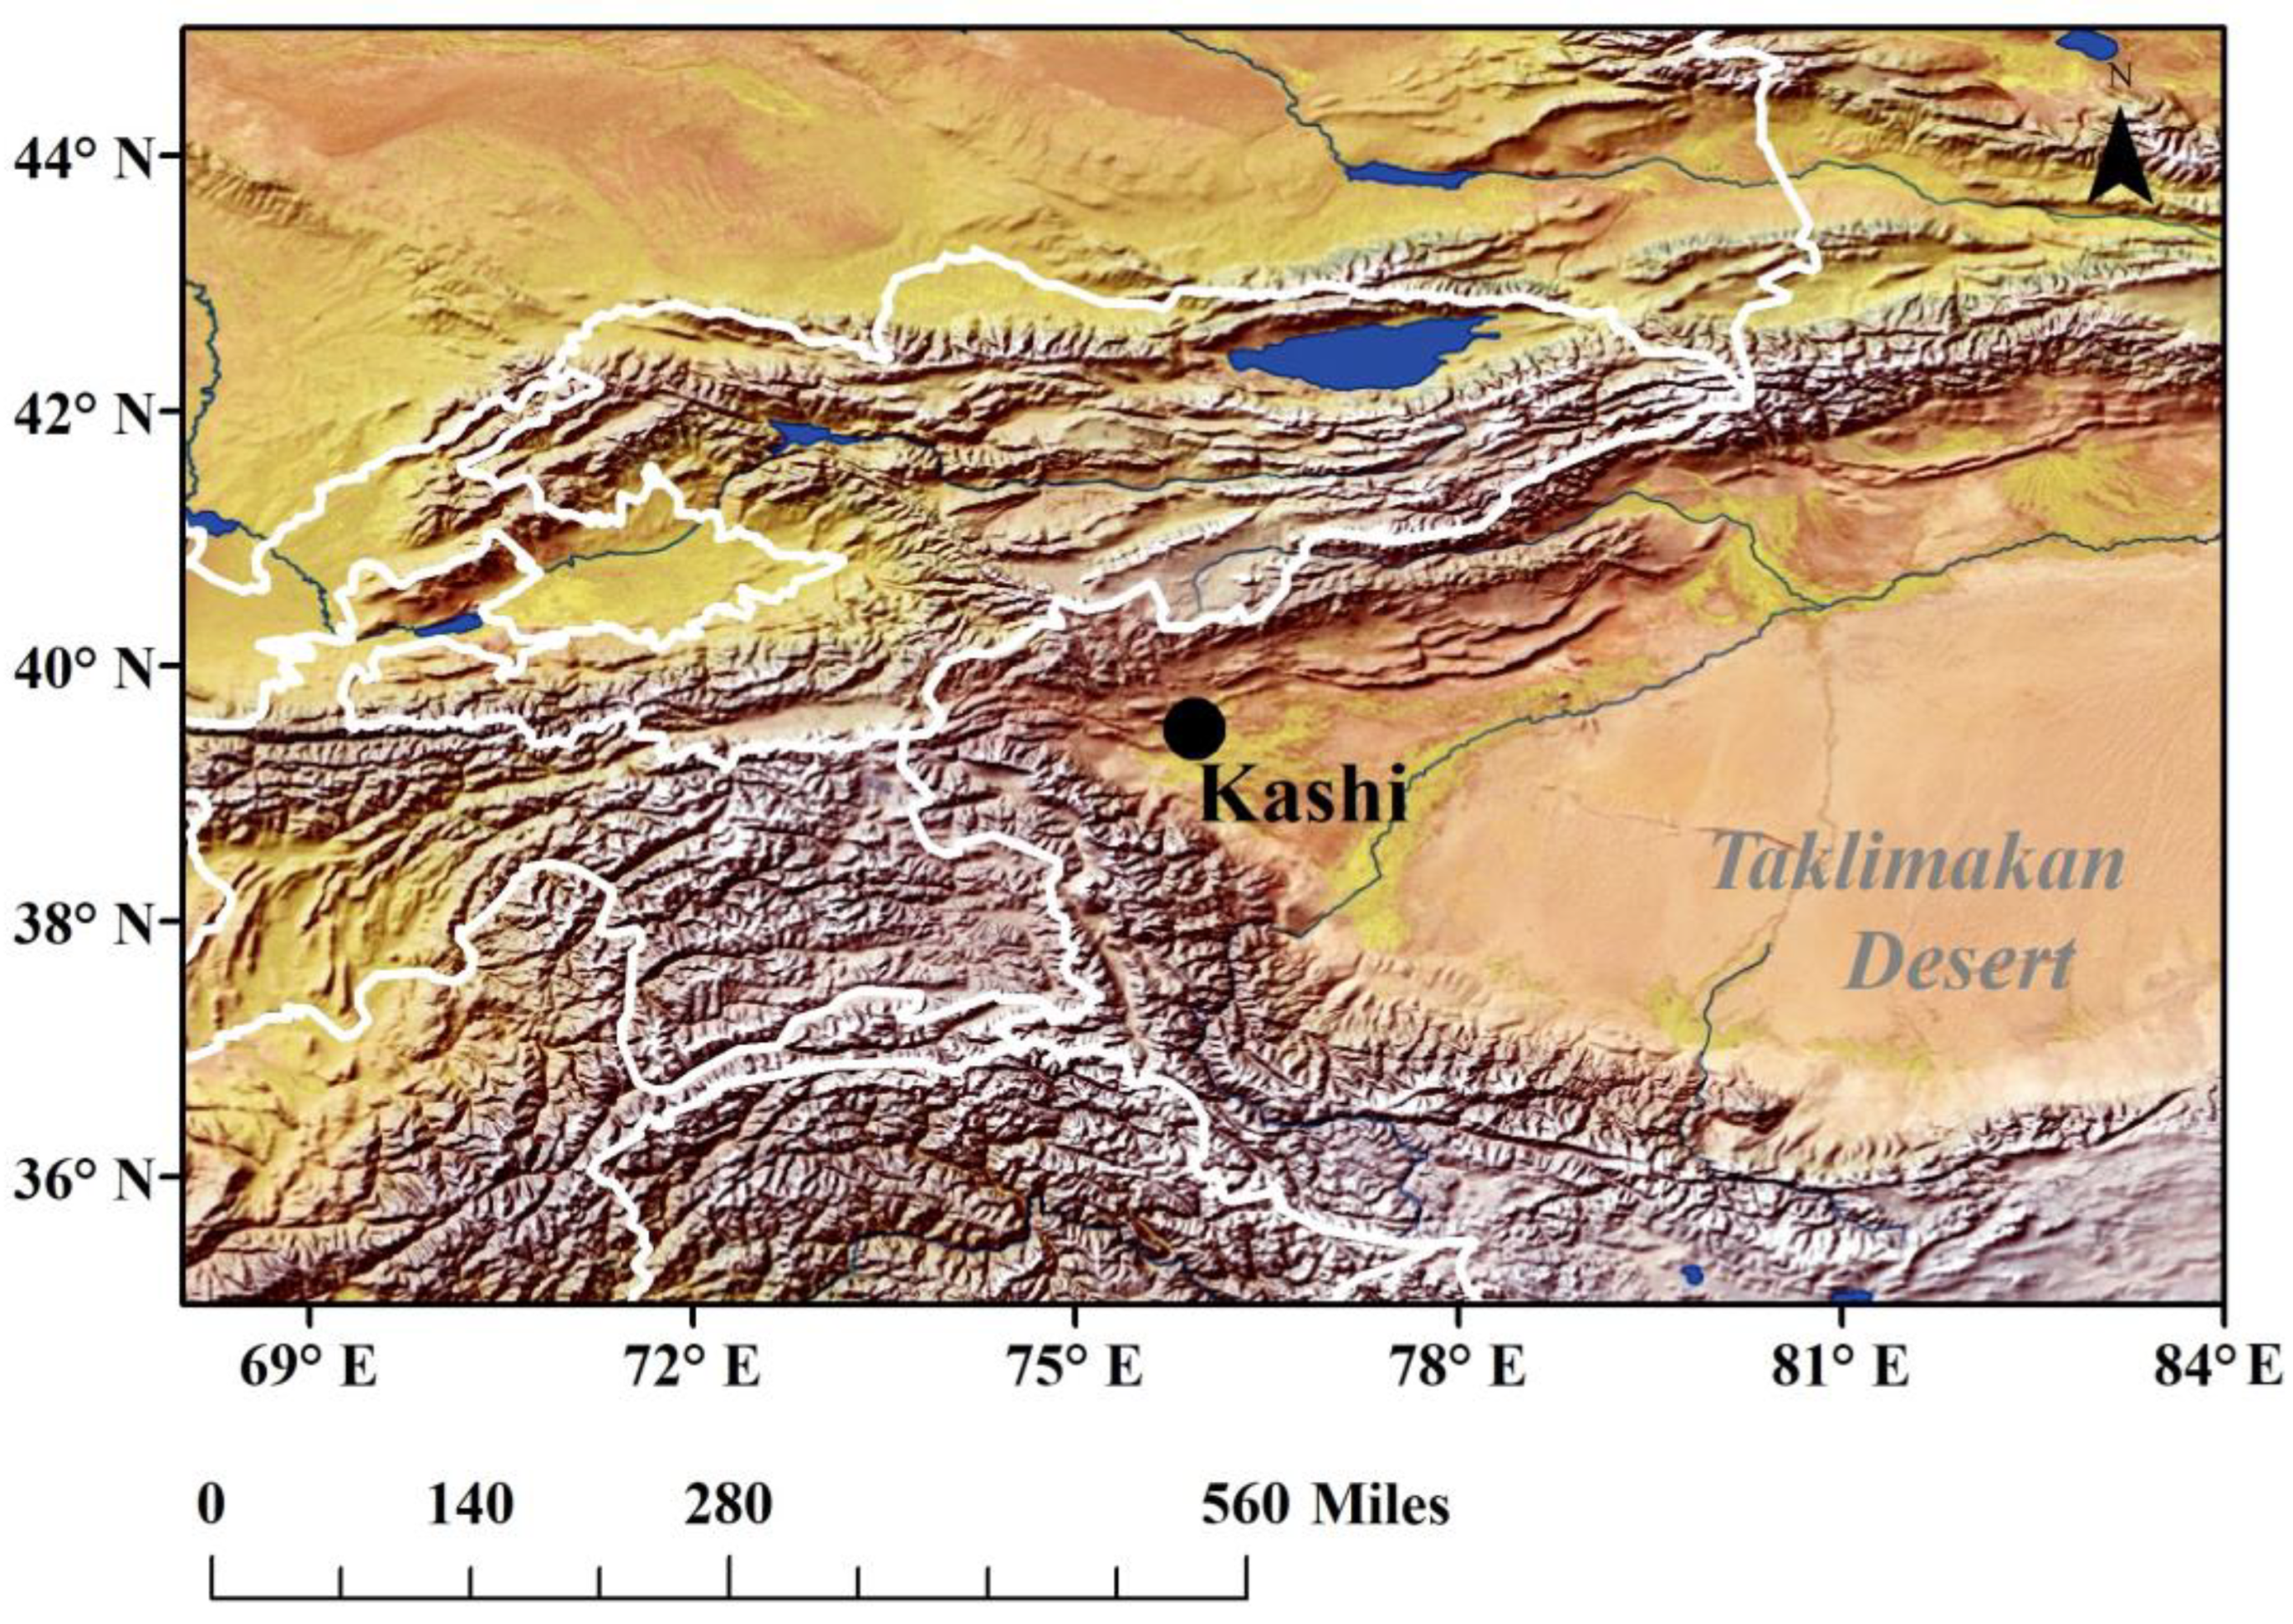
2.1.1. Study Area
2.1.2. Simultaneous Observations by Instruments
2.2. Methods
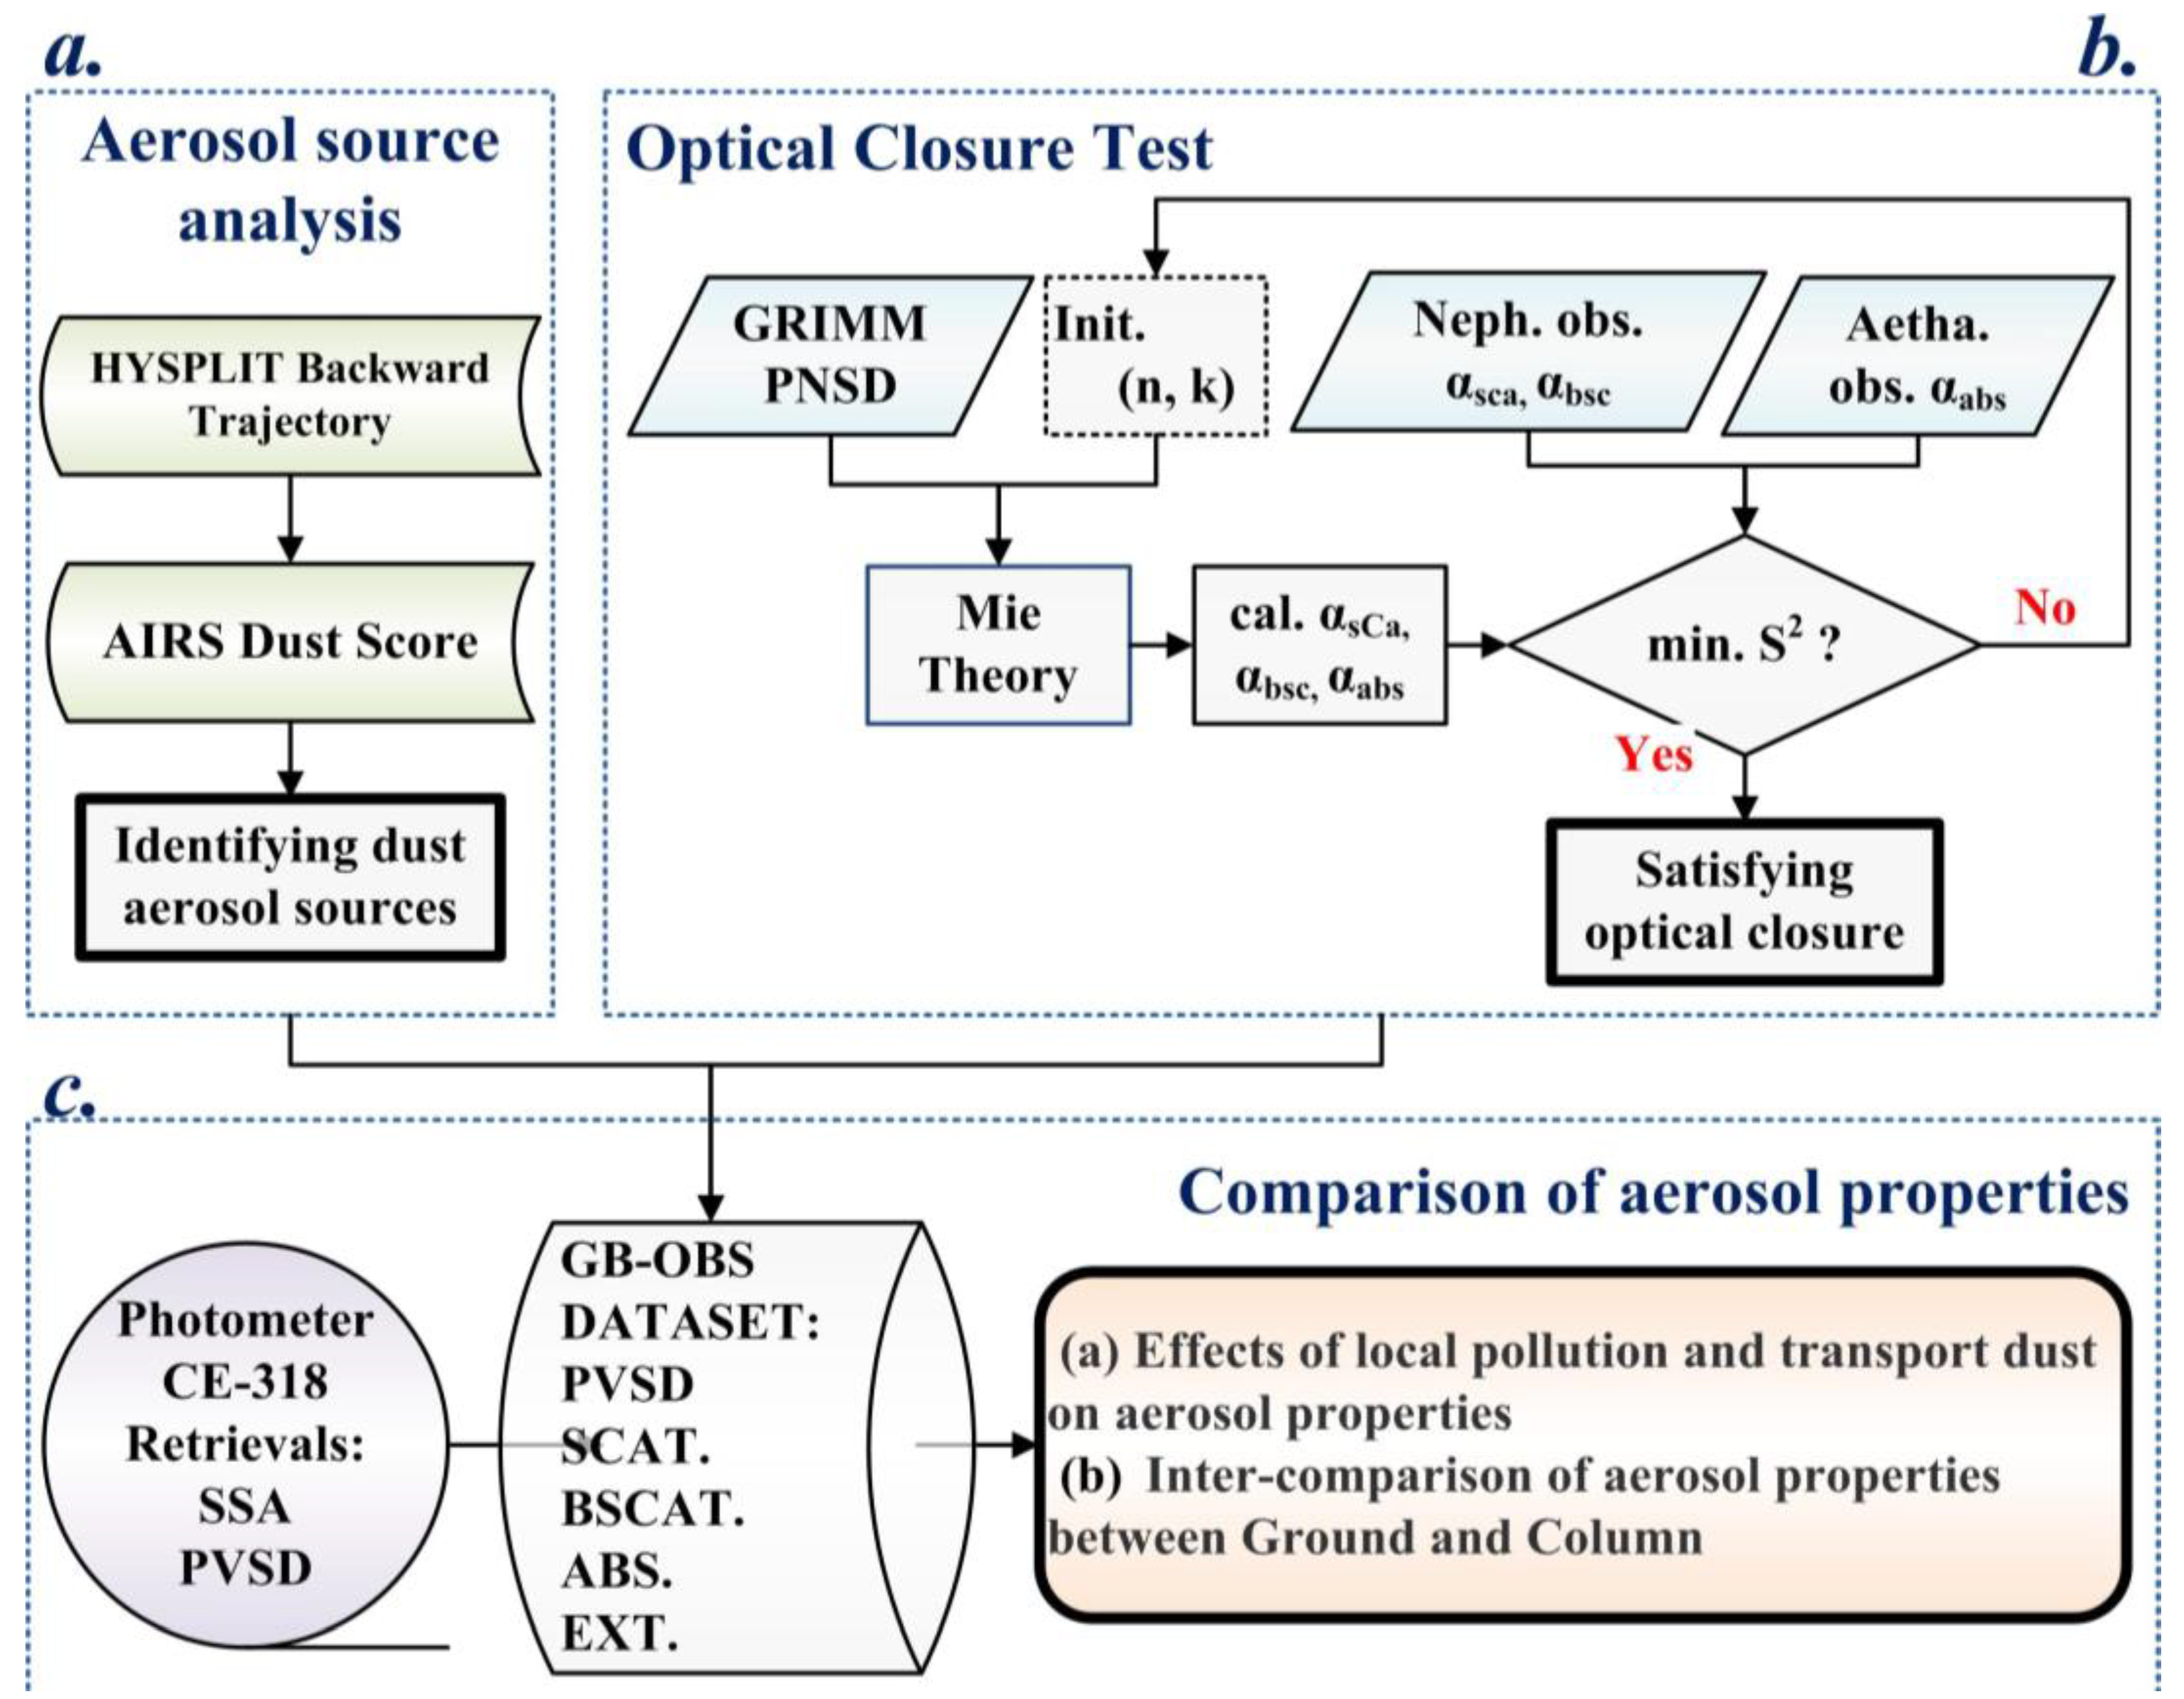
2.2.1. Experimental Scheme
2.2.2. Method for Identifying Aerosol Sources
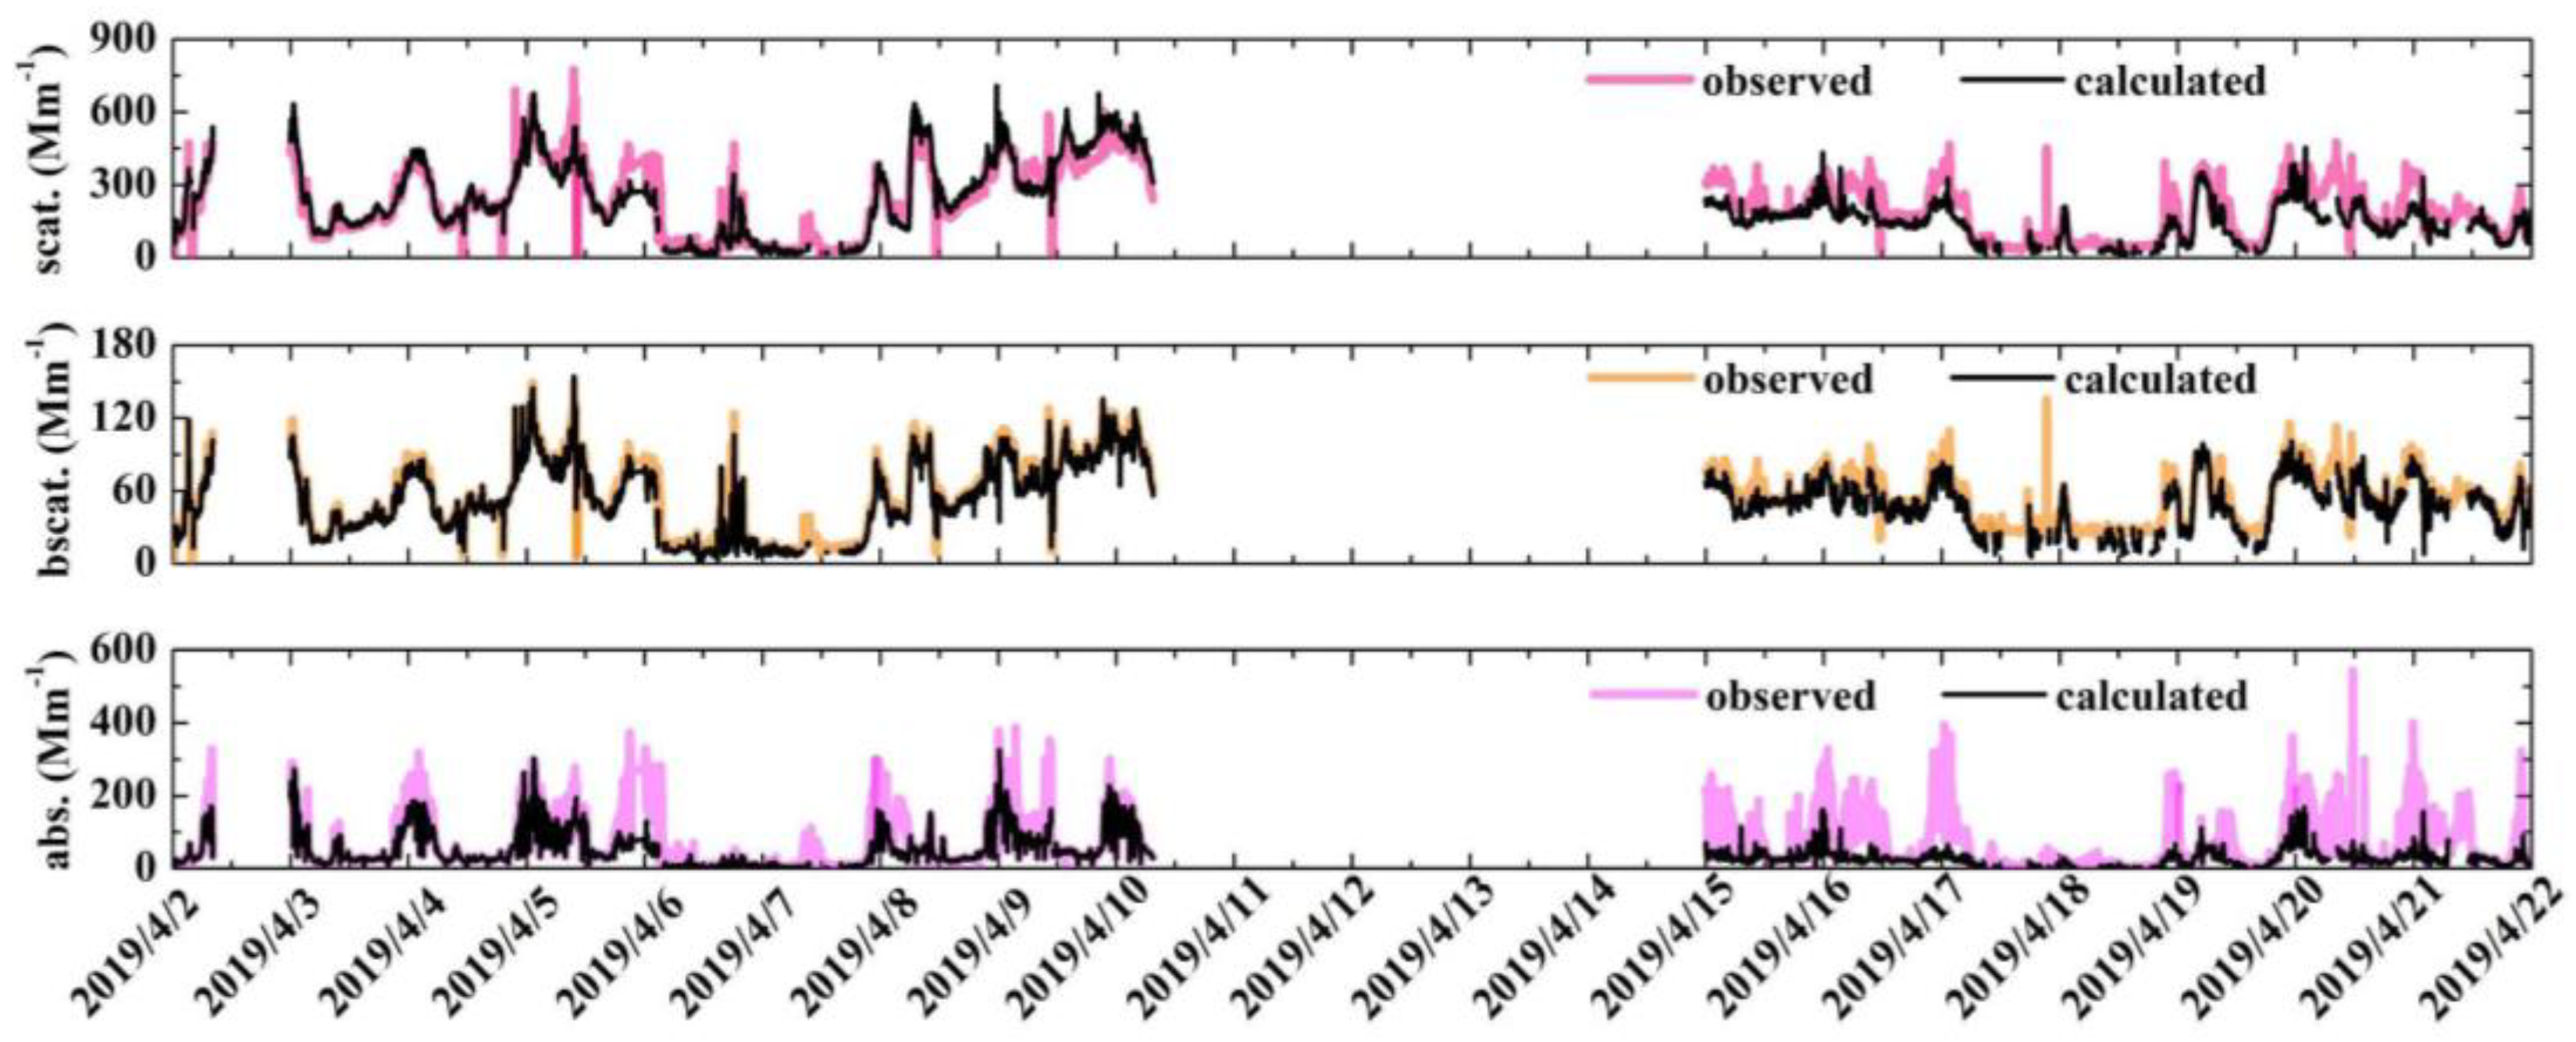
2.2.3. The Method Used for the Optical Closure Test
3. Results and Analysis
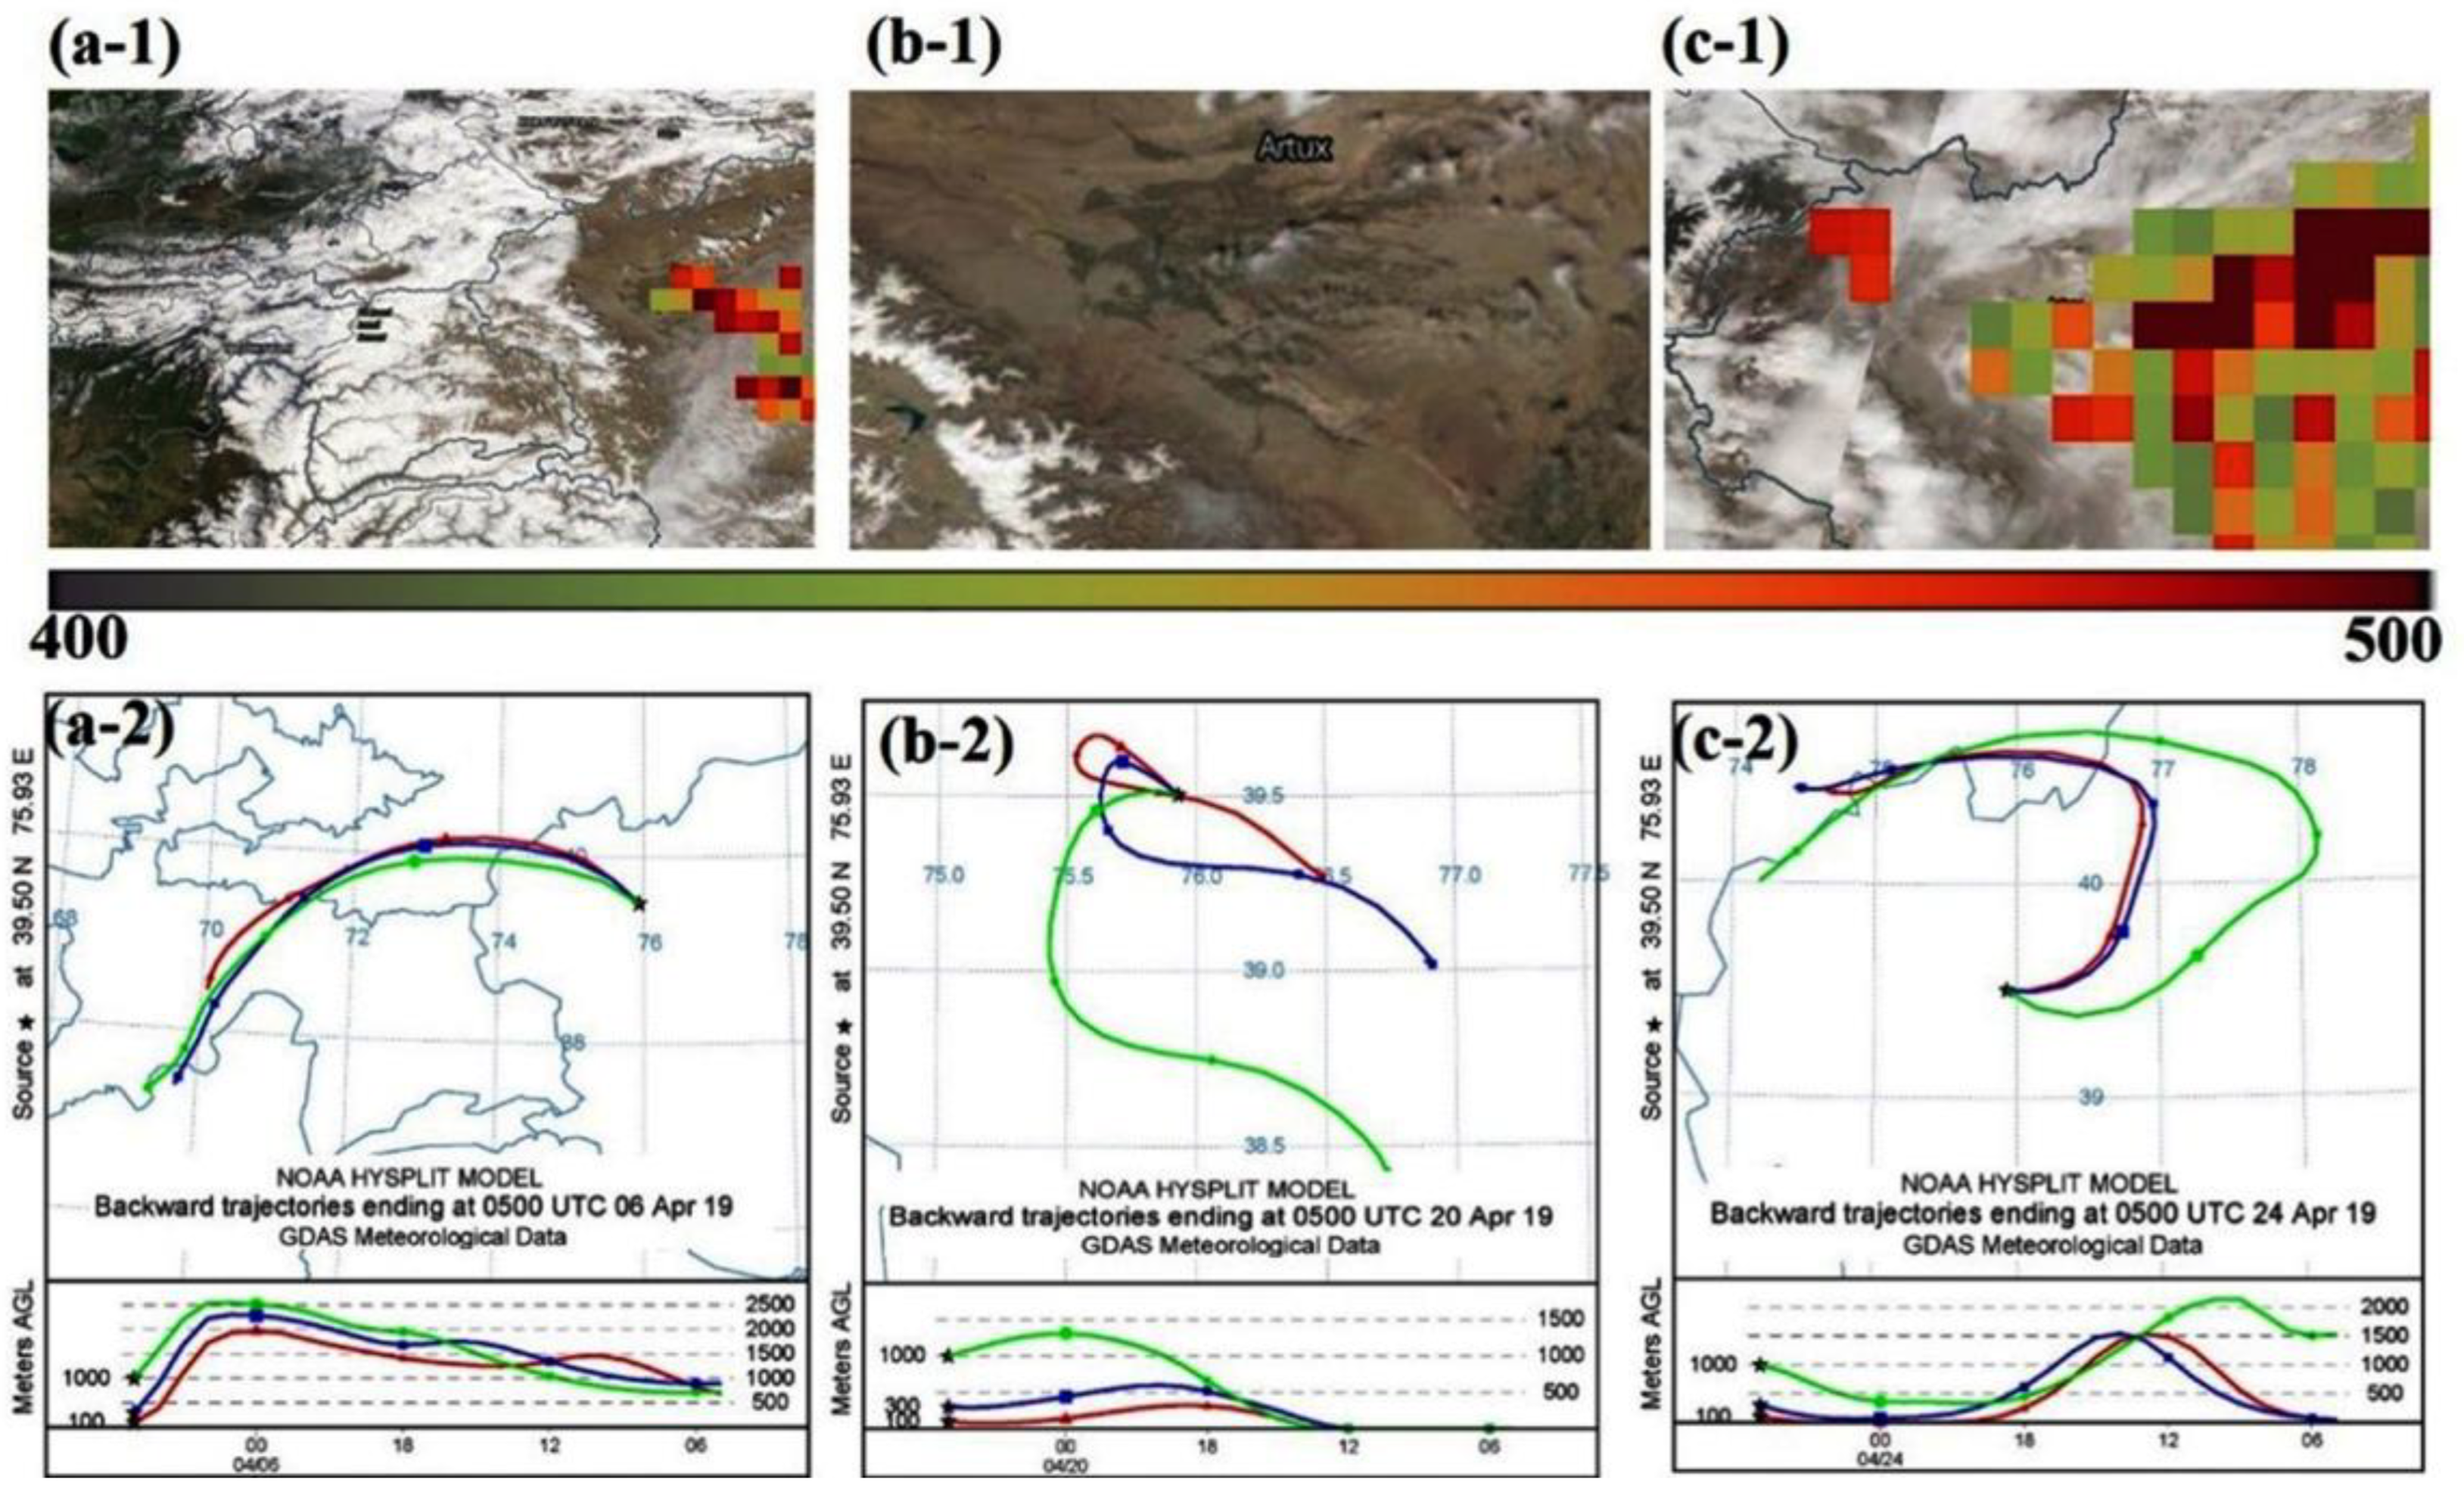
3.1. Trajectory Analysis
3.2. The Effects of Local Pollution and Transported Dust on the Optical Characteristics
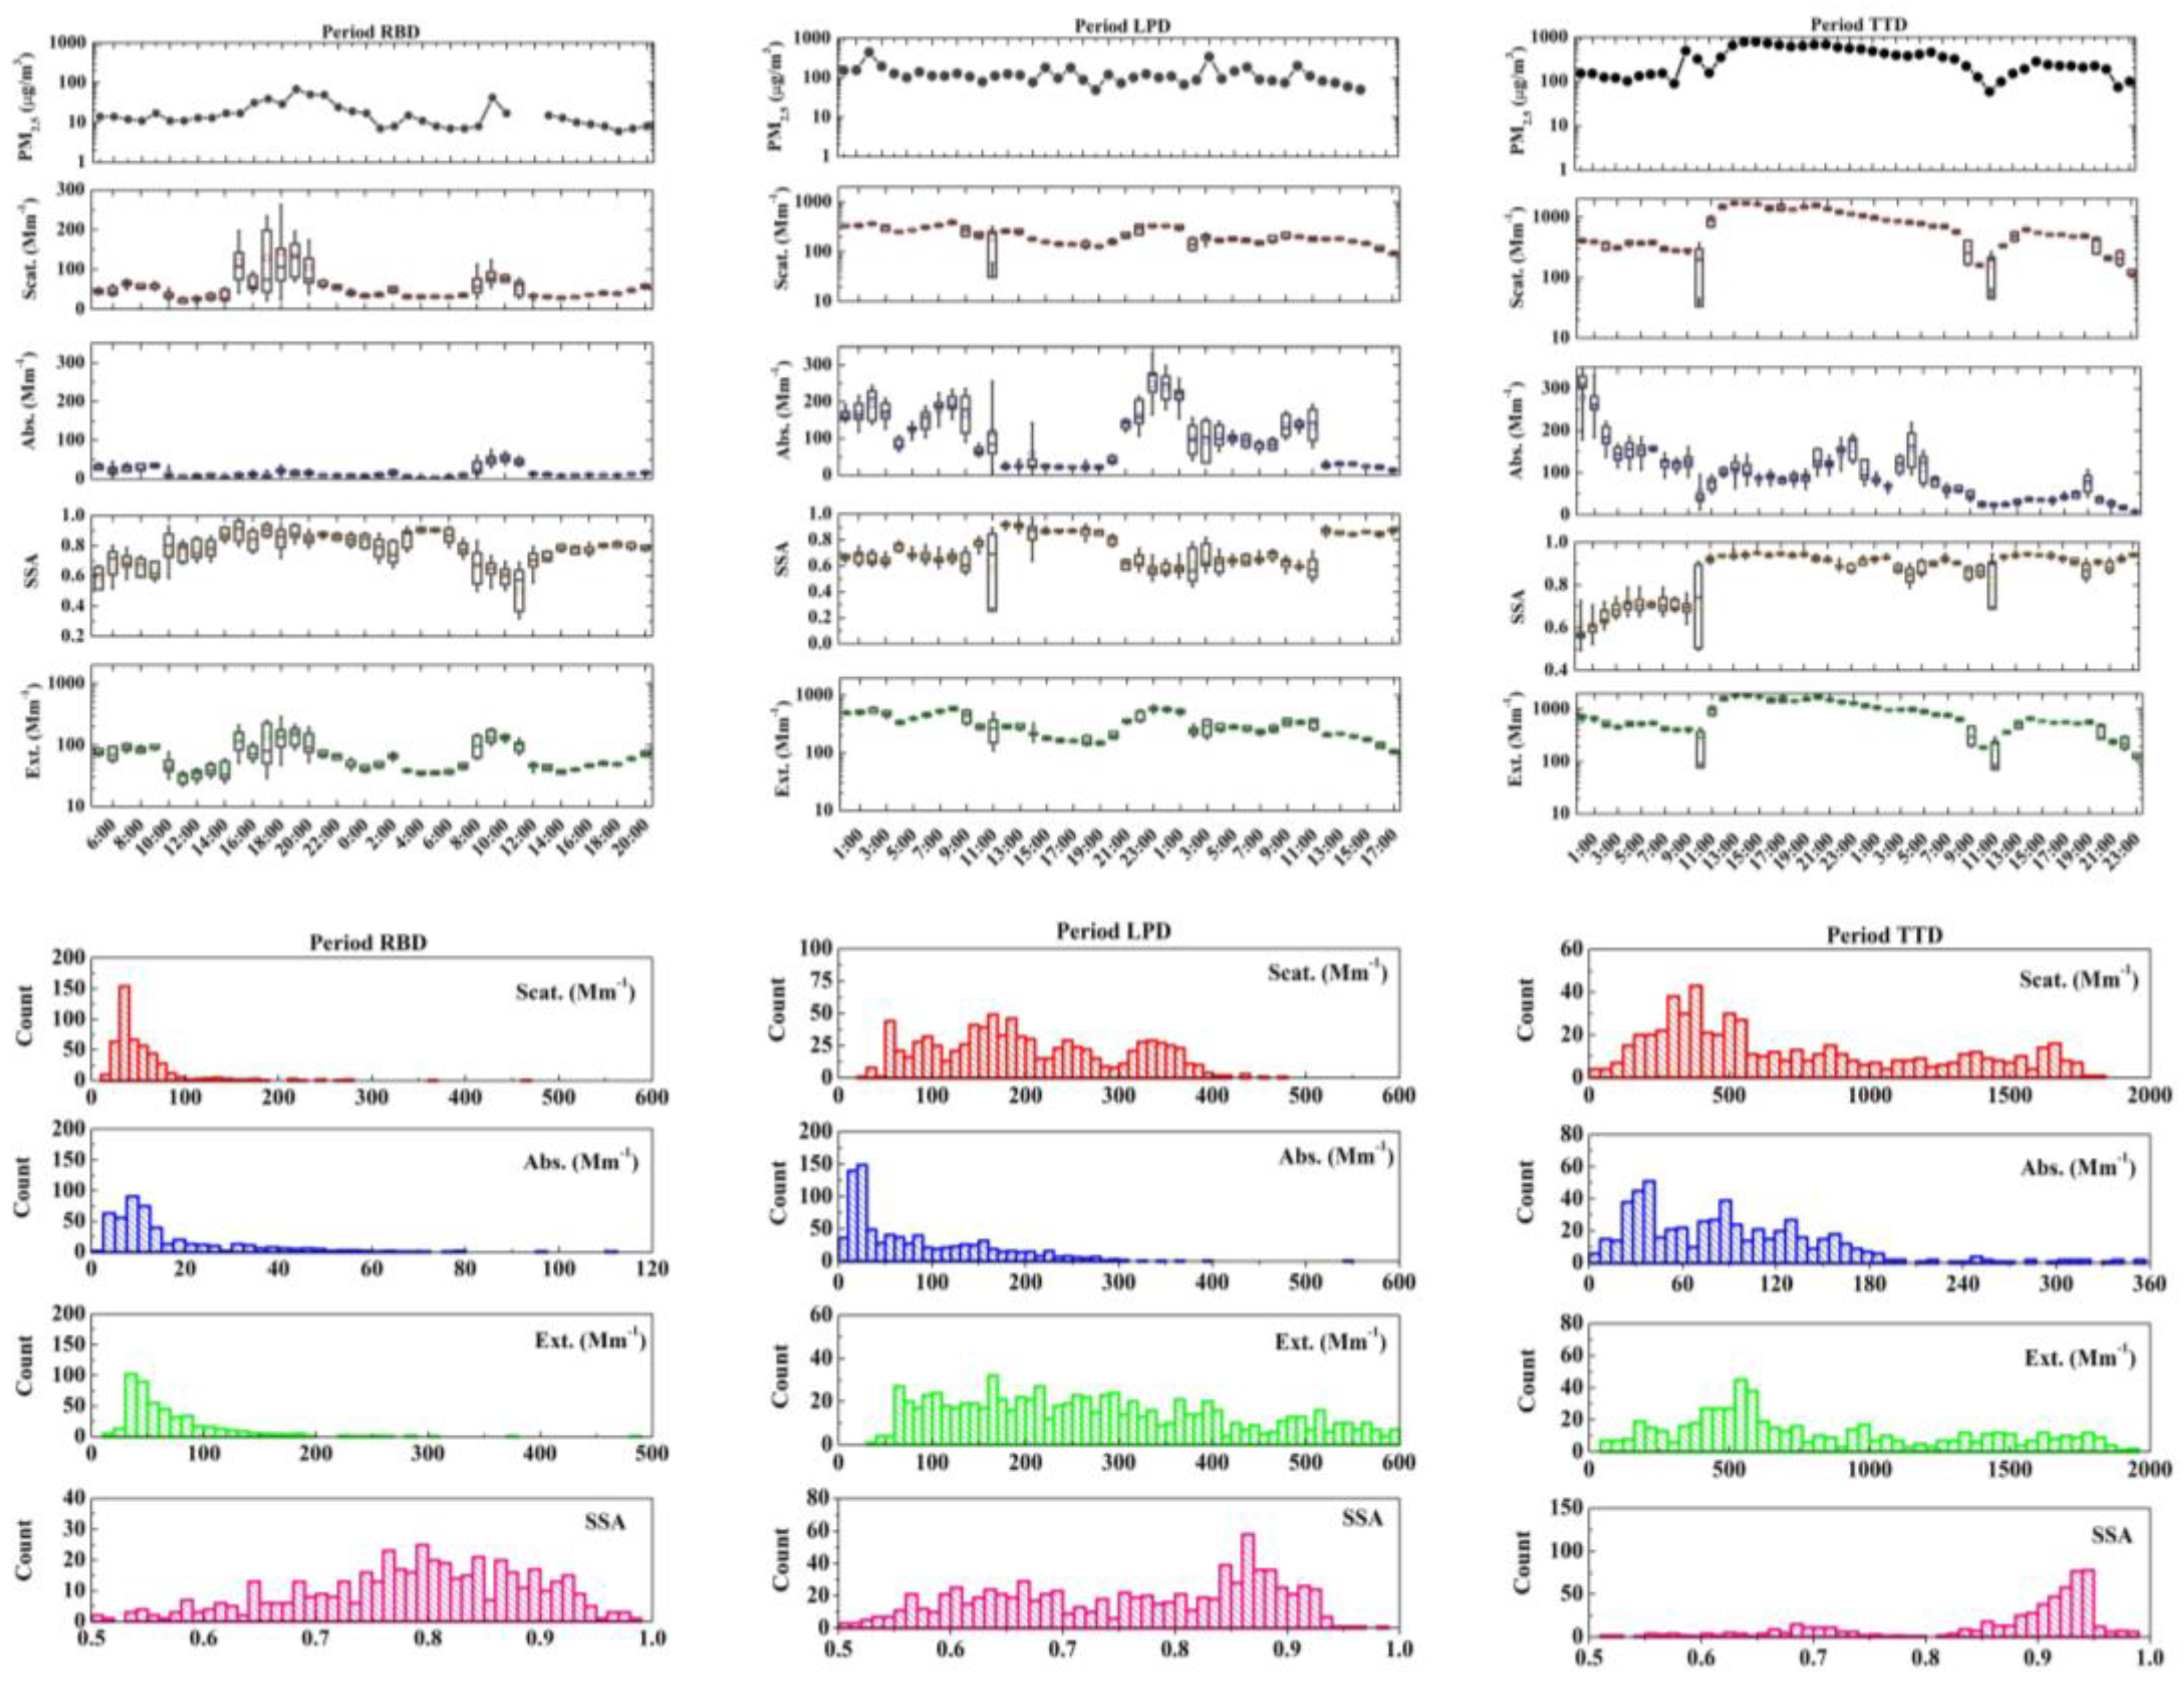
3.2.1. Diurnal Variation of Optical Parameters during Typical Periods
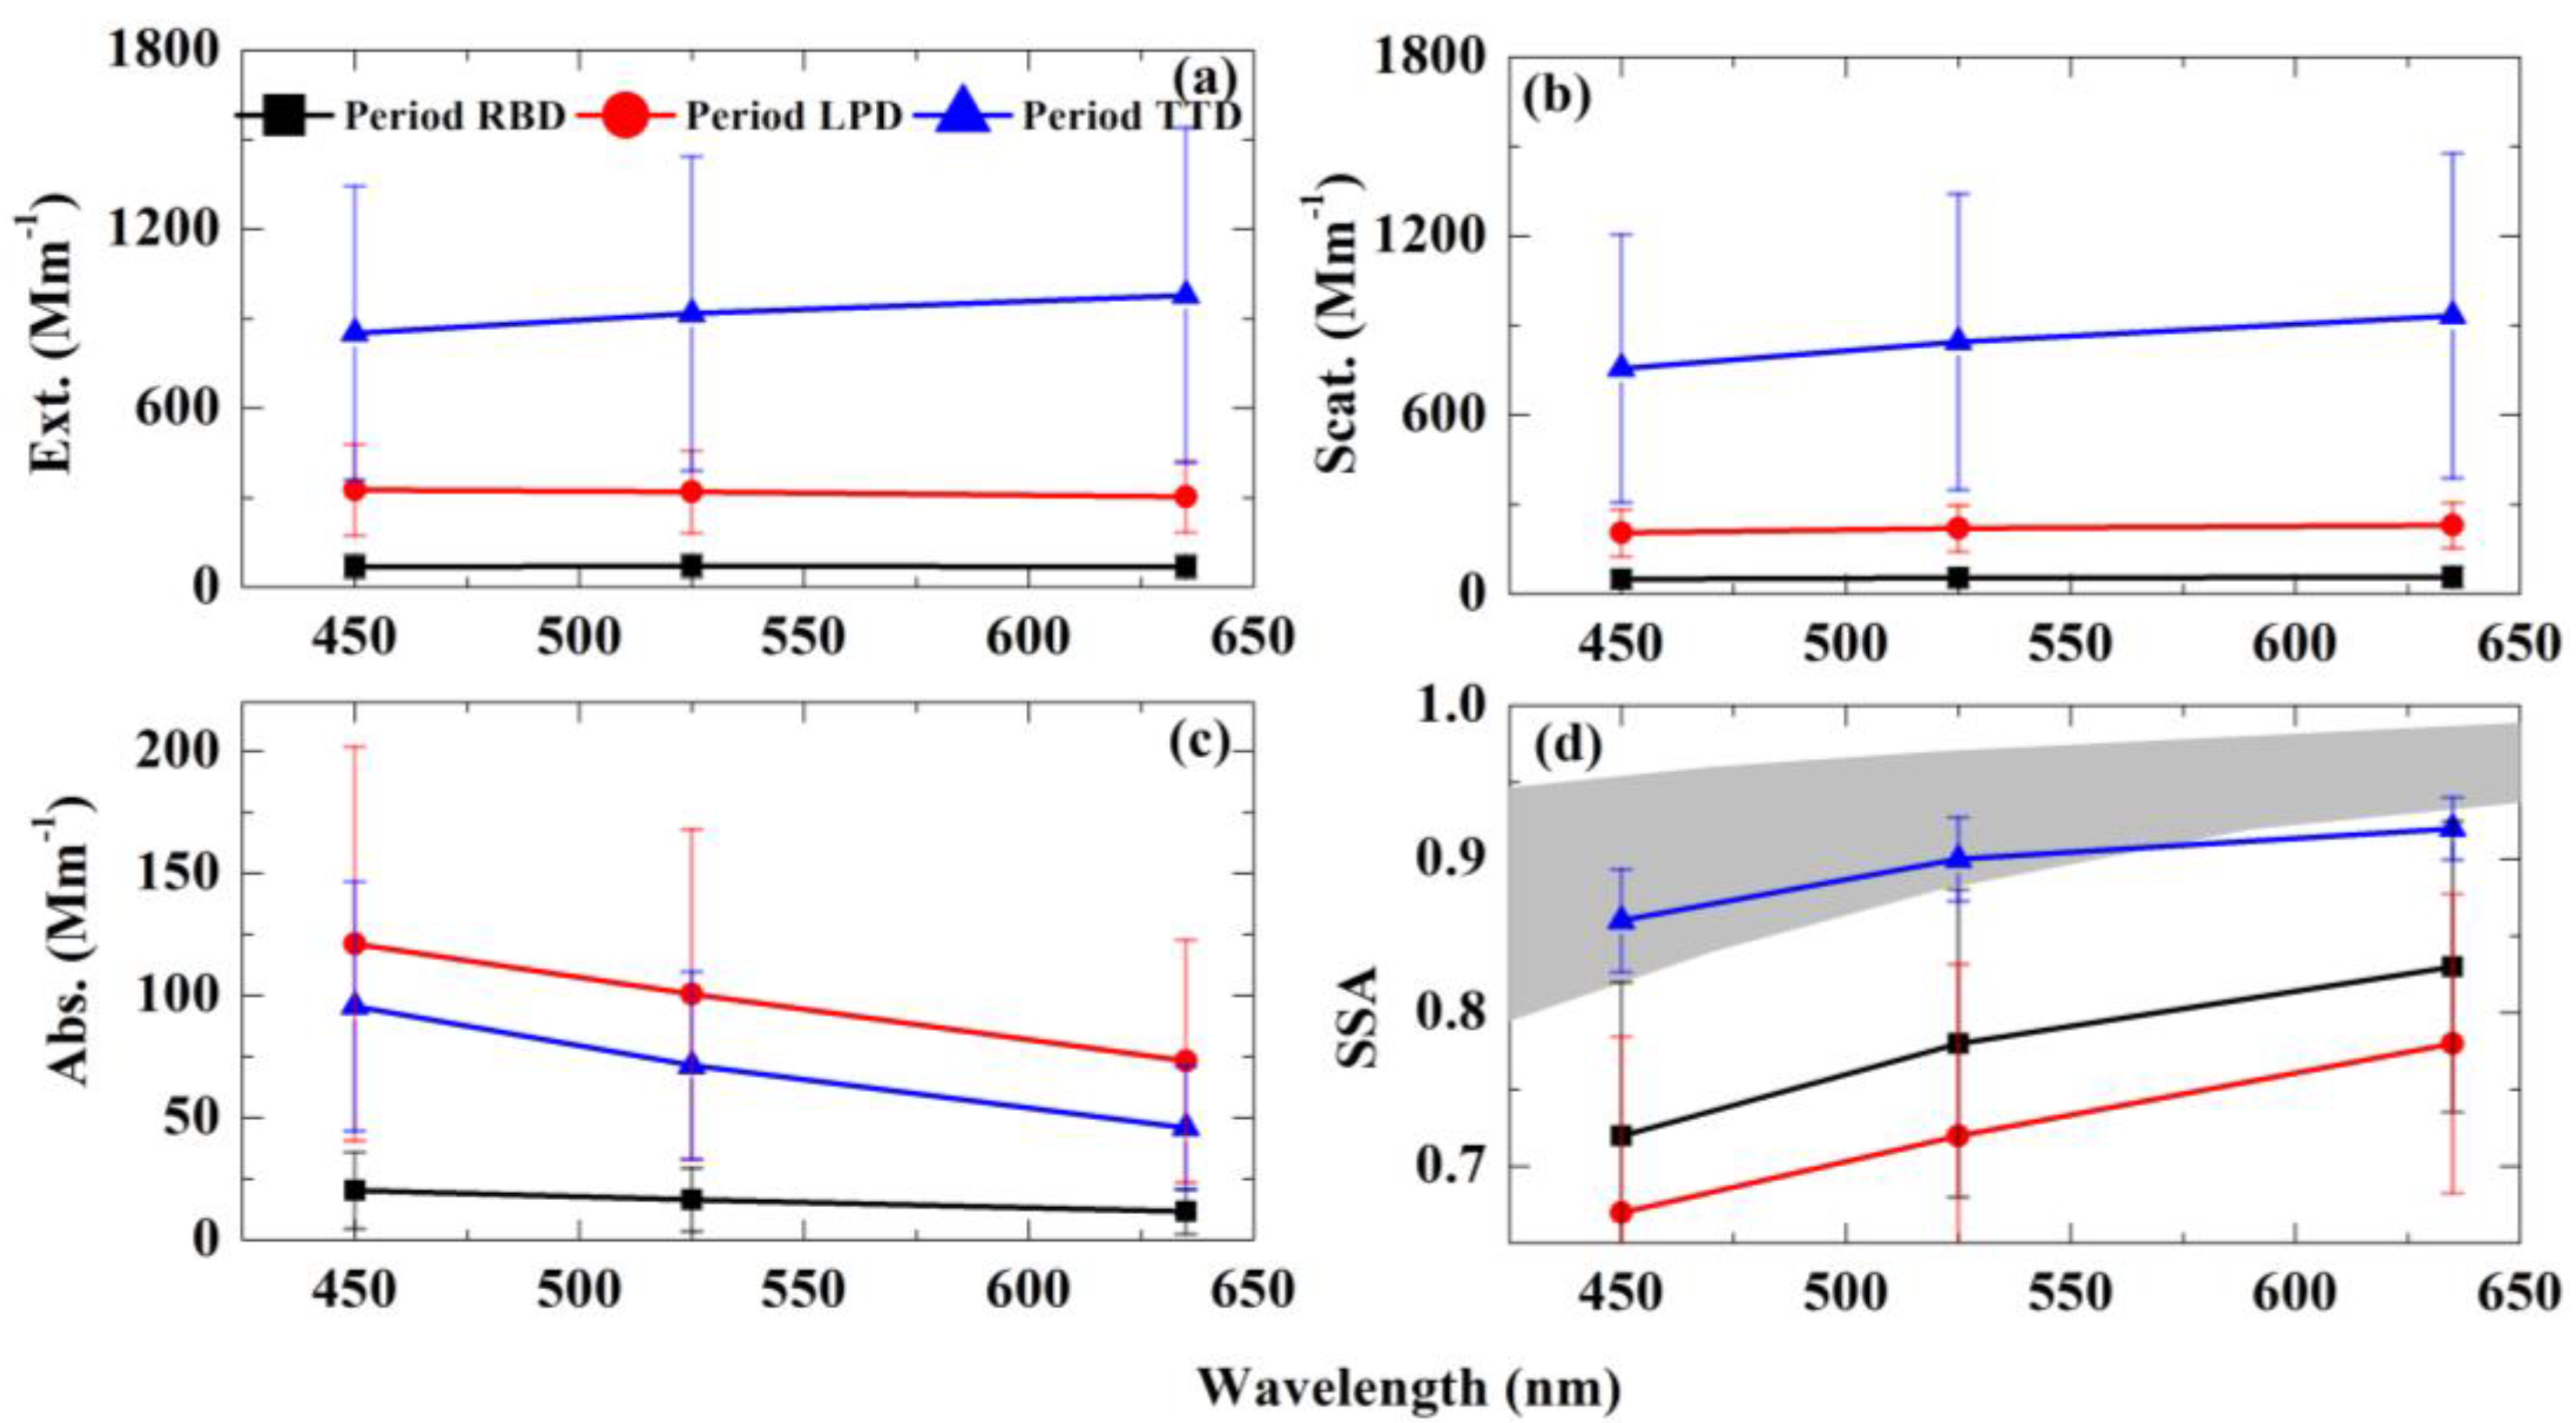
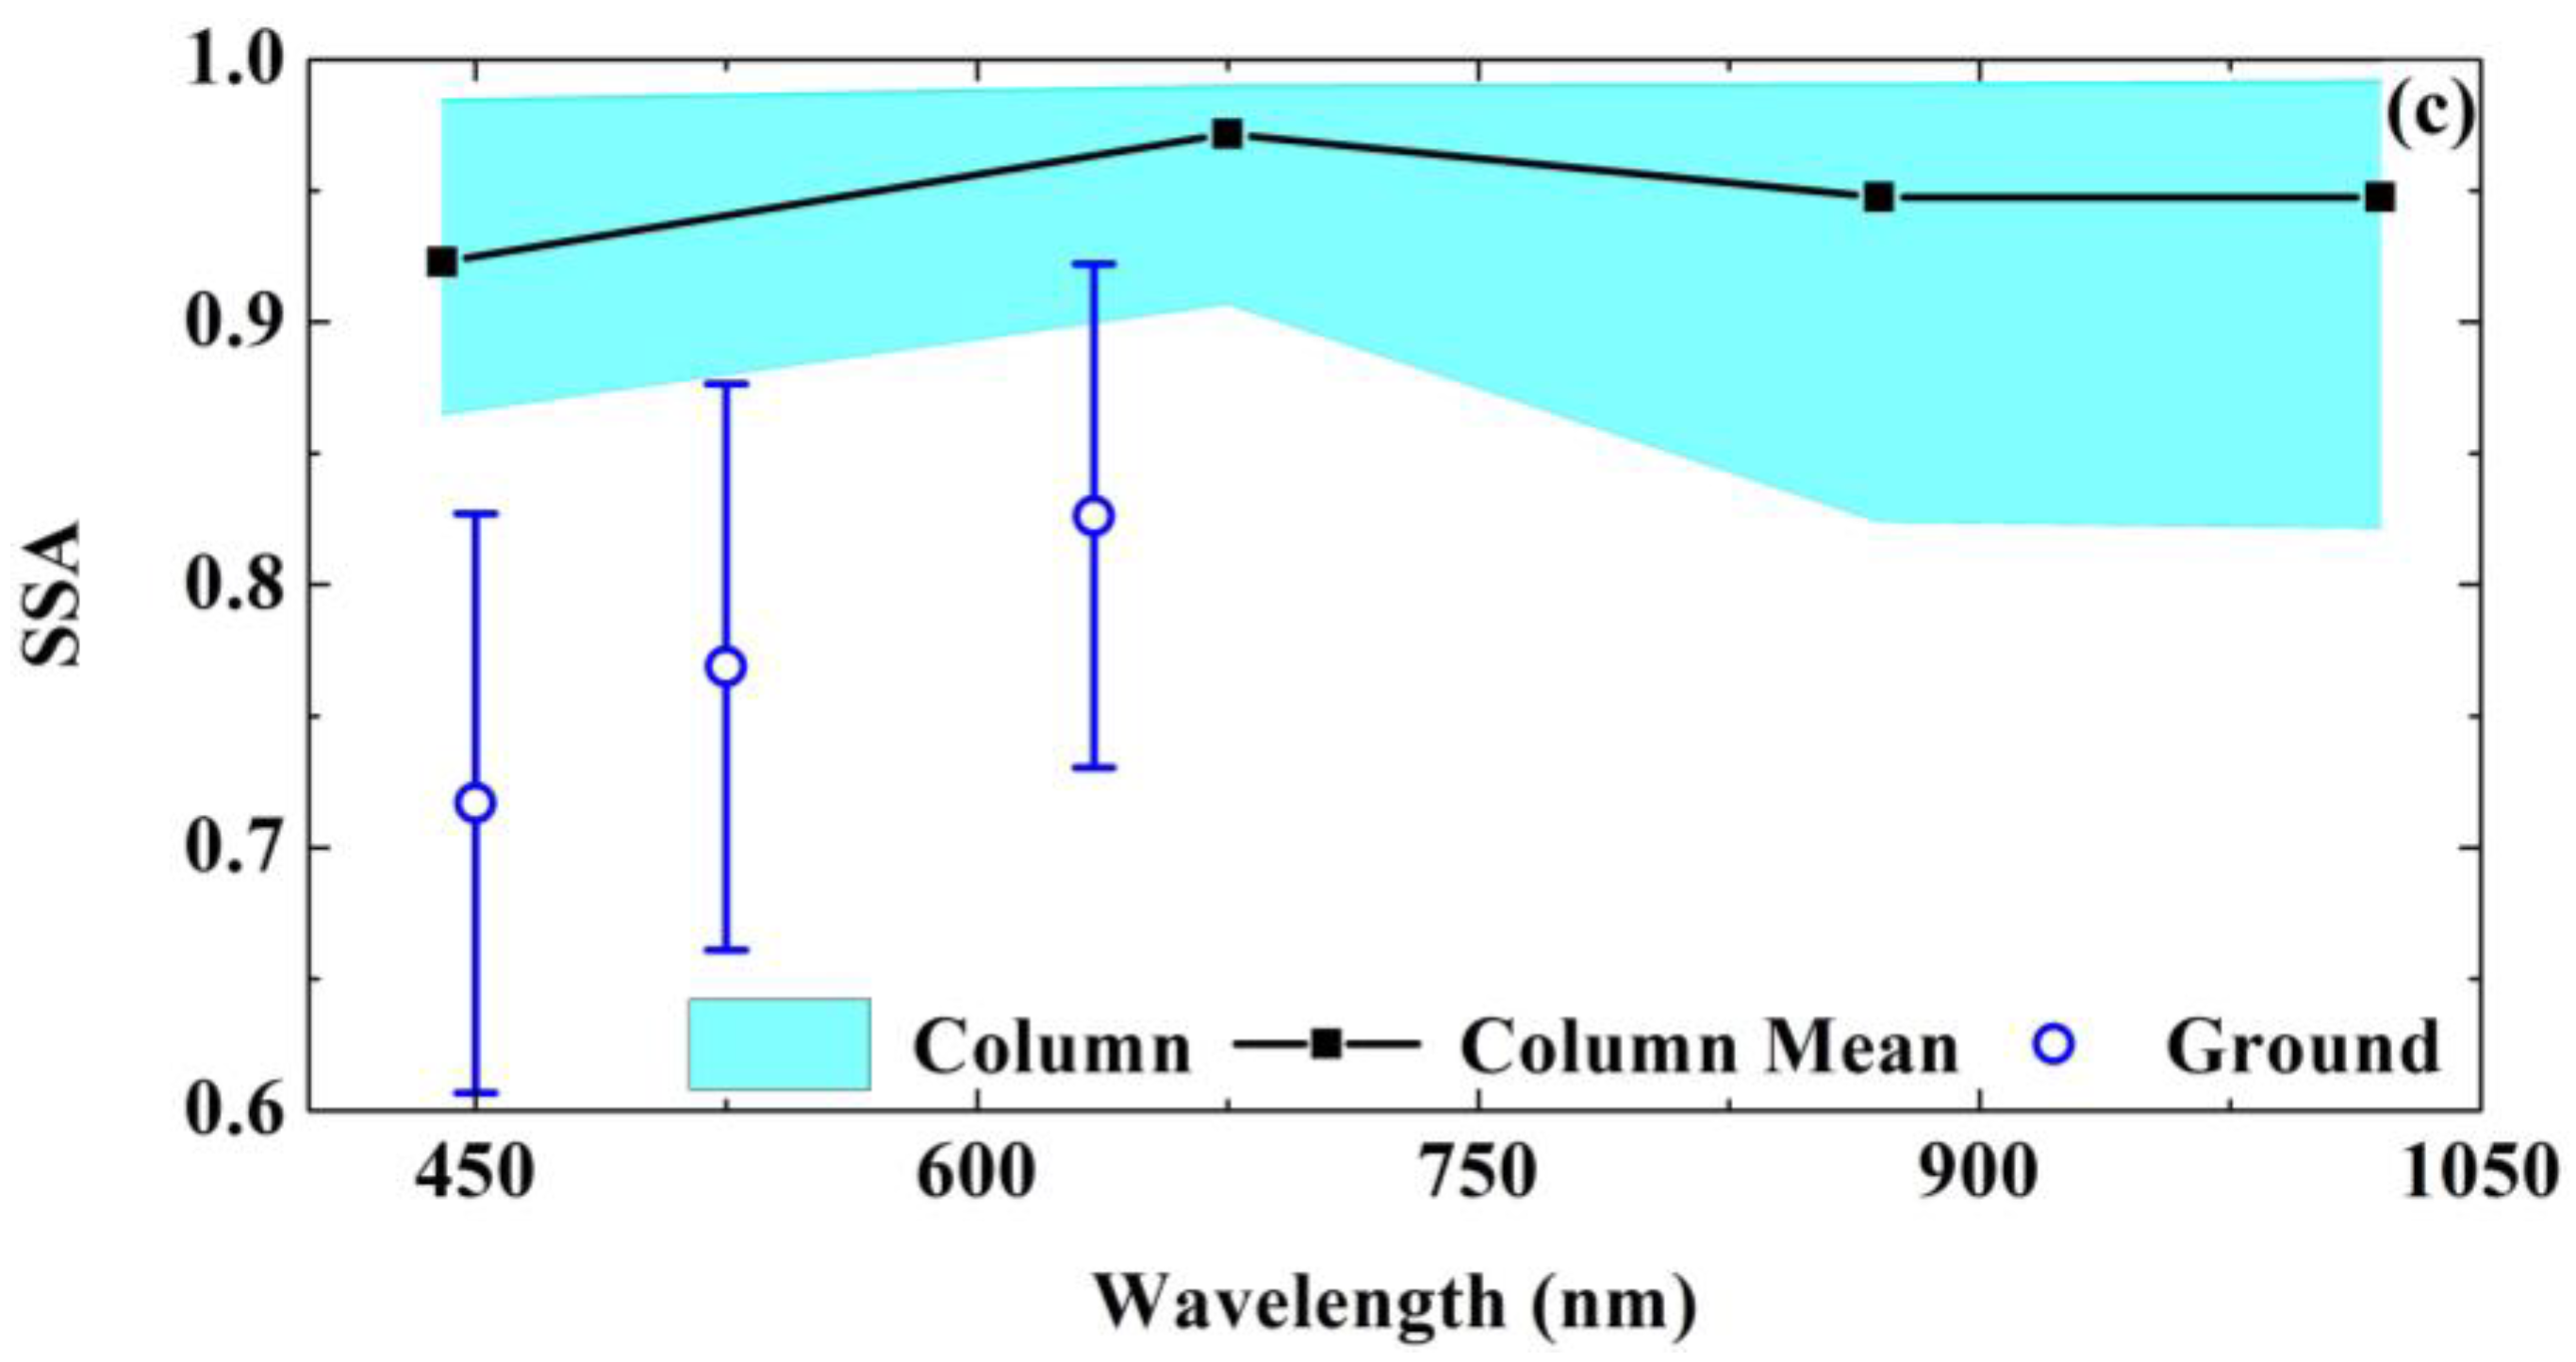
3.2.2. The Variation of the Spectral Characteristics of the SSA during Typical Periods
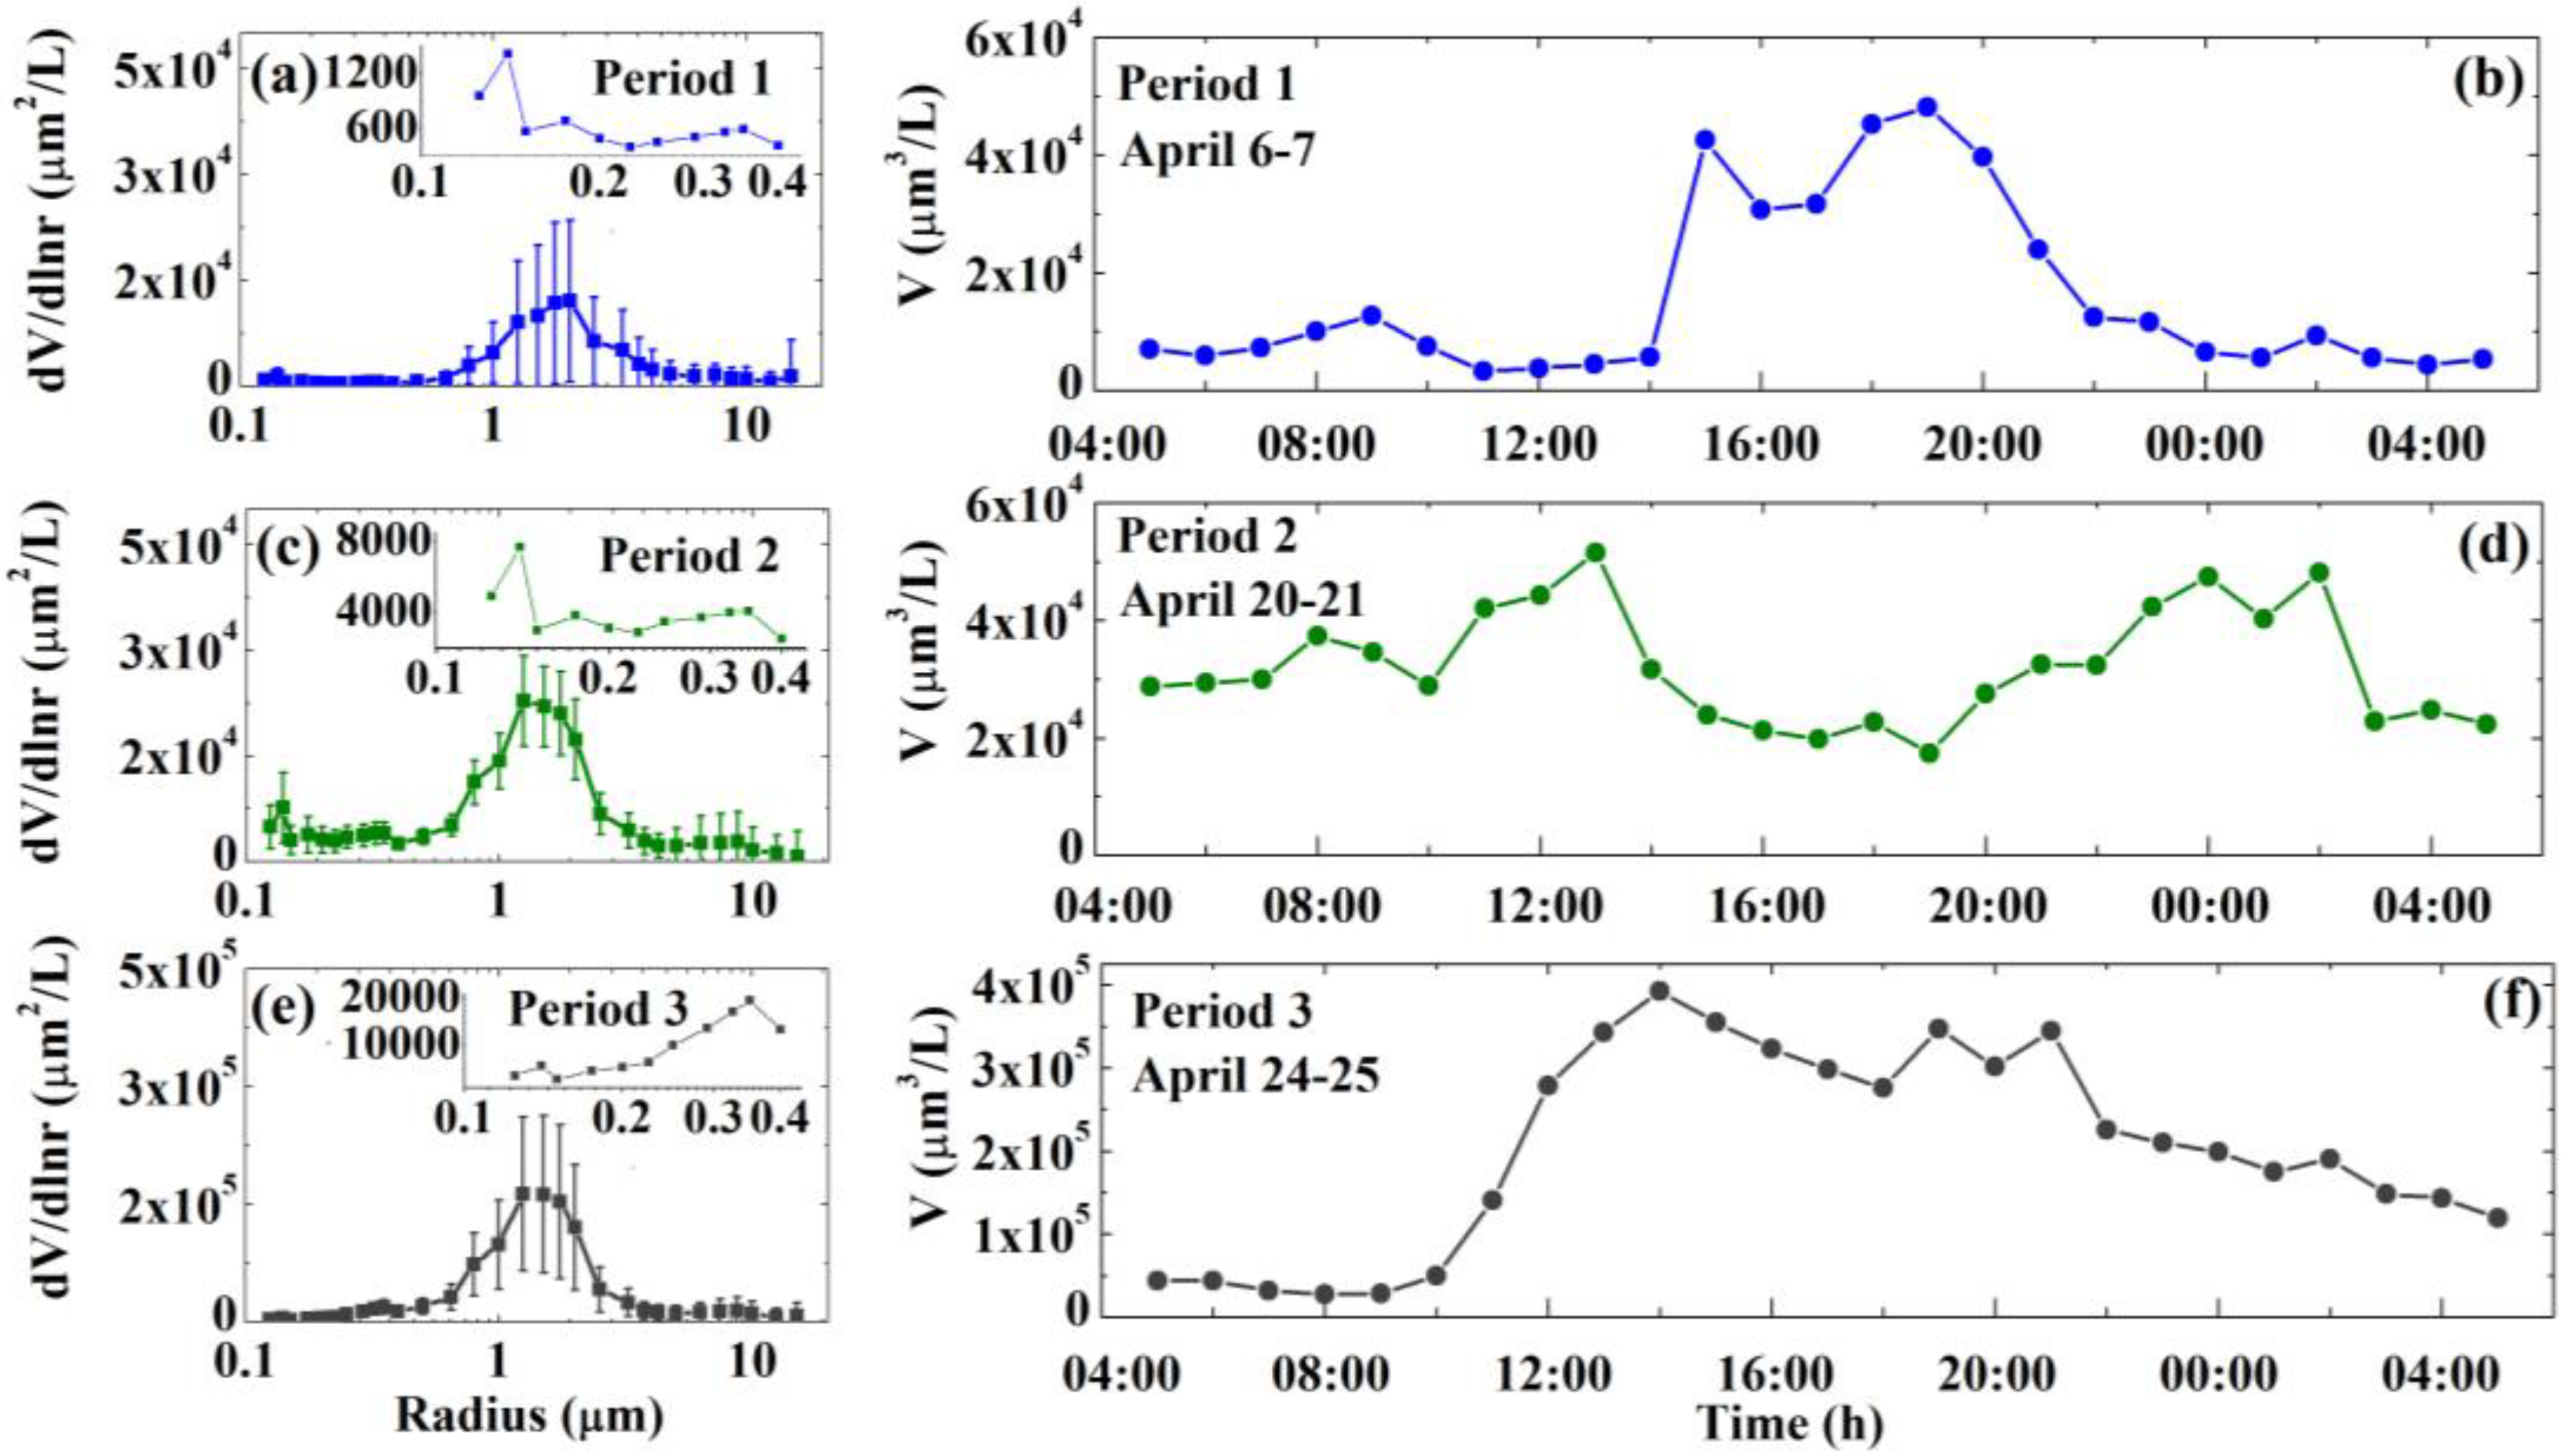
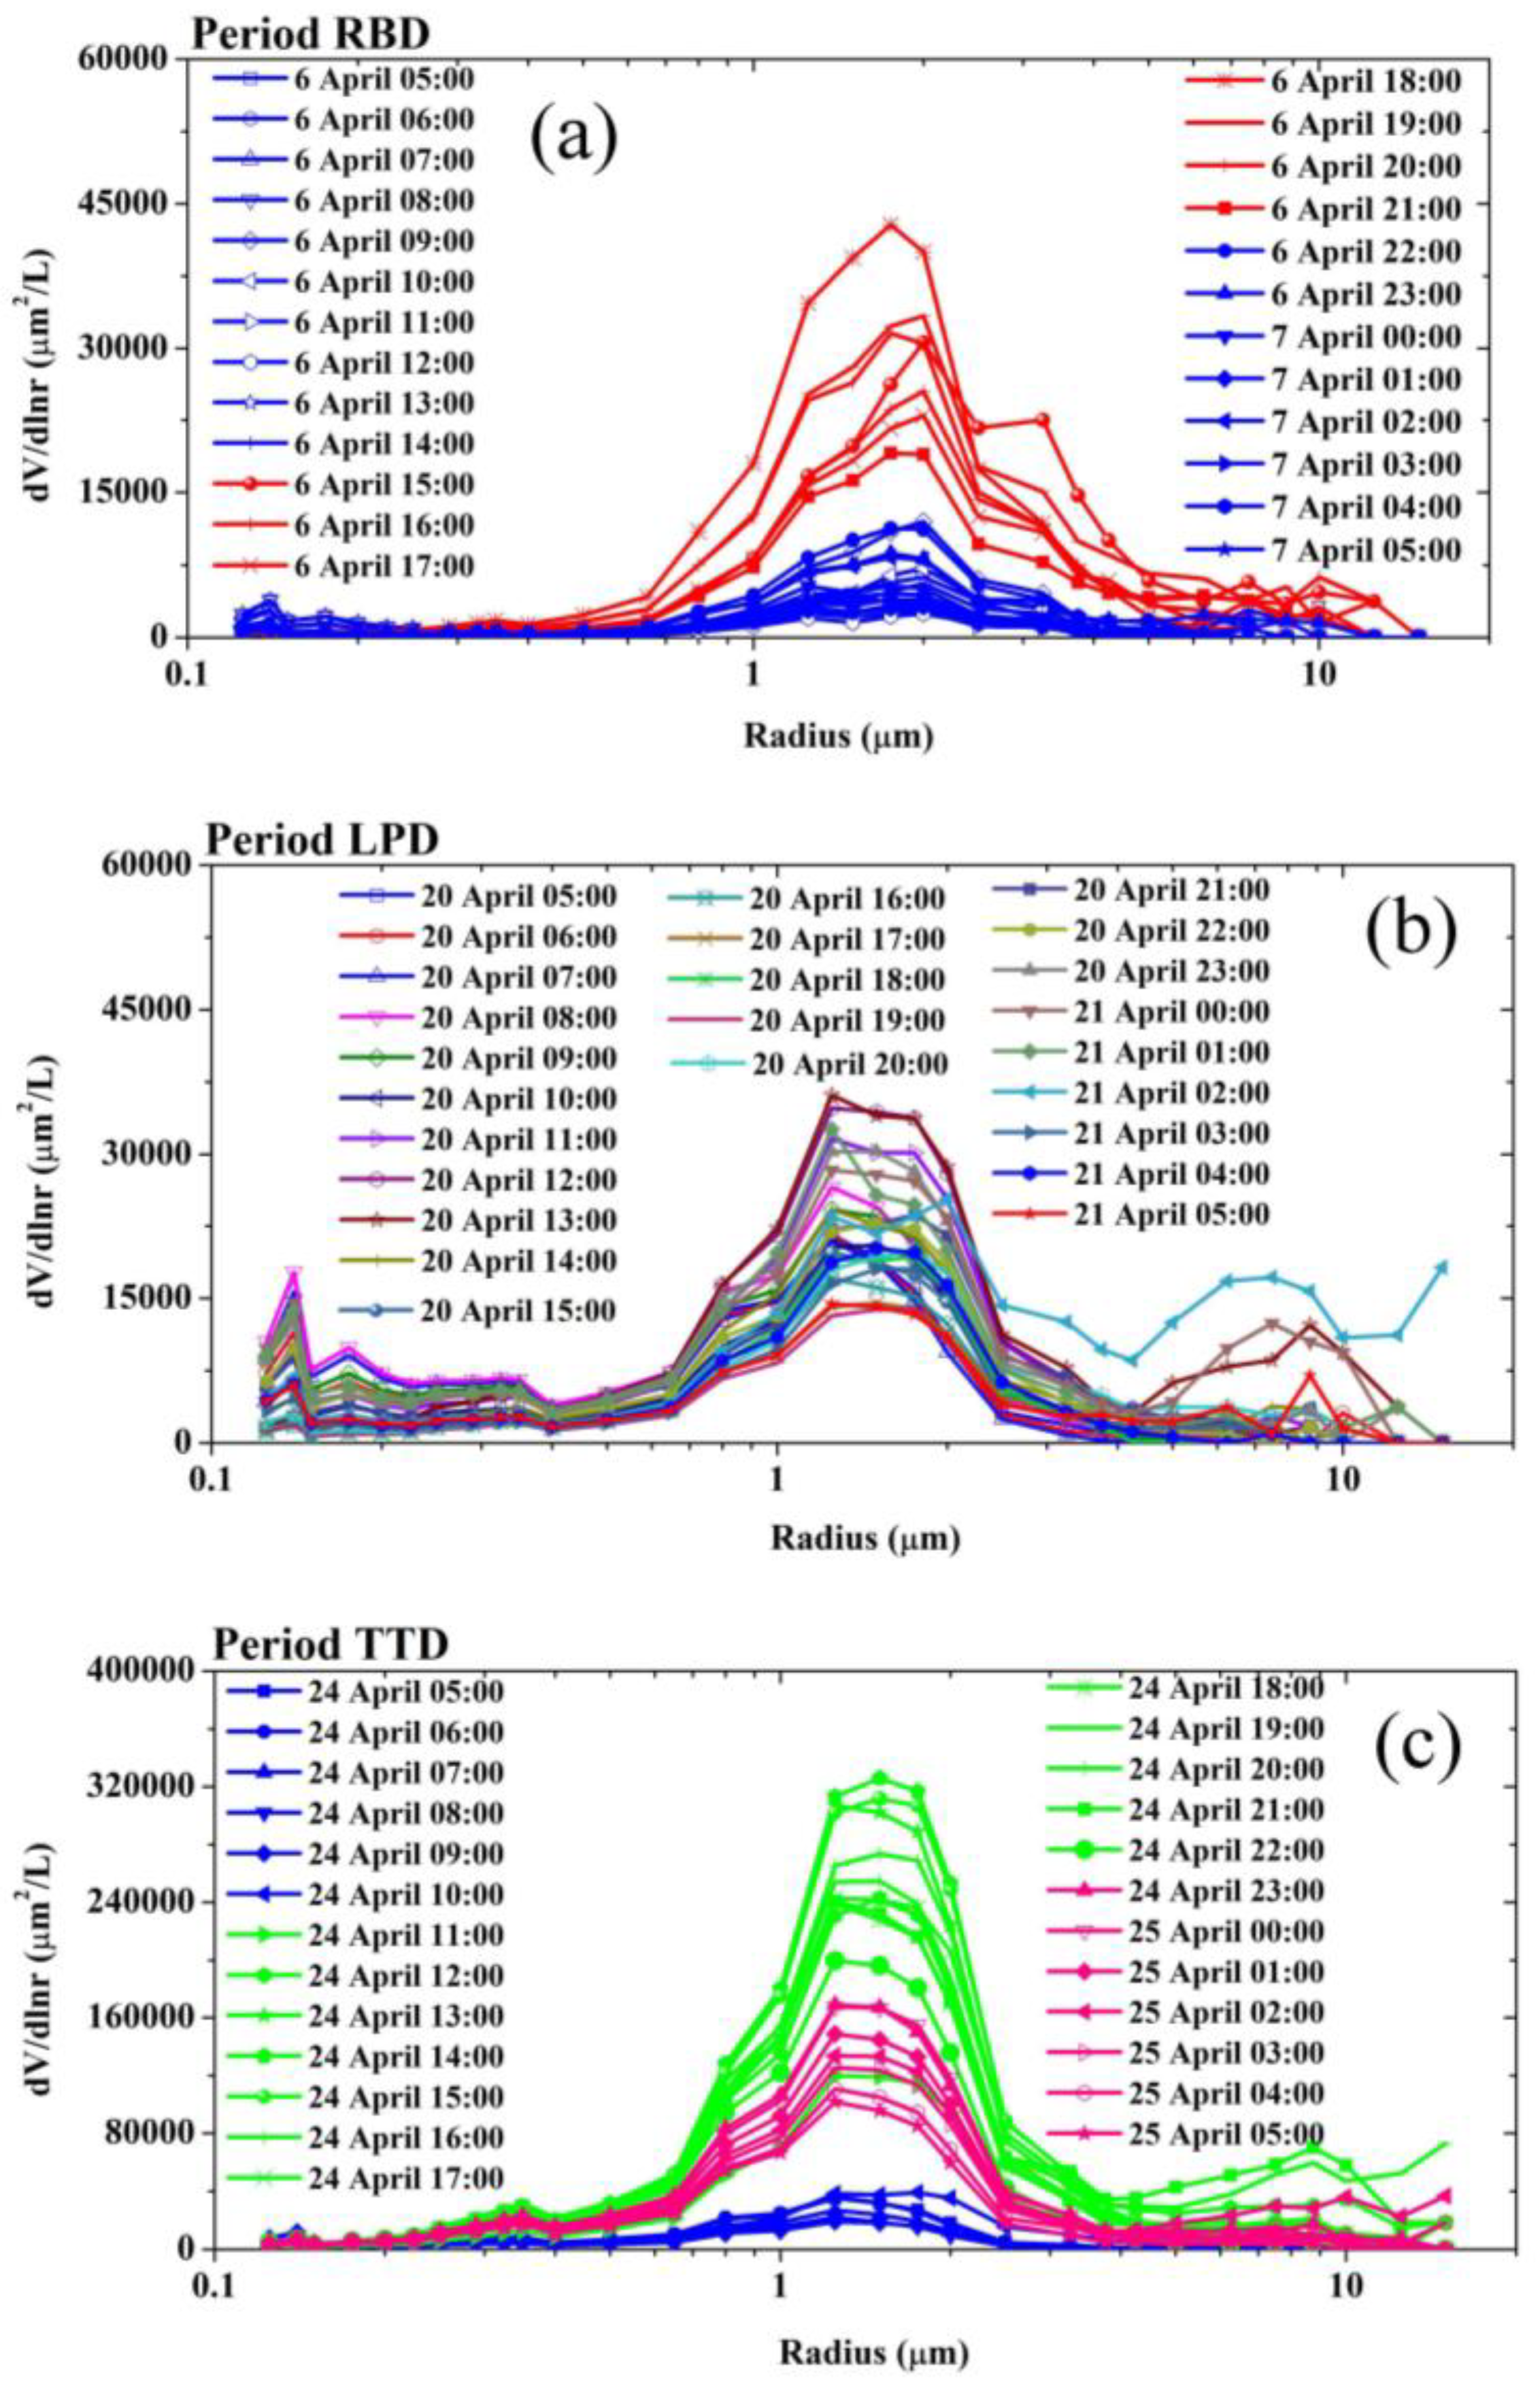
3.3. The Effects of Local Pollution and Transported Dust on the Particle Volume Size Distribution
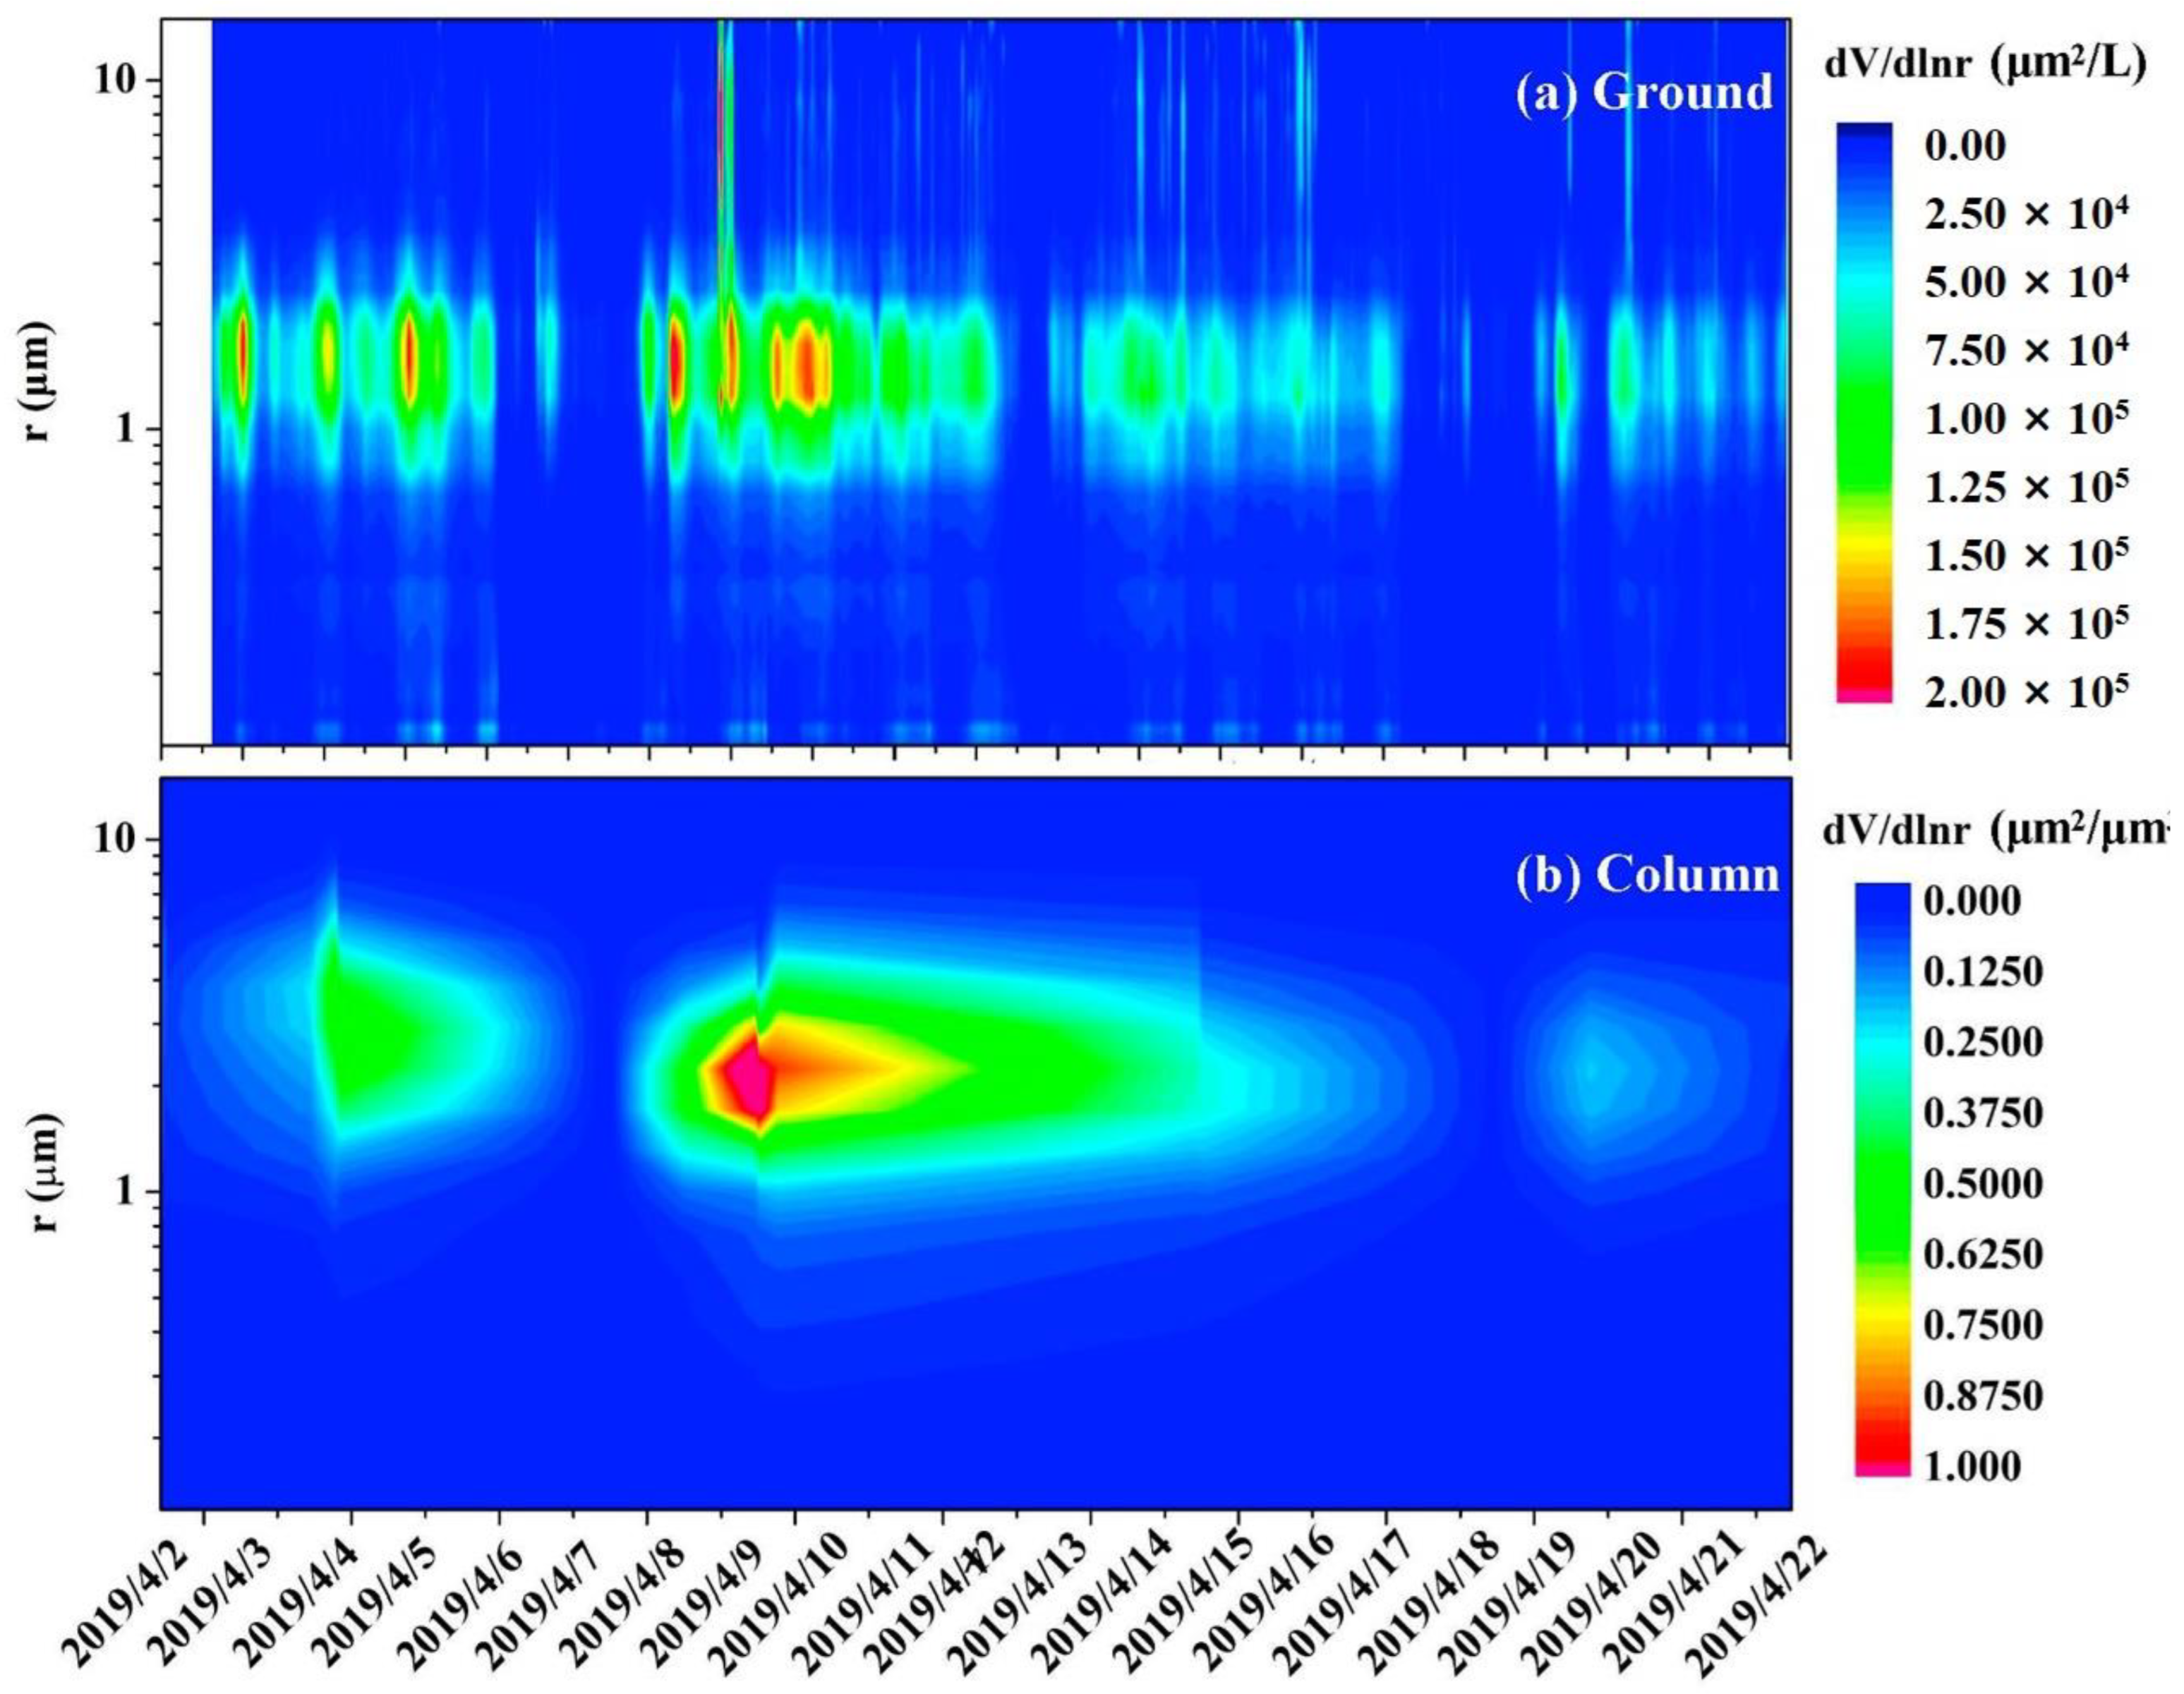
3.4. The Difference of the Optical and Micro-Physical Properties between the near Surface and Total Column
4. Discussion
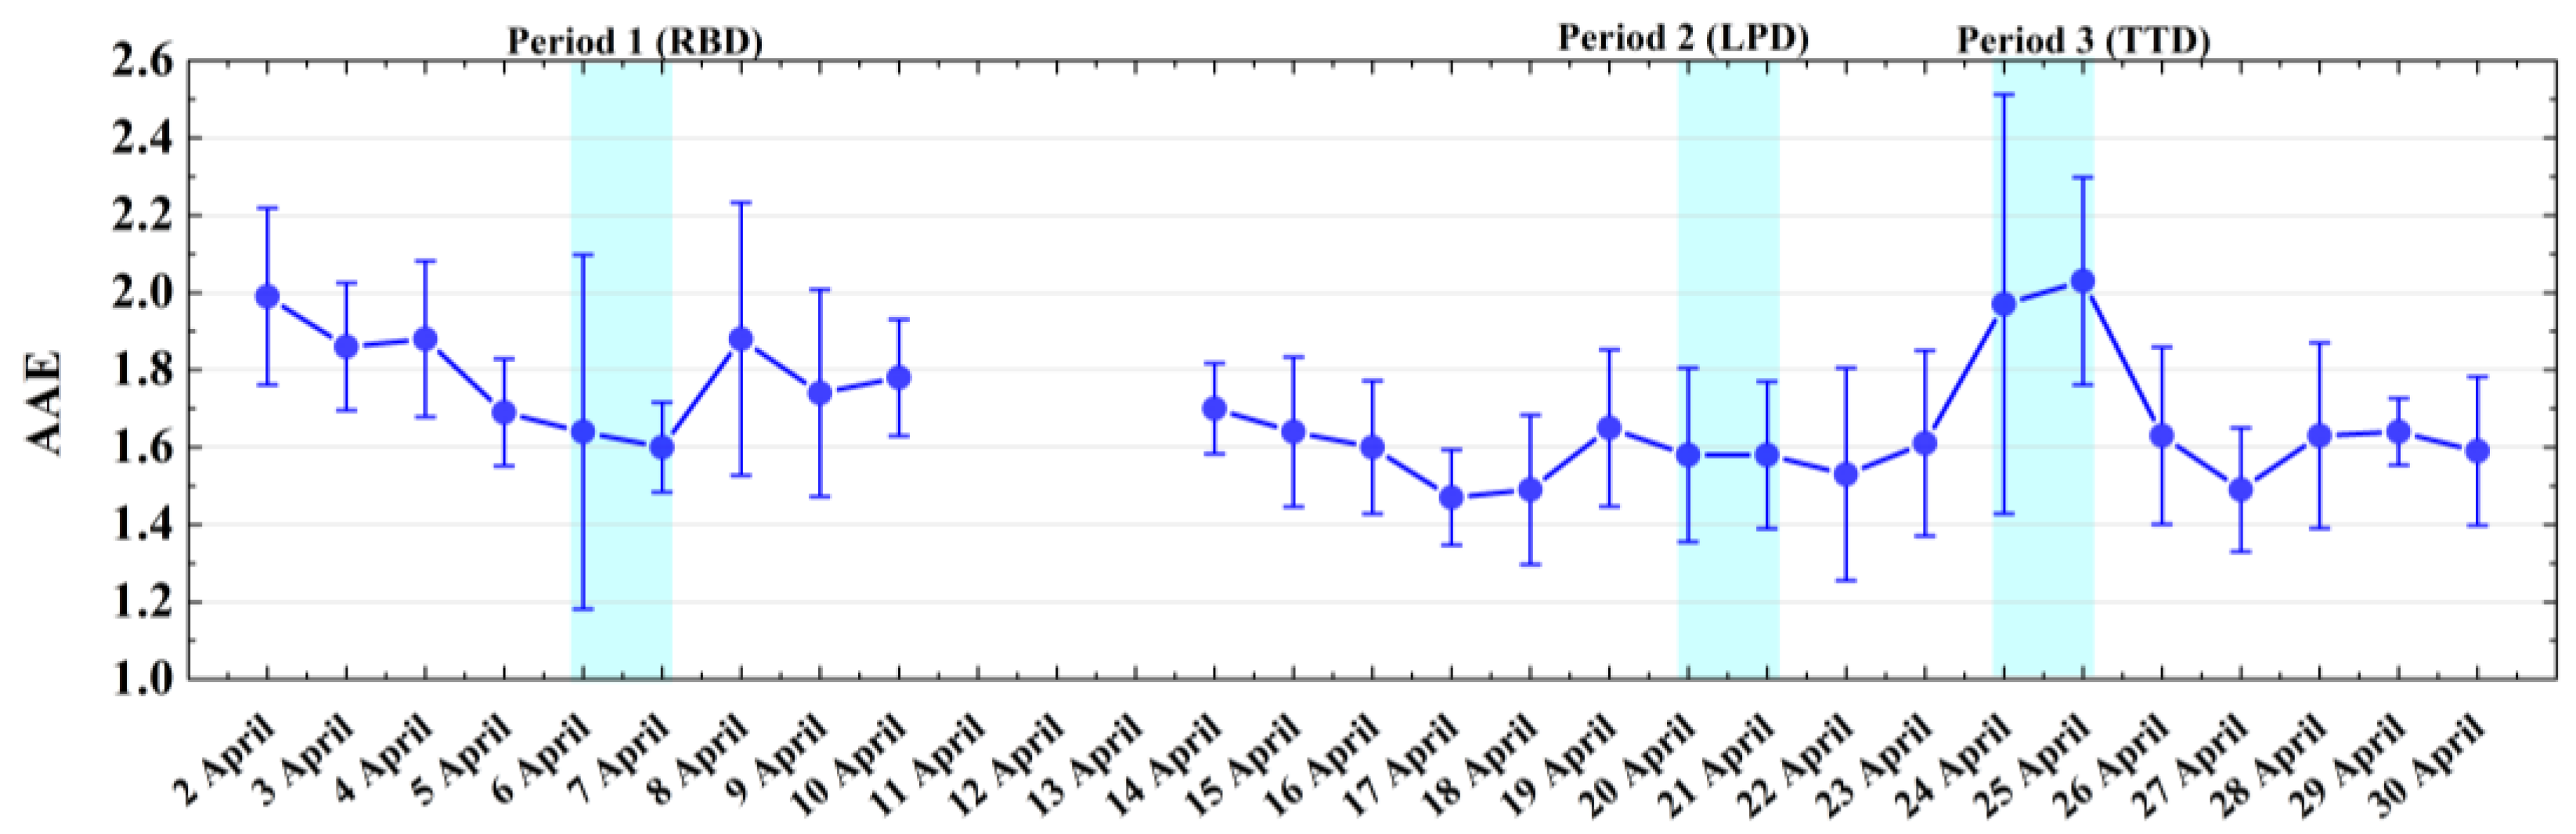
4.1. Analysis of the Absorption Angstrom Exponent
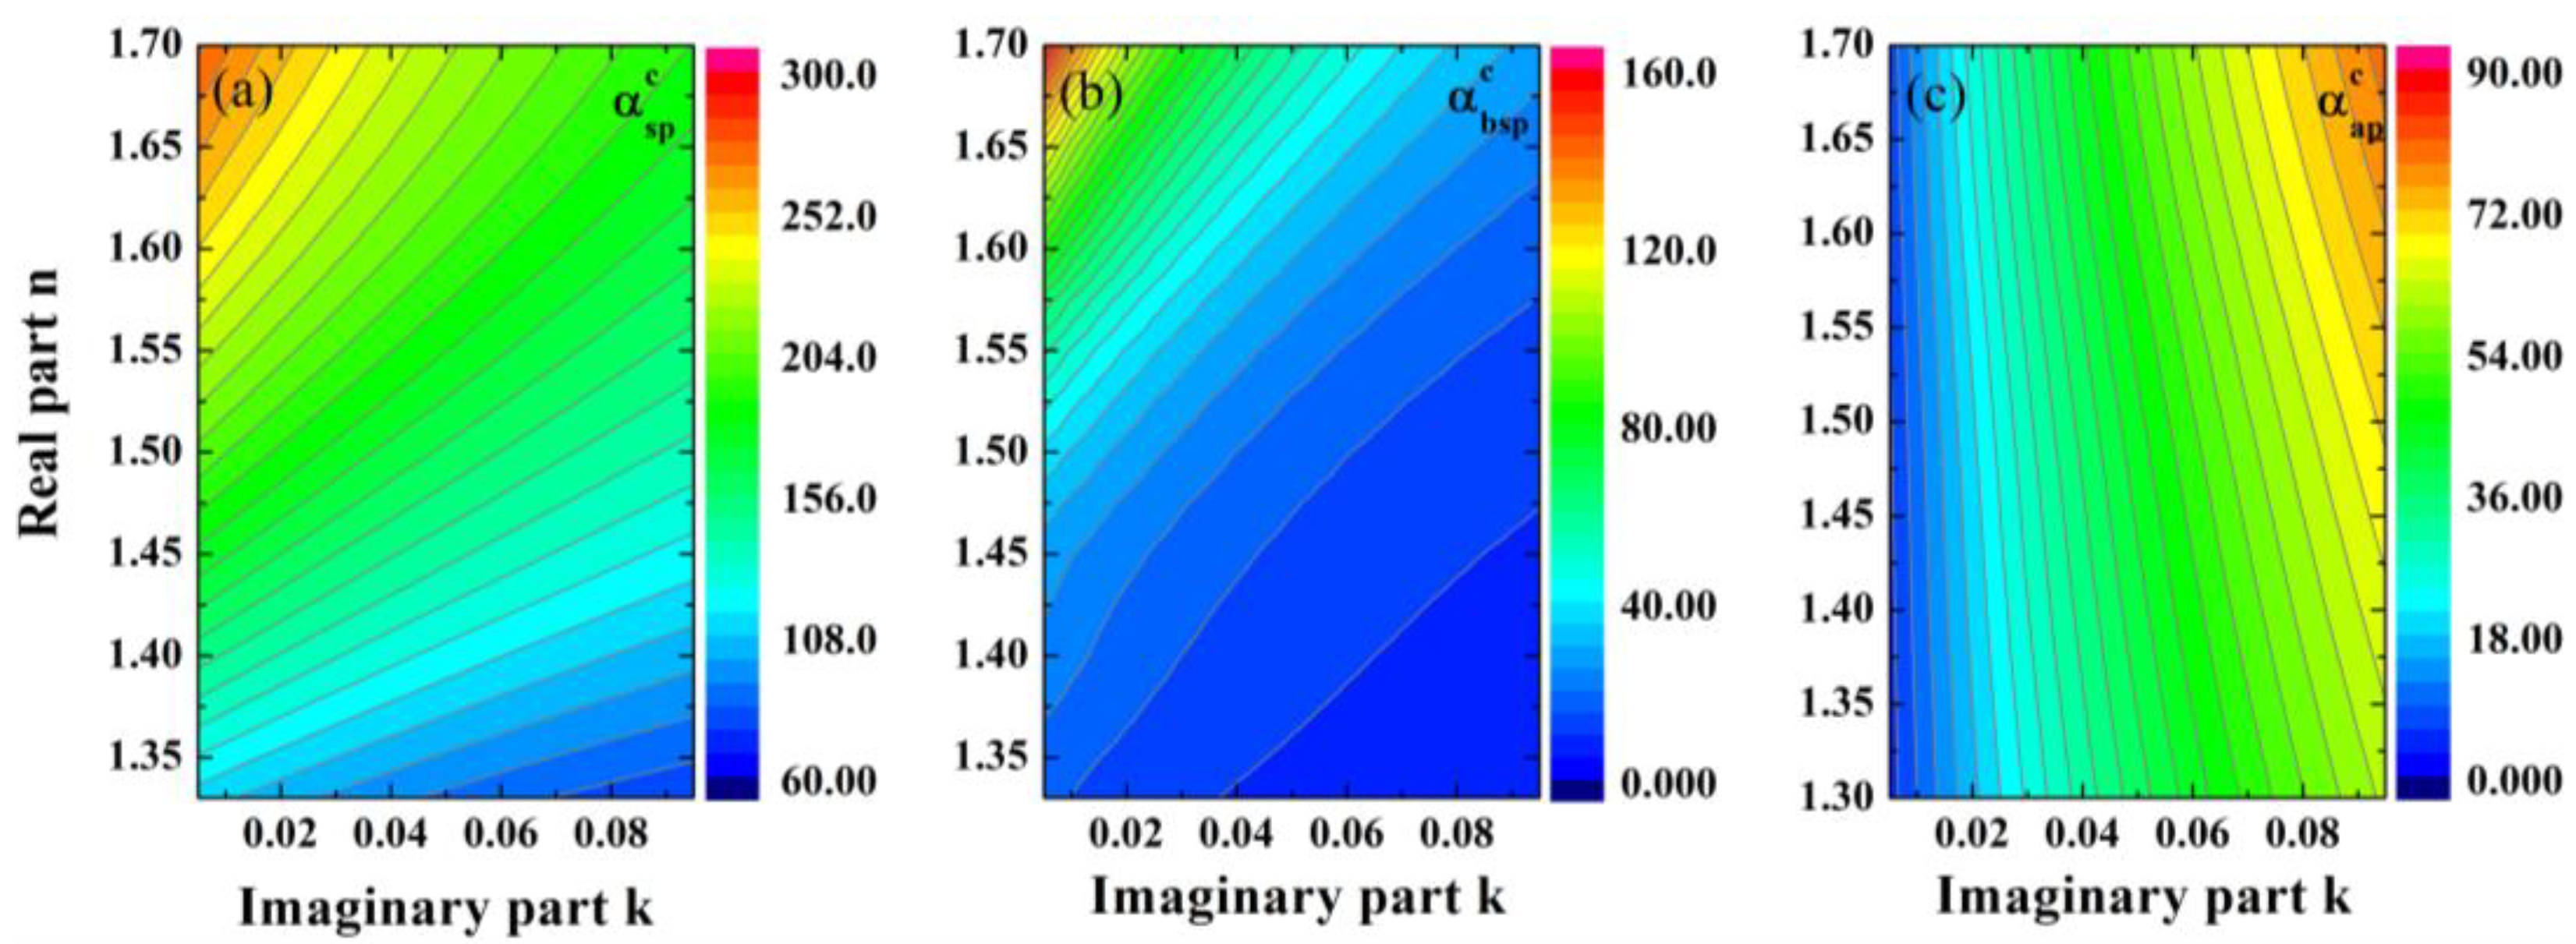
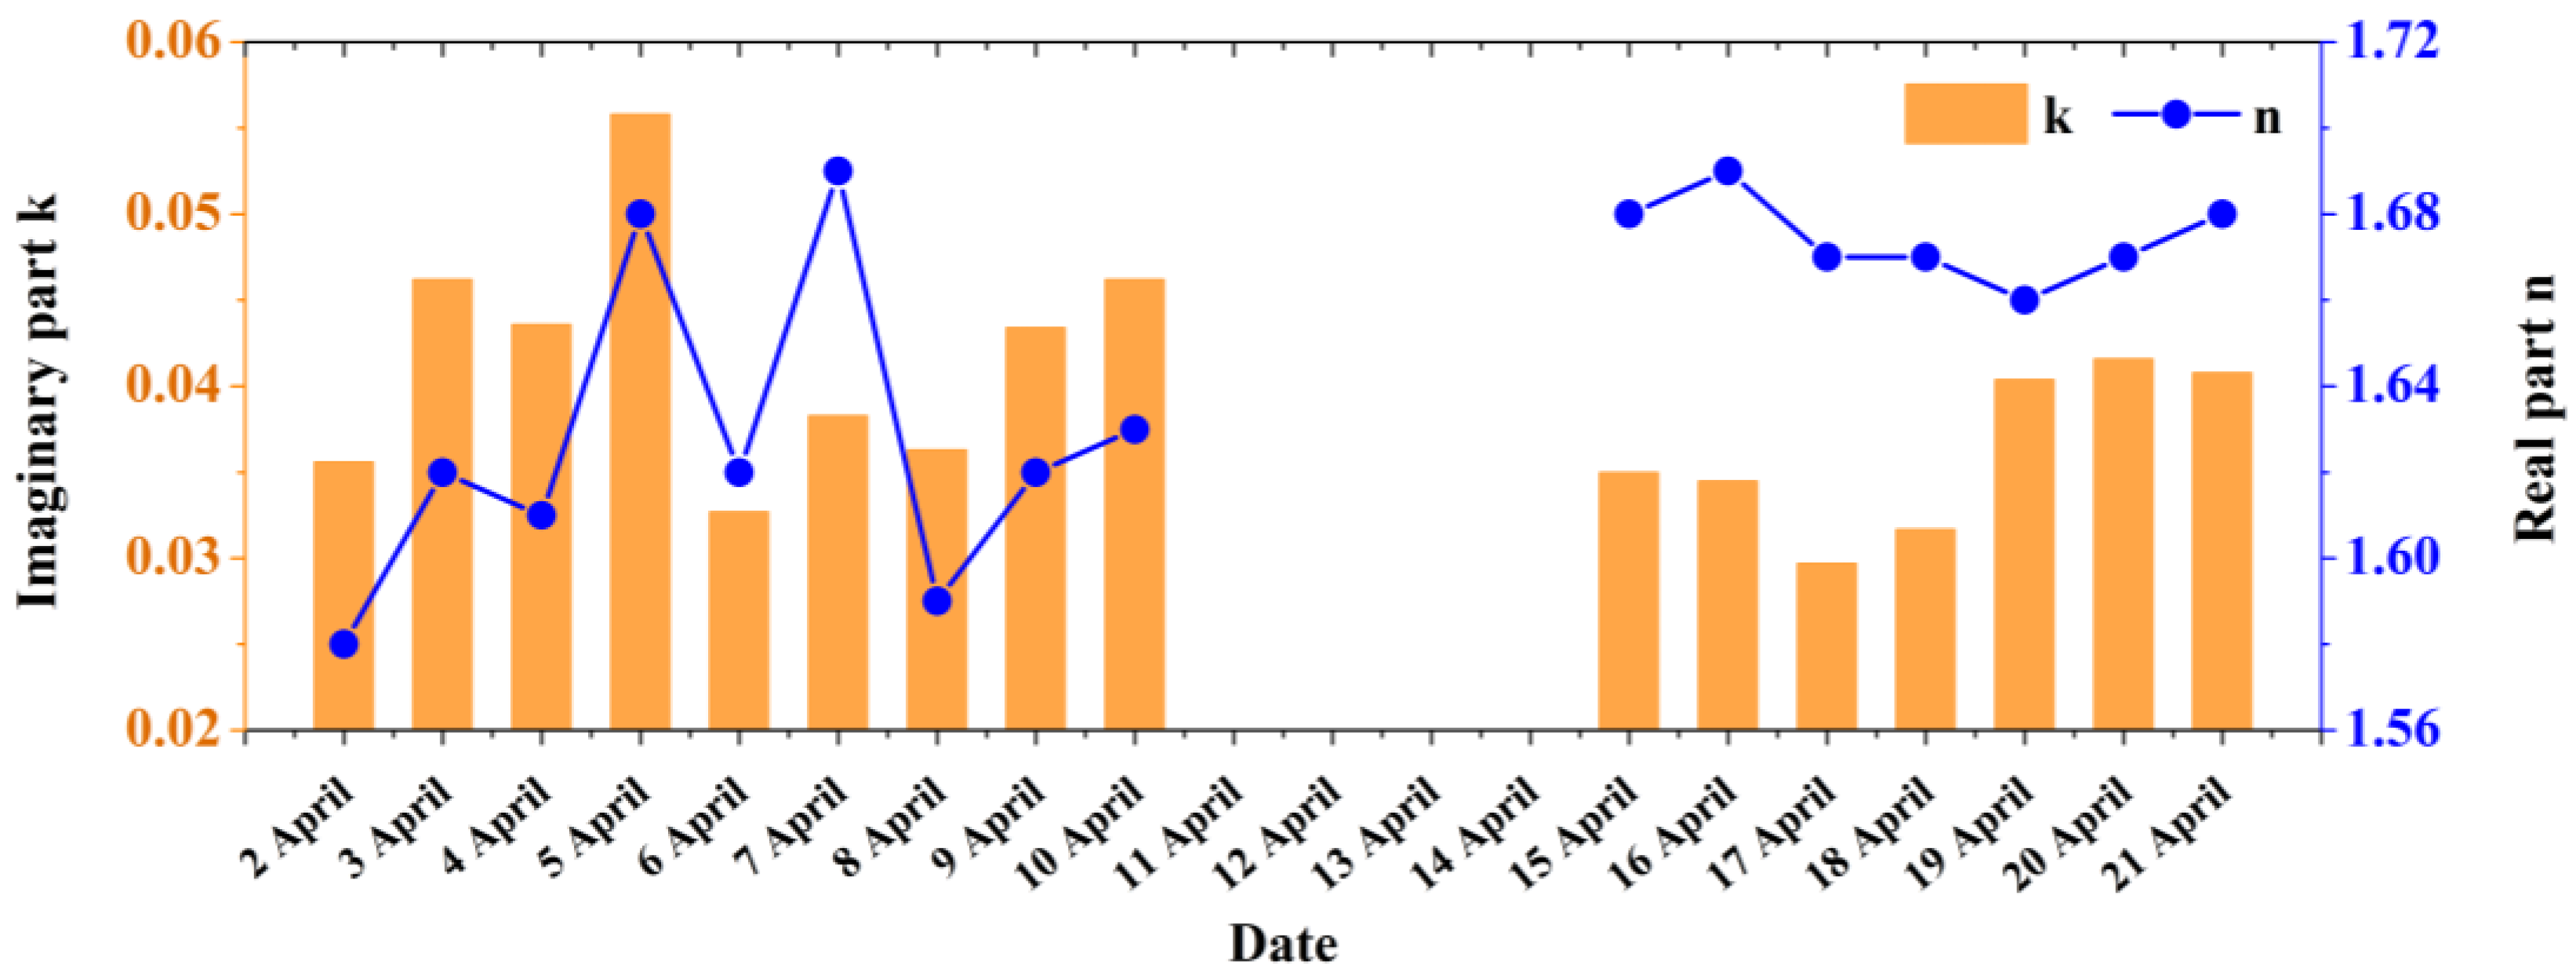
4.2. Retrieval of the Complex Refractive Index
5. Conclusions
Author Contributions
Funding
Data Availability Statement
Acknowledgments
Conflicts of Interest
Appendix A


| SSA | λ (nm) | Species | Reference |
|---|---|---|---|
| 0.2 | 550 | Diesel soot | Schnaiter et al., 2003 [70] |
| 0.2–0.3 | 550 | BC fractal aggregates | Smith and Grainger et al., 2014 [71] |
| 0.7 | 550 | Biomass burning | Schnaiter et al., 2005 [62] |
| 0.3 | 550 | Soot with OC < 20% | Schnaiter et al., 2006 [69] |
| 0.7 | 550 | Soot with OC~50% | Schnaiter et al., 2006 [69] |
| 0.7 ± 0.18 | 870 | Fine particles over a Western Tibetan Plateau site | Zhang et al., 2021 [72] |
References
- Hand, J.L.; Gill, T.; Schichtel, B. Spatial and seasonal variability in fine mineral dust and coarse aerosol mass at remote sites across the United States. J. Geophys. Res. Atmos. 2017, 122, 3080–3097. [Google Scholar] [CrossRef]
- Scheuvens, D.; Schütz, L.; Kandler, K.; Ebert, M.; Weinbruch, S. Bulk composition of northern African dust and its source sediments—A compilation. Earth-Sci. Rev. 2013, 116, 170–194. [Google Scholar] [CrossRef]
- Skiles, S.M.; Painter, T.H. Toward understanding direct absorption and grain size feedbacks by dust radiative forcing in snow with coupled snow physical and radiative transfer modeling. Water Resour. Res. 2019, 55, 7362–7378. [Google Scholar] [CrossRef]
- Christia, C.; Poma, G.; Besis, A.; Samara, C.; Covaci, A. Legacy and emerging organophosphοrus flame retardants in car dust from Greece: Implications for human exposure. Chemosphere 2018, 196, 231–239. [Google Scholar] [CrossRef] [PubMed]
- Svensson, J.; Ström, J.; Kivekäs, N.; Dkhar, N.B.; Tayal, S.; Sharma, V.P.; Jutila, A.; Backman, J.; Virkkula, A.; Ruppel, M. Light-absorption of dust and elemental carbon in snow in the Indian Himalayas and the Finnish Arctic. Atmos. Meas. Tech. 2018, 11, 1403–1416. [Google Scholar] [CrossRef] [Green Version]
- Huang, J.; Wang, T.; Wang, W.; Li, Z.; Yan, H. Climate effects of dust aerosols over East Asian arid and semiarid regions. J. Geophys. Res. Atmos. 2014, 119, 11398–11416. [Google Scholar] [CrossRef]
- Creamean, J.M.; Suski, K.J.; Rosenfeld, D.; Cazorla, A.; DeMott, P.J.; Sullivan, R.C.; White, A.B.; Ralph, F.M.; Minnis, P.; Comstock, J.M. Dust and biological aerosols from the Sahara and Asia influence precipitation in the western US. Science 2013, 339, 1572–1578. [Google Scholar] [CrossRef] [Green Version]
- Hara, K.; Zhang, D. Bacterial abundance and viability in long-range transported dust. Atmos. Environ. 2012, 47, 20–25. [Google Scholar] [CrossRef]
- Zhao, C.; Liu, X.; Leung, L.; Johnson, B.; McFarlane, S.A.; Gustafson Jr, W.; Fast, J.D.; Easter, R. The spatial distribution of mineral dust and its shortwave radiative forcing over North Africa: Modeling sensitivities to dust emissions and aerosol size treatments. Atmos. Chem. Phys. 2010, 10, 8821–8838. [Google Scholar] [CrossRef] [Green Version]
- Haas, D.; Kriso, A.; Fritz, T.; Galler, H.; Habib, J.; Ilieva, M.; Kropsch, M.; Ofner-Kopeinig, P.; Stonitsch, M.; Strasser, A. Background concentrations of cultivable, mesophilic bacteria and dust particles in the air in urban, rural and mountain regions. Int. J. Environ. Res. Public Health 2020, 17, 9572. [Google Scholar] [CrossRef]
- Kandler, K.; Benker, N.; Bundke, U.; Cuevas, E.; Ebert, M.; Knippertz, P.; Rodriguez, S.; Schütz, L.; Weinbruch, S. Chemical composition and complex refractive index of Saharan Mineral Dust at Izaña, Tenerife (Spain) derived by electron microscopy. Atmos. Environ. 2007, 41, 8058–8074. [Google Scholar] [CrossRef]
- Di Biagio, C.; Formenti, P.; Balkanski, Y.; Caponi, L.; Cazaunau, M.; Pangui, E.; Journet, E.; Nowak, S.; Andreae, M.O.; Kandler, K. Complex refractive indices and single-scattering albedo of global dust aerosols in the shortwave spectrum and relationship to size and iron content. Atmos. Chem. Phys. 2019, 19, 15503–15531. [Google Scholar] [CrossRef] [Green Version]
- Skonieczny, C.; Bory, A.; Bout-Roumazeilles, V.; Abouchami, W.; Galer, S.J.; Crosta, X.; Stuut, J.B.; Meyer, I.; Chiapello, I.; Podvin, T. The 7–13 March 2006 major Saharan outbreak: Multiproxy characterization of mineral dust deposited on the West African margin. J. Geophys. Res. Atmos. 2011, 116, D18. [Google Scholar] [CrossRef]
- Caquineau, S.; Gaudichet, A.; Gomes, L.; Legrand, M. Mineralogy of Saharan dust transported over northwestern tropical Atlantic Ocean in relation to source regions. J. Geophys. Res. Atmos. 2002, 107, AAC 4-1–AAC 4-12. [Google Scholar] [CrossRef]
- Proestakis, E.; Amiridis, V.; Marinou, E.; Georgoulias, A.K.; Solomos, S.; Kazadzis, S.; Chimot, J.; Che, H.; Alexandri, G.; Binietoglou, I. Nine-year spatial and temporal evolution of desert dust aerosols over South and East Asia as revealed by CALIOP. Atmos. Chem. Phys. 2018, 18, 1337–1362. [Google Scholar] [CrossRef] [Green Version]
- Mamouri, R.-E.; Ansmann, A.; Nisantzi, A.; Kokkalis, P.; Schwarz, A.; Hadjimitsis, D. Low Arabian dust extinction-to-backscatter ratio. Geophys. Res. Lett. 2013, 40, 4762–4766. [Google Scholar] [CrossRef]
- Yang, M.; Howell, S.; Zhuang, J.; Huebert, B. Attribution of aerosol light absorption to black carbon, brown carbon, and dust in China–interpretations of atmospheric measurements during EAST-AIRE. Atmos. Chem. Phys. 2009, 9, 2035–2050. [Google Scholar] [CrossRef] [Green Version]
- Collaud Coen, M.; Weingartner, E.; Schaub, D.; Hueglin, C.; Corrigan, C.; Henning, S.; Schwikowski, M.; Baltensperger, U. Saharan dust events at the Jungfraujoch: Detection by wavelength dependence of the single scattering albedo and first climatology analysis. Atmos. Chem. Phys. 2004, 4, 2465–2480. [Google Scholar] [CrossRef] [Green Version]
- Jin, Y.; Kai, K.; Shibata, T.; Zhang, K.; Zhou, H. Validation of the dust layer structure over the Taklimakan Desert, China by the CALIOP space-borne lidar using ground-based lidar. Sola 2010, 6, 121–124. [Google Scholar] [CrossRef] [Green Version]
- Hu, Q.; Wang, H.; Goloub, P.; Li, Z.; Veselovskii, I.; Podvin, T.; Li, K.; Korenskiy, M. The characterization of Taklamakan dust properties using a multiwavelength Raman polarization lidar in Kashi, China. Atmos. Chem. Phys. 2020, 20, 13817–13834. [Google Scholar] [CrossRef]
- Sun, J.; Shen, Z.; Zhang, L.; Lei, Y.; Gong, X.; Zhang, Q.; Zhang, T.; Xu, H.; Cui, S.; Wang, Q. Chemical source profiles of urban fugitive dust PM2. 5 samples from 21 cities across China. Sci. Total Environ. 2019, 649, 1045–1053. [Google Scholar] [CrossRef] [PubMed]
- Tao, J.; Zhang, L.; Cao, J.; Zhang, R. A review of current knowledge concerning PM2.5 chemical composition, aerosol optical properties and their relationships across China. Atmos. Chem. Phys. 2017, 17, 9485–9518. [Google Scholar] [CrossRef] [Green Version]
- Yu, H.; Zhao, X.; Wang, J.; Yin, B.; Geng, C.; Wang, X.; Gu, C.; Huang, L.; Yang, W.; Bai, Z. Chemical characteristics of road dust PM2.5 fraction in oasis cities at the margin of Tarim Basin. J. Environ. Sci. 2020, 95, 217–224. [Google Scholar] [CrossRef] [PubMed]
- Yu, H.; Yang, W.; Wang, X.; Yin, B.; Zhang, X.; Wang, J.; Gu, C.; Ming, J.; Geng, C.; Bai, Z. A seriously sand storm mixed air-polluted area in the margin of Tarim Basin: Temporal-spatial distribution and potential sources. Sci. Total Environ. 2019, 676, 436–446. [Google Scholar] [CrossRef] [PubMed]
- Putaud, J.-P.; Van Dingenen, R.; Dell’Acqua, A.; Raes, F.; Matta, E.; Decesari, S.; Facchini, M.; Fuzzi, S. Size-segregated aerosol mass closure and chemical composition in Monte Cimone (I) during MINATROC. Atmos. Chem. Phys. 2004, 4, 889–902. [Google Scholar] [CrossRef] [Green Version]
- Falkovich, A.H.; Schkolnik, G.; Ganor, E.; Rudich, Y. Adsorption of organic compounds pertinent to urban environments onto mineral dust particles. J. Geophys. Res. Atmos. 2004, 109, D02208. [Google Scholar] [CrossRef]
- Tian, P.; Zhang, L.; Ma, J.; Tang, K.; Xu, L.; Wang, Y.; Cao, X.; Liang, J.; Ji, Y.; Jiang, J.H. Radiative absorption enhancement of dust mixed with anthropogenic pollution over East Asia. Atmos. Chem. Phys. 2018, 18, 7815–7825. [Google Scholar] [CrossRef] [Green Version]
- Li, L.; Li, Z.; Chang, W.; Ou, Y.; Goloub, P.; Li, C.; Li, K.; Hu, Q.; Wang, J.; Wendisch, M. Aerosol solar radiative forcing near the Taklimakan Desert based on radiative transfer and regional meteorological simulations during the Dust Aerosol Observation-Kashi campaign. Atmos. Chem. Phys. 2020, 20, 10845–10864. [Google Scholar] [CrossRef]
- Reid, J.S.; Eck, T.F.; Christopher, S.a.; Koppmann, R.; Dubovik, O.; Eleuterio, D.; Holben, B.N.; Reid, E.A.; Zhang, J. A review of biomass burning emissions part III: Intensive optical properties of biomass burning particles. Atmos. Chem. Phys. 2005, 5, 827–849. [Google Scholar] [CrossRef] [Green Version]
- Russell, P.; Bergstrom, R.; Shinozuka, Y.; Clarke, A.; DeCarlo, P.; Jimenez, J.; Livingston, J.; Redemann, J.; Dubovik, O.; Strawa, A. Absorption Angstrom Exponent in AERONET and related data as an indicator of aerosol composition. Atmos. Chem. Phys. 2010, 10, 1155–1169. [Google Scholar] [CrossRef] [Green Version]
- Ridley, D.A.; Heald, C.L.; Kok, J.F.; Zhao, C. An observationally constrained estimate of global dust aerosol optical depth. Atmos. Chem. Phys. 2016, 16, 15097–15117. [Google Scholar] [CrossRef] [Green Version]
- Li, Z.; Xu, H.; Li, K.; Li, D.; Xie, Y.; Li, L.; Zhang, Y.; Gu, X.; Zhao, W.; Tian, Q. Comprehensive study of optical, physical, chemical, and radiative properties of total columnar atmospheric aerosols over China: An overview of Sun–Sky Radiometer Observation Network (SONET) measurements. Bull. Am. Meteorol. Soc. 2018, 99, 739–755. [Google Scholar] [CrossRef]
- Heim, M.; Mullins, B.J.; Umhauer, H.; Kasper, G. Performance evaluation of three optical particle counters with an efficient “multimodal” calibration method. J. Aerosol Sci. 2008, 39, 1019–1031. [Google Scholar] [CrossRef]
- Müller, T.; Laborde, M.; Kassell, G.; Wiedensohler, A. Design and performance of a three-wavelength LED-based total scatter and backscatter integrating nephelometer. Atmos. Meas. Tech. 2011, 4, 1291–1303. [Google Scholar] [CrossRef] [Green Version]
- Arnott, W.P.; Hamasha, K.; Moosmüller, H.; Sheridan, P.J.; Ogren, J.A. Towards aerosol light-absorption measurements with a 7-wavelength aethalometer: Evaluation with a photoacoustic instrument and 3-wavelength nephelometer. Aerosol Sci. Technol. 2005, 39, 17–29. [Google Scholar] [CrossRef]
- Caubel, J.J.; Cados, T.E.; Kirchstetter, T.W. A new black carbon sensor for dense air quality monitoring networks. Sensors 2018, 18, 738. [Google Scholar] [CrossRef] [Green Version]
- Gobeli, D.; Schloesser, H.; Pottberg, T. Met one instruments BAM-1020 beta attenuation mass monitor US-EPA PM2.5 federal equivalent method field test results. In Proceedings of the Air & Waste Management Association (A&WMA) Conference, Kansas City, MO, USA, 4–27 June 2008. [Google Scholar]
- Draxler, R.R.; Hess, G. An overview of the HYSPLIT_4 modelling system for trajectories. Aust. Meteorol. Mag. 1998, 47, 295–308. [Google Scholar]
- Kassianov, E.; Barnard, J.; Pekour, M.; Berg, L.K.; Shilling, J.; Flynn, C.; Mei, F.; Jefferson, A. Simultaneous retrieval of effective refractive index and density from size distribution and light-scattering data: Weakly absorbing aerosol. Atmos. Meas. Tech. 2014, 7, 3247–3261. [Google Scholar] [CrossRef] [Green Version]
- Abo Riziq, A.; Erlick, C.; Dinar, E.; Rudich, Y. Optical properties of absorbing and non-absorbing aerosols retrieved by cavity ring down (CRD) spectroscopy. Atmos. Chem. Phys. 2007, 7, 1523–1536. [Google Scholar] [CrossRef] [Green Version]
- Pettersson, A.; Lovejoy, E.R.; Brock, C.A.; Brown, S.S.; Ravishankara, A. Measurement of aerosol optical extinction at 532nm with pulsed cavity ring down spectroscopy. J. Aerosol Sci. 2004, 35, 995–1011. [Google Scholar] [CrossRef]
- Xu, X.; Zhao, W.; Zhang, Q.; Wang, S.; Fang, B.; Chen, W.; Venables, D.S.; Wang, X.; Pu, W.; Wang, X. Optical properties of atmospheric fine particles near Beijing during the HOPE-J 3 A campaign. Atmos. Chem. Phys. 2016, 16, 6421–6439. [Google Scholar] [CrossRef] [Green Version]
- Hofer, J.; Althausen, D.; Abdullaev, S.F.; Makhmudov, A.N.; Nazarov, B.I.; Schettler, G.; Engelmann, R.; Baars, H.; Fomba, K.W.; Müller, K. Long-term profiling of mineral dust and pollution aerosol with multiwavelength polarization Raman lidar at the Central Asian site of Dushanbe, Tajikistan: Case studies. Atmos. Chem. Phys. 2017, 17, 14559–14577. [Google Scholar] [CrossRef] [Green Version]
- Falkovich, A.H.; Ganor, E.; Levin, Z.; Formenti, P.; Rudich, Y. Chemical and mineralogical analysis of individual mineral dust particles. J. Geophys. Res. Atmos. 2001, 106, 18029–18036. [Google Scholar] [CrossRef] [Green Version]
- Zhang, Y.; Li, Z.; Chen, Y.; de Leeuw, G.; Zhang, C.; Xie, Y.; Li, K. Improved inversion of aerosol components in the atmospheric column from remote sensing data. Atmos. Chem. Phys. 2020, 20, 12795–12811. [Google Scholar] [CrossRef]
- Guan, X.; Zhang, N.; Tian, P.; Tang, C.; Zhang, Z.; Wang, L.; Zhang, Y.; Zhang, M.; Guo, Y.; Du, T. Wintertime vertical distribution of black carbon and single scattering albedo in a semi-arid region derived from tethered balloon observations. Sci. Total Environ. 2022, 807, 150790. [Google Scholar] [CrossRef]
- Kirchstetter, T.W.; Novakov, T.; Hobbs, P.V. Evidence that the spectral dependence of light absorption by aerosols is affected by organic carbon. J. Geophys. Res. Atmos. 2004, 109, D21208. [Google Scholar] [CrossRef] [Green Version]
- Lee, S.; Yoon, S.-C.; Kim, S.-W.; Kim, Y.P.; Ghim, Y.S.; Kim, J.-H.; Kang, C.-H.; Kim, Y.J.; Chang, L.-S.; Lee, S.-J. Spectral dependency of light scattering/absorption and hygroscopicity of pollution and dust aerosols in Northeast Asia. Atmos. Environ. 2012, 50, 246–254. [Google Scholar] [CrossRef]
- Anderson, T.L.; Ogren, J.A. Determining aerosol radiative properties using the TSI 3563 integrating nephelometer. Aerosol Sci. Technol. 1998, 29, 57–69. [Google Scholar] [CrossRef] [Green Version]
- Zhang, X.; Wu, G.; Zhang, C.; Xu, T.; Zhou, Q. What is the real role of iron oxides in the optical properties of dust aerosols? Atmos. Chem. Phys. 2015, 15, 12159–12177. [Google Scholar] [CrossRef] [Green Version]
- Moosmüller, H.; Engelbrecht, J.P.; Skiba, M.; Frey, G.; Chakrabarty, R.K.; Arnott, W.P. Single scattering albedo of fine mineral dust aerosols controlled by iron concentration. J. Geophys. Res. Atmos. 2012, 117, D11210. [Google Scholar] [CrossRef] [Green Version]
- Lafon, S.; Sokolik, I.N.; Rajot, J.L.; Caquineau, S.; Gaudichet, A. Characterization of iron oxides in mineral dust aerosols: Implications for light absorption. J. Geophys. Res. Atmos. 2006, 111, D21207. [Google Scholar] [CrossRef]
- Mahowald, N.M.; Baker, A.R.; Bergametti, G.; Brooks, N.; Duce, R.A.; Jickells, T.D.; Kubilay, N.; Prospero, J.M.; Tegen, I. Atmospheric global dust cycle and iron inputs to the ocean. Glob. Biogeochem. Cycles 2005, 19, GB4025. [Google Scholar] [CrossRef]
- Prats, N.; Cachorro, V.; Sorribas, M.; Mogo, S.; Berjón, A.; Toledano, C.; De Frutos, A.; De la Rosa, J.; Laulainen, N.; De la Morena, B. Columnar aerosol optical properties during “El Arenosillo 2004 summer campaign”. Atmos. Environ. 2008, 42, 2643–2653. [Google Scholar] [CrossRef]
- Foyo-Moreno, I.; Alados, I.; Guerrero-Rascado, J.L.; Lyamani, H.; Pérez-Ramírez, D.; Olmo, F.; Alados-Arboledas, L. Contribution to column-integrated aerosol typing based on Sun-photometry using different criteria. Atmos. Res. 2019, 224, 1–17. [Google Scholar] [CrossRef] [Green Version]
- Dubovik, O.; Holben, B.; Eck, T.F.; Smirnov, A.; Kaufman, Y.J.; King, M.D.; Tanré, D.; Slutsker, I. Variability of absorption and optical properties of key aerosol types observed in worldwide locations. J. Atmos. Sci. 2002, 59, 590–608. [Google Scholar] [CrossRef]
- Bergstrom, R.W.; Pilewskie, P.; Russell, P.B.; Redemann, J.; Bond, T.C.; Quinn, P.K.; Sierau, B. Spectral absorption properties of atmospheric aerosols. Atmos. Chem. Phys. 2007, 7, 5937–5943. [Google Scholar] [CrossRef] [Green Version]
- Eck, T.F.; Holben, B.; Sinyuk, A.; Pinker, R.; Goloub, P.; Chen, H.; Chatenet, B.; Li, Z.; Singh, R.P.; Tripathi, S.N. Climatological aspects of the optical properties of fine/coarse mode aerosol mixtures. J. Geophys. Res. Atmos. 2010, 115, D19205. [Google Scholar] [CrossRef] [Green Version]
- Gadhavi, H.; Jayaraman, A. Absorbing aerosols: Contribution of biomass burning and implications for radiative forcing. Ann. Geophys. 2010, 28, 103–111. [Google Scholar] [CrossRef] [Green Version]
- Chung, C.; Kim, S.-W.; Lee, M.; Yoon, S.-C.; Lee, S. Carbonaceous aerosol AAE inferred from in-situ aerosol measurements at the Gosan ABC super site, and the implications for brown carbon aerosol. Atmos. Chem. Phys. 2012, 12, 6173–6184. [Google Scholar] [CrossRef] [Green Version]
- Hoffer, A.; Gelencsér, A.; Guyon, P.; Kiss, G.; Schmid, O.; Frank, G.; Artaxo, P.; Andreae, M. Optical properties of humic-like substances (HULIS) in biomass-burning aerosols. Atmos. Chem. Phys. Discuss. 2005, 5, 7341–7360. [Google Scholar] [CrossRef] [Green Version]
- Schnaiter, M.; Schmid, O.; Petzold, A.; Fritzsche, L.; Klein, K.-F.; Andreae, M.O.; Helas, G.; Thielmann, A.; Gimmler, M.; Möhler, O. Measurement of wavelength-resolved light absorption by aerosols utilizing a UV-VIS extinction cell. Aerosol Sci. Technol. 2005, 39, 249–260. [Google Scholar] [CrossRef] [Green Version]
- Zhang, X.; Mao, M.; Yin, Y.; Tang, S. The absorption Ångstrom exponent of black carbon with brown coatings: Effects of aerosol microphysics and parameterization. Atmos. Chem. Phys. 2020, 20, 9701–9711. [Google Scholar] [CrossRef]
- Clarke, A.; McNaughton, C.; Kapustin, V.; Shinozuka, Y.; Howell, S.; Dibb, J.; Zhou, J.; Anderson, B.; Brekhovskikh, V.; Turner, H. Biomass burning and pollution aerosol over North America: Organic components and their influence on spectral optical properties and humidification response. J. Geophys. Res. Atmos. 2007, 112, D12S18. [Google Scholar] [CrossRef] [Green Version]
- Shiraiwa, M.; Kondo, Y.; Iwamoto, T.; Kita, K. Amplification of light absorption of black carbon by organic coating. Aerosol Sci. Technol. 2010, 44, 46–54. [Google Scholar] [CrossRef]
- Lack, D.A.; Cappa, C.D.; Cross, E.S.; Massoli, P.; Ahern, A.T.; Davidovits, P.; Onasch, T.B. Absorption enhancement of coated absorbing aerosols: Validation of the photo-acoustic technique for measuring the enhancement. Aerosol Sci. Technol. 2009, 43, 1006–1012. [Google Scholar] [CrossRef]
- Goel, V.; Mishra, S.K.; Pal, P.; Ahlawat, A.; Vijayan, N.; Jain, S.; Sharma, C. Influence of chemical aging on physico-chemical properties of mineral dust particles: A case study of 2016 dust storms over Delhi. Environ. Pollut. 2020, 267, 115338. [Google Scholar] [CrossRef]
- Singh, R.; Dey, S.; Tripathi, S.; Tare, V.; Holben, B. Variability of aerosol parameters over Kanpur, northern India. J. Geophys. Res. Atmos. 2004, 109, D23206. [Google Scholar] [CrossRef]
- Schnaiter, M.; Gimmler, M.; Llamas, I.; Linke, C.; Jäger, C.; Mutschke, H. Strong spectral dependence of light absorption by organic carbon particles formed by propane combustion. Atmos. Chem. Phys. 2006, 6, 2981–2990. [Google Scholar] [CrossRef] [Green Version]
- Schnaiter, M.; Horvath, H.; Möhler, O.; Naumann, K.-H.; Saathoff, H.; Schöck, O. UV-VIS-NIR spectral optical properties of soot and soot-containing aerosols. J. Aerosol Sci. 2003, 34, 1421–1444. [Google Scholar] [CrossRef]
- Smith, A.; Grainger, R. Simplifying the calculation of light scattering properties for black carbon fractal aggregates. Atmos. Chem. Phys. 2014, 14, 7825–7836. [Google Scholar] [CrossRef] [Green Version]
- Zhang, L.; Tang, C.; Huang, J.; Du, T.; Guan, X.; Tian, P.; Shi, J.; Cao, X.; Huang, Z.; Guo, Q. Unexpected high absorption of atmospheric aerosols over a western Tibetan Plateau site in summer. J. Geophys. Res. Atmos. 2021, 126, e2020JD033286. [Google Scholar] [CrossRef]


| Instrument | Parameter | Abbr./Sym. | Observation Time | |
|---|---|---|---|---|
| Total Column | Sun–sky photometer (CE 318, CIMEL) | Particle volume size distribution and single scattering albedo | PVSDcol, SSAcol | 2–21 April |
| Near-Surface | Optical particle counter (GRIMM, 1.129) | Particle number size distribution | PNSDns | 2–30 April |
| Nephelometer (Aurora 3000, Ecotech) | Scattering and backscatter coefficients (at 635 nm, 525 nm, and 450 nm) | αsca, αbsca | 2–30 April | |
| Aethalometer (AE 33, Magee Scientific) | Absorption coefficient (at 370 nm, 470 nm, 520 nm, 590 nm, 660 nm, 880 nm, and 950 nm) | αabs | 2–30 April | |
| Beta attenuation monitor (BAM-1020, MetOne) | PM2.5 mass concentration | PM2.5 | 2–30 April |
| Typical Case Period | Start Time (Beijing Time) | Description of Characteristics |
|---|---|---|
| Period RBD | From 5:00 a.m. on 6 April to 8:00 p.m. on 7 April | Clean condition with Regional Background Dust aerosol |
| Period LPD | From 5:00 a.m. on 20 April to 5:00 p.m. on 21 April | Slightly polluted condition with Local Polluted Dust aerosol |
| Period TTD | From 24 to 25 April | Highly polluted condition with Taklamakan Transported Dust aerosol |
| Periods | PM2.5 (μg/m3) | Scat. Coeff. (Mm−1) | Abs. Coeff. (Mm−1) | Ext. Coeff. (Mm−1) | SSA |
|---|---|---|---|---|---|
| RBD | 21 | 49.89 | 16.19 | 66.07 | 0.77 |
| LPD | 125 | 219.89 | 100.51 | 320.48 | 0.72 |
| TTD | 337 | 727.56 | 91.61 | 817.93 | 0.86 |
| The whole campaign | 98 | 238.8 | 66.56 | 302.97 | 0.79 |
| AAE | λ (nm) | Species | Reference |
|---|---|---|---|
| 1.6–1.8 | 470–660 | Organic aerosol | Chung et al., 2012 [60] |
| 1.5–1.9 | 450–700 | Biomass burning | Schnaiter et al., 2005 [62] |
| 0.7–1.4 | - | Coated BC with non-absorbing material | Zhang et al., 2020 [63] |
| 1.0–3.0 | 300–1000 | Carbonaceous aerosol | Kirchstetter et al., 2004 [47] |
| 6.0–7.0 | 300–700 | Humic-like substances | Hoffer et al., 2006 [61] |
| 1.0 | 300–1000 | Black carbon | Kirchstetter et al., 2004 [47] |
| Gadhavi et al., 2010 [59] | |||
| 2.3 | 300–1000 | Dust | Bergstrom et al., 2007 [57] |
| 2.1 | 440–675 | Dust-dominated aerosol | Eck et al., 2010 [58] |
| 2.0–3.3 | 440–670 | Desert dust | Russell et al., 2010 [30] |
| 1.5 ± 0.1 | 470–660 | Polluted dust | Lee et al., 2012 [48]; Yang et al., 2009 [17] |
| 1.7–4.7 | 470–660 | Mixture of dust and pollution | Clarke et al., 2007 [64] |
| 2.3 | 325–1000 | Dust-dominated aerosol | Russell et al. 2010 [30] |
| k | λ (nm) | Species | Reference |
|---|---|---|---|
| 0.007 | 532 | Mixed dust | Kandler et al., 2007 [11] |
| 0.125 | 550 | FeOOH | Goel et al., 2020 [67] |
| 0.250 | 550 | Fe2O3 | Goel et al., 2020 [67] |
| 0.670 | 550 | BC | Goel et al., 2020 [67] |
| 0.720 | 550 | BC | Kirchstetter et al., 2004 [47] |
| 0.770 | 550 | FeO | Goel et al., 2020 [67] |
| 2.800 | 550 | Fe | Goel et al., 2020 [67] |
| 0.030 | 550 | OC | Kirchstetter et al., 2004 [47] |
| >0.012 | 550 | Mixed dust | Singh et al., 2004 [68] |
Publisher’s Note: MDPI stays neutral with regard to jurisdictional claims in published maps and institutional affiliations. |
© 2022 by the authors. Licensee MDPI, Basel, Switzerland. This article is an open access article distributed under the terms and conditions of the Creative Commons Attribution (CC BY) license (https://creativecommons.org/licenses/by/4.0/).
Share and Cite
Wei, Y.; Li, Z.; Zhang, Y.; Li, K.; Chen, J.; Peng, Z.; Hu, Q.; Goloub, P.; Ou, Y. The Effects of Local Pollution and Transport Dust on Aerosol Properties in Typical Arid Regions of Central Asia during DAO-K Measurement. Atmosphere 2022, 13, 729. https://doi.org/10.3390/atmos13050729
Wei Y, Li Z, Zhang Y, Li K, Chen J, Peng Z, Hu Q, Goloub P, Ou Y. The Effects of Local Pollution and Transport Dust on Aerosol Properties in Typical Arid Regions of Central Asia during DAO-K Measurement. Atmosphere. 2022; 13(5):729. https://doi.org/10.3390/atmos13050729
Chicago/Turabian StyleWei, Yuanyuan, Zhengqiang Li, Ying Zhang, Kaitao Li, Jie Chen, Zongren Peng, Qiaoyun Hu, Philippe Goloub, and Yang Ou. 2022. "The Effects of Local Pollution and Transport Dust on Aerosol Properties in Typical Arid Regions of Central Asia during DAO-K Measurement" Atmosphere 13, no. 5: 729. https://doi.org/10.3390/atmos13050729