Abstract
In this study, the ambient concentrations of volatile organic compounds (VOCs) were intensively measured from January 2012 to December 2016 using an evacuated canister and were analyzed using a gas chromatography/mass spectrophotometer (GC/MS) based on the US EPA TO-15 in the community and industrial areas of the largest petroleum refinery and petrochemical industrial complex in Map Ta Phut Thailand. The ternary diagram was used to identify the source of VOCs. Reactivity of VOCs on their ozone formation potential (OFP) were quantified by the maximum incremental reactivity coefficient method (MIR) and propylene-equivalent concentration methods. Results from the study revealed that aromatic hydrocarbon was the dominant group of VOCs greatly contributing to the total concentration of measured VOCs. Among the measured VOCs species, toluene had the highest concentration and contributed as the major precursor to ozone formation. The ternary analysis of benzene:toluene:ethybenzene ratios indicated that VOCs mainly originated from mobile sources and industrial processes. Within the industrial area, measured VOC concentration was dominated by halogenated hydrocarbons, and alkene was the highest contributor to ozone formation. The propylene-equivalent concentration method was also used to evaluate the reactivity of VOCs and their role in ozone formation, and secondly to support findings from the MIR method.
1. Introduction
With rapid urbanization and industrialization, air pollution has become a serious problem particularly in urban and industrial areas. Vehicle exhaust and industrial activities are considered major emission sources [1,2,3]. Air pollutants such as particulate matter (PM), volatile organic compounds (VOCs), and tropospheric ozone (O3) exceed the standards in many areas [4,5,6,7] and affect human health. These problems have attracted public attention.
Tropospheric ozone (O3) is one of the most important secondary pollutants due to its harmful effects on the environment and human health [8]. It mainly forms by the photochemical reaction of nitrogen oxides (NOx) and VOCs. Exposure to O3 can cause lung irritation and impair respiratory functions [9]. O3 is a serious threat to vegetation including agricultural crops and plants in ecosystems. It can affect various physiological levels of plants and the reduction in photosynthetically active leaf area leads to reduced carbon uptake by plants. In addition, O3 poses significant threats to crop production. Various factors such as solar radiation, temperature, drought, and nitrogen supply can affect plant response to O3 [10,11,12]. O3 is also a greenhouse gas and has been linked to climate change [13]. Increasing concentrations of its precursors from urbanization and industrialization leads to a great concern on effects from increases at ground-level in many parts of the world such as in India [5,14], China [15,16,17], Canada [18,19], and Taiwan [20].
VOCs generally refer to a group of organic chemicals, having a boiling point within the range 50 °C–260 °C and high vapor pressure (>10 Pa) at ambient temperature, they are certain to vaporize and enter the atmosphere in gaseous form. VOCs include alkanes, alkynes, aromatic hydrocarbons, halogenated hydrocarbons, and aldehydes. VOCs are a very important precursor of photochemical reactivity. They act as catalyst to form O3 under favorable VOC/NOx conditions as well as forming of the secondary organic aerosols (SOA) and peroxyacetyl nitrate (PAN) [21,22,23,24]. VOCs can be emitted to the atmosphere from both biogenic and various anthropogenic activities, e.g., vehicle exhaust, industrial evaporation, refineries, paints, and solvents [25,26,27,28]. VOCs in the air are of particular concern because they have negative effects not only on the environment but also human health. VOCs can endanger human health, such as damaging the respiratory tract and being teratogenic and carcinogenic with long-term exposure [29,30]. Some VOCs including benzene, ethylbenzene, 1,3-butadiene, vinyl chloride, and trichloroethylene have been classified as carcinogens by various international organizations [31,32,33]. Many organizations establish air quality standards for individual VOCs based on toxicity levels to protect direct health impact potentially occurring from inhaling VOCS.
Ozone formation potential (OFP) is a parameter that has been widely used to describe the role of individual VOCs in tropospheric ozone formation. To evaluate the effects of VOCs on O3 formation, the maximum incremental reactivity (MIR) method, and propylene equivalent concentration have been used to quantify their potentiality on ozone formation [25,34,35,36,37,38]. For example, in the study on OFP in Beijing, China, alkenes and aromatics were reported to be the main group of VOCs contributing to OFP [39]. In Guangzhou, China, aromatics represented the largest ozone production potential, followed by alkenes [40]. In this study, the MIR and the propylene equivalent concentration methods proposed [41,42] were applied to calculate the reactivity of VOCs on ozone formation.
In this study, intensive measurement and analysis of VOCs and their potential for O3 formation was conducted in the Map Ta Phut industrial area, Thailand. It constitutes the largest petroleum and petrochemical industrial complex in Thailand with factories such as petrochemical plants, oil refineries, coal-fired power plants, iron and steel plants, and plastic manufacturers. Currently, environmental problems in this area, especially air pollution, are one of many critical issues. Monitoring data of some VOCs (1,2-dichloroethane, benzene, and 1,3-butadiene) in the community areas of the Map Ta Phut industrial complex exceed the Thai ambient air quality standards [43]. Beside the potential health impact from VOCs, high concentrations of O3 were also found in this area. This study aimed to elucidate the potential impact of VOCs by considering their direct impact and their indirect impact as the precursor of secondary air pollutants. The studies of O3 formation in urban areas reported that the potential emission sources of VOCs are biogenic [44] and anthropogenic sources. However, a few studies were conducted in the industrial area. The intensive study in the industrial areas in this research will create a better understanding of the characteristics and contributions of industrial sources towards the formation of secondary air pollutants.
2. Materials and Methods
2.1. Site Description
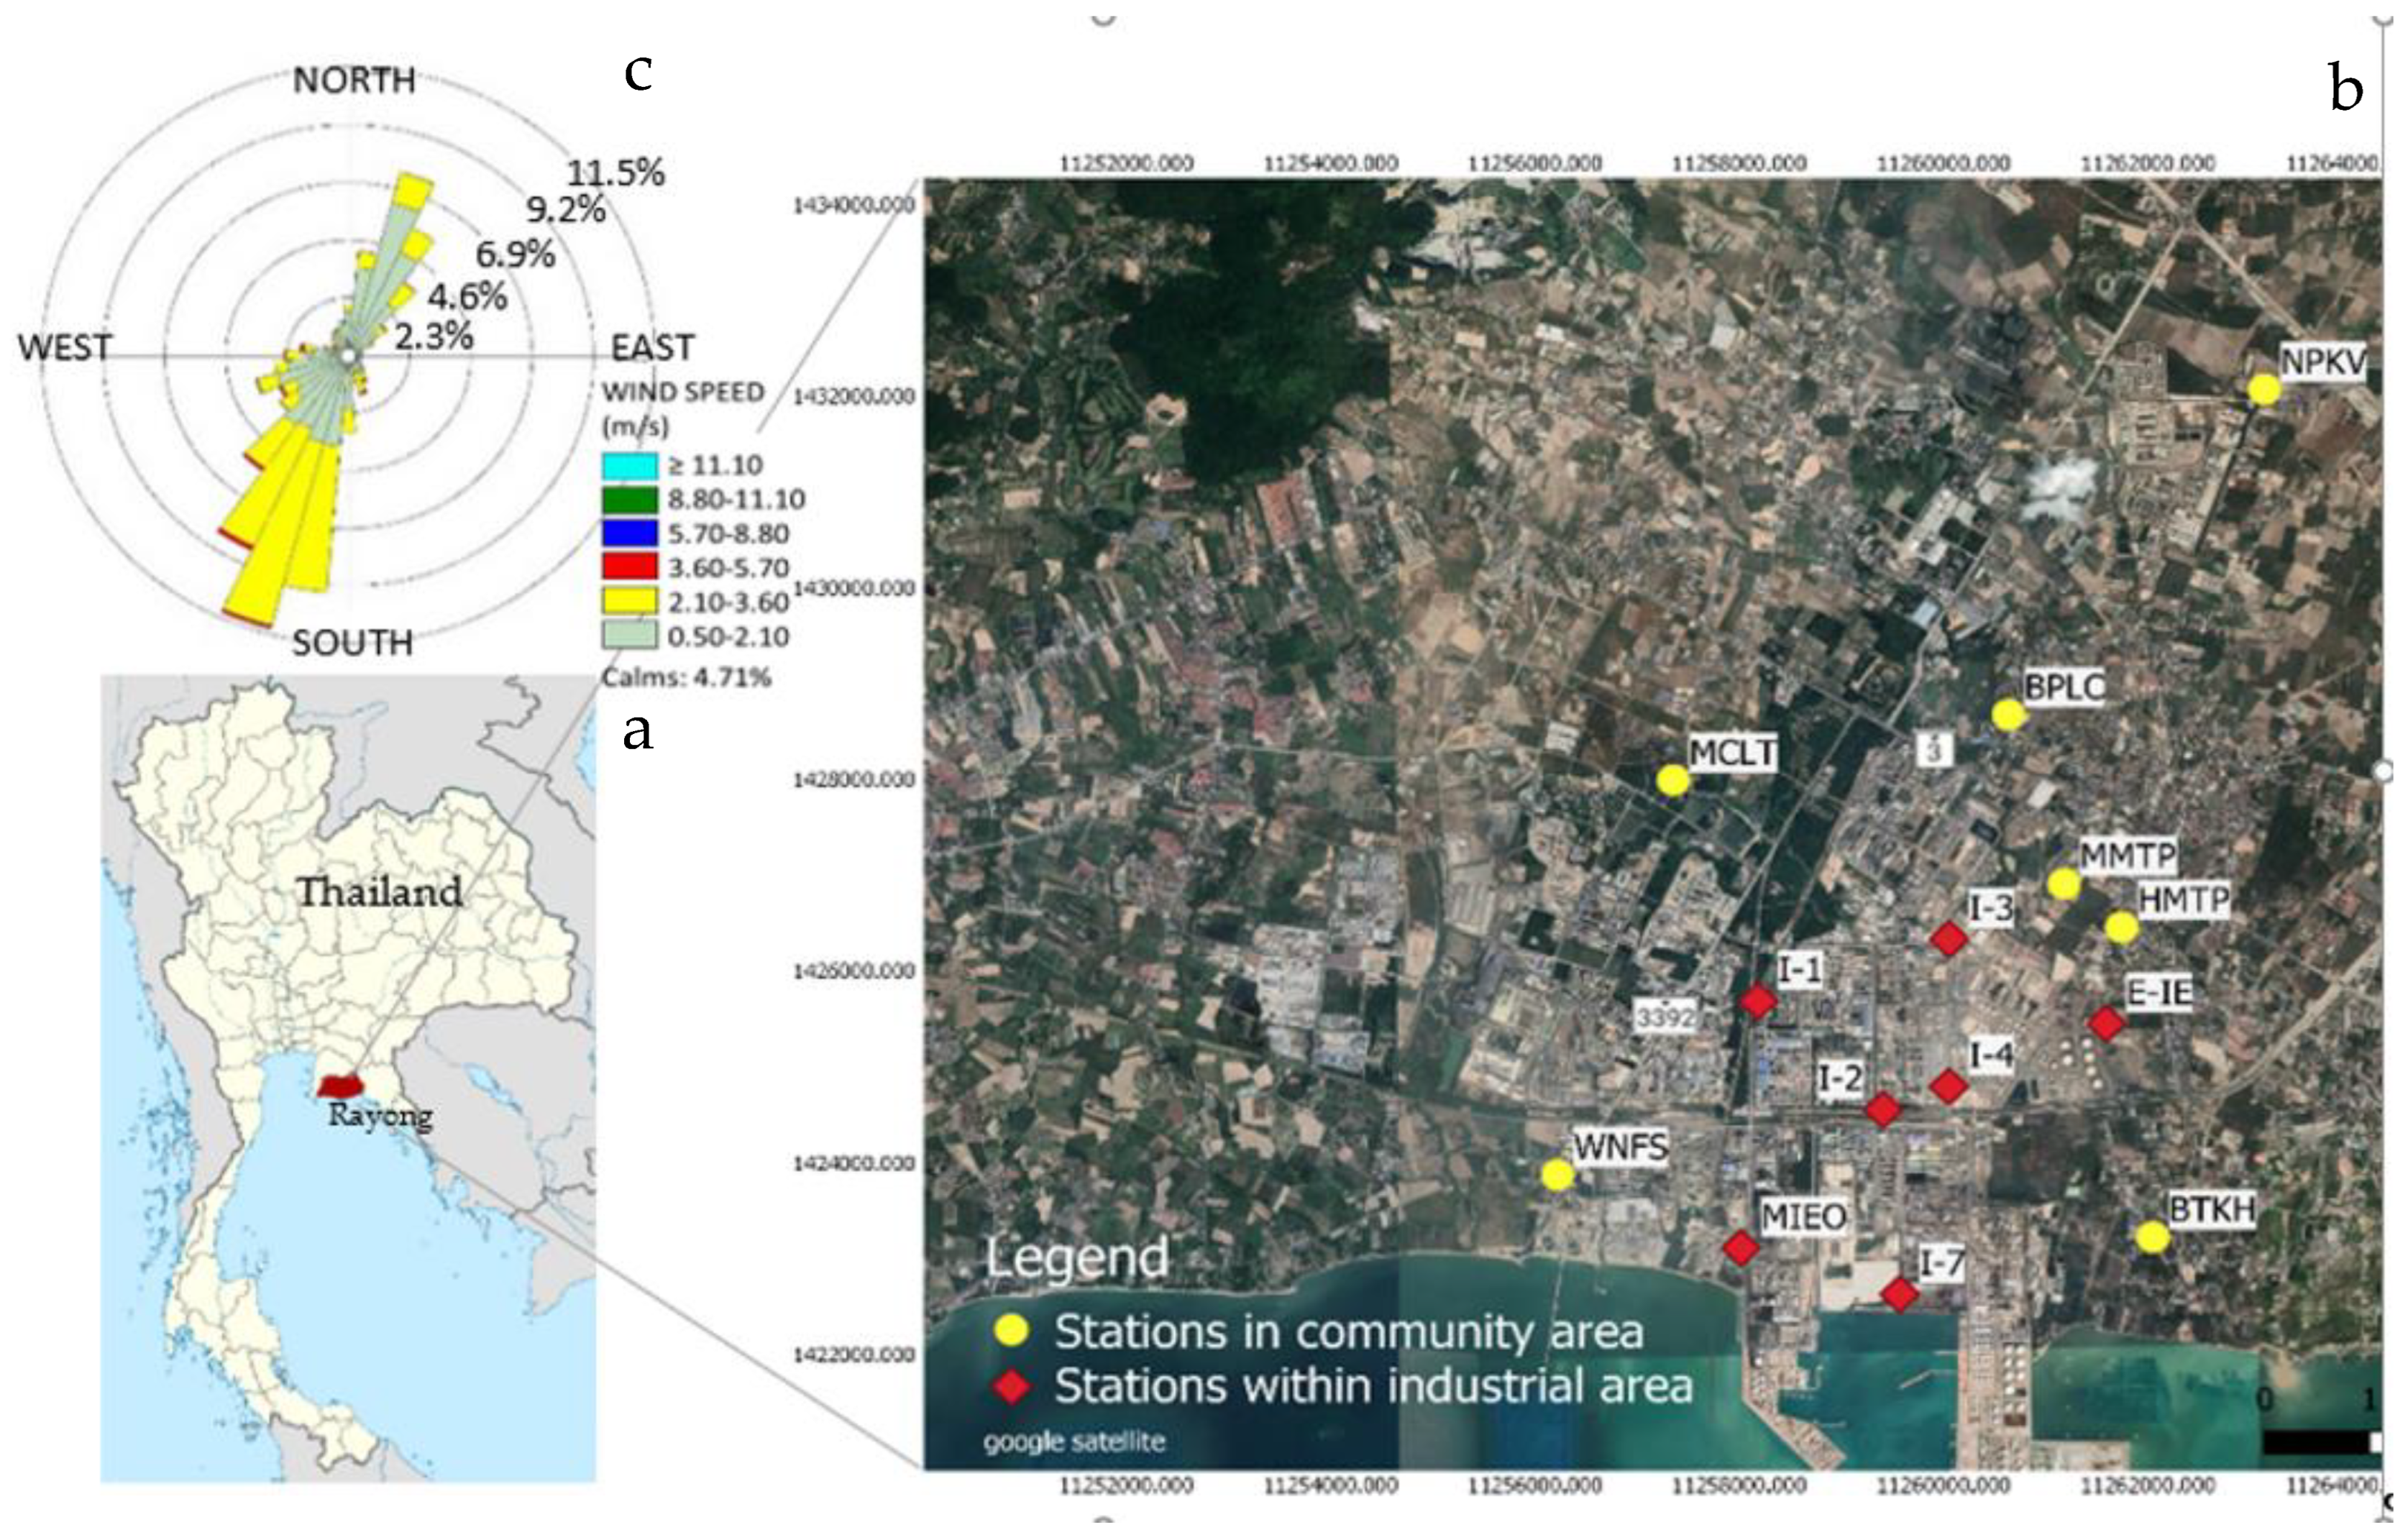
The Map Ta Phut complex is a petrochemical-based industrial area consisting of five industrial estates and one port. This industrial complex is in the Eastern region of Thailand (Figure 1a), located about 130 km east of the capital Bangkok. The industrial complex is home to heavy industry including petrochemical plants, oil refineries, coal-fired power plants, iron and steel plants, and plastics manufacturing. The annual average temperature is 28.3 °C in 2020. This area is normally influenced by two prevailing wind directions: southwest (SW) and northeast (NE). The SW wind direction is usually frequent during the wet season (April-October) while the NE is the predominant wind direction during the dry season (November-March). The wind rose diagram is shown in Figure 1c.
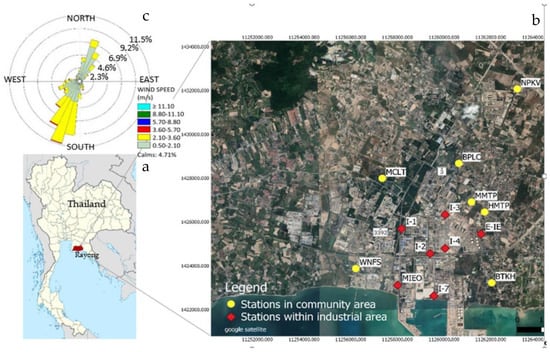
Figure 1.
Location of Map Tha Phut industrial complex, Rayong, Thailand (a) and VOC monitoring stations (b) along with wind rose diagram (c).
VOCs were comprehensively measured in the community and within industrial areas. Measurement of ambient VOCs in the community areas were conducted at 7 monitoring stations. The stations were located covering all directions from the industrial complex. Characteristics of VOC monitoring stations in the community areas are described in Table 1. Forty compounds were analyzed at each monitoring station. Seven monitoring stations located within the industrial areas were MIEO, I-4, I-3, E-IE, I-2, I-7, PTT, and I-1. Twenty VOCs species were measured once per month at each station. Spatial distribution of the monitoring station is shown in Figure 1b.

Table 1.
Information on site characteristics in the community areas.
2.2. Data Collection and Analysis
In this study, field sampling of VOCs in ambient air was performed continuously using evacuated 6-L (0.05 mmHg) SiloniteTM coated stainless steel canisters (Entech Instruments Inc., Simi Valley, CA, USA). The concentration of VOCs was analyzed in the laboratory using gas chromatography and mass spectrometry (GC/MS) based on the United States Environmental Protection Agency’s TO-15 standard method (USEPA TO-15). VOC concentrations were measured once per month for 24 h from January 2012 to December 2016. As for the sampling, the VOCs sample was introduced into the canisters by the differential pressure between atmospheric pressure and vacuum pressure inside each canister. With a flow controller, the sub-atmospheric sampling system maintained a constant flow rate from full vacuum to within about 7 kPa (1.0 psi) or less below ambient pressure. Canister flow rate was controlled by flow controller and was adjusted to 3.3 mL/minute for 24-h sampling. After collecting the ambient VOCs, the sample canister was pressurized by humidified nitrogen about 20 psia in order to prevent the contamination entering the sample canister. Samples were transferred to the thermal desorption unit, working as a preconcentrator prior to being sent to GC/MS [45,46,47].
Quality assurance and quality control (QA/QC) procedures were implemented to ensure data quality. Before sampling, all canisters were cleaned by pressurizing with nitrogen, and samples were tested as blanks to confirm their cleanliness. The samples were transferred from the containers to the preconcentration unit, where the sample volume was concentrated and minimized for injection in the gas chromatography/mass spectrophotometer (GC/MS). Air samples were drawn through the heated sampling line (170 °C) to remove moisture and control the sampling flow rate [46]. Duplicate precision was estimated by calculating the percent difference between the sample concentration and the duplicate sample concentration, which was less than 25%. For the compounds detected in blank samples, the method detection limit (MDL) and method quantitation limit were defined as the results of the calculation by multiplying the standard deviation of the blank field values by three and ten, respectively. The quality of the measured data was ensured by the QA/QC criteria rigorously performed in this study. The acceptance criteria for the correlation coefficients (r2) of the calibration curves were above 0.99. The relative standard deviation values were below 20% and were used in the calibration assessment. The MDL was determined for each compound and ranged from 0.002 to 0.05 (ug/m3). With regards to this quality control, about 3.3% of total data were excluded from this analysis. Totally, 22,880 measured VOCs data met these criteria and were used for further analysis in this study. The lists of VOC species measured in the community and within the industrial areas is shown in Table S1.
2.3. Ternary Diagram
The ratio of benzene, toluene and ethylbenzene (B:T:E) was plotted as a ternary diagram to identify the emission sources of VOCs at the monitoring stations in the community areas. The emission sources could be classified in three categories: industrial and solvent emissions, traffic emissions, and combustion emissions (biomass, biofuel, and coal combustion) according to the source profiles studied by Zhang [48] and various research results [49,50,51]. For example, traffic emissions are characterized by a high proportion of toluene, followed by benzene.
2.4. Estimation of VOCs Chemical Reactivity
The highly reactive species are rapidly degraded, while the less reactive ones are relatively stable, increasing VOC accumulation, and constitute potential contribution of VOCs sources [52]. Many different methods are used to evaluate ozone chemical reactivity, related to VOCs compounds.
2.4.1. MIR Method
The OFP of individual VOCs can be evaluated using the MIR method, developed by Carter [29]. Its equation is expressed below Equation (1).
where, is the ozone formation potential of chemical i; is the maximum incremental reactivity scale of chemical i (Table 2), is the ambient concentration of chemical i. In this study, 23 and 15 VOCs compounds measured in community and within industrial areas were selected to evaluate the OFP.

Table 2.
MIR and OH reaction rate constant of each compound.
2.4.2. Propylene-Equivalent Concentration
The propy-equiv concentration is one of the methods to elucidate the ozone reactivity in an atmospheric environment. This concentration is the measure of VOC concentration on an OH-reactivity based scale normalized to the reactivity of propene [53]. The method was proposed by Chameides [42]. The propy-equiv for each VOC species was calculated using Equation (2) below.
where, is defined as each VOC compound i on an OH reactivity-based scale normalized to the reactivity of propylene (). is the concentration of ambient VOCs compound i (ppbC), a rate constant for the reactivity of VOC compound i with an OH radical and is a rate constant for the reaction of propylene with OH radicals. The rate constants were given by Atkinson and Arey [54] (Table 2).
In propy-equiv concentration analysis, VOC mass concentration in the unit of µg/m3 is converted to volume concentration (ppbV) and converted to carbon atom concentration (ppbC).
3. Results and Discussion
3.1. Concentration and Characteristics of Ambient VOCs
Forty VOCs species were analyzed at each monitoring station in the community areas. The VOCs concentration were dominated by aromatic hydrocarbons (13.26–39.79 µg/m3), followed by halogenated hydrocarbons (9.65–14.0 µg/m3) and alkenes (0.13–0.92 µg/m3), accounting for 56.9–79.1%, 20.3–42.05%, and 0.4–2.6% of the total VOCs, respectively. The highest VOCs concentration was measured at BPLC (50.31 µg/m3), followed by HMTP (36.60 µg/m3), MMTP (35.56 µg/m3), NPKV (35.18 µg/m3), BTKH (31.11 µg/m3), WNFS (24.02 µg/m3), and MCLT (23.07 µg/m3). High concentrations were generally observed at the stations located downwind from the industrial complex particularly and adjacent to the main road. Toluene was the most abundant (5.53–24.61 µg/m3) at every station, accounting for 23.0–48.9% of total VOCs. The concentration of benzene, toluene, ethylbenzene, and m-,p-xylene were found as the top ten VOC species in this area. Remarkably, these VOCs could be emitted from mobile sources and industrial activities [55,56]. Toluene and benzene are commonly used as indicators of traffic sources and industrial activities [1,8]. M-,p-xylene and ethylbenzene are known aromatics that can be emitted from vehicle exhaust [21]. The VOCs concentrations and their percentage at the seven monitoring stations in community areas are shown in Figure 2.

Figure 2.
Concentration (a) and contribution (b) of three VOCs categories in the community areas.
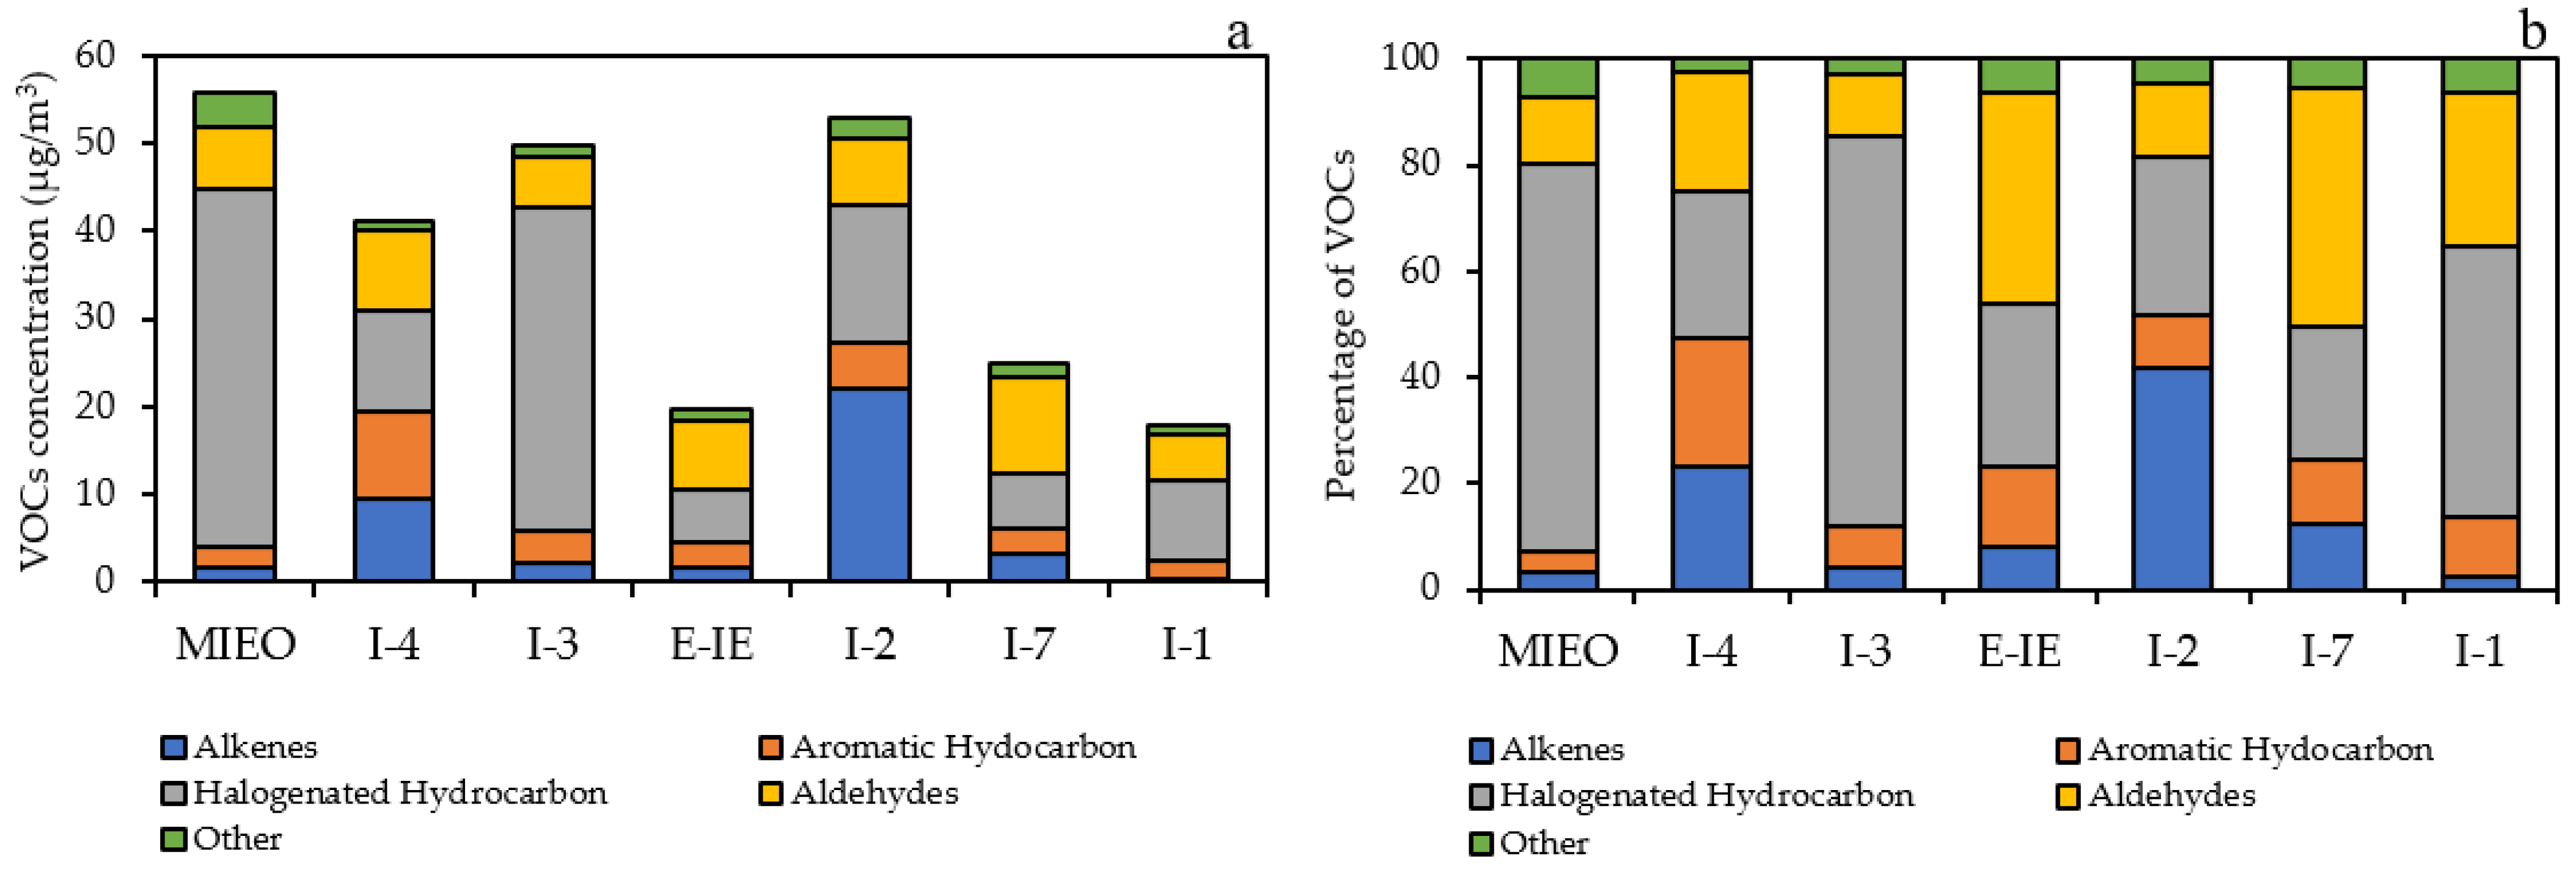
Within the industrial areas, the measured 20 VOCs species were classified in five categories: alkenes, aromatic hydrocarbons, halogenated hydrocarbons, aldehydes, and others. The VOCs concentration were dominated by halogenated hydrocarbons, with concentration of 6.0–40.9 µg/m3, accounting for 25.0–73.9% of total VOCs. Aldehydes were the second largest group, ranging from 5.2–11.2 µg/m3 (11.6–45.1%), followed by alkenes (1.7–22.1 µg/m3; 3.1–41.8%), aromatic hydrocarbons (2.0–10.0 µg/m3; 4.1–24.3%), and others (1.0–4.0 µg/m3; 2.5–7.2%). The station with the highest VOCs concentration was MIEO (55.9 µg/m3), followed by I-2 (52.8 µg/m3), I-3 (49.8 µg/m3), I-4 (41.1 µg/m3), I-7 (24.8 µg/m3), E-IE (19.6 µg/m3), and I-1 (17.9 µg/m3). High concentrations of 1,3-butadiene and acetaldehyde were detected within the industrial areas. High concentrations of 1,3-butadiene are found in highly industrialized cities or near oil refineries, chemical plants, and plastic and rubber factories, while acetaldehyde is commonly used as an intermediate in the synthesis of other chemicals and the production of polyester resins [57,58]. The concentration and contribution of five categories in each monitoring station within the industrial areas are depicted in Figure 3.
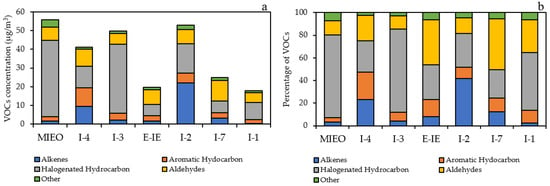
Figure 3.
Concentration (a) and contribution (b) of five VOCs categories within the industrial areas.
3.2. VOCs Source Estimations
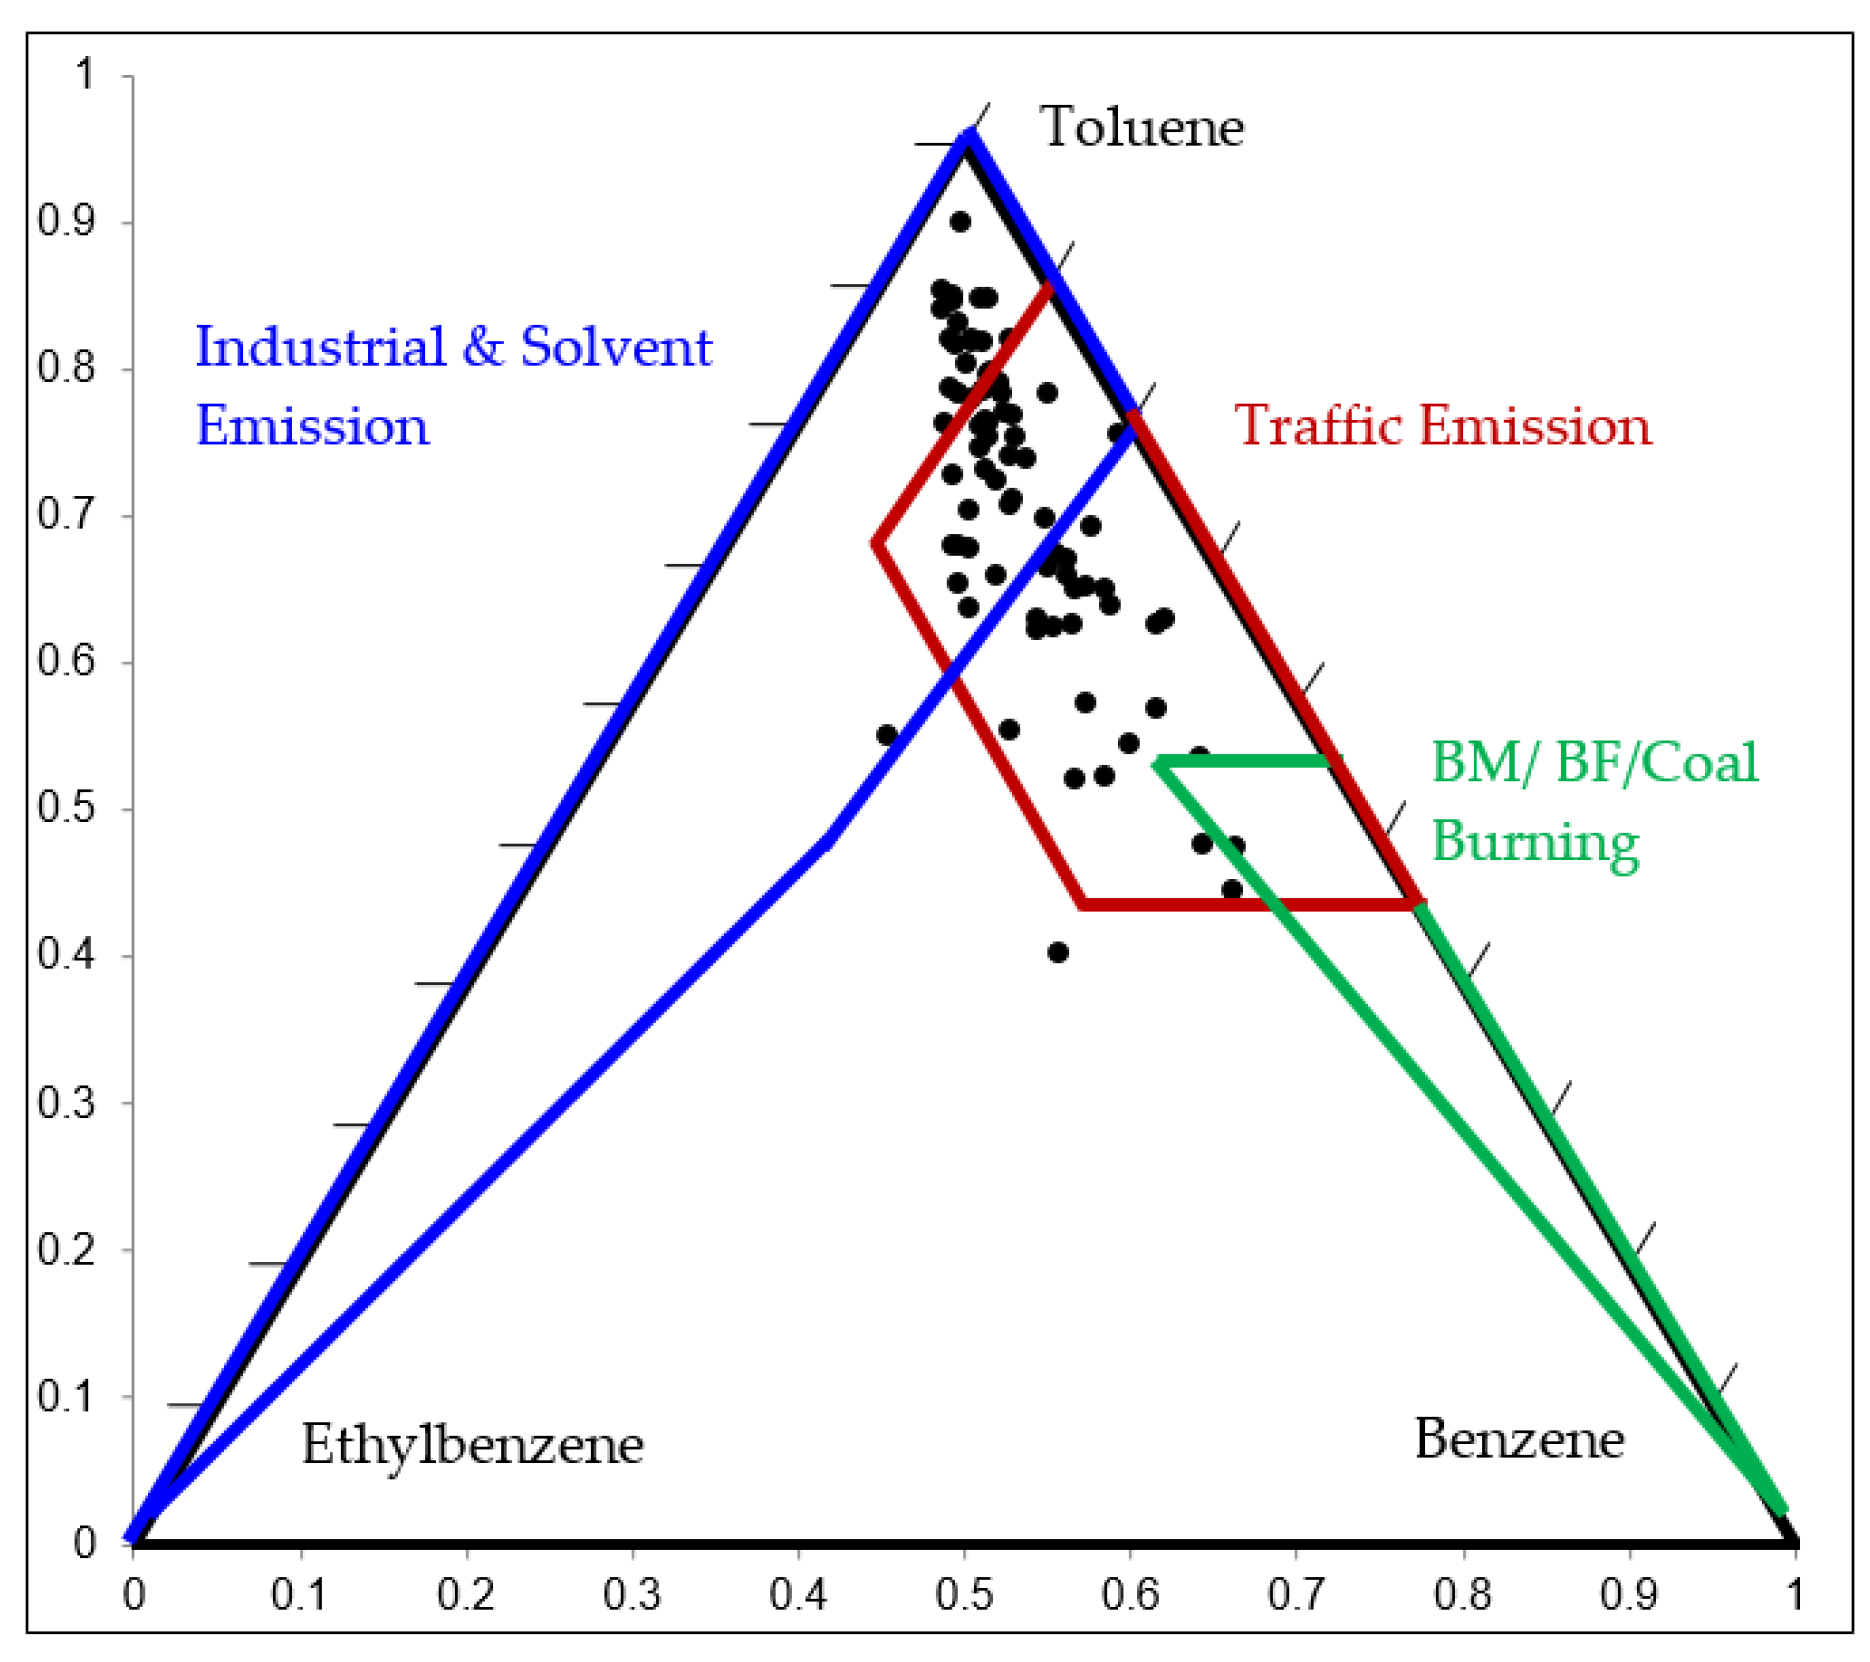
The ratio of benzene, toluene and ethylbenzene (B:T:E) is useful to identify VOC sources as industrial and solvent emissions, traffic emissions and combustion emissions. In this study, the ratio was plotted on a ternary diagram. For example, the initial relative compositions of B:T:E at the HMTP station in the community area over the observation period is illustrated in Figure 4. The ternary diagram of B:T:E at other stations is shown in Figure S1. The proportions of B:T:E were scattered mostly in the zone of industrial/solvent emissions with higher toluene and lower benzene and traffic emissions with high toluene and benzene. The average B:T:E ratios were 0.16:0.75:0.09, 0.16:0.75:0.09, 0.16:0.70:0.14, 0.21:0.69:0.10, 0.14:0.72:0.14, 0,18:0.74:0.08, and 0.18:0.72:0.1 at HMTP, BTKH, WNFS, MMTP, MCLT, BPLT, and NPKV monitoring stations, respectively. The results suggested that VOC sources are mainly from traffic and industrial locations at all sites in the community areas.
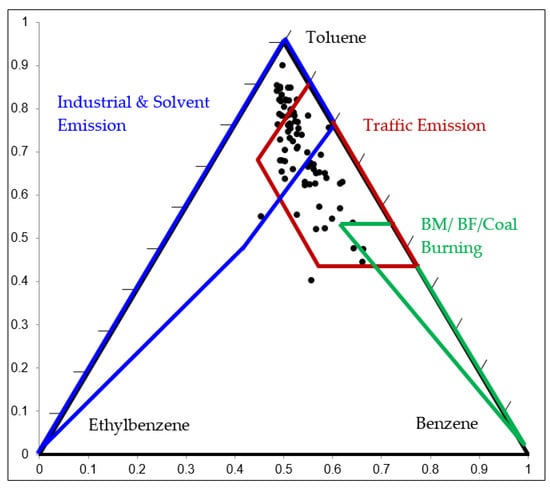
Figure 4.
B/T/E ratios at the HMTP monitoring station.
3.3. VOCs Chemical Reactivity
3.3.1. MIR Method
The MIR method has been widely used to estimate ground-level ozone formation of individual VOCs in many studies [14,51,52]. MIR is defined as the maximum increment of O3 in weight (g) per weight (g) of VOCs. OFP was evaluated using the product of the concentration (Ci) of each VOC (i) and the MIR coefficient (MIRi) of individual VOCs [29].
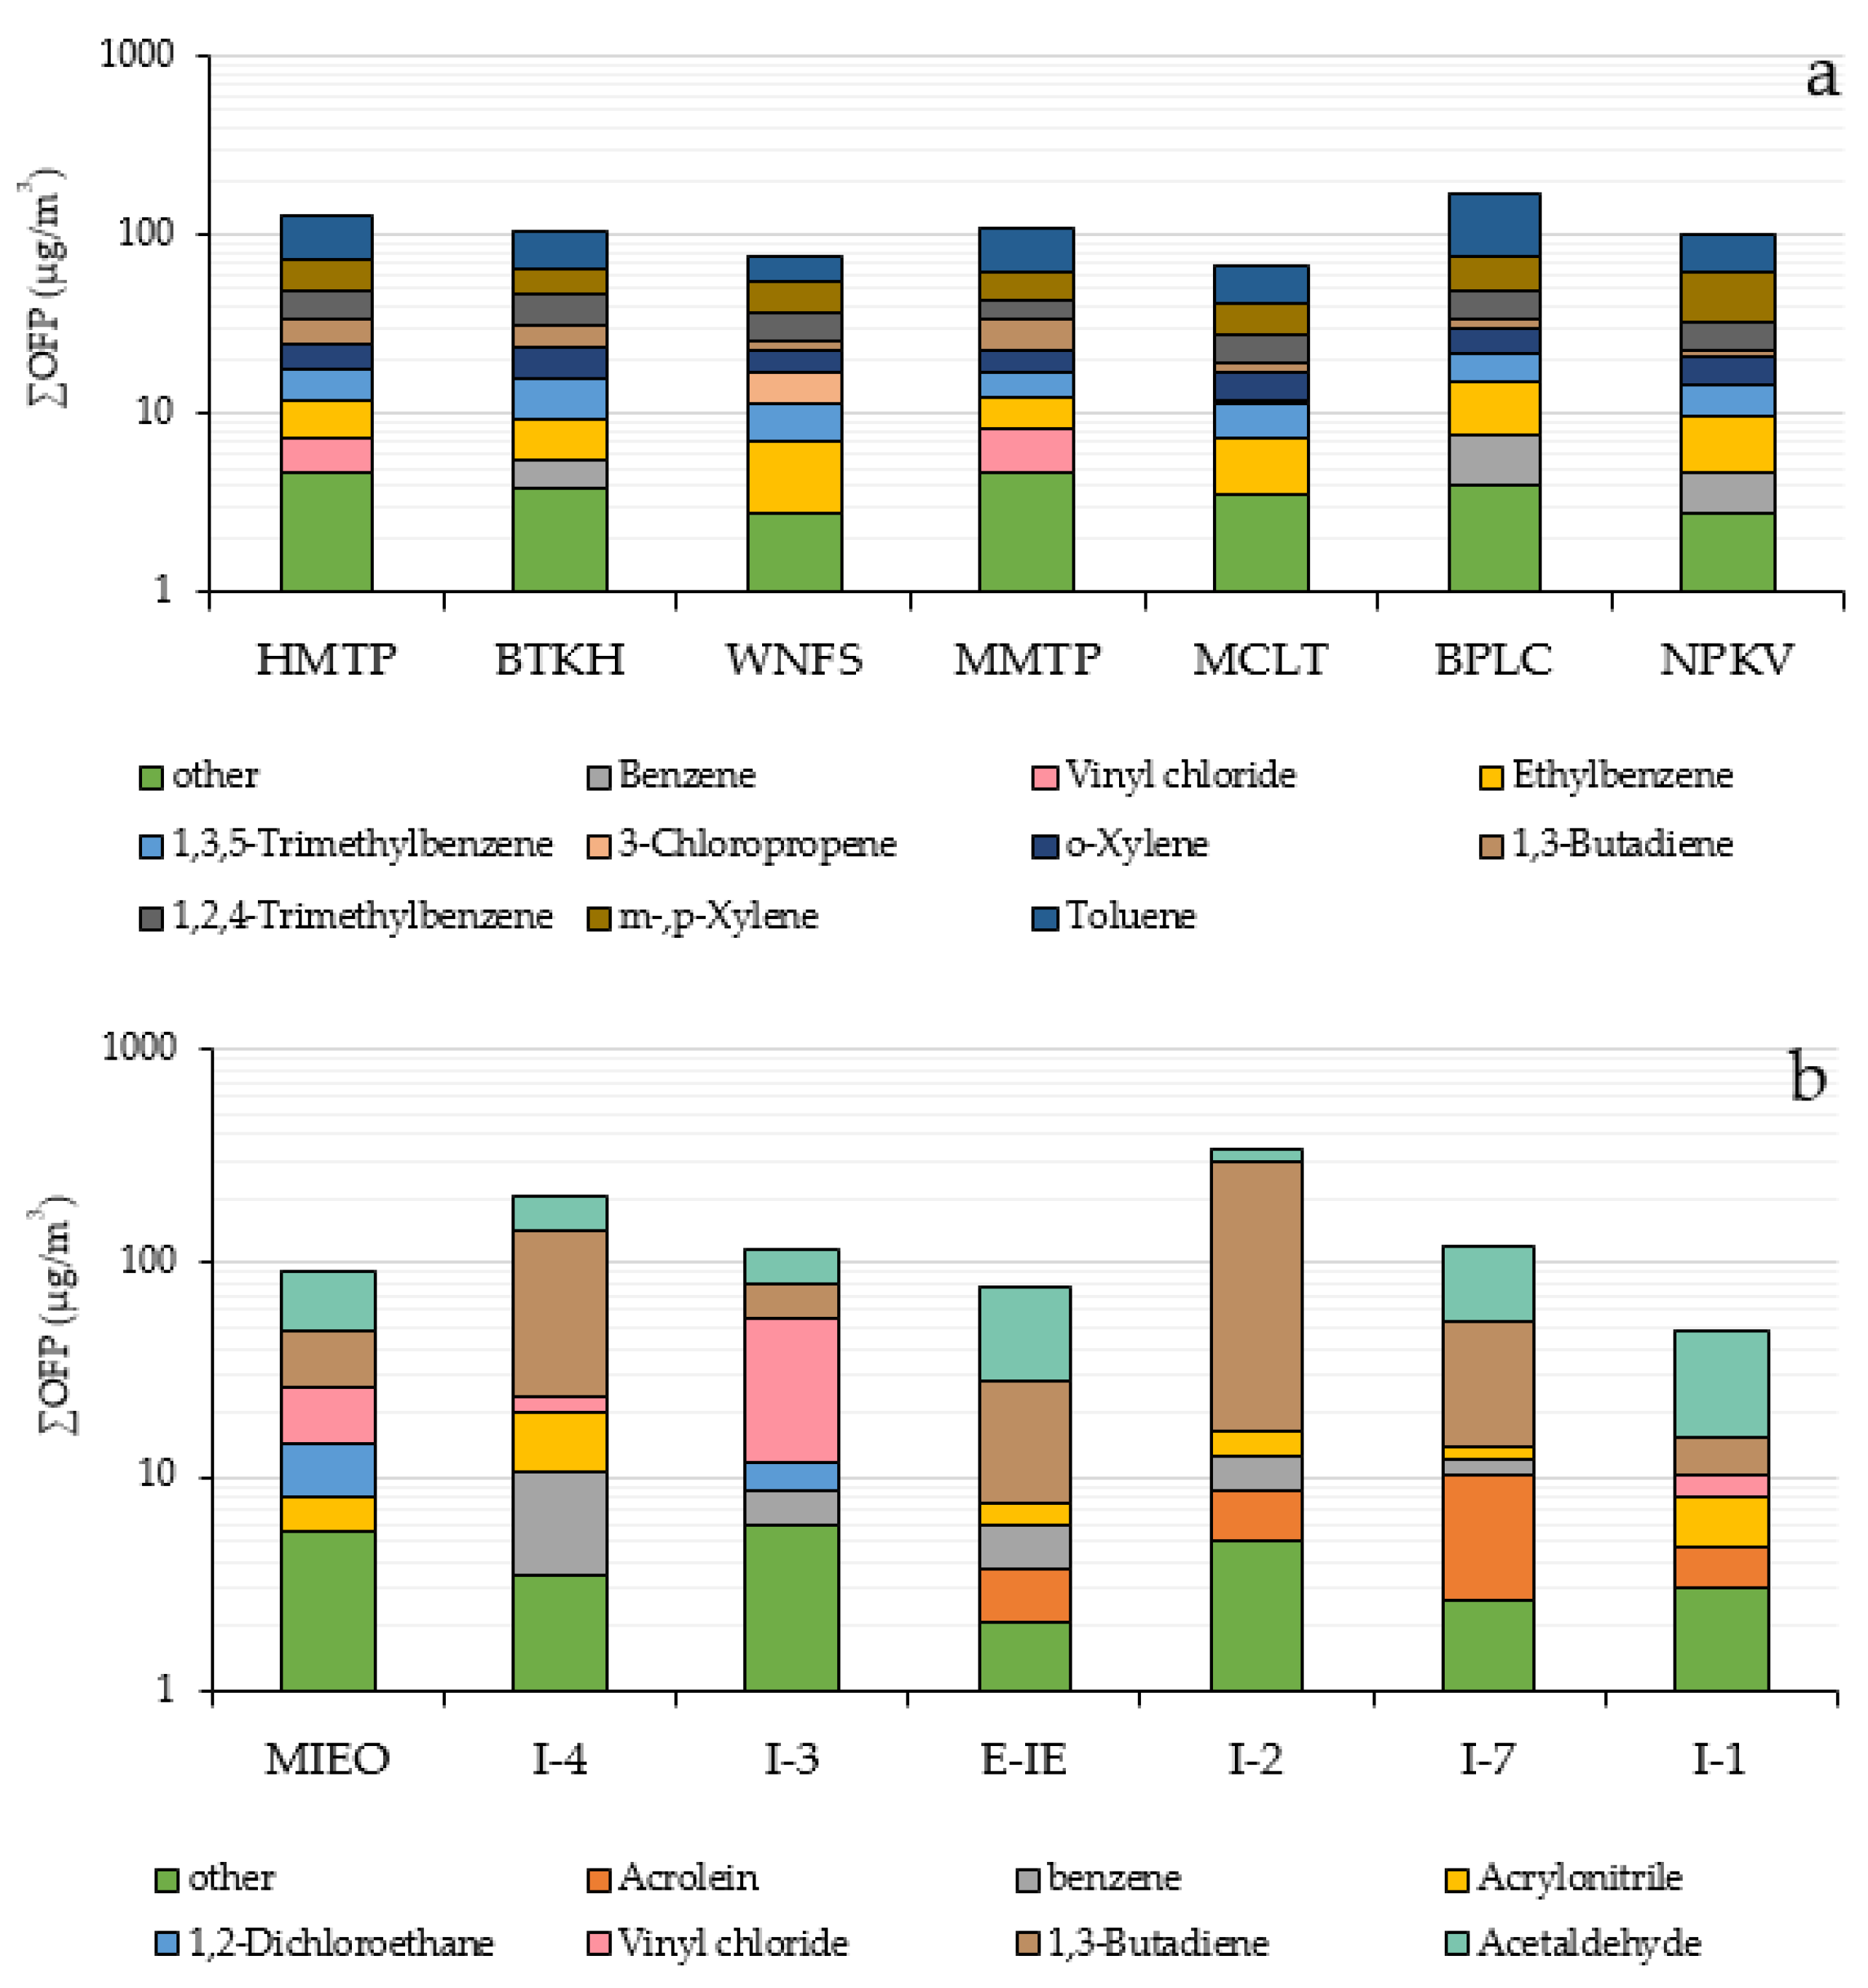
Analytical results from the OFPs of ambient VOCs through the MIR method at each monitoring station in the community areas is illustrated in Figure 3a. The total concentrations of OFP were found from 67.6–173.3 µg/m3. Aromatic hydrocarbons greatly contributed to OFP concentration (62.9–166.4 µg/m3) followed by alkenes (1.6–11.6 µg/m3) and halogenated hydrocarbon (2.2–6.5 µg/m3). Halogenated hydrocarbons had the lowest OFP content due to their strong chemical bonds between carbon and halogen atoms creating less reactivity. Toluene was the major contributor to OFP concentrations at every station (22.1–98.4 µg/m3) accounting for about 28.9–56.8% of total OFP, due to its high concentration and high reactivity, followed by m-,p-xylene (14.4–28.6 µg/m3), representing 14.6–28.3% of the VOCs mixing ratio. This result was similar to that of other studies reporting that these VOCs species were the main contributors to ozone formation in urban areas. [14,59,60,61]. The top 5 VOC species identified by the MIR method representing from 80.6–89.2% of total OFP in the community areas were toluene, m,p-xylene, o-xylene, 1,2,4-trimethylbenzene, 1,3,5-trimethylbenzene, ethylbenzene, 1,3-butadiene, and 3-chloropropene. OFP of ambient VOCs in each monitoring station in community areas is shown in Figure 5a.
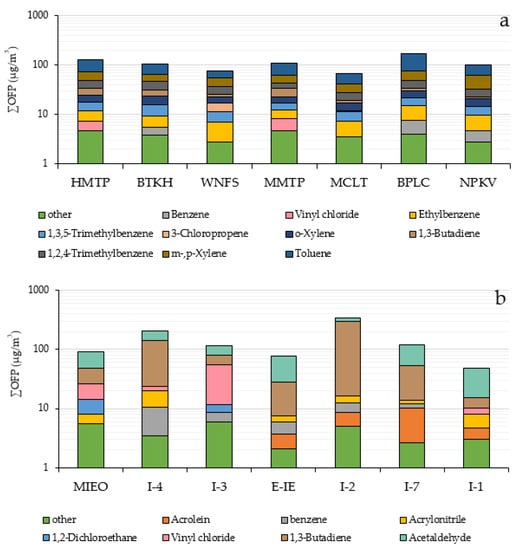
Figure 5.
Ozone formation potential of ambient VOCs in each monitoring station in community areas (a) and within industrial areas (b).
Within the industrial areas, the result indicated that total OFP ranged from 48.0–340.6 µg/m3. The OFP of alkene, aromatic hydrocarbon, halogenated hydrocarbons, aldehydes and other compounds totaled 5.34–119.1, 1.47–7.19, 2.7–48.4, 34.2–74.2, and 1.09–1.83 µg/m3, respectively. The top 5 VOCs species contributing about 93.6–98.5% of total OFP within the industrial areas were acetaldehyde, 1,3-butadiene, vinyl chloride, 1,2-dichloroethane, acrylonitrile, benzene and acrolein. Aldehydes and alkene play an important role in forming ground-level ozone. Acetaldehyde and 1,3-butadiene were the major species contributing to OFP, accounting for 13.4–67.9% and 11.1–81.8% of total OFP, respectively. Different VOCs species exhibit different photochemical reactivity, for example, acetaldehyde has higher photochemical reactivity than 1,3-butadiene. However, at some stations, 1,3 butadiene showed a high potential for ozone production because of its high concentration. The OFPs of ambient VOCs calculated using the MIR method at each monitoring station within the industrial areas is illustrated in Figure 5b.
Results clearly revealed that concentrations of ozone precursors and the calculated OFP within industrial areas were higher than those in residential areas. At the community areas, levels of OFP were above the guidelines (>100 ug/m3) at HMTP, BTKH, MMTP and BPLC stations with concentrations of 123.23, 103.18, 105.87, and 165.68 µg/m3, respectively. Higher concentrations were observed within the industrial areas at stations I-4 (202.0 µg/m3), I-3 (116.6 µg/m3), I-2 (340.6 µg/m3), and I-7 (119.7 µg/m3). Total OFP concentration in this study was lower than those analyzed in Bangkok [62,63]. Table 3 shows the proportion of each VOC to the OFP concentration species measured in this study as compared with other cities.

Table 3.
Ozone formation potential in this study compared with other studies.
3.3.2. Propylene Equivalent Concentration
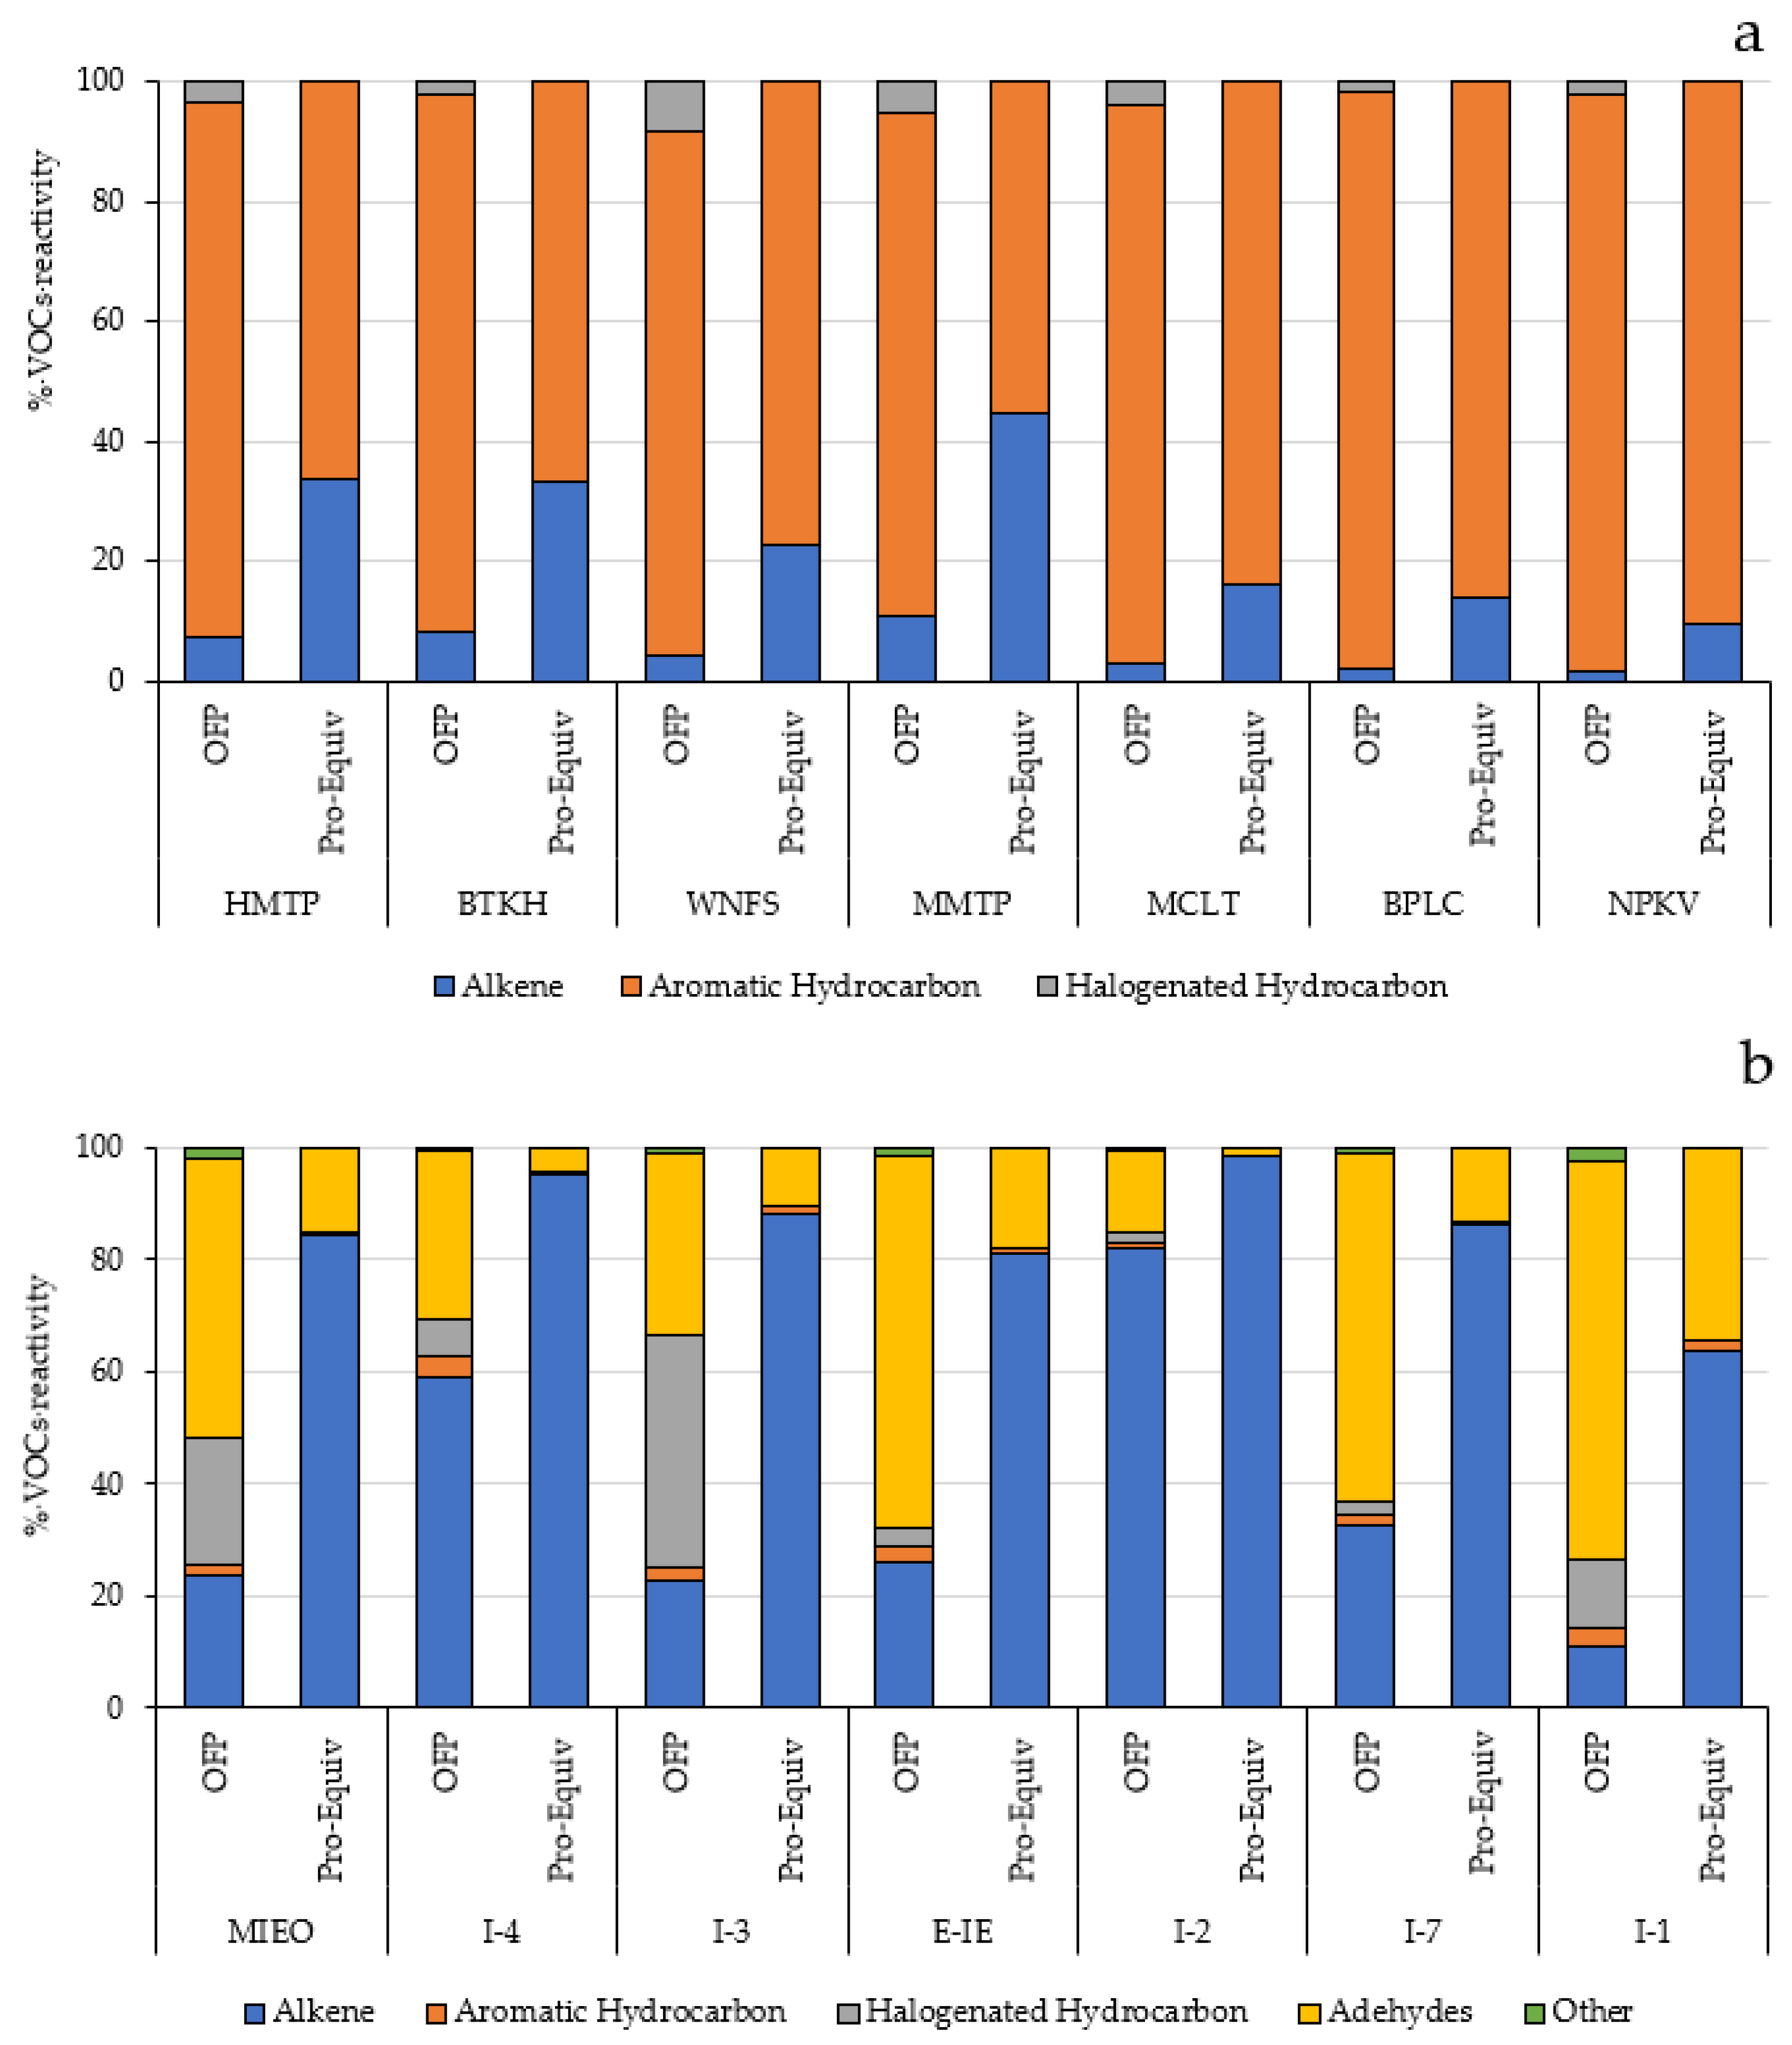
Based on the propy-equiv method, the aromatic hydrocarbons constituted the major contributor to ozone formation in the community areas. The top 5 contributors obtained from this method representing about 79.7–89.1% of the total propy-equiv concentration were toluene, m-,p-xylene, 1,2,4-trimethylbenzene, 1,3,5-trimethylbenzene, 1,3-butadiene, and styrene. Within the industrial areas, the propyl-equiv concentration was mostly contributed from alkenes and aldehydes. These results were generally consistent with the results analyzed based on the MIR method. The percentage of VOC reactivity based on MIR and propy-equiv methods in community (a) and within industrial areas (b) is presented in Figure 6.
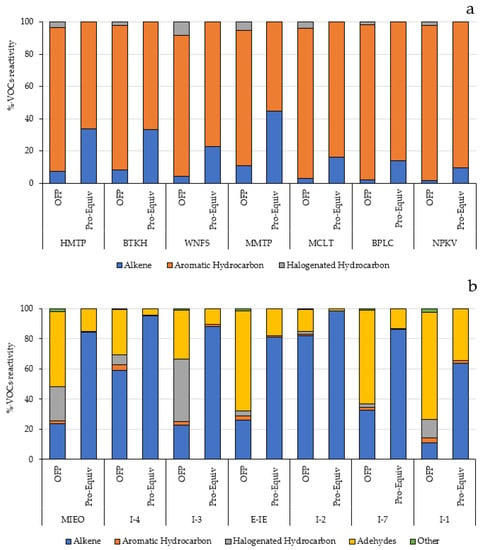
Figure 6.
Percentage of VOC reactivity based on MIR and propy-equiv methods in community (a) and within industrial areas (b).
The results of this study revealed that aromatic hydrocarbons, aldehydes, and alkenes are the dominant contributor to the formation of ozone in this industrial area. These VOC groups were generally originated from anthropogenic emissions, and especially, traffic emissions and the industrial sources. It highlighted that these emission sources should be given priority in managing and controlling to achieve the effectiveness in the development of regional O3 control strategies. Results from this study also elucidated the important of controlling VOCs by not only consider their direct health impact but also on their potential in forming of the secondary air pollutant such as O3 which will greatly support the establishment of appropriate emission controls and mitigation measures for effective management of industrial air pollution.
4. Conclusions
The ambient VOCs concentrations, intensively measured over five years from 14 air monitoring stations in community and industrial areas of the Map Ta Phut industrial town, Thailand were evaluated for their characteristics and chemical reactivity as precursors to forming secondary air pollutants. The OFP of ambient VOCs was comprehensively analyzed based on the MIR and the propy-equiv concentration methods. In community areas, the OFP mainly contributed from the formation of ambient aromatic hydrocarbon. The source apportionment analysis identified that these compounds were mainly emitted from mobile sources and the industrial processes. Within industrial areas, high halogenated hydrocarbons were measured. However, alkene was the highest contributor to OFP concentration due to its high secondary ozone formation reactivity. Analytical results from the MIR and the propy-equiv method were generally consistent with each other. This study assisted in revealing the potential risk of VOCs by considering their direct health effect and their indirect impact as the precursors of secondary air pollutant. It identified the major and potential emission sources of VOCs which should be given a priority in controlling. Methods and analytical procedures as well as results presented in this study could be useful for the scientific community to prepare technical information to advocate policy makers in setting up the appropriate mitigation measures to manage VOCs and ozone pollution, effectively.
Supplementary Materials
The following are available online at https://www.mdpi.com/article/10.3390/atmos13050732/s1, Table S1: The lists of VOC species measured in the community and within the industrial areas, Figure S1: T/B/E ratio at the BTKH, WNFS, MMTP, MCLT, BPLT, NPV monitoring stations.
Author Contributions
Writing the original draft, N.P.; writing the review & editing, S.T.; V.K. and J.K. has read and agreed to the published version of the manuscript. All authors have read and agreed to the published version of the manuscript.
Funding
This research was funded by the Thailand Research Fund through the Royal Golden Jubilee Ph.D. program, grant number PHD/0066/2558.
Institutional Review Board Statement
Not applicable.
Informed Consent Statement
Not applicable.
Data Availability Statement
Not applicable.
Acknowledgments
The authors would like to thank the Pollution Control Department (PCD) and the Industrial Estate Authority of Thailand (IEAT) in providing VOC monitoring data for this work. Financial support from the Thailand Research Fund through the Royal Golden Jubilee Ph.D. Program (Grant No. PHD/0066/2558) to Nattaporn Pinthong and Sarawut Thepanondh is acknowledged. This study was supported for publication by the Faculty of Public Health, Mahidol University, Thailand.
Conflicts of Interest
The authors declare they have no conflict of interest.
References
- Bozkurt, Z.; Üzmez, Ö.Ö.; Döğeroğlu, T.; Artun, G.; Gaga, E.O. Atmospheric concentrations of SO2, NO2, ozone and VOCs in Düzce, Turkey using passive air samplers: Sources, spatial and seasonal variations and health risk estimation. Atmos. Pollut. Res. 2018, 9, 1146–1156. [Google Scholar] [CrossRef]
- Alfoldy, B.; Mahfouz, M.M.K.; Yigiterhan, O.; Safi, M.A.; Elnaiem, A.E.; Giamberini, S. BTEX, nitrogen oxides, ammonia and ozone concentrations at traffic influenced and background urban sites in an arid environment. Atmos. Pollut. Res. 2019, 10, 445–454. [Google Scholar] [CrossRef]
- Baghani, A.N.; Sorooshian, A.; Heydari, M.; Sheikhi, R.; Golbaz, S.; Ashournejad, Q.; Kermani, M.; Golkhorshidi, F.; Bar-khordari, A.; Jafari, A.J.; et al. A case study of BTEX characteristics and health effects by major point sources of pollution during winter in Iran. Environ. Pollut. 2019, 247, 607–617. [Google Scholar] [CrossRef]
- Saeaw, N.; Thepanondh, S. Source apportionment analysis of airborne VOCs using positive matrix factorization in industrial and urban areas in Thailand. Atmos. Pollut. Res. 2015, 6, 644–650. [Google Scholar] [CrossRef] [Green Version]
- Sharma, S.; Khare, M. Simulating ozone concentrations using precursor emission inventories in Delhi—National Capital Region of India. Atmos. Environ. 2017, 151, 117–132. [Google Scholar] [CrossRef]
- Kim, S.; Kim, T.-Y.; Yi, S.-M.; Heo, J. Source apportionment of PM2.5 using positive matrix factorization (PMF) at a rural site in Korea. J. Environ. Manag. 2018, 214, 325–334. [Google Scholar] [CrossRef]
- Sun, J.; Shen, Z.; Zhang, Y.; Zhang, Z.; Zhang, Q.; Zhang, T.; Niu, X.; Huang, Y.; Cui, L.; Xu, H.; et al. Urban VOC profiles, possible sources, and its role in ozone formation for a summer campaign over Xi’an, China. Environ. Sci. Pollut. Res. 2019, 26, 27769–27782. [Google Scholar] [CrossRef]
- Zhang, J.F.; Wei, Y.J.; Fang, Z.F. Ozone pollution: A major health hazard worldwide. Front. Immunol. 2019, 10, 2518. [Google Scholar] [CrossRef] [Green Version]
- Ebi, K.L.; McGregor, G. Climate change, tropospheric ozone and particulate matter, and health impacts. Environ. Health Per-spect. 2008, 116, 1449–1455. [Google Scholar] [CrossRef]
- Juráň, S.; Grace, J.; Urban, O. Temporal Changes in Ozone Concentrations and Their Impact on Vegetation. Atmosphere 2021, 12, 82. [Google Scholar] [CrossRef]
- Hong, C.; Mueller, N.D.; Burney, J.A.; Zhang, Y.; AghaKouchak, A.; Moore, F.C.; Tong, D.; Davis, S.J. Impacts of ozone and climate change on yields of perennial crops in California. Nat. Food 2020, 1, 166–172. [Google Scholar] [CrossRef]
- Agyei, T.; Juráň, S.; Edwards-Jonášová, M.; Fischer, M.; Švik, M.; Komínková, K.; Ofori-Amanfo, K.K.; Marek, M.V.; Grace, J.; Urban, O. The Influence of Ozone on Net Ecosystem Production of a Ryegrass—Clover Mixture under Field Conditions. Atmosphere 2021, 12, 1629. [Google Scholar] [CrossRef]
- Chen, S.; Wang, H.; Lu, K.; Zeng, L.; Hu, M.; Zhang, Y. The trend of surface ozone in Beijing from 2013 to 2019: Indications of the persisting strong atmospheric oxidation capacity. Atmos. Environ. 2020, 242, 117801. [Google Scholar] [CrossRef]
- Bauri, N.; Bauri, P.; Kumar, K.; Jain, V.K. Evaluation of seasonal variations in abundance of BTXE hydrocarbons and their ozone forming potential in ambient urban atmosphere of Dehradun (India). Air Qual. Atmos. Health 2016, 9, 95–106. [Google Scholar] [CrossRef]
- Mozaffar, A.; Zhang, Y.; Fan, M.; Cao, F.; Lin, Y.-C. Characteristics of summertime ambient VOCs and their contributions to O3 and SOA formation in a suburban area of Nanjing, China. Atmos. Res. 2020, 240, 104923. [Google Scholar] [CrossRef]
- Yang, H.H.; Gupta, S.K.; Dhital, N.B.; Wang, L.C.; Elumalai, S.P. Comparative investigation of coal- and oil-fired boilers based on emission factors, ozone and secondary organic aerosol formation potentials of VOCs. J. Environ. Sci. 2020, 92, 245–255. [Google Scholar] [CrossRef]
- Chen, P.; Zhao, X.; Wang, O.; Shao, M.; Xiao, X.; Wang, S.; Wang, Q.G. Characteristics of VOCs and their Potentials for O3 and SOA Formation in a Medium-sized City in Eastern China. Aerosol Air Qual. Res. 2022, 22, 210239. [Google Scholar] [CrossRef]
- Bari, M.A.; Kindzierski, W.B. Ambient volatile organic compounds (VOCs) in Calgary, Alberta: Sources and screening health risk assessment. Sci. Total Environ. 2018, 631–632, 627–640. [Google Scholar] [CrossRef] [Green Version]
- Xiong, Y.; Bari, M.A.; Xing, Z.; Du, K. Ambient volatile organic compounds (VOCs) in two coastal cities in western Canada: Spatiotemporal variation, source apportionment, and health risk assessment. Sci. Total Environ. 2020, 706, 135970. [Google Scholar] [CrossRef]
- Widiana, D.R.; Wang, Y.C.; You, S.J.; Wang, Y.F. Source apportionment and health risk assessment of ambient volatile organic compounds in primary schools in Northern Taiwan. Int. J. Environ. Sci. Technol. 2019, 16, 6175–6188. [Google Scholar] [CrossRef]
- Dumanoglu, Y.; Kara, M.; Altiok, H.; Odabasi, M.; Elbir, T.; Bayram, A. Spatial and seasonal variation and source appor-tionment of volatile organic compounds (VOCs) in a heavily industrialized region. Atmos. Environ. 2014, 98, 168–178. [Google Scholar] [CrossRef]
- Wu, F.; Yu, Y.; Sun, J.; Zhang, J.; Wang, J.; Tang, G.; Wang, Y. Characteristics, source apportionment and reactivity of ambient volatile organic compounds at Dinghu Mountain in Guangdong Province, China. Sci. Total Environ. 2016, 548–549, 347–359. [Google Scholar] [CrossRef]
- Zhang, Y.; Li, R.; Fu, H.; Zhou, D.; Chen, J. Observation and analysis of atmospheric volatile organic compounds in a typical petrochemical area in Yangtze River Delta, China. J. Environ. Sci. 2018, 71, 233–248. [Google Scholar] [CrossRef]
- Zhang, X.; Yin, Y.; Wen, J.; Huang, S.; Han, D.; Chen, X.; Cheng, J. Characteristics, reactivity and source apportionment of ambient volatile organic compounds (VOCs) in a typical tourist city. Atmos. Environ. 2019, 215, 116898. [Google Scholar] [CrossRef]
- Ding, Y.; Lu, J.; Liu, Z.; Li, W.; Chen, J. Volatile organic compounds in Shihezi, China, during the heating season: Pollution characteristics, source apportionment, and health risk assessment. Environ. Sci. Pollut. Res. Int. 2020, 27, 16439–16450. [Google Scholar] [CrossRef]
- Gong, Y.; Wei, Y.; Cheng, J.; Jiang, T.; Chen, L.; Xu, B. Health risk assessment and personal exposure to Volatile Organic Compounds (VOCs) in metro carriages—A case study in Shanghai, China. Sci. Total Environ. 2017, 574, 1432–1438. [Google Scholar] [CrossRef]
- Hajizadeh, Y.; Mokhtari, M.; Faraji, M.; Mohammadi, A.; Nemati, S.; Ghanbari, R.; Abdolahnejad, A.; Fard, R.F.; Nikoonahad, A.; Jafari, N.; et al. Trends of BTEX in the central urban area of Iran: A preliminary study of photochemical ozone pollution and health risk assessment. Atmos. Pollut. Res. 2017, 9, 220–229. [Google Scholar] [CrossRef]
- Wang, H.; Xue, S.; Hao, R.; Fang, L.; Nie, L. Emission Characteristics and Ozone Formation Potential Assessment of VOCs from Typical Metal Packaging Plants. Atmosphere 2022, 13, 57. [Google Scholar] [CrossRef]
- Rajabi, H.; Mosleh, M.H.; Mandal, P.; Lea-Langton, A.; Sedighi, M. Emissions of volatile organic compounds from crude oil processing—Global emission inventory and environmental release. Sci. Total Environ. 2020, 727, 138654. [Google Scholar] [CrossRef] [Green Version]
- Li, A.J.; Pal, V.K.; Kannan, K. A review of environmental occurrence, toxicity, biotransformation and biomonitoring of volatile organic compounds. J. Environ. Chem. Ecotoxicol. 2021, 3, 91–116. [Google Scholar] [CrossRef]
- Wang, M.; Qin, W.; Chen, W.; Zhang, L.; Zhang, Y.; Zhang, X.; Xie, X. Seasonal variability of VOCs in Nanjing, Yangtze River delta: Implications for emission sources and photochemistry. Atmos. Environ. 2020, 223, 117254. [Google Scholar] [CrossRef]
- Kumar, A.; Singh, D.; Kumar, K.; Singh, B.B.; Jain, V.K. Distribution of VOCs in urban and rural atmospheres of subtropical India: Temporal variation, source attribution, ratios, OFP and risk assessment. Sci. Total Environ. 2018, 613–614, 492–501. [Google Scholar] [CrossRef]
- Bari, M.A.; Kindzierski, W.B. Concentrations, sources and human health risk of inhalation exposure to air toxics in Edmonton, Canada. Chemosphere 2017, 173, 160–171. [Google Scholar] [CrossRef]
- Dai, H.; Jing, S.; Wang, H.; Ma, Y.; Li, L.; Song, W.; Kan, H. VOC characteristics and inhalation health risks in newly renovated residences in Shanghai, China. Sci. Total Environ. 2017, 577, 73–83. [Google Scholar] [CrossRef]
- Garg, A.; Gupta, N.C. A comprehensive study on spatio-temporal distribution, health risk assessment and ozone formation potential of BTEX emissions in ambient air of Delhi, India. Sci. Total Environ. 2019, 659, 1090–1099. [Google Scholar] [CrossRef]
- Jia, C.; Mao, X.; Huang, T.; Liang, X.; Wang, Y.; Shen, Y.; Jiang, W.; Wang, H.; Bai, Z.; Ma, M.; et al. Non-methane hydrocarbons (NMHCs) and their contribution to ozone formation potential in a petrochemical industrialized city, Northwest China. Atmos. Res. 2016, 169, 225–236. [Google Scholar] [CrossRef]
- Zhang, T.; Xiao, S.; Wang, X.; Zhang, Y.; Pei, C.; Chen, D.; Jiang, M.; Liao, T. Volatile Organic Compounds Monitored Online at Three Photochemical Assessment Monitoring Stations in the Pearl River Delta (PRD) Region during Summer 2016: Sources and Emission Areas. Atmosphere 2021, 12, 327. [Google Scholar] [CrossRef]
- Gao, Y.; Li, M.; Wan, X.; Zhao, X.; Wu, Y.; Liu, X.; Li, X. Important contributions of alkenes and aromatics to VOCs emissions, chemistry and secondary pollutants formation at an industrial site of central eastern China. Atmos. Environ. 2021, 244, 117927. [Google Scholar] [CrossRef]
- Wang, G.; Cheng, S.; Wei, W.; Zhou, Y.; Yao, S.; Zhang, H. Characteristics and source apportionment of VOCs in the suburban area of Beijing, China. Atmos. Pollut. Res. 2016, 7, 711–724. [Google Scholar] [CrossRef] [Green Version]
- Zou, Y.; Deng, X.; Zhu, D.; Gong, D.; Wang, H.; Li, F.; Tan, H.; Deng, T.; Mai, B.; Liu, X.; et al. Characteristics of 1 year of observational data of VOCs, NOx and O3 at a suburban site in Guangzhou, China. Atmos. Chem. Phys. 2015, 15, 6625–6636. [Google Scholar] [CrossRef] [Green Version]
- Carter, W.P.L. Development of Ozone Reactivity Scales for Volatile Organic Compounds. J. Air Waste Manag. Assoc. 1994, 44, 881–899. [Google Scholar] [CrossRef] [Green Version]
- Chameides, W.L.; Fehsenfeld, F.; Rodgers, M.O.; Cardelino, C.; Martinez, J.; Parrish, D.; Lonneman, W.; Lawson, D.R.; Ras-mussen, R.A.; Zimmerman, P.; et al. Ozone precursor relationships in the ambient atmosphere. J. Geophys. Res. 1992, 97, 6037–6055. [Google Scholar] [CrossRef]
- Pollution Control Department. Thailand State of Pollution Report 2018. 2018. Available online: https://www.pcd.go.th/publication/3657/ (accessed on 20 October 2021).
- Kaser, L.; Peron, A.; Graus, M.; Striednig, M.; Wohlfahrt, G.; Juráň, S.; Karl, T. Interannual Variability of BVOC Emissions in an Alpine City. Atmos. Chem. Phys. Discuss. 2021, 22, 5603–5618. [Google Scholar] [CrossRef]
- Thepanondh, S.; Varoonphan, J.; Sarutichart, P.; Makkasap, T. Airborne Volatile Organic Compounds and Their Potential Health Impact on the Vicinity of Petrochemical Industrial Complex. Water Air Soil Pollut. 2011, 214, 83–92. [Google Scholar] [CrossRef]
- Saikomol, S.; Thepanondh, S.; Laowagul, W. Emission losses and dispersion of volatile organic compounds from tank farm of petroleum refinery complex. J. Environ. Health Sci. Eng. 2019, 17, 561–570. [Google Scholar] [CrossRef]
- Jindamanee, K.; Thepanondh, S.; Aggapongpisit, N.; Suktawee, S. Source apportionment analysis of volatile organic com-pounds using Positive Matrix Factorization coupled with Conditional Bivariate Probability Function in the industrial areas of Rayong, Thailand. EnvironmentAsia 2020, 13, 31–49. [Google Scholar] [CrossRef]
- Zhang, Z.; Zhang, Y.; Wang, X.; Lü, S.; Huang, Z.; Huang, X.; Yang, W.; Wang, Y.; Zhang, Q. Spatiotemporal patterns and source implications of aromatic hydrocarbons at six rural sites across China’s developed coastal regions. J. Geophys. Res. Atmos. 2016, 121, 6669–6687. [Google Scholar] [CrossRef]
- Han, T.; Ma, Z.; Xu, W.; Qiao, L.; Li, Y.; He, D.; Wang, Y. Characteristics and source implications of aromatic hydrocarbons at urban and background areas in Beijing, China. Sci. Total Environ. 2020, 707, 136083. [Google Scholar] [CrossRef]
- Huang, Y.S.; Hsieh, C.C. VOC characteristics and sources at nine photochemical assessment monitoring stations in western Taiwan. Atmos. Environ. 2020, 240, 117741. [Google Scholar] [CrossRef]
- Zhu, H.; Wang, H.; Jing, S.; Wang, Y.; Cheng, T.; Tao, S.; Lou, S.; Qiao, L.; Li, L.; Chen, J. Characteristics and sources of at-mospheric volatile organic compounds (VOCs) along the mid-lower Yangtze River in China. Atmos. Environ. 2018, 190, 232–240. [Google Scholar] [CrossRef]
- Fu, S.; Guo, M.; Luo, J.; Han, D.; Chen, X.; Jia, H.; Jin, X.; Liao, H.; Wang, X.; Fan, L.; et al. Improving VOCs control strategies based on source characteristics and chemical reactivity in a typical coastal city of South China through measurement and emission inventory. Sci. Total Environ. 2020, 744, 140825. [Google Scholar] [CrossRef] [PubMed]
- Tan, J.-H. Non-methane Hydrocarbons and Their Ozone Formation Potentials in Foshan, China. Aerosol Air Qual. Res. 2012, 12, 387–398. [Google Scholar] [CrossRef] [Green Version]
- Atkinson, R.; Arey, J. Gas-phase tropospheric chemistry of biogenic volatile organic compounds: A review. Atmos. Environ. 2003, 37, 197–219. [Google Scholar] [CrossRef]
- Hui, L.; Liu, X.; Tan, Q.; Feng, M.; An, J.; Qu, Y.; Zhang, Y.; Jiang, M. Characteristics, source apportionment and contribution of VOCs to ozone formation in Wuhan, Central China. Atmos. Environ. 2018, 192, 55–71. [Google Scholar] [CrossRef]
- Li, H.Z.; Reeder, M.D.; Pekney, N.J. Quantifying source contributions of volatile organic compounds under hydraulic fracking moratorium. Sci. Total Environ. 2020, 732, 139322. [Google Scholar] [CrossRef]
- Agency for Toxic Substances and Disease Registry (ATSDR). Toxicological Profiles. 2020. Available online: https://www.atsdr.cdc.gov/toxprofiledocs/index.html/ (accessed on 1 December 2021).
- United States Environmental Protection Agency (U.S. EPA). IRIS Assessments. 2017. Available online: https://cfpub.epa.gov/ncea/iris_drafts/AtoZ.cfm (accessed on 21 November 2021).
- Chen, C.; Wang, L.; Zhang, Y.; Zheng, S.; Tang, L. Spatial and Temporal Distribution Characteristics and Source Apportionment of VOCs in Lianyungang City in 2018. Atmosphere 2021, 12, 1598. [Google Scholar] [CrossRef]
- Li, Q.; Su, G.; Li, C.; Liu, P.; Zhao, X.; Zhang, C.; Sun, X.; Mu, Y.; Wu, M.; Wang, Q.; et al. An investigation into the role of VOCs in SOA and ozone production in Beijing, China. Sci. Total Environ. 2020, 720, 137536. [Google Scholar] [CrossRef]
- Wu, W.; Zhao, B.; Wang, S.; Hao, J. Ozone and secondary organic aerosol formation potential from anthropogenic volatile organic compounds emissions in China. J. Environ Sci. 2017, 53, 224–237. [Google Scholar] [CrossRef]
- Suthawaree, J.; Tajima, Y.; Khunchornyakong, A.; Kato, S.; Sharp, A.; Kajii, Y. Identification of volatile organic compounds in suburban Bangkok, Thailand and their potential for ozone formation. Atmos. Res. 2012, 104-105, 245–254. [Google Scholar] [CrossRef]
- Tunsaringkarn, T.; Prueksasit, T.; Morknoy, D.; Semathong, S.; Rungsiyothin, A.; Zapaung, K. Ambient air’s volatile organic compounds and potential ozone formation in urban area, Bangkok, Thailand. J. Environ. Occup. Sci. 2014, 3, 130–135. [Google Scholar] [CrossRef]
- Olumayede, E.G. Atmospheric Volatile Organic Compounds and Ozone Creation Potential in an Urban Center of Southern Nigeria. Int. J. Atmos. Sci. 2014, 2014, 764948. [Google Scholar] [CrossRef]
- Yan, Y.; Peng, L.; Li, R.; Li, Y.; Li, L.; Bai, H. Concentration, ozone formation potential and source analysis of volatile organic compounds (VOCs) in a thermal power station centralized area: A study in Shuozhou, China. Environ Pollut. 2017, 223, 295–304. [Google Scholar] [CrossRef] [PubMed]
- Tohid, L.; Sabeti, Z.; Sarbakhsh, P.; Zoroufchi Benis, K.; Shakerkhatibi, M.; Rasoulzadeh, Y.; Rahimian, R.; Darvishali, S. Spa-tiotemporal variation, ozone formation potential and health risk assessment of ambient air VOCs in an industrialized city in Iran. Atmos. Pollut. Res. 2019, 10, 556–563. [Google Scholar] [CrossRef]
Publisher’s Note: MDPI stays neutral with regard to jurisdictional claims in published maps and institutional affiliations. |
© 2022 by the authors. Licensee MDPI, Basel, Switzerland. This article is an open access article distributed under the terms and conditions of the Creative Commons Attribution (CC BY) license (https://creativecommons.org/licenses/by/4.0/).

