Review

Comparison of Wildfire Meteorology and Climate at the Adriatic Coast and Southeast Australia

by
Ivana Čavlina Tomašević
1,2,
Kevin K. W. Cheung
3,*,
Višnjica Vučetić
1 and
Paul Fox-Hughes
4
1
Croatian Meteorological and Hydrological Service, 10000 Zagreb, Croatia
2
School of Natural Sciences, Faculty of Science and Engineering, Macquarie University, North Ryde, NSW 2109, Australia
3
E3-Complexity Consultant, Eastwood, NSW 2122, Australia
4
Bureau of Meteorology, Hobart, TAS 7001, Australia
*
Author to whom correspondence should be addressed.
Atmosphere 2022, 13(5), 755; https://doi.org/10.3390/atmos13050755
Submission received: 27 March 2022 / Revised: 1 May 2022 / Accepted: 4 May 2022 / Published: 7 May 2022
(This article belongs to the Section Climatology)

Abstract

:
Wildfire is one of the most complex natural hazards. Its origin is a combination of anthropogenic factors, urban development and weather plus climate factors. In particular, weather and climate factors possess many spatiotemporal scales and various degrees of predictability. Due to the complex synergy of the human and natural factors behind the events, every wildfire is unique. However, there are indeed common meteorological and climate factors leading to the high fire risk before certain ignition mechanismfigures occur. From a scientific point of view, a better understanding of the meteorological and climate drivers of wildfire in every region would enable more effective seasonal to annual outlook of fire risk, and in the long term, better applications of climate projections to estimate future scenarios of wildfire. This review has performed a comparison study of two fire-prone regions: southeast Australia including Tasmania, and the Adriatic coast in Europe, especially events in Croatia. The former is well known as part of the ‘fire continent’, and major resources have been put into wildfire research and forecasting. The Adriatic coast is a region where some of the highest surface wind speeds, under strong topographic effect, have been recorded and, over the years, have coincided with wildfire ignitions. Similar synoptic background and dynamic origins of the meso-micro-scale meteorological conditions of these high wind events as well as the accompanied dryness have been identified between some of the events in the two regions. We have also reviewed how the researchers from these two regions have applied different weather indices and numerical models. The status of estimating fire potential under climate change for both regions has been evaluated. This review aims to promote a global network of information exchange to study the changing anthropogenic and natural factors we have to confront in order to mitigate and adapt the impacts and consequences from wildfire.

1. Introduction

Wildfire or bushfire is one of the costliest (e.g., [1]) natural hazards and, at the same time, brings great threat to human lives. From the point of view of compound hazard events [2], fire risk has climate drivers of high temperature, low precipitation and relative humidity (dryness), wind and lightning. Some of these drivers are common for other hazards such as drought, heat wave, wind damage and even air pollution. Thus, given a set of climate conditions (and pre-conditions, i.e., a type of hazard is favourable for the occurrence of another, see [2]), a fire-prone region may face amplified and/or complicated types of impacts. At least for some regions in the world, climate projections have already indicated elevated risk of wildfire under a warming climate [3,4,5]. However, the drivers leading to the increased fire risks in these regions are complex and vary geographically. Thus, it is crucial to understand the respective meteorological and climate drivers of wildfire, especially in the consideration of land–atmosphere interaction, in every fire-prone region. Only with such an understanding will the analysis of future fire behaviour, which consists of interacting drivers, be more insightful.
Wildfire is not solely a regional phenomenon. Using ECMWF ERA5, Vitolo et al. [6] recently generated a reanalysis product based on the Canadian Fire Weather Index (FWI). From the global distribution of the mean FWI (Figure 1a), it can be seen that fire risk basically covers all the continents except Antarctica, and especially Africa, the Mediterranean, north Asia, Australia, southwest U.S. and the southeast of South America. The drivers of fire are spatiotemporally multiscale. Temperature, precipitation and humidity certainly vary with the large-scale environment. Down to the local scale, fuel load, topography, lightning activity and local circulation determine the occurrence probability of wildfire [7]. Although a lot of these factors will be discussed in the following sections, an example of local-scale fire driver, which is downslope wind, is illustrative. Abatzoglou et al. [8] prepared a global climatology of synoptically forced downslope winds also using ERA5 reanalysis (Figure 1b). The criteria of downslope wind include thresholds imposed to three diagnostics of cross-barrier wind near mountaintop level, static stability at or above mountaintop and vertical velocity at or below mountaintop. The global distribution of frequent downslope wind (at least two out of four times in a day) in the figure shows many overlapping regions with those where FWI is high. These include western North America, southeast South America, South Africa and North Asia. The focus regions in this review, the Adriatic coast over north Mediterranean (especially Croatia) and southeast Australia including Tasmania, may not have the highest FWI among the regions mentioned above. However, additional factors such as strong downslope wind (and elevated fuel availability) can increase the fire potential enormously and explain the sometimes-deadly wildfire events in the history of these regions.
The major aim of this review is thus to discuss the common and dissimilarities of the meteorological and climate drivers for wildfire in the two focus regions. Through this comparative study, knowledge can be gained in the relationship between the regions on hazard reduction strategy, emergency operation and response and adaptation to fire risk variability under climate change. One of the motivations is that wildfire events in the Adriatic coast, despite having some of the most hazardous impacts and some of the most well-established fire management systems, have been rarely presented in the available literature before. Therefore, a focus on this region would make the global fire risk picture more complete and enable better exchange of fire hazard reduction strategy.
The structure of this paper is as follows. Section 2 first gives an overview of wildfire, its recent trends in activities and fire regimes with a global context. Section 3 is dedicated to the studies of wildfire for the Mediterranean Basin, especially those from Croatia, located on the Adriatic coast. To complete this tale of two regions, studies of southeast Australia are discussed in Section 4. Climate change will have a substantial impact on the future behaviour of wildfire, and in Section 5, we compare the approaches applied to project fire activity in the two regions and their results. This comparison between the two regions would be most beneficial to the research and operational community if the common natural drivers of wildfire and their dynamic origins, which may be of very different spatial and temporal scale, can be identified. This has been done in Section 6 as a conclusion to the review, especially in regard to different terminologies and approaches of studies applied in the two regions.

2. Global Context of Fire and Megafire

2.1. Catastrophic Wildfires

Since the turn of the 21st century, numerous catastrophic wildfires have captured public attention [9]. Apart from the record-setting size of a burnt area, some wildfires in the 21st century surprised with major infrastructure damage and human casualties. The deadliest wildfire this century in Australia, Black Saturday in 2009, killed 173 [10], although extremely high death tolls have occurred on both sides of the Atlantic. The deadly wildfire in 2018 near Athens, Greece killed 102 people in less than 3 h [11], while in the U.S., several wildfires caused 95 deaths in the same year, most of which took place in the Camp Fire over northern California [12,13]. Apart from human loss, the Camp Fire destroyed nearly 19,000 homes and other structures, marking the most expensive wildfire season in California state history [12].
Southeast Australia, including the State of New South Wales, South Australia, Victoria and Tasmania, is well-known as part of the ‘fire continent’. Prior to the 21st century, there were periodically large and deadly wildfires. Examples include the Black Thursday wildfire in 1851 that burnt quarter of the State of Victoria [14] and the fires during 1974/75 over central Australia that burnt 117 million hectares [15]. Recently, the extent of the 2019/20 fire season in Australia has been difficult to comprehend [16]. With more than 13 million hectares burnt, tragically dozens of people killed, and up to 1 billion animals dead, this fire season will long be remembered as the “Black Summer” [17]. These lethal bushfires, which is an Australian term for wildfires, generated an intense smoke that, in some places, turned day into night. Plumes not only had immediate local impact, but a longer-term global impact. Crossing international and continental boundaries smoke from those bushfires affected the air quality in places far away as New Zealand and South America (Figure 2).
Many of these catastrophic wildfires were due to the availability of highly flammable vegetation, of which the moisture and load are much under the influence of climate conditions. For example, thick forests provide massive fuel load for wildfires, such as the Croajingolong National Park in southeastern Australia [18]. One strategy in wildfire management is prescribed burning to reduce fuel loads [18,19].
In recent years, fire activity has been observed in other global regions where wildfires are least expected, for example, within the frozen Arctic Circle and Himalayas [20]. The latitude and elevation of those fires are of a great concern. Amazonia’s burning crisis in 2019 attracted worldwide media and political attention. Although wildfires within the landscapes of the Amazonia rainforest (northwestern Brazil, extending into Colombia and Peru) were a consequence of intentional deforestation and extensive agriculture, it was unusual to record an increase in number of wildfires in the absence of a strong drought [21].
Wildfires today burn more frequently in the so-called wildland–urban interface (WUI), where millions of people live, work and recreate. Although there was increased number of human-caused ignitions, wildfires within WUI, once started, make firefighting operations very demanding. Regions where this is especially pronounced include, among others, southeastern Australian, where the majority of the Australian population resides, the coastal and touristic areas of Mediterranean European countries (e.g., Italy, Slovenia, Croatia, Bosnia and Heregovina, Montenegro, Albania and Greece), where small touristic towns merge with natural and forest areas [22] and western North American (including California, Oregon, Washington State and western Canada), as depicted in Figure 1. Our ability to manage wildfires is not only limited by the increase in human population and rapid expansion of WUI; wildfires today also burn differently compared to the past.

2.2. Megafires

In the 21st century, we are already experiencing an alarming new category of wildfires—so-called ‘megafires’ [23]. The term ‘megafire’ became widespread in 2002 when the western U.S. (California) reported its worst wildfires on record and described the incidents as extraordinary and distinct from other large wildfires [24]. Since then, the term has been used to describe massive, intense wildfires in many fire-prone regions globally [25,26,27], usually larger than 10,000 ha [28]. Although extremely infrequent and rare (accounting for only 1% of the total number of fires), megafires may be responsible for more than 90% of burnt area in one fire season [29,30]. The criteria for defining a megafire may vary, and there is no single overarching definition [31]. From fire management and social perspectives, it describes a wildfire notable in scale, intensity, expense, necessary resources and human, economic or environmental impacts [26]. From the meteorological perspective, megafires are high impact wildfires characterized by enhanced dynamical coupling with the atmosphere. Megafires can generate sufficient energy to modify prevailing meteorological conditions and create their own weather—firestorms [32]. Firestorms, as a product of fire-induced interaction with the atmosphere, in severe cases may generate violent pyroconvection, or deep convective column, manifested as a special type of clouds: pyrocumulus (pyroCu) or pyrocumulonimbus clouds (pyroCb, [33]). Convective updrafts and downdrafts within a pyroCu or pyroCb can affect fire behaviour by strong and erratic changes in wind speed and direction [9,34]. Large-scale firestorms may produce pyrogenic lightning and cause additional ignitions kilometres away from the fire front [35]. In extreme cases, pyroconvection can lead to the evolution of a disastrous large fire-generated vortex (>100 m diameter) with dynamical similarities to tornadoes. Although very rare, these rotating columns of ash, smoke and flame connected to overlying pyroCb have been documented in Australia (Figure 3a) as well as cases of pyrotornadogenesis in Australia and the U.S. [36,37,38]. At least one intense fire tornado demolished the outskirts of Canberra (Australian Capital Territory, ACT) in a series of wildfires in January 2003. The Canberra Firestorm produced a fire vortex along a 20 km path with intensity equivalent to an F2 (180–240 km/h) Fujita scale tornado [39]. Since 2003, there have been several documented cases when wildfires generated catastrophic pyroCbs [40,41,42,43], including the 2017 event over the U.S. Pacific northwest with a stratospheric injection of smoke [44], and that during 2019–20 over southeast Australia, in which more than 30 pulses of pyroCb occurred [45].
Wildfires of this scale have not been reported in Croatia yet or with pyroCb confirmed; however, pyroconvection has certainly occurred (Figure 3b). There have been reports of unusually destructive, uncontrollable and wind-driven wildfires that burned overnight without evidence of slowing down, with unstoppable fire progression, widespread flaming, rapid downhill spread and reaching suburban areas that are usually considered protected from such blazes. All these phenomena were reported in 2017, the worst fire season ever in Croatia. In recent years, Croatian firefighters and firefighting aircraft often describe wildfires as too intense to fight or even approach, leaving them the only option of allowing the fire to burn until all fuel was consumed, which is not safe due to the potential for erratic changes in wind. Therefore, Croatia, as in Australia, has recorded unprecedented wildfires and wildfire behaviour, meteorologically linked to enhanced fire-atmosphere dynamics, with greater energy release, chaos and non-linear effects [33]. Regardless of their exact definition, these events call for special attention and underline the need for researchers to better understand the mechanisms causing and driving them.

2.3. Fire Weather and Fire Regime

Here, we define fire weather as those critical atmospheric conditions that enable extreme fire activity, resulting in large and destructive wildfires [47,48]. Conditions contributing to fire weather may differ between locations and at different times at one location. However, there are common conditions important for large wildfires including high surface air temperature and low relative humidity, low atmospheric stability, strong surface and upper-level wind and drought [49,50,51]. Drought is the most obvious factor coinciding with the period prior to a major wildfire. However, it is not the sole contributing factor and not in itself able to provide operational fire danger forecasting with likely fire outbreak locations, as droughts frequently affect wide areas.
Each meteorological property has its own important influence on wildfires, such as fuel moisture, air–fuel water exchange, supply of oxygen and the transport of embers causing spotting. However, these elements are just local and surface manifestations of atmospheric conditions. The whole set of factors influencing wildfires is determined by the horizontal state and vertical structure of the atmosphere, or in meteorological terms, the strength and movement of surface lows and highs and associated warm and cold fronts, all known as synoptic-scale features [52]. To date, critical fire weather synoptic patterns can be divided into two categories—those causing strong surface wind associated with low relative humidity and those particularly associated with low atmospheric stability. Occasionally, the co-occurrence of these patterns can lead to more extreme situations [47]. Moreover, mesoscale and microscale features frequently modify the local atmospheric conditions.
The spatial and temporal pattern of wildfires at certain location and over a given time period defines a fire regime. A fire regime is characterized by fire frequency, size, intensity (amount of energy released), severity (measure of fuel consumption), seasonality and type (ground, surface or crown) of wildfires within a certain spatiotemporal window [53]. These six components of fire regime are determined by key drivers that represent the resources and necessary conditions for fire activity. Climate and weather are found to be the most important natural drivers influencing fire regimes in many fire-prone regions [54,55,56,57,58].

3. Fire Weather in the Mediterranean Basin—Adriatic Coast and Croatia

3.1. Syntopic Patterns Conducive to Wildfire

Fire weather conditions in the Mediterranean Basin during summer are mostly characterized by two large semi-permanent synoptic weather systems—the Azores anticyclone to the west and the low-pressure monsoon system over the far eastern edge (the so-called Karachi depression) [59]. The Mediterranean region has a complex orography, which includes an extensive coastline backed by relatively high mountain ranges surrounding the warm Mediterranean Sea [60]. Mountain ranges around the sea act as constraining barriers to the atmospheric flows and can generate mountain-induced aerodynamical vortices or large-scale blocking. Additionally, large-scale channelling is common in the entire region [61]. Over the major peninsulas, summertime atmospheric circulation can include the formation of extensive and deep convective cells and thermal lows [62]. Other thermally driven meso-meteorological circulations with the diurnal cycle include, for example, sea and land breeze circulations. Their formation during the day, together with their relax or collapse during the night, often involves coupling and/or decoupling with the upper-level wind, resulting in a rapid change in surface wind speed and direction. Therefore, awareness of diurnal evolution of such meso-circulations and their interactions with the upper atmospheric flows is necessary for understanding the dynamics of wildfires in the Mediterranean area [59].
Summertime synoptic weather patterns related to large wildfires in this region can be loosely distinguished as the ones causing the hottest and driest conditions, and the ones causing windy conditions. Extremely warm days in Europe have been associated with atmospheric ‘blocking’ or stationary and persistent anticyclonic flow [63]. For instance, the location and strength of a North Atlantic ridge, associated with the Azores anticyclone, usually corresponds to the ‘hot and dry’ episodes and heat waves. Depending on the sub-regions in the Mediterranean, the anticyclone causes the advection of hot and dry air from continental Europe and North Africa [64], contributing to high temperature and low relative humidity. Such anticyclonic weather types contributed to the European summer heat wave in 2003. The persistent ‘blocking’ nature of the high pressure stretching from the Azores to the Norwegian Sea completely prevented the intrusion of moist and cool air from the Atlantic and the North Sea to central Europe [65]. The most severe fire weather conditions coincided with the peak of the heat wave in August 2003, which resulted in the most severe wildfires in Portugal in modern times. A devastating sequence of large wildfires burned 450,000 ha in the first two weeks of August 2003 [65]. The atmospheric circulation during those wildfires was dominated by a strong North Atlantic ridge, which was partly situated over the Iberian Peninsula. Near the surface, this ridge enhanced the anomalous advection of hot and dry air mass from northern Africa. This air mass was additionally heated and dried while crossing the central Iberian plateau before reaching wildfires in Portugal [66]. This synoptic configuration led to the highest 850 hPa temperatures on record, together with the all-time Portuguese surface temperature record (47.3 °C for maximum and 30.6 °C for minimum air temperature on 1 August 2003; [67]). Similar episodes of ‘blocking’ synoptic conditions, which promote periods of long clear sky and consequently long-term solar radiative heating and warm surface conditions, were found to correlate with severe wildfires in many other Mediterranean countries [68] including Spain [69,70,71], Italy [72], Greece [73,74] and Israel [75].
The term ‘blocking ridge’ has long been associated with severe wildfires in other mid-latitudes of the northern hemisphere. For example, various North American studies [54,55,76,77] have confirmed that upper ridges, which can last for a week or longer, tend to block or divert moisture-carrying systems to the north or south of the ridge, leaving conditions at the surface warm and dry [52]. The air within a ridge sinks and dries, and after a week or more, irrespective of the antecedent conditions, the fuels are dry enough to burn. Although fire danger increases over a period of time when a ‘blocking ridge’ sits over a certain region, and the peak of fire danger often correlates with the peak of ridge height [76], it seems that during the ridge breakdown, wildfire behaviour intensifies in terms of sudden increase in fire intensity and spread. The breakdown of a ridge usually occurs due the passage of a surface cold front and upper-level trough, which brings dry, hot and windy conditions, followed by changes in wind direction and transition to cooler, moister air and lighter winds [78]. In the Mediterranean Basin, these conditions occur when the Azores or the central European anticyclone weakens and allows Atlantic depressions to move to lower latitudes. Summertime Mediterranean cyclones are rare (e.g., [79]), but when they occur, depressions and accompanying cold fronts sweep the area from the Iberian Peninsula in the west Mediterranean to the Balkan Peninsula in the east [59]. A summer cold front passage can also leave some regions dry, or without a significant amount of rainfall that can influence vegetation moisture. As frontal systems cross the region, the wind direction changes from southerlies to northerlies, with the last stage accompanied by a significant increase in wind speed. These synoptic conditions override the regional diurnal coastal circulations, and although it seems the dry cold front passage may be the most intense summer event to influence wildfires persistence and intensity, studies on the relationship of this phenomenon to wildfires are almost non-existent in the European literature, with the only exception being Millán et al. [59].

3.2. European Wildfire Studies

Fire weather research in Europe to date has mostly consisted of two kinds of studies. One is to elaborate indices representing fire risk, and other using the concepts of synoptic climatology to study relationships between general atmospheric circulation and extreme wildfires. Many European authors (e.g., [4,11,24,59,68,74,80]), mostly of forestry or agriculture background, have been inspired by those topics. Studies of meteorological background are usually climatological studies that link burnt area, fire size and fire frequency with previously defined synoptic weather types. However, different national terms for local winds and often different nomenclature of the same synoptic weather patterns, even for circulations of similar dynamics and driving mechanisms, make the review of European fire weather knowledge base demanding and confusing (Table 1). Moreover, averaging of the synoptic circulation, even for specific case studies, and viewing the atmosphere as a steady-state phenomenon does not give a complete answer regarding the most dangerous possible mesoscale and microscale meteorological processes. There is a significant lack in the European literature of in-depth meteorological studies that use high-resolution numerical mesoscale models to establish the atmospheric dynamics impacting fire grounds within complex coastal orography around the Mediterranean Basin. Only three studies were found to use the Weather Research and Forecasting (WRF) model, two of which used a coupled version with a fire-spread model (WRF-SFIRE), to investigate the most catastrophic case of wildfire in Mediterranean that resulted in the death of 102 civilians in Eastern Attica, Greece on 23 July 2018 [11,80]. Numerical simulations revealed a range of the mesoscale atmospheric phenomena found in other regions to influence wildfires: induced orographic waves, hydraulic jumps, strong winds on lee slopes and the strong downward transport of kinetic energy.

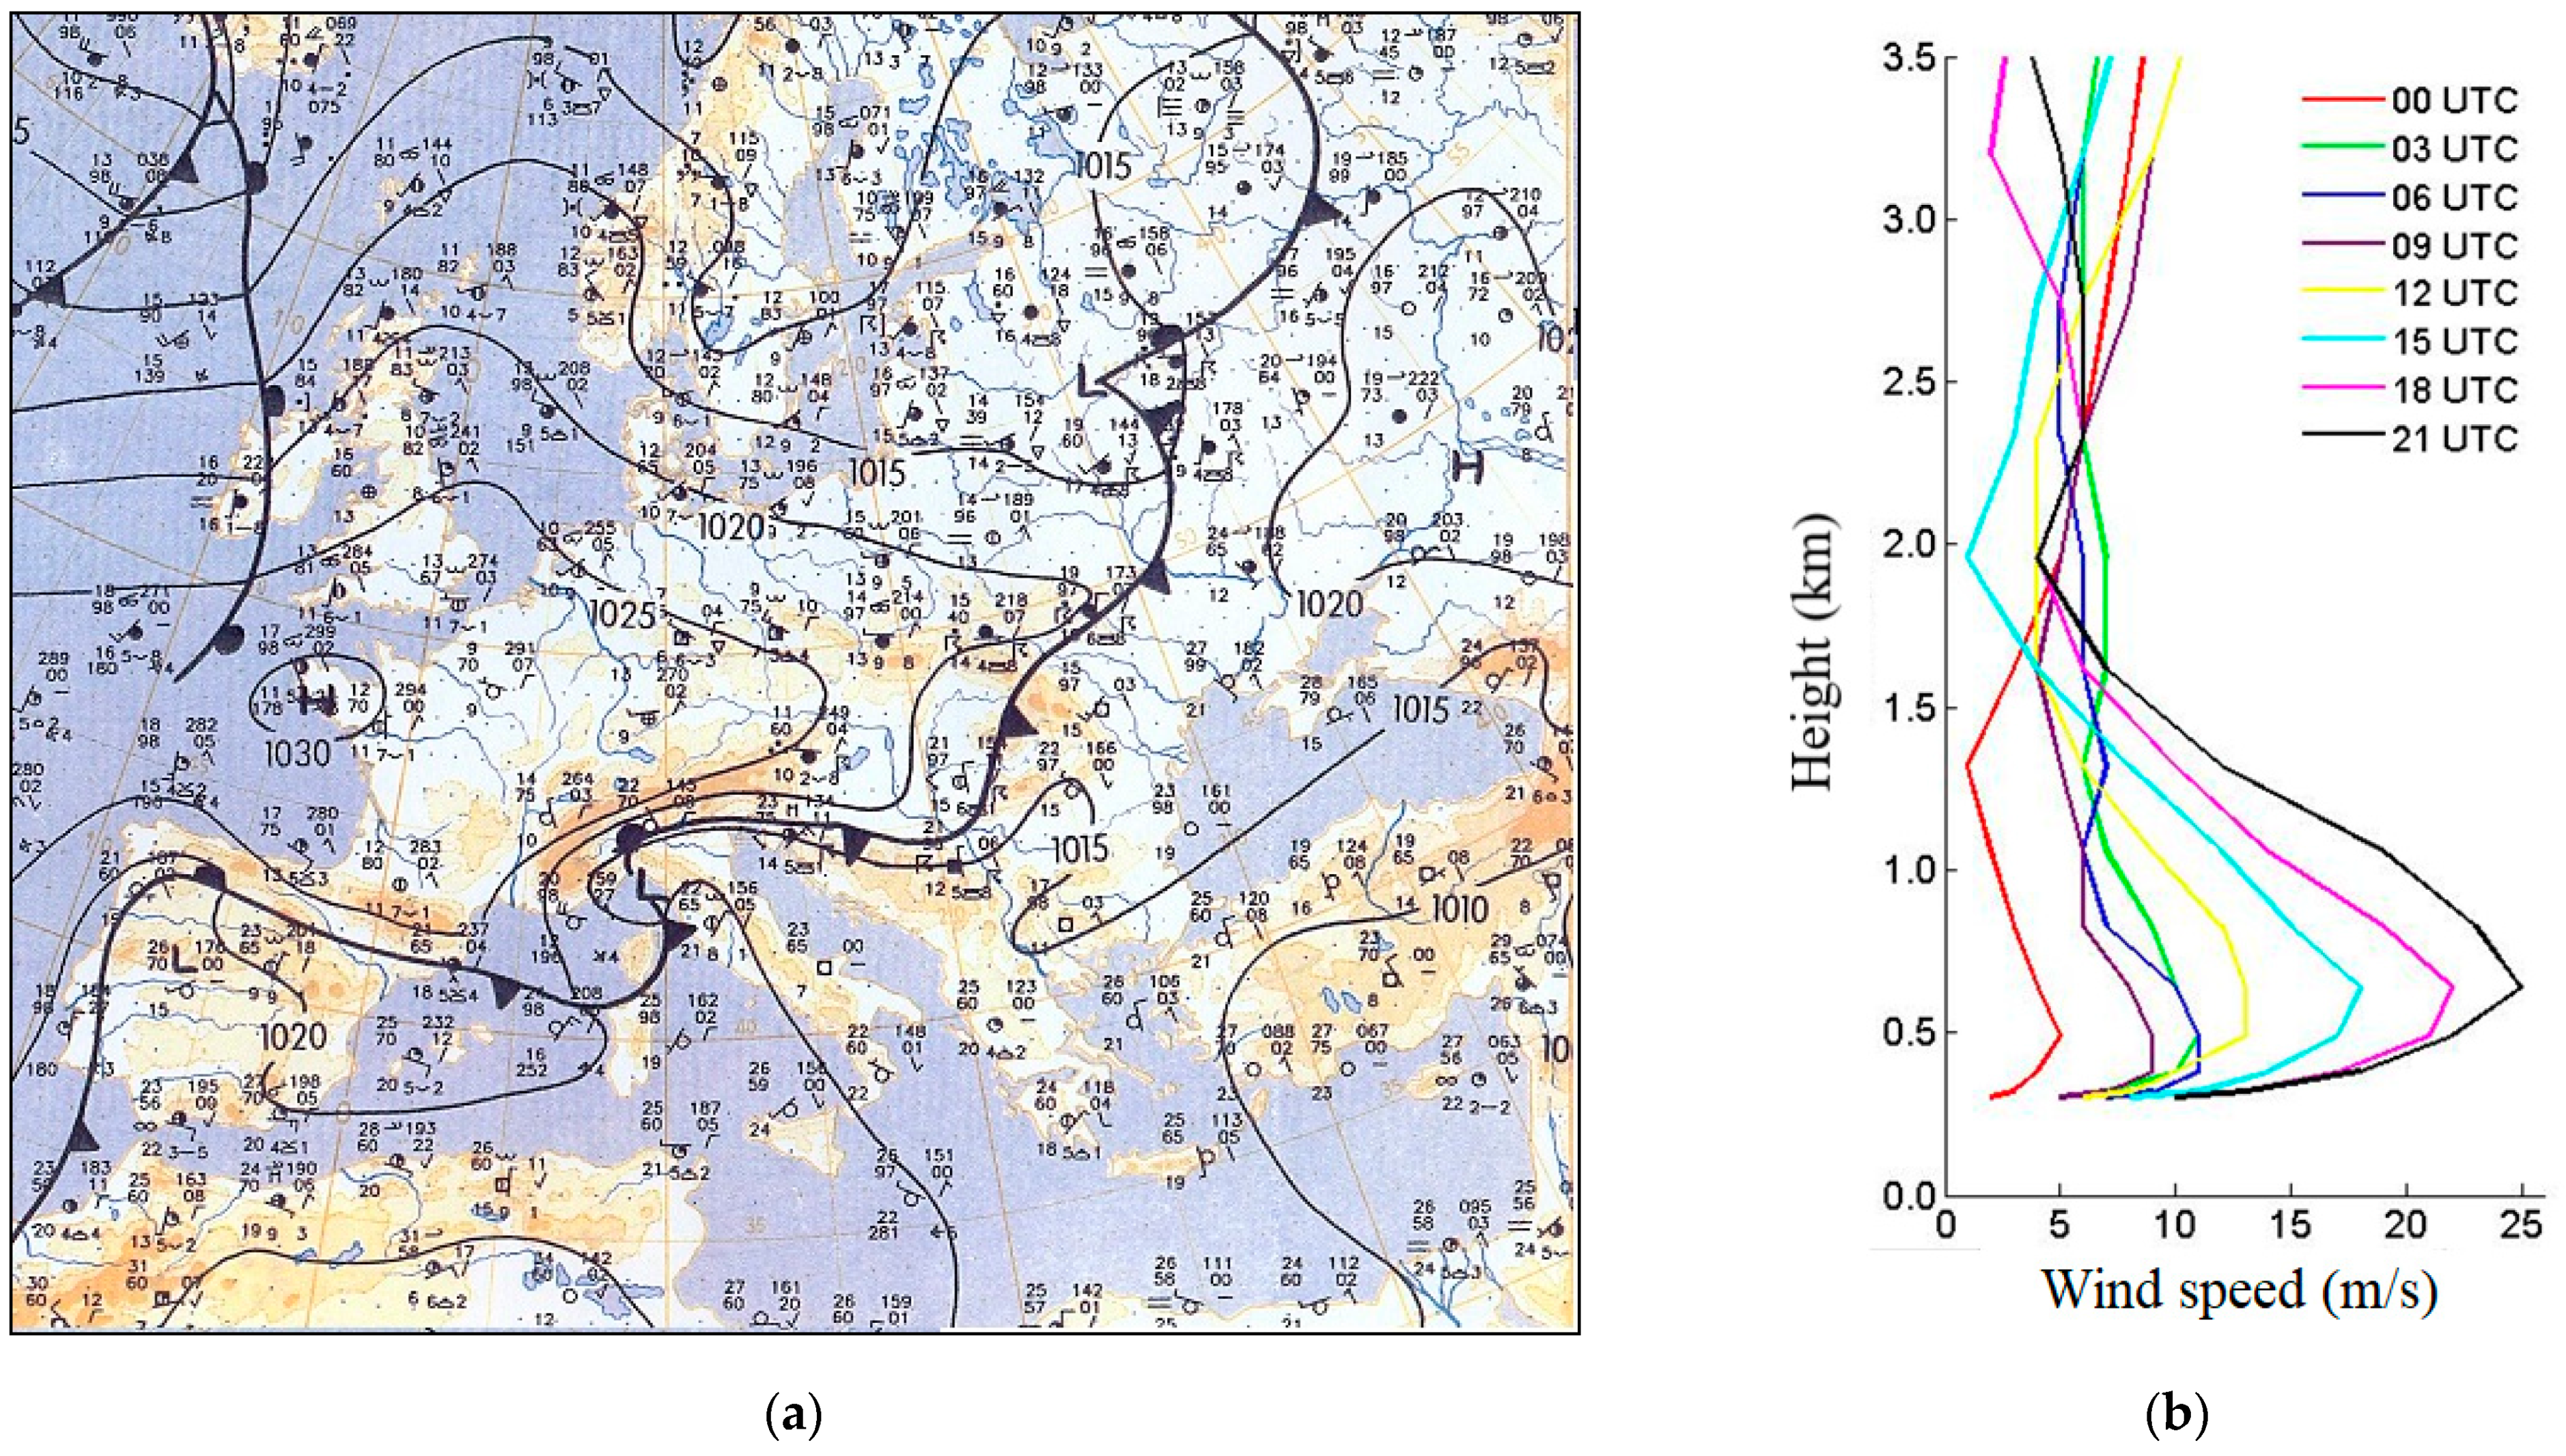
3.3. Croatian Wildfire Studies—Wind-Driven

Croatia, as a central European and Mediterranean country, is part of a region with a high fire risk, especially during the summer months when long-lasting dry spells and intense heat favour fire ignition and spread. The most at-risk area is the Adriatic Sea coastline, its surrounding hinterland and more than a thousand islands (e.g., [81]) in Croatia’s archipelago. Together with the warm and dry Mediterranean climate in the summer season, fire danger is enhanced by highly flammable vegetation, in the form of pine trees and shrubs. Each year, Croatia is affected by a large number of wildland fires. For instance, the average number of fires per year in the period 2006–2016 was 4033, with an average burnt forest area of 26,690 ha [82]. However, wildfire severity has been increasing, as illustrated by the very hazardous 2017 fire season including the Split Fire [83].
The earliest papers that analysed synoptic and mesoscale features revealed that a significant influence on fire weather conditions along the Adriatic coast in Croatia has the placement of the Azores anticyclone over Europe, especially when it displaces to the north. This allows cold fronts to sweep the area of the Adriatic, overriding local coastline circulations, changing wind direction and increasing the wind speed in the region. Such summertime cold fronts are usually dry, or bring a small amount of precipitation, insufficient for already dry vegetation or to extinguish already started wildfires. In cases of severe wildfire events on the mid-Adriatic islands in 1985 [84] and in 1990 [85], in spite of small rainfall amounts following the cold front passage and decreased fire severity rating, wildfires intensified again after having been controlled.
A similar pattern of wind-driven wildfires in Croatia repeated in the following years. For example, in the July 1997 wildfire, which coincided with a cold front passage [86], authors emphasized the important role that wind speed and direction have in severe wildfires cases along the Adriatic coast. Steep mountain ranges descending towards the Adriatic Sea result in complex topography that easily modifies the air flow in this area. Additionally, Vučetić [86] served as the first and the only attempt to date to calculate the speed of the fire front in a Croatian wildfire. The best approximation of the maximum fire spreading speed of this wildfire was 5 km h−1.
The simulated vertical wind profiles in three case studies with different synoptic background, which was based on the operational high-resolution mesoscale ALADIN (Aire Limiteé Adaptation Dynamique dévelopement InterNational) model of the METEO-France, showed a surprisingly similar atmospheric profile within 3 km above ground. In each case, a significant wind speed maximum was found between 250 and 900 m altitude [87]. In all three cases with this wind speed maximum aloft, wildfires burned out of control. In each case, however, the wind was from a different characteristic and individually named direction: SE (jugo), NE (bura) and NW (maestral). Earlier research from the U.S. defined this type of vertical wind speed profile as low-level jet (LLJ) and found it to be among the most dangerous profiles associated with wildfires. Wildfire behaviour in such events may be dominated by the wind, with probable occurrence of large whirlwinds and is potentially very dangerous for towns and villages ahead of the fire front [88].
The same kind of wind speed profile was confirmed and, for the first time, defined as an LLJ in Croatian literature, in the comprehensive meteorological study of the most tragic wildfire event in Croatian history—the Kornati fire on 30 August 2007, when 12 firefighters died, and 1 was badly injured [89]. The fatal combination of meteorological factors contributing to the tragedy on that day included the annual maximum of the fire danger rating [90], a cold front passage related to the cyclonic activity over the Adriatic Sea with accompanying 850 hPa trough affecting most of the Western Mediterranean, and on the local scale, a shallow meso-cyclone over the wildfire area, which created partly cloudy and windy weather with moderate to strong SE wind. The vertical structure of the atmosphere during the most critical wildfire hours consistently included the LLJ. The appearance of the LLJ was associated with a very strong wind shear in the atmospheric boundary layer, together with very high values of turbulent kinetic energy.
This typical synoptic pattern and vertical profile (cold front passage and LLJ) was found to occur in cases of all wildfires larger than 500 ha in the period 2001–2010 [91,92]. Due to an extension of the ridge of the Azores anticyclone over central Europe, the accompanying cold front crossed the area in a matter of hours on the night between 11 and 12 August 2001 (Figure 4a). This synoptic configuration triggers the occurrence of the cool and gusty NE bura wind along the Adriatic coast, which is a common feature during winter months. Although it is rare from June to August, studies found that when it occurs, it has a drastic influence on wildfire behaviour. Wildfires that started on the night of 11 August 2001 quickly became out of control progressively from the north to the south of the Adriatic, coinciding with increasing prefrontal winds. The strong NE bura wind was determined to have maximum wind speed of 25 m s−1 at 640 m altitude (Figure 4b). Such a strong wind was close to the largest conflagration near the city of Split. Other wildfires were scattered around the coastline and islands and burned more than 3000 ha in 5 days [91].
In 2003, nine wildfires raged simultaneously on the island of Hvar, some merging into one big conflagration, while on the nearby island of Brač, an ongoing wildfire rapidly doubled its size in less than 4 h (from 300 ha to 600 ha; [91]. The total burnt area during these events was larger than 4200 ha. Another example of extreme wildfire occurred in September 2003 after the usual fire season peak in Croatia, which is in July and August. Cold front, bura wind and LLJ aloft again coincided with multiple wildfires on the Adriatic coast, with the largest threatening residents and tourists on the island of Lastovo. The total burnt area was 1800 ha, the majority of which (1200 ha) burned in the first day of the wildfire due to strong bura [91].
In the years that followed, similar meteorological conditions continued to trigger large wildfires, including that in the northern Adriatic on 23 July 2012 [93]. Measurements from the nearby automatic weather station showed the maximum mean wind speed of 13 m s−1, with gusts up to 30 m s−1. The relative humidity dropped to 20%, which, together with the strong wind, further dried the fuels. Besides the strong surface wind, a typical characteristic of the bura vertical profile is an overlying inversion layer capping the layer of strongest winds. This also influenced the capabilities of fire management on the ground, since thick smoke was trapped below the inversion. Variability in speed is also typical for bura wind.
A somewhat different synoptic pattern influenced weather conditions during the largest wildfire in Croatia that burnt 5600 ha. The wildfire started on the island of Brač on 14 July 2011, being dominated by strong SE jugo wind, which, the next day, turned to a NW maestral wind, typical for diurnal coastal circulation in the area [46]. The change in wind direction in this case again coincided with the passage of a cold front, although an upper-level cyclone was situated over central Europe, in contrast to the anticyclone in the previous cases. Such changes in wind direction are also known to be associated with the largest fire power and most destructive conditions from cases in southern Australia [41,94]. LLJ occurred in this synoptic situation as well, although weaker, with a maximum wind speed of 9 m s−1 in the layer between 350 and 700 m in height. On the first day, the wildfire burned 2000 ha, corresponding to an extreme wildfire behaviour. Although synoptic forcing was not as strong as in the bura cases, the cold front passage, the LLJ and the enhanced local coastal circulation had a significant influence on wildfire behaviour. The probable additional explanation for the extreme behaviour is the altitude of the wildfire, around 200 m, close to the layer of the LLJ and therefore more subject to influence from the jet flow.

3.4. Croatian Wildfire Studies—Heat-Driven

Besides the most common type of wildfires along the Adriatic coast that can be classified as ‘wind-driven’, there were a few extreme cases of the so-called ‘heat-driven’ wildfires. For example, extremely warm and dry weather conditions caused the severe crown wildfire on the Pelješac Peninsula in the Southern Adriatic on 20 July 2015 that burned 2400 ha [95]. According to measurements from the nearest meteorological station, July 2015 was the warmest month in the 1981–2015 period, with 30 days exceeding 30 °C maximum daily air temperature. The closest climatological station recorded its highest values since 1981: daily maximum air temperature reached 38.8 °C on the second day of the wildfire, followed by the highest minimum air temperature of 30 °C during the following night. With such a small gap before the maximum and minimum temperature, there is no capacity for moisture recharge in vegetation, and fire may remain overnight (e.g., [96]).
Although the ALADIN model simulated a shallow cyclone over the southern Adriatic, there was no significant synoptic forcing that would override the local diurnal circulation. In fact, the local circulation was consistent during the whole active period of the wildfire—with a maximum mean speed of the NW maestral wind of 9.1 m s−1, and a maximum gust of 15.4 m s−1 on 23 July 2015. During the night, the wind weakened and veered to the N-NE, locally known as burin. Numerical simulations of vertical wind profile did not identify the LLJ; however, the temperature profile did indicate an inversion in the near-ground layer during the first night of the wildfire. Such a vertical profile enabled the vertical movement of hot air, additionally enhanced with the steep orography of the peninsula. These conditions dominated the wildfire behaviour, which was hardly controlled by the firefighters. The fire management operation was also aggravated due to multiple other wildfires that burnt at the same time along the coast and islands.
Wildfires in Croatia do not only occur along the Adriatic coast. In the second decade of the 21st century, quite severe wildfires occurred in the continental inland. One such ignited on the mountain Strahinjčica situated 65 km north of the capital city of Zagreb. Although smaller in burnt size (350 ha), this wildfire stood out because it did not appear in the warmest part of the year, or during usual fire season from June to August, but in the first days of spring from 22 to 27 March 2012 [97]. Notably, the FWI index is not even operationally calculated for this time of year. Additionally, this wildfire burnt oak, beech and conifer forests in contrast to the wildfires of dry Mediterranean vegetation along the Adriatic coastline. Extremely dry weather conditions contributed to this wildfire. The eleven months prior to the wildfire were drier on average in comparison to the standard 1961–1990 period, with March being the driest and the second warmest in the 1994–2012 period. In the first few days of the wildfire, the wind was weak; however, the atmosphere was unstable in the lowest 1 km. Similar to the Pelješac wildfire, these conditions contributed to the vertical updraft of warm air along the 60° slope of the mountain Strahinjčica, which could be confirmed visually by the observation of the vertical column of smoke.
In spite of a very difficult firefighting operation due to the very steep terrain and the fact that firefighters in continental Croatia had never experienced this type of wildfire with massive stump burning and multiple ground fires, usually found in the Mediterranean environment, the fire was controlled after 5 days. This was crucial because fire weather conditions deteriorated rapidly thereafter with an approaching cold front, wind became strong and gusty NE (up to 12.8 m s−1) and the LLJ appeared with maximum speed of 20 m s−1. This case in particular serves to illustrate the importance of better future collaboration between firefighting management and meteorologists. It is also worth mentioning that a few days before this wildfire, on the mountain Strahinjčica, another wildfire occurred in the eastern inland in the largest swamp area in Europe, Kopački Rit. Multiple wildfires in the continental part of Croatia in recent years are in agreement with the results of SSR rating analysis (discussed below), which found a significant increase in the fire danger rating in these regions, once considered safe from such disastrous events [81].

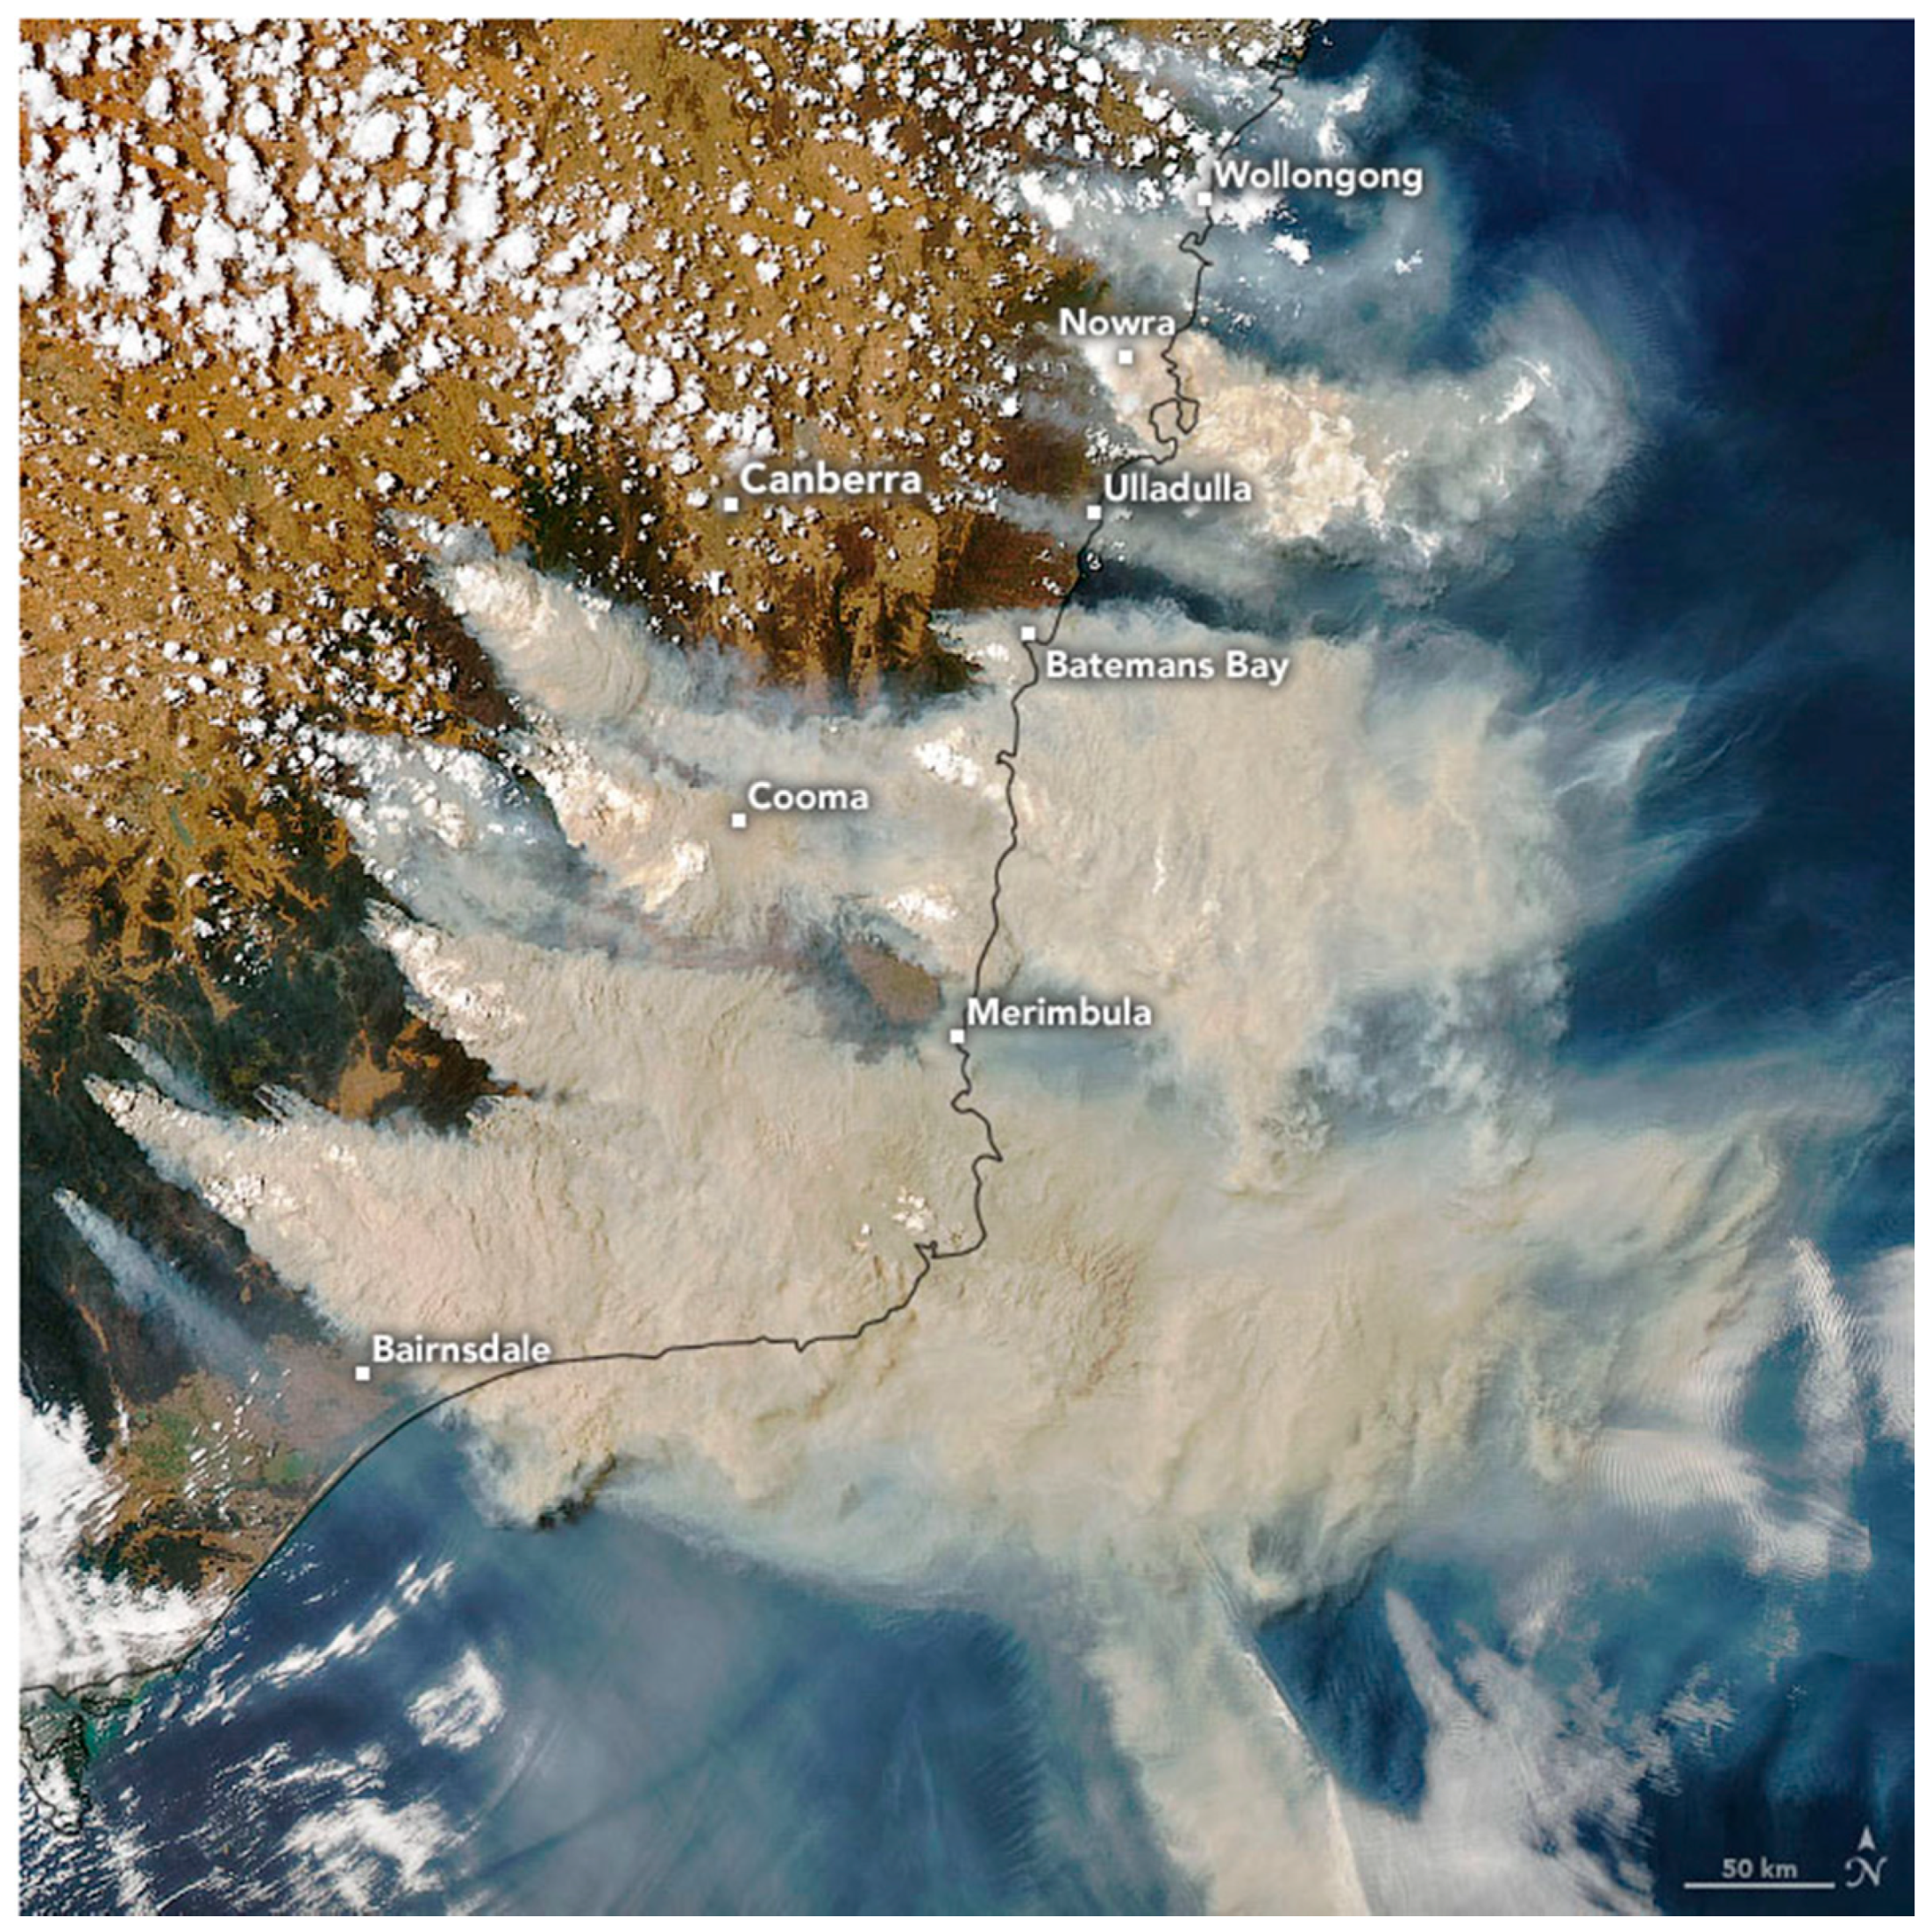
4. Fire Weather in Southeast Australia

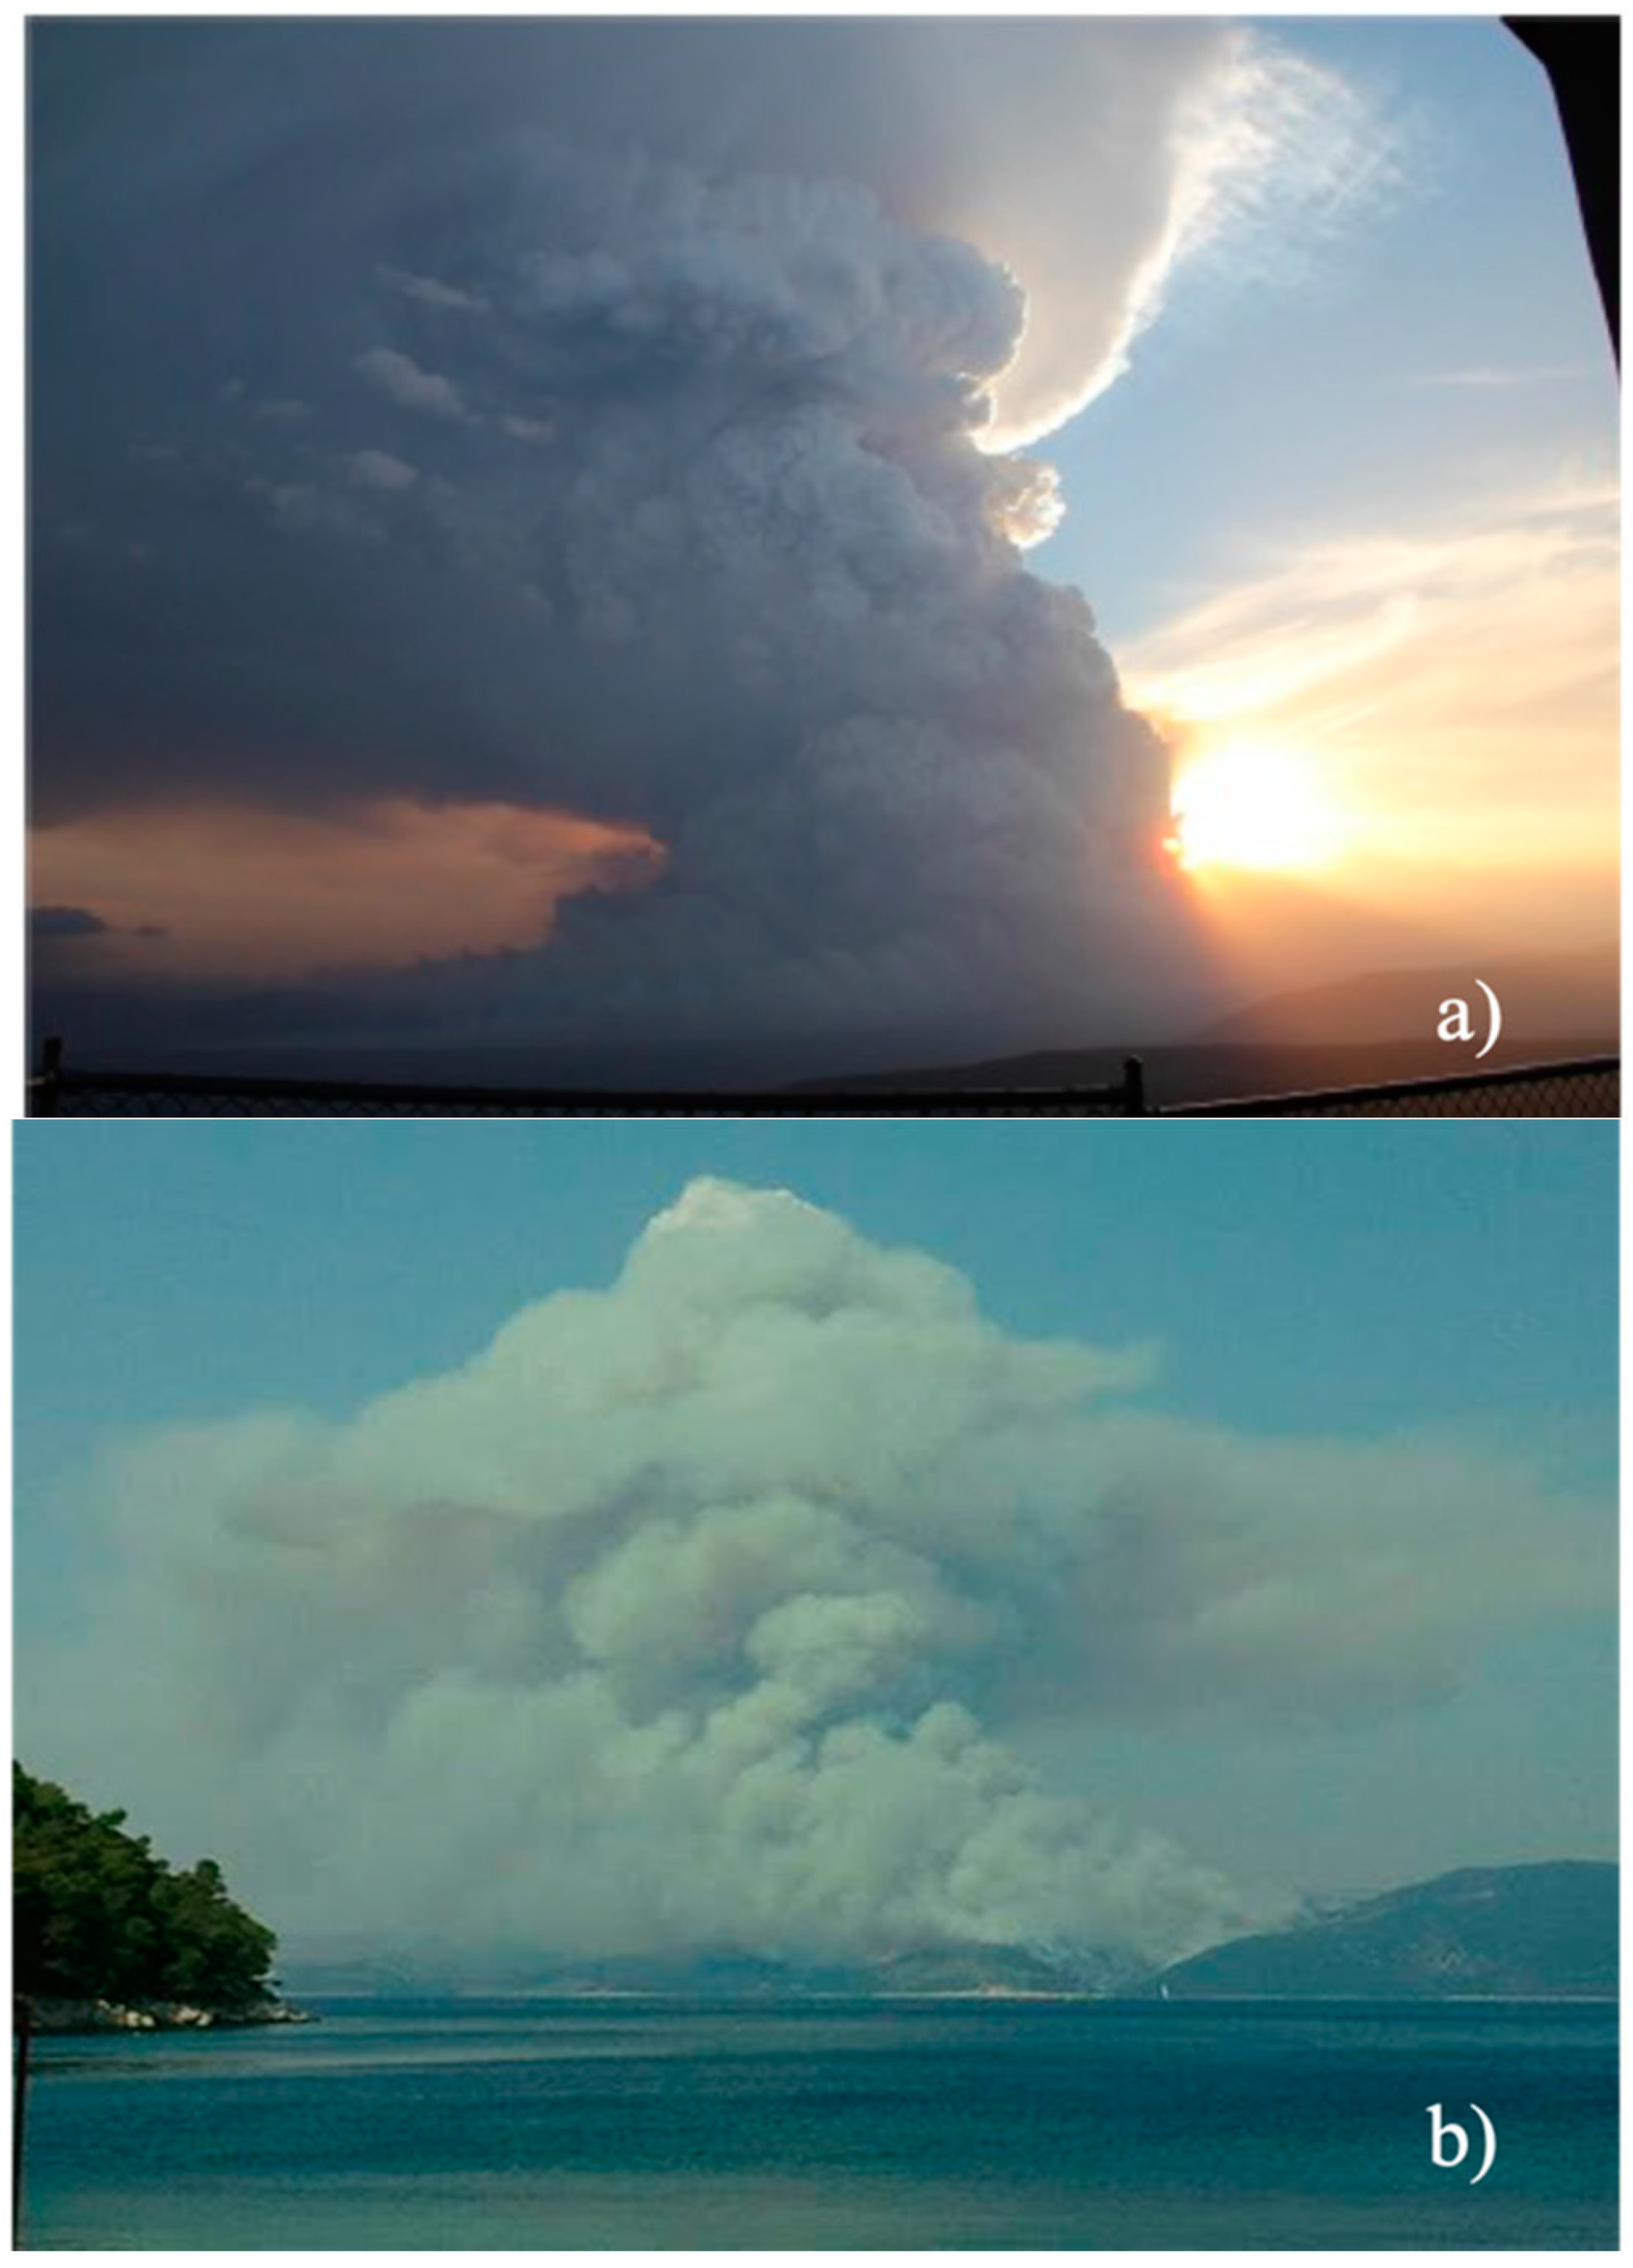
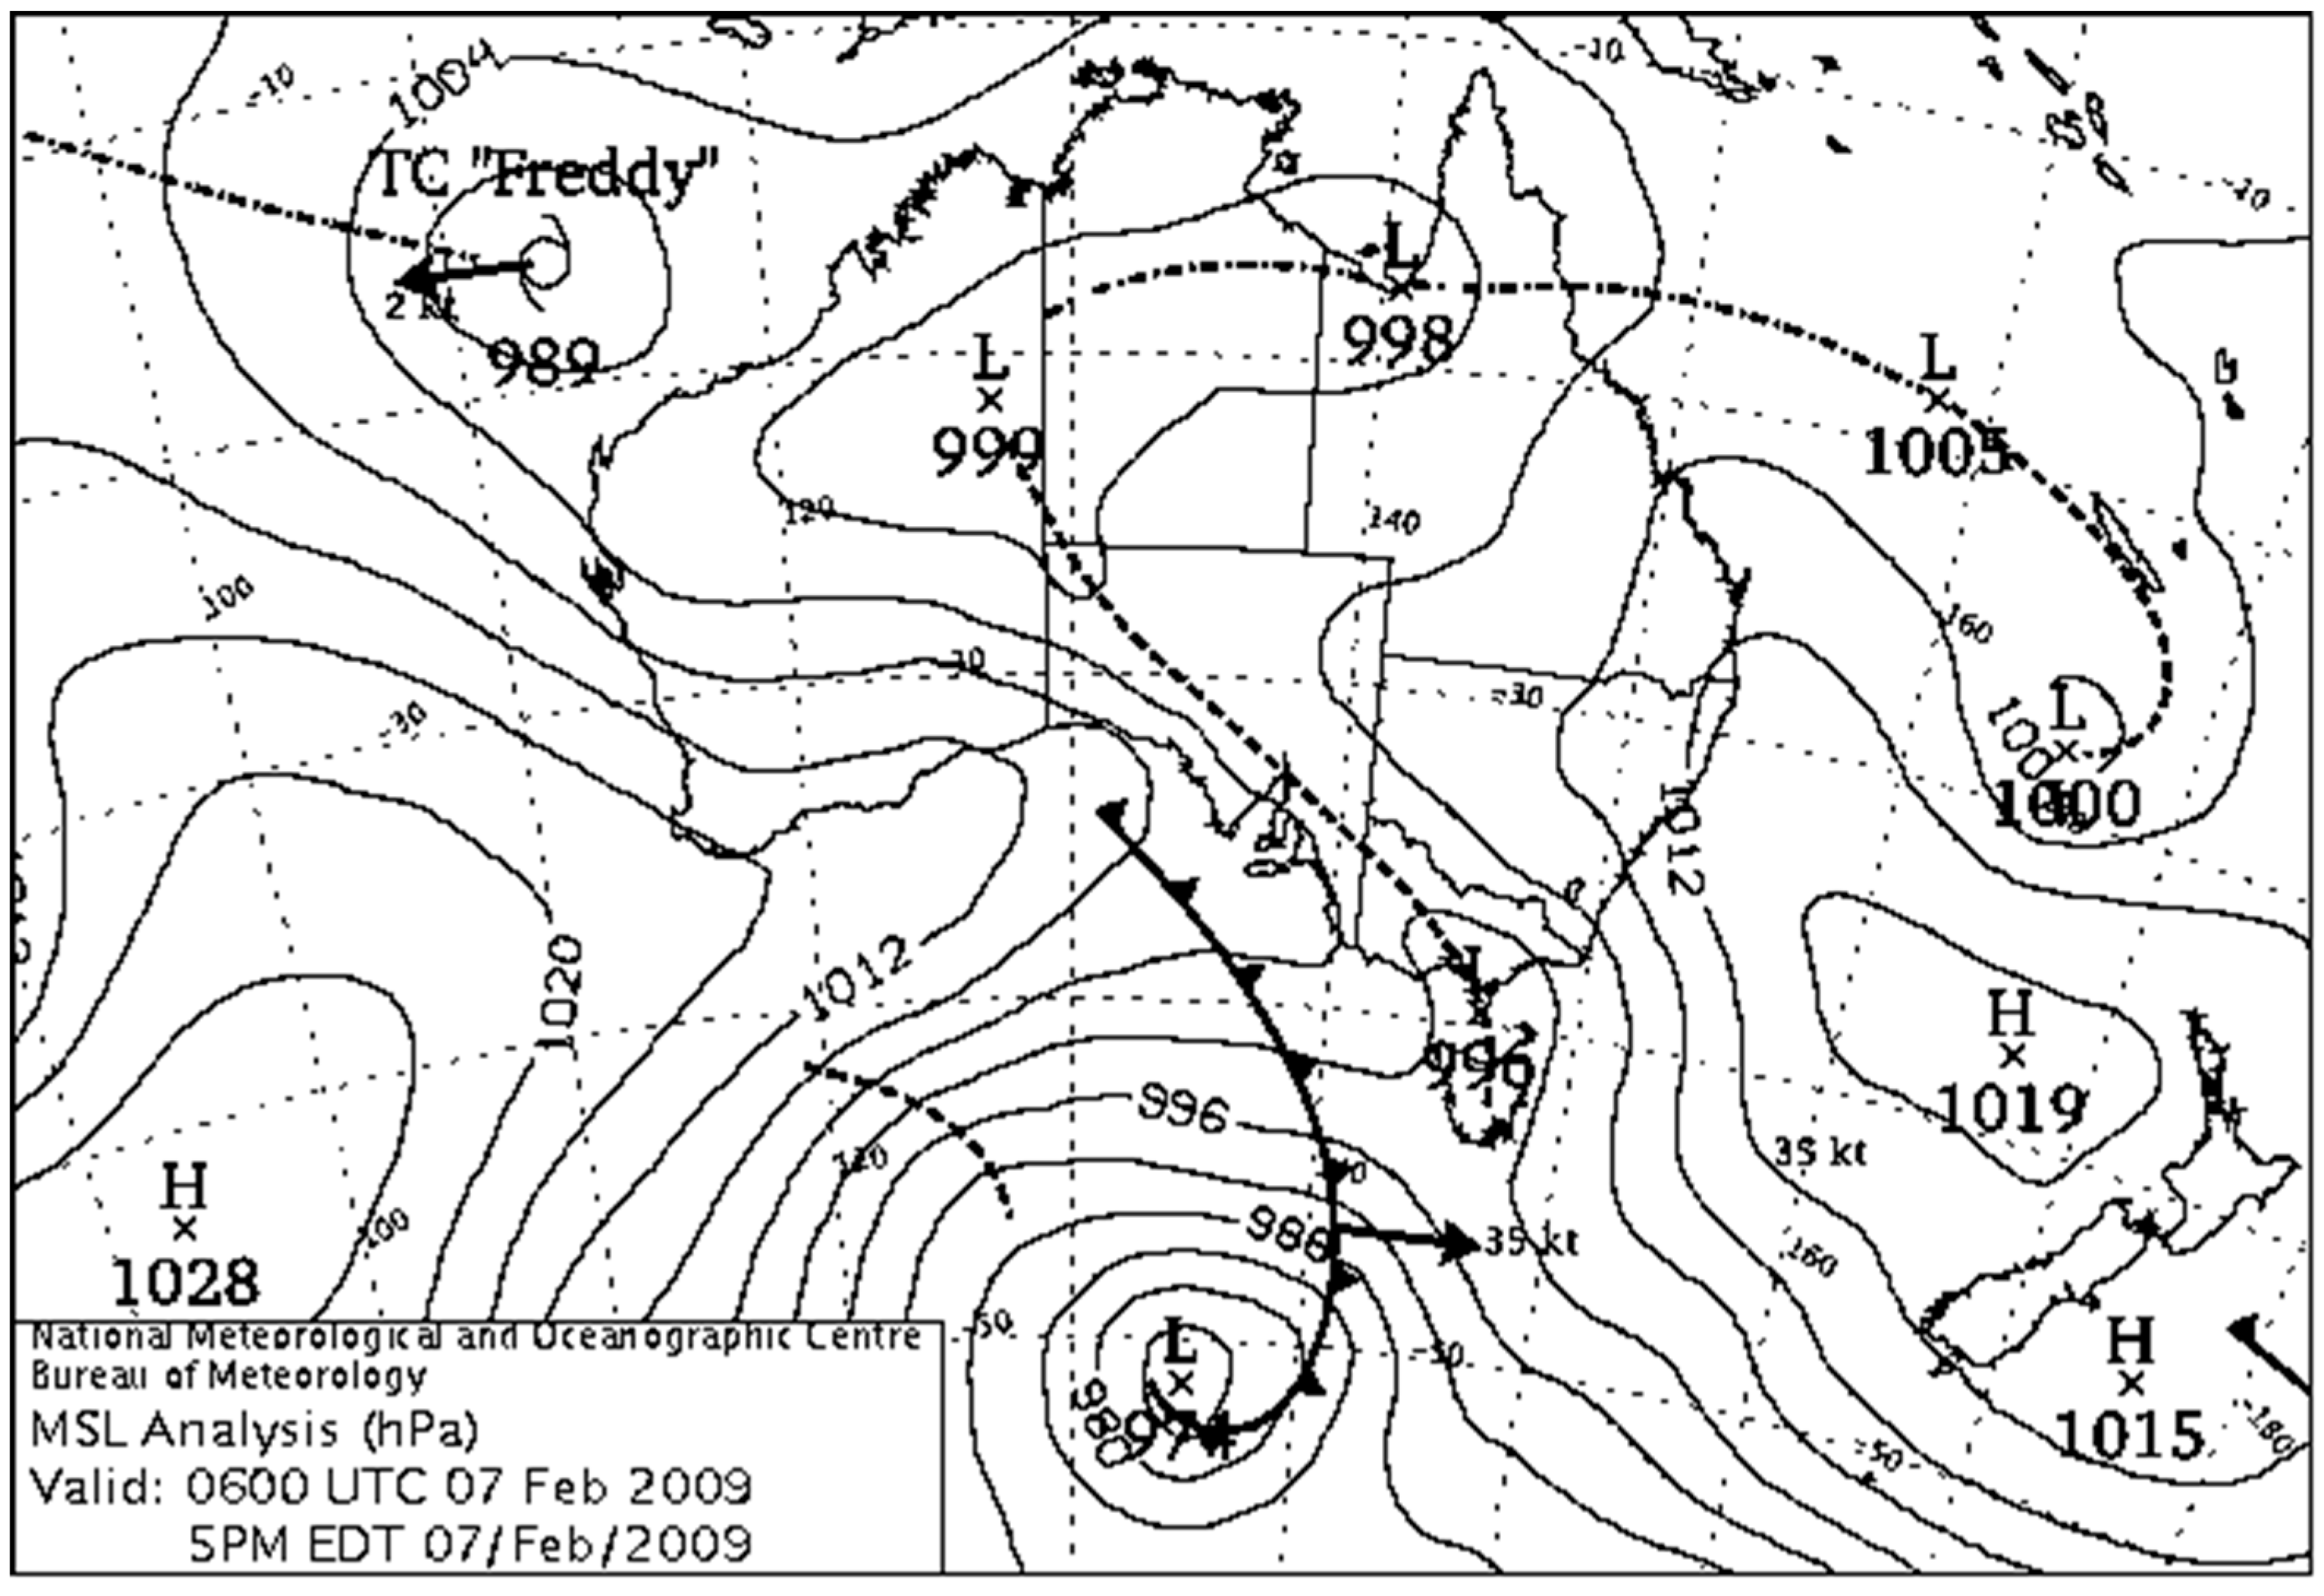
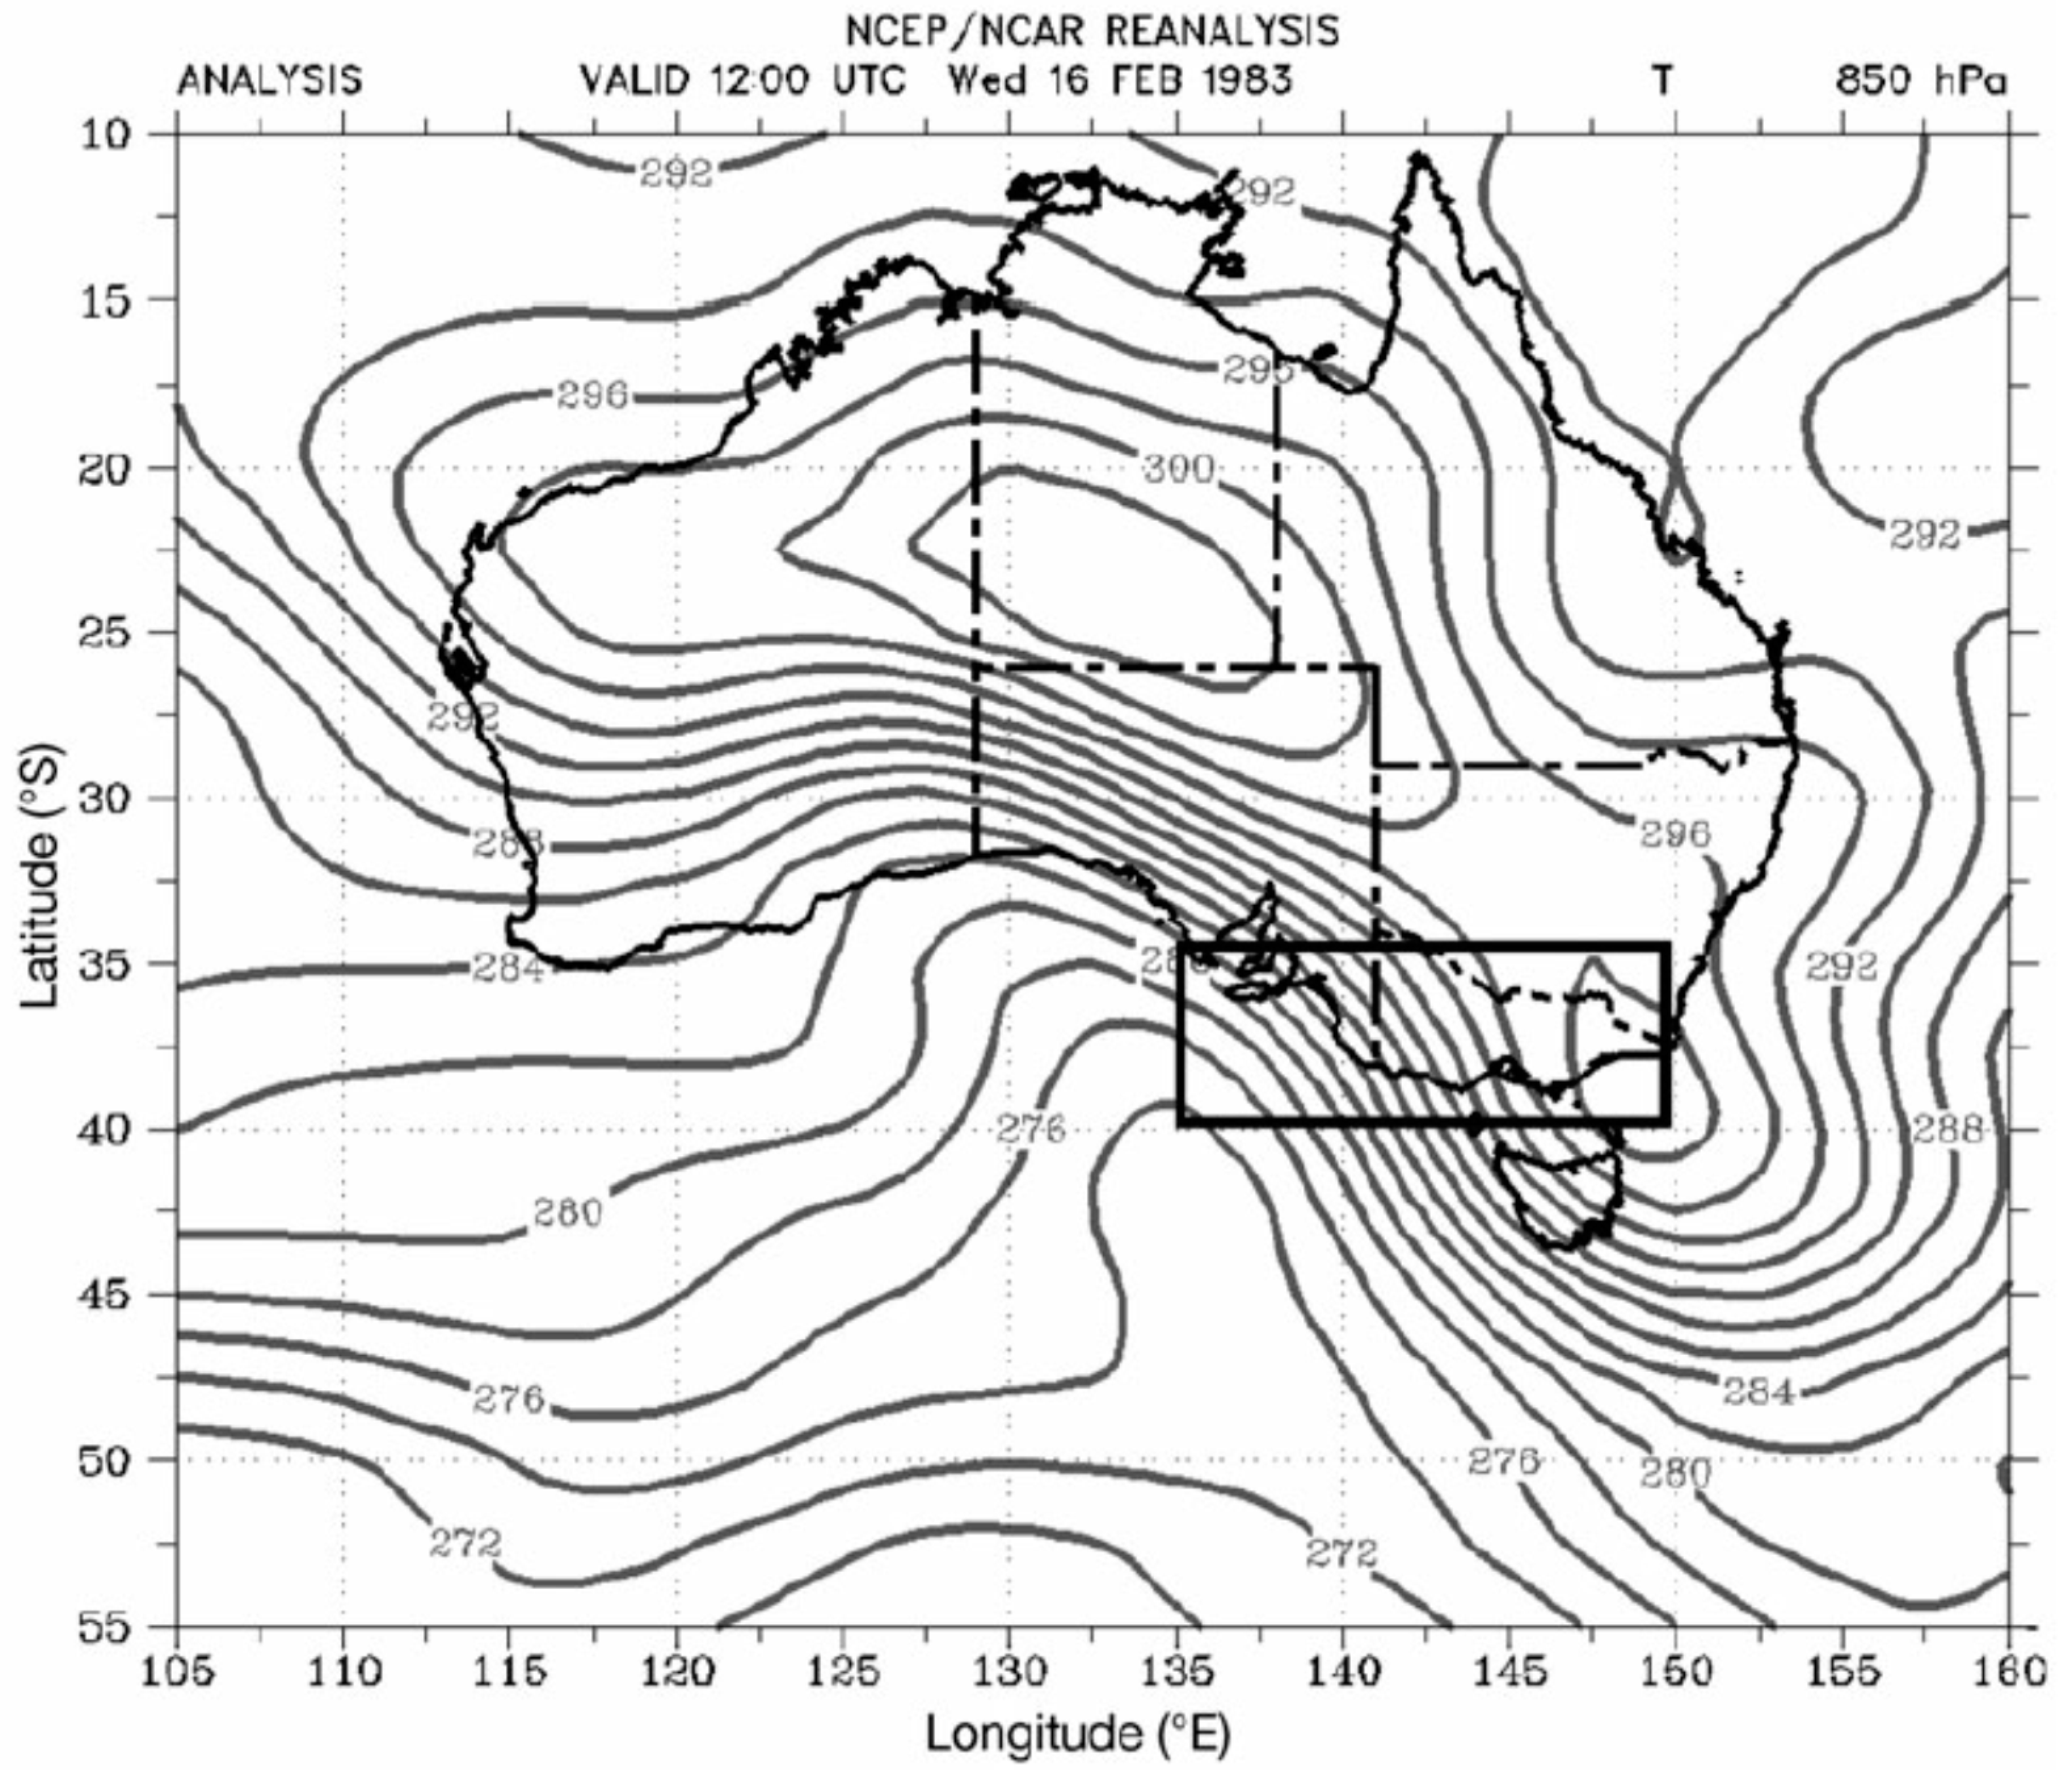
4.1. Synoptic Drivers

Early research on two-dimensional synoptic patterns accompanying large wildfires in Australia led to the conclusion that two major patterns tend to be present [98]. The first includes any pattern transporting dry air from the centre of the continent to the more fuel-enriched periphery, while the second pattern corresponds to frontal passages following an anticyclone and is the most common in southeast Australia. Indeed, coastline of Victoria, New South Wales and Tasmania often experience a particular feature of fire weather—dry summertime cold fronts, also known as ‘cool changes’ (e.g., [99]). In this region, hot continental air mass from the inland merges with cold maritime air from the Southern Ocean. This intersection of air masses intensifies cold fronts as they approach the coastline and interact with coastal temperature gradient [49,100,101]. Fronts are usually preceded by a pronounced anticyclone, which directs dry air from the heated continental interior with prefrontal NW to NE wind. The frontal passage is then followed by S to SW wind and the advection of cooler maritime air from the Southern Ocean over southeast Australia [99,102]. This synoptic type is well-known and has been confirmed to have a strong correlation with high fire risk in this area. The most catastrophic wildfires in Australia’s history have been associated with summertime cold fronts. A strong cold front is defined as one for which the rate of decrease in maximum daily temperature is between 12 and 17 °C (i.e., 12 °C < ΔT < 17 °C) on the day following the frontal passage, while an extreme cold front is defined as one with the difference greater than 17 °C (i.e., ΔT ≥ 17 °C) [103]. Research on meteorological conditions that occurred during 24 large wildfires in southeast Australia in the period from 1962 to 2003 showed association with cold fronts, with 11 wildfires associated with a strong cold front, and 8 with an extreme cold front [94,103,104].
Perhaps the most extreme example of this synoptic pattern associated with the cold front as a defining feature occurred during the most catastrophic wildfires in southeast Australia (Victoria) on 7 February 2009, also known as Black Saturday. Synoptic scale analysis revealed that a strong anticyclone dominated the weather in the week before Black Saturday, leading to a very hot and deep air mass over this area [10,105]. On Black Saturday itself, an approaching cold front from the southwest was associated with a low-pressure system farther south as a high-pressure system lay to the east (Figure 5). Northwesterly winds transported exceptionally hot and dry air from the inland, resulting in the highest daily maximum temperature in 154 years in Melbourne (46.4 °C), and the historical record for fire danger rating for southeast Australia [106]. In addition, a wind direction change (from 320° to 250° in a 14 min period) caused by a cold front passage over the wildfire areas led to extremely dangerous fire behaviour in terms of intensity (up to 88,000 kW min−1), rate of spread (peaking at 153 m min−1, with one fire developing 55 km long headfire in 1 h) and spotting up to 33 km ahead of the fire front [35,41]. The most significant of all fires on Black Saturday, called the Kilmore East fire, accounted for 70% of all fatalities, burned 100,000 ha and destroyed more than 2000 buildings in the first 12 h alone. Due to the enormous amount of energy released, the wildfire generated a pyroCb cloud, whose top reached at least 13 km, injecting a vast amount of smoke into the lower stratosphere. A day after the cold front passed this area, the daily maximum air temperature dropped to 20.9 °C [106]. Over a period of 3 weeks, wildfires burned approximately 400,000 ha and resulted in 173 human fatalities.
The extreme fire weather potential observed during Black Saturday wildfires is not unprecedented in southeast Australia [41]. An earlier example of a wildfire event associated with the extreme cold front is the Ash Wednesday fire (South Australia and Victoria) in 1983. A synoptic pattern that included the hot and dry northwesterly flow of continental origin caused an extended period of the maximum air temperature exceeding 30 °C over much of southeast Australia. Elevated fire danger peaked on the warmest day, accompanied by a strong synoptic-scale cold front. A change in wind speed and direction, associated with the cold front passage in this case, contributed to the catastrophe. In particular, everyone killed during Ash Wednesday died within 1 h after the cold front passed over the wildfires’ area [94]. Similarly, ‘inferno-like’ fire weather conditions, when wildfires cause the most damage in a matter of hours, have been documented in a number of other events. The Hobart wildfires (Tasmania) in 1967 [107], Canberra (ACT) in 2003 [40], the Dunalley fire near Hobart (Tasmania) in 2013 [43,108] and the Black Summer wildfires (New South Wales) in late 2019 and early 2020 are cases in point [109].
A detailed re-examination of the synoptic and mesoscale features of Ash Wednesday indicated that the extreme values of 850 hPa temperature gradient were a crucial meteorological parameter, which were associated with the most extreme wildfire behaviour in a number of other cases (including the 1967 Tasmanian fires). In these cases, the strongest recorded 850 hPa temperature gradients over southeast Australia consisted of a thermal ridge and a baroclinic zone related to a surface trough passage. It is also noted that the temperature gradient in the majority of cases was stronger in the east–west rather than the more typical north–south direction; in other words, isotherms were more meridionally oriented (Figure 6; [110]). Consequently, the magnitude of the maximum thermal gradient in the 850 hPa temperature field has the potential to be used for medium range prediction of extreme days when sub-synoptic weather features can possibly lead to ‘blow-up’ fire (The Glossary of Wildland Fire Terminology defines a ‘blow-up’ as the sudden increase in fireline intensity or rate of spread of a fire, often accompanied by violent convection that may have other characteristics of a fire storm; [9]). An assessment of the occurrence frequency of high 850 hPa temperature gradient values over southeastern Australia may also be used in climate change projections to determine possible future changes in severe fire weather (e.g., [110,111]; see Section 5).
Another critical fire weather pattern includes interaction of synoptic flow with topography, which certainly may overlap with the pattern of large temperature gradient described above. For instance, some cases of sudden escalations in local fire danger levels along the mountainous relief in southeastern Australia are related to cross mountain flows and foehn wind occurrence [112]. Foehn is a type of downslope wind that, on the lee side of a mountain range, causes abrupt warming and drying through adiabatic compression, accompanied by strong winds and gusts together with turbulent mixing, which are features leading to rapid fire spread [113,114]. The examination of multiple cases confirming foehn existence in the lee side of the Australian Alps in the southeast connected foehn occurrence with the regional fire danger rating anomalies, at the 95th percentile and above [112]. These anomalies cannot be explained by the advection of warm and dry air from the inland of the continent alone. The main cause of the abrupt changes in fire danger rating was the decrease in relative humidity, accounting for up to 75% of the changes in the McArthur Forest Fire Danger Index (FFDI, [115]), with changes in air temperature and wind speed making up the rest. The analysed foehn events in southeast Australia also pointed towards certain synoptic precursors for foehn occurrence—low pressure cells or synoptic fronts passing over the Great Australian Bight and southeast mainland area, generating strong winds perpendicular to the topography of the region. In addition to similarities in synoptic patterns leading to foehn occurrence, mesoscale numerical weather prediction (NWP) model products revealed that foehn was related to partial blocking of humid lower-level air by a mountain barrier and subsidence of drier air on its lee side. Mesoscale analysis also consistently identified the presence of topographically induced atmospheric wave structures connected with foehn occurrence. The combination of the two, foehn and mountain wave structures, results in increased turbulence near the surface. These two features, together with the associated synoptic patterns, seem to be very important in defining critical fire weather conditions in southeast Australia. These features were also found to influence fire weather in the eastern part of Tasmania [116], where elevated fire danger has been associated with offshore winds such as the strong easterlies during the January 2016 fires in western Tasmania. For instance, foehn-like winds contributed to extreme fire weather conditions during bushfires near Hobart on 6 November 1982 [117] and again on the eastern coast of Tasmania on 12 October 2006 [118].

4.2. Surface Drying

For many years, fire managers in southeast Australia have been aware of a potential threat of ‘dry air aloft’ causing rapid changes in relative humidity on the surface, which influences fine fuel moisture and therefore fire risk. Rapid fluctuations in relative humidity are difficult to observe and forecast, but the use of mesoscale NWP models allowed an investigation of these cases. The earliest research on two wildfire events when extreme fire behaviour was related to rapid reduction in near-surface relative humidity included devastating wildfires in Canberra (ACT) on 18 January 2003 and on the Eyre Peninsula (South Australia; SA) on 11 January 2005 [119]. The research proposed that the abrupt surface drying in these cases happened due to two reasons. The first included subsidence of extremely dry air from the upper to the mid-troposphere that created a layer of dry air over the wildfire’s area, while the second process included a development of very deep boundary layer that mixes this dry air from the mid-troposphere to the surface. In the case of the Eyre Peninsula fire, the latter processes occurred in less than an hour, which corresponds to the time scale for fine fuels to respond to changes in atmospheric humidity. The mid-tropospheric dry air was, in both cases, visible as a dark band in the 6.7 µm ‘water vapor’ channel (WVI) from a geostationary satellite and in both cases dry bands appeared near the time of extreme wildfire activity, which makes this tool useful in nowcasting and forecasting.
Mills [120] presented a synoptic climatology derived from a number of similar cases with abrupt surface drying in the period from 1999 to 2005. The study found that downward advection of dry air from the upper troposphere has been associated with synoptic and mesoscale troughs or ridges, while accelerated air was connected to the jet stream circulation. Jet stream entrance and exit circulation induced narrow bands of dry air to descend to the mid-troposphere. This circulation was also found in the cases of the Canberra and Eyre Peninsula wildfires. Nevertheless, as noted in the aforementioned study, this feature is not the only ingredient needed for the abrupt drying at ground level. There are certain lower tropospheric processes that are needed to link this mid-tropospheric dry air with the surface. One possible low-level process is dry convective mixing in daytime mixed layers, which usually occurs during the afternoon when mixed layers are deepest. The second common feature in most cases are the pre-frontal updrafts that enhance vertical mixing and the exchange of air and, therefore, the entrainment of mid-tropospheric dry air to the surface. A third possibility for bringing the dry mid-tropospheric air to the surface is descent from the cool air side of the frontal system, immediately following the frontal passage. Finally, cross-mountain flows with topographically induced downward flows can transport the dry air from aloft. All these processes are common along the eastern coast of Australia’s mainland and Tasmania and can be used for operational purposes in forecasting dramatic reductions in surface humidity and warning fire officials of possible sudden and extreme wildfire behaviour. First, it is necessary to identify areas of upper tropospheric descent of dry air, and secondly, to assess whether there is possibility for any of the mentioned low-level features to occur to draw this dry air from the mid-troposphere to the surface.
Of these mechanisms, localized low-level convective processes can be especially dangerous. Apart from enhancing the descent of dry mid-tropospheric air to the surface, convective conditions can cause so-called ‘plume-dominated’ wildfires—fires in which vertical convection is more important than horizontal winds. Meteorological conditions that lead to these events have been frequently discussed in Australian literature in recent decades (e.g., [35,39,40]). Localized convective processes can be generated in conditions of low wind and low atmospheric stability. Atmospheric stability, as a rate of change of air temperature with altitude, influences fire behaviour through its influence on the buoyancy or rate of rise of the convection column. An unstable atmosphere usually implies increased kinetic energy and allows the development of a deep convective column with strong updrafts, leading to strong low-level inflow to the wildfire and therefore unexpected wildfire activity [49,88]. A quantitative measure of the potential for vertical atmospheric stability and humidity to influence wildfires is the Haines Index (HI; [121]). The Australian region that has most benefited from using the HI is Tasmania, where it was, for a period, used as complementary information to FFDI in issuing fire weather warnings [122,123]. Other parts of Australia have certain limitations in using HI because high values of the original formulation of the HI occur very frequently in the Australian climate and therefore make it hard to discriminate days with exceptionally high fire danger due to atmospheric instability. For this reason, Australian researchers developed the extended version of the HI known as the Continuous Haines Index (CHI; [124]), which is widely used in the rest of the continent to forecast conditions with possible unexpected wildfire behaviour associated with dangerous pyroconvection. More recently, techniques for predicting specifically pyroCb have been developed and used in a pre-operational capacity [125].
Various studies from the short review above demonstrate that, in predicting wildfire behaviour, in addition to surface meteorological conditions and synoptic circulation patterns, it is of utmost importance to consider lower tropospheric processes, in addition to the upper tropospheric processes identified above associated with jet stream circulations. Many Australian studies that have investigated low-level processes have applied high-resolution NWP model products. Computational capabilities revealed other interesting local atmospheric dynamics influencing wildfires. For example, the influence of atmospheric instability in enhancing fire activity in a convergent sea breeze regime, or how local boundary layer phenomena impacted spatiotemporal variation of fire weather parameters has been explored [118].

5. Wildfire and Fire Regimes under Climate Change
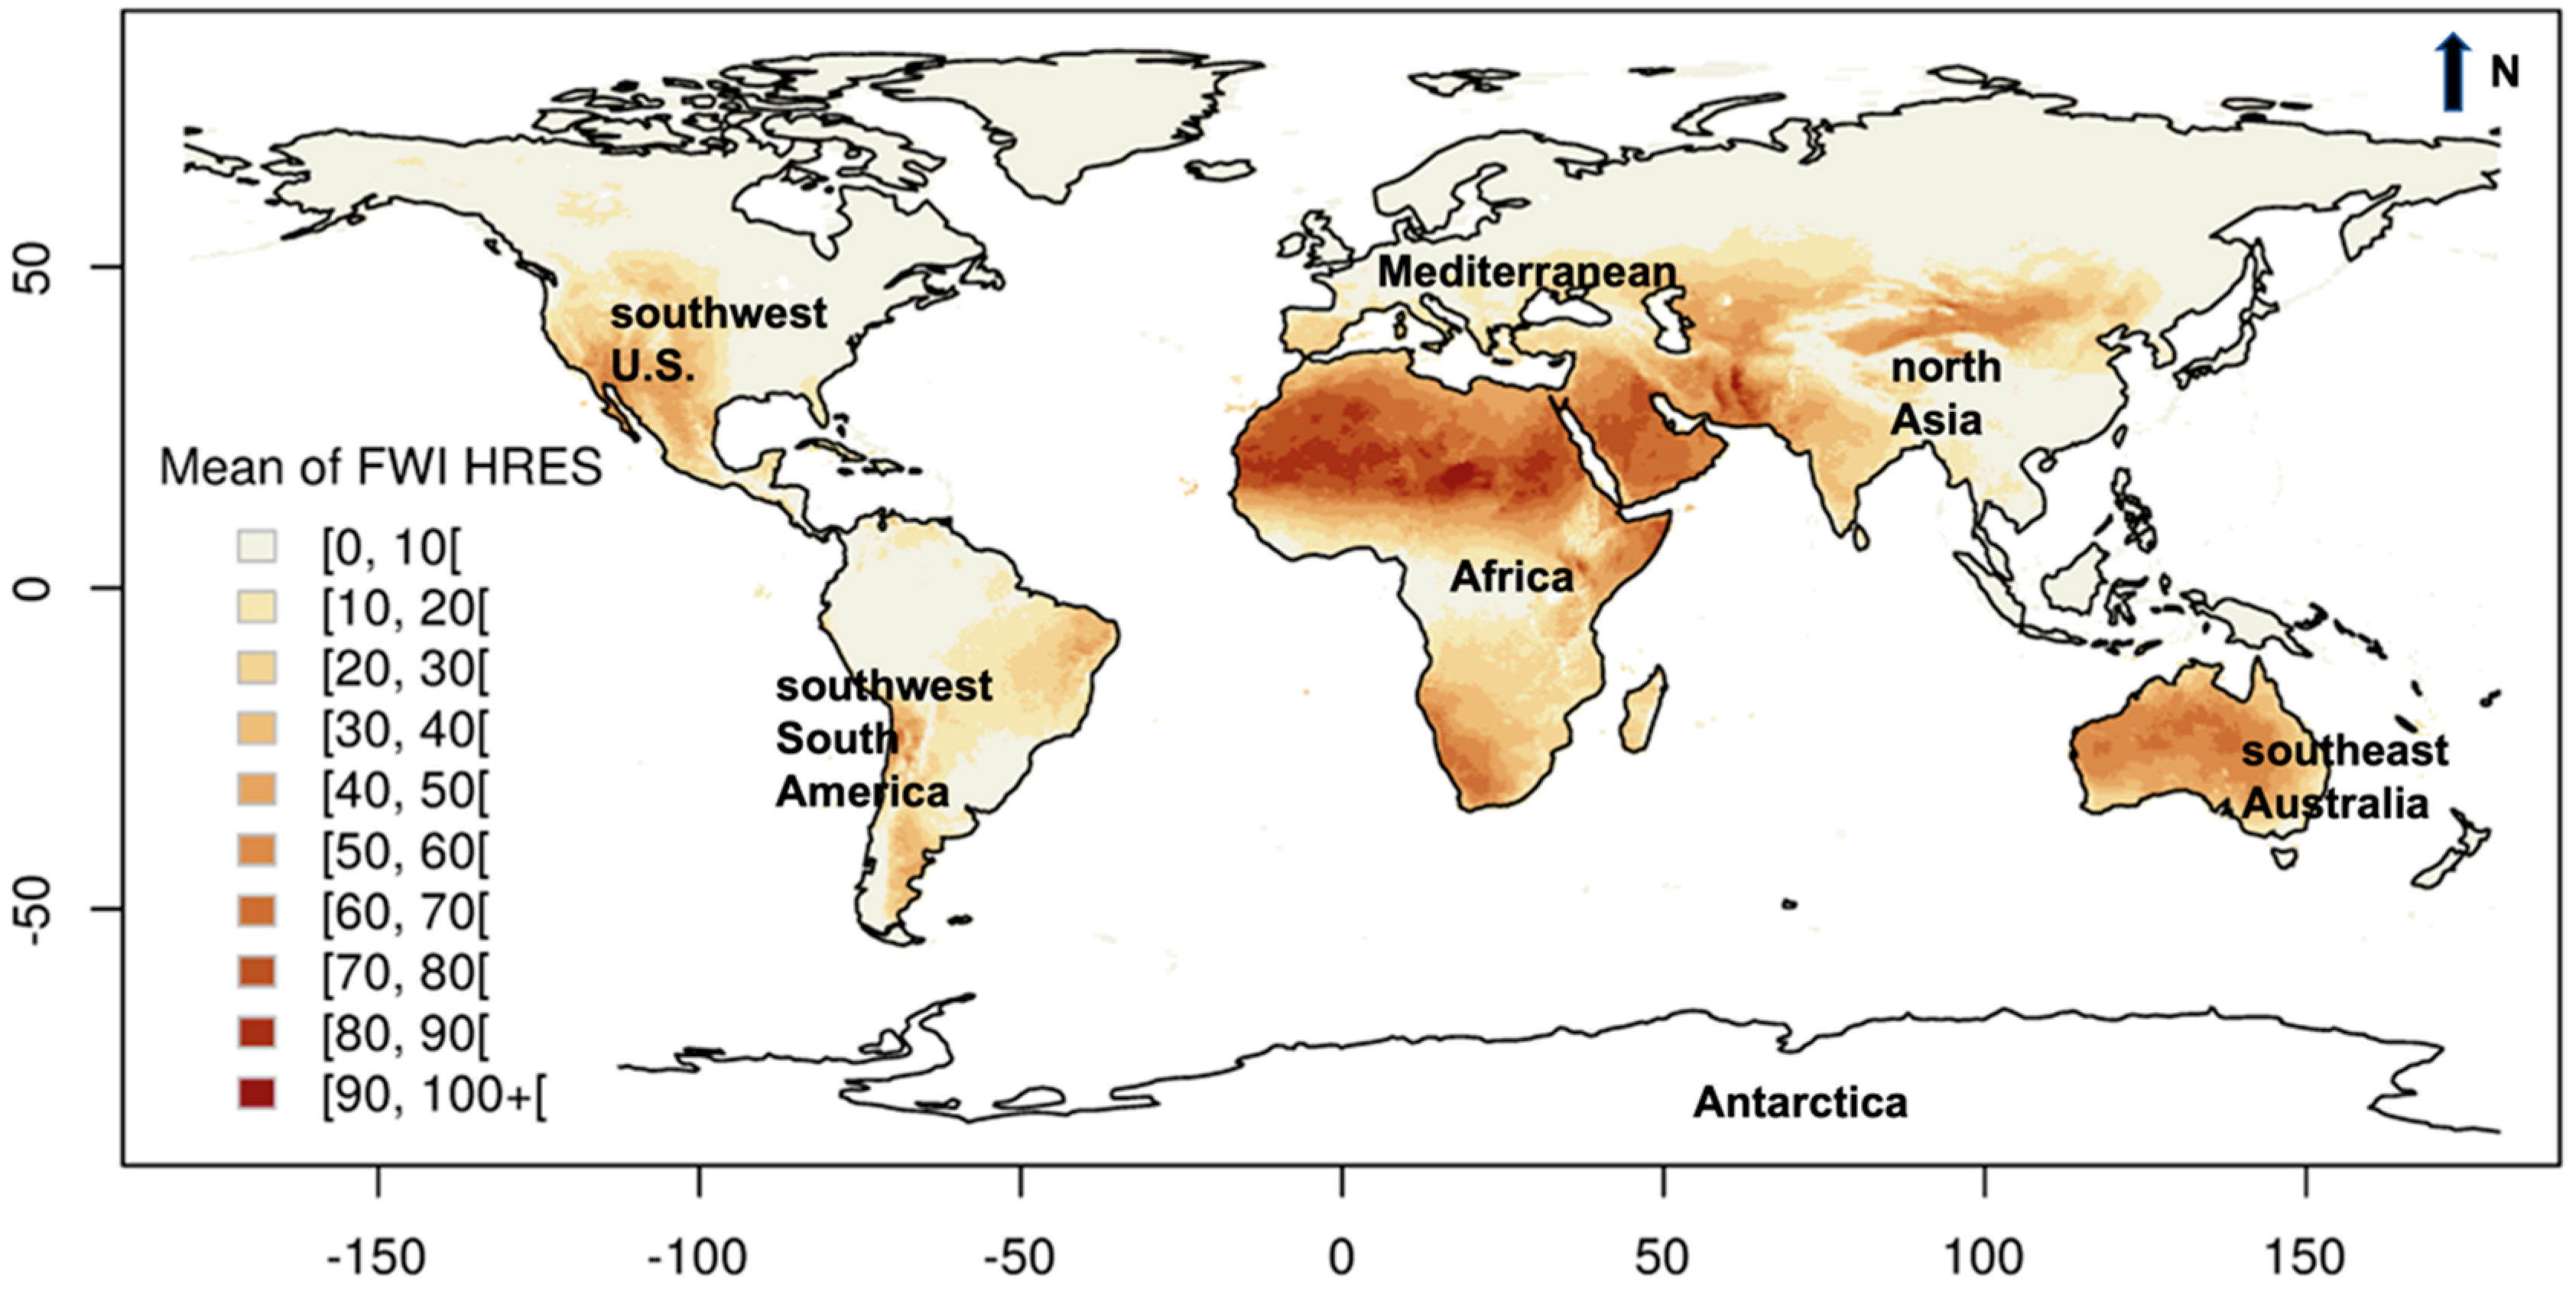
5.1. Fire Indices

From our previous discussion, the fire regime obviously depends on climate and weather; it is also very sensitive to climate change and climate variability [126]. Climate change, according to scientific consensus, is occurring due to anthropogenic influences [127] and may have significant and potentially unexpected impacts on global fire regimes [52]. In recent decades, climate scientists have frequently confirmed the correlation between rising global temperatures, long-lasting droughts and atmospheric conditions favourable for wildfires [52,110,128,129,130,131,132]. Although there is variability in the detail, the majority of studies agree on the changes in each of the six components of fire regime and provide evidence of an increase in frequency, severity, scale and intensity of wildfires, as well as shifts in seasonality and type of wildfires [109,133].
Indeed, a similar link between climate change and a change in fire regime has been detected in both countries of interest in this research: Croatia, which is within one of the world’s most fire prone areas, the Mediterranean Basin, and Australia, long known as the ‘fire continent’ [52]. Although distinct and incomparable in size of territory or scale of wildfires, the countries have certain similarities. Specifically, the southern part of Croatia and the southeastern part of Australia share a similar climate, with hot and dry summers and mild and wet winters. Both experience droughts and heatwaves accompanied by episodes of strong wind, complex coastal topography adding to the difficulty of resolving wind and moisture fields influencing fire behaviour, all contributing to extreme fire weather and wildfire events defined in terms for each country.
In representing the climate change influence on weather conditions favourable for wildfires, researchers from both countries frequently use indices. In Australia, climate change studies often focus on the analysis of surface fire weather conditions represented by the FFDI, and in Croatia, on the FWI based on the Canadian Forest Fire Weather Index System (CFFWIS). Indices are calculated operationally at the meteorological service of each country (FWI at the Croatian Meteorological and Hydrological Service, DHMZ and FFDI at the Australian Bureau of Meteorology, BoM) from daily surface air temperature, relative humidity, wind speed and precipitation [134], and combine fuel dryness and surface soil moisture indices with fire spread rate and/or fire intensity indices. Therefore, the final product describes the joint influence of various meteorological and fuel conditions important to estimate the risk associated with wildfires and serves as a broad-scale warning in both countries (in Australia, for both public and fire management, but in Croatia, only for fire management).
Various climatological studies have analysed the FFDI values for Australia [134,135,136,137]. In its initial formulation, the FFDI was set to have a maximum value of 100 [49]. This value was described as ‘the near worst possible fire conditions that are likely to be experienced in Australia’. In terms of meteorological values, it includes joint conditions of 40 °C air temperature, a relative humidity of 15%, a wind speed of 15 m s−1, and a long (6–8 weeks) drought period. In the real world, the putative upper bound of FFDI has been exceeded multiple times [51]. For instance, during the 2009 Black Saturday fires, the FFDI value exceeded 150, which forced Australian authorities to redefine the FFDI scale and set a ‘catastrophic’ fire danger for FFDI > 100 [138]. Another analysis of historical records of FFDI index at 26 meteorological stations in southeast Australia showed that, since 1973, 12 stations have recorded ‘catastrophic’ FFDI [139]. The most recent study that examined the 67-year period of climate analysis data (from 1950 to 2016) found evident changes in fire weather conditions throughout Australia [140,141]. Specifically, there is a strong trend toward more severe conditions in southern Australia, where fire danger peaks during spring and summer season, as well as an increase in the frequency and extent of extremes together with earlier onset of the fire season [142]. These trends are highlighted by larger values of FFDI in recent decades, including multiple cases of values higher than anything previously recorded.
Climatological research on FWI in Croatia draws similar conclusions to those from Australia. The first analysis of FWI along the Adriatic coast in Croatia revealed that historical extreme maximum values are exceeded on almost daily basis during the peak fire season from June to August, specifically in the region of the mid-Adriatic coastline known as Dalmatia [143]. Later studies generally examined the temporal and spatial distribution of the Monthly Severity Rating (MSR) and the Seasonal Severity Rating (SSR; e.g., [81,144,145,146]), both derived directly from FWI. The SSR represents the wildfire risk from June to September, and it is considered to be extreme if the value exceeds 7. Examination of SSR based on station data (from 1960 to 2018) showed that not only is fire risk increasing in recent decades within the fire prone coastal area of Croatia, but the high fire risk is spreading from the mid-Adriatic to the northern Adriatic and also inland towards regions where wildfires are less often expected, such as in the agricultural land in the northeast of the country. The same research also included analysis of the fire danger history of even longer, secular measurements for one coastal station (from 1867 to 2018), which showed that mean wildfire risk is greater by a factor of 2.4 for the period 1981–2010 relative to the period 1891–1917 [147]. Furthermore, consistent with the increasing trend of MSR and SSR [81,148], fire seasons in Croatia tend to be longer with an earlier onset and later ending, with almost every season in the 21st century exhibiting extreme weather conditions favourable for the most severe type of wildfires. An absolute SSR maximum so far (28.5) occurred in 2017 [147], which was the worst fire season ever recorded in Croatia.
On the whole, the knowledge from a wide range of climatological analyses on fire risk in Croatia and Australia represented by indices derived from station, model or reanalysis data permits a certain degree of confidence in concluding that increases in FFDI and FWI values in recent decades and the current century, including their temporal and spatial variability in both countries, are consistent with observed climate change [52,141].

5.2. Future Fire Regimes

The future fire regime resulting from climate change is very hard to estimate due to different climate change scenarios and unpredictable human activity related to future fire management, land use or accidental fires [149] together with other important factors such as fuel availability and loading [150,151,152,153]. Nevertheless, projections based on general circulation models (GCMs) agree that, due to climate change, fire regime components will maintain the aforementioned trend until the end of the 21st century [127,154].
Whereas there are no studies regarding future fire risk specifically for Croatia, there are a limited number predicting evolution of fire regimes in the Mediterranean area. According to GCM projections the Mediterranean Basin can be described as a “hot spot”, or one of the most vulnerable and responsive regions to global climate change [155]. Observations of changes today are considered to be minimal in comparison to the expected future climate change. The most critical issue for this region will be the reduction in precipitation in all seasons, especially in the Balkan Peninsula, within which lies the bulk of Croatian territory. It is estimated that annual temperature will become 20% higher than the global average, with exceptionally high warming in summer with temperature increase from 50% to an alarming 100% (i.e., double of the summer mean) in regions north of the Mediterranean basin [154]. Various studies using a variety of approaches and different global or regional models considering different future climate scenarios consistently indicate that projected changes will consequentially generate a certain degree of increase in fire risk within the entire Mediterranean area in forthcoming decades (e.g., [126,156,157,158,159,160]). Some European studies have found an increase in fire risk along the mid-Adriatic coast and in the aforementioned agricultural land in eastern Croatia [161]. Together with an increase in fire risk, another study also found an increase in the length of fire seasons and increase in the number of extreme events per season in a part of Croatian territory by the end of the 21st century [162].
Numerous studies have examined possible future changes to FFDI in Australia (e.g., [129,139,163,164,165,166,167]). Without exception, studies highlight the potential for a significant increase in FFDI in southeast Australia, a region with an unusually high frequency of catastrophic wildland–urban fires in recent decades [168]. A recent study based on high resolution projections of the climate change impacts on fire weather conditions generated specifically for this region showed substantially greater FFDI by the year 2080 [142]. This is especially pronounced in the spring season, which suggests the intensification and lengthening of fire seasons. Along with increases in severe fire weather conditions, projections also show a decrease in the number of prescribed burning (or reduction burning before the fire season to reduce risk) days or shortage of available prescribed burning windows (by up to 10 days in spring, [169]). These results reinforce previous findings. For example, research on future impact of climate change on fire weather based on FFDI calculated for 26 stations in southeast Australia show the general increase from 10% to 30% in the average cumulative FFDI for the year 2050 with respect to 1990, based on high emissions scenario [139]. This increase in accumulated FFDI represents a longer fire season but can possibly hide the much larger changes in the number of days with high fire risk. The projections of the number of days exceeding the FFDI value of 50 by 2050 shows an increase of 10–50% for the low-emission scenarios and 100–300% for the high scenarios. As mentioned above, a historical analysis of FFDI at 26 meteorological stations revealed that 12 out of 26 stations recorded ‘catastrophic’ FFDI. Projections by 2050, using high-emission scenarios, indicate ‘catastrophic’ (FFDI > 100) days at 22 out of 26 sites, 19 with return periods of 8 years or less, and 7 sites with 3 years or less. Additional research that examined the future frequency of occurrence of specific synoptic patterns causing the most extreme fire weather events over southeast Australia indicates the increase in frequency of such events from about one event per 2 years in the late 20th century to about one event per year in the middle of the 21st century and one to two events per year in the late 21st century [110]. Likewise, projections of the composite mean sea level pressure pattern (MSLP) associated with elevated FFDI index specifically for the south-eastern state Tasmania show an increase in its frequency by the end of the 21st century [116]. Many other studies in recent decades consistently confirm that there is a likelihood of a shift to an altered, even more hazardous fire regime in southeast Australia in the future, and if started, there will be more potential for wildfires to blow up to extreme proportions, burning in an uncontrollable way due to extreme fire weather conditions.
Broadly, climate not only has a direct effect on fire weather conditions but also an indirect, long-term effect on the distribution, moisture and load of available flammable vegetation to burn [170]. Moreover, climate not only influences fire regime; fire activity can, in turn, influence climate. Strong thermal convection during large wildfires can cause the long-range transport of fire emissions thousands of kilometres away, even to high-latitude glaciers. Black carbon deposits reduce the albedo of glaciers and sea ice. As a result, instead of being reflective, ice absorbs more sunlight, which can cause spatially extensive melting events [171]. Changes in albedo together with changes in the atmospheric concentration of greenhouse gases [172], vegetation destruction and accompanying drop in evapotranspiration during and after large wildfires affect the energy budget and, therefore, climate [53].

6. Conclusions

6.1. Discussion

What can be learnt from the wildfire studies of the Adriatic coast and southeast Australia? A good way to extract the important information from the studies, which may improve our predictive capability of wildfire in terms of both operational fire behaviour forecasts as well as climate outlooks of fire risk, is to recapitulate the multiscale nature of wildfire drivers on which our introduction has been based (Table 1). Studies from both Europe and Australia have shown that the potential for fire occurrence is highly sensitive to the synoptic patterns, complicated by the dependence on not just the surface pattern but also the relative positions of the surface (e.g., blocking high) and upper-level (e.g., anticyclone) features. Documented cases in the Adriatic coast and southeast Australia showed that cold front passage is often the common feature to trigger fire events or to turn relatively quiet flank fire into a potentially very active head fire. The abrupt change in wind direction and speed across the frontal zone may lead to the ‘right’ temperature and humidity gradient for rapid fire propagation. Synoptic prediction is certainly of very high standard in the current operational weather forecast practice. However, given the high sensitivity of fire occurrence to the synoptic configuration, how well is fire potential estimation based on the synoptic forecast products? This could be a focus of GCM and NWP model evaluation.
Progressing to the meso-micro scale, we have reviewed that many fire events from both Croatia and southeast Australia have been associated with orographic flow, namely the bura in the Adriatic coast region and, elsewhere, flows subject to the foehn effect (e.g., [173,174]). In these local wind systems, often, mountain waves transport turbulent kinetic energy to the surface and may intensify the fire. Theories such as the hydraulic jump mechanism (e.g., [80,175]) have been developed for such downslope wind systems. Moreover, it is well-known that strong downslope winds often accompany severe wildfire events in other parts of the world such as west coast U.S. [13,176,177,178]. It is thus highly desirable that the studies on the dynamics and predictability of these local wind systems for different parts of the world be integrated into a knowledge base, such that the fire research community can benefit from it.
Similar to the issue of synoptic predictability relevant to fire potential estimate, the local wind systems relevant to fire development also impose great challenges to meso-micro-scale modelling. In recent years, the international fire weather research community has benefited from the development of coupled fire–atmosphere models, which have provided an opportunity to resolve physical processes and feedbacks between a fire and the atmosphere in order to better understand and predict wildfire behaviour. This is important because, while the fundamental dynamics of topography-related wind systems require better understanding, there are many mechanisms of fire–atmosphere interaction that affect the quality of fire behaviour prediction. These mechanisms include the vertical stability influence on pyroconvection and fire front interaction with the LLJ, as have been reviewed in the earlier sections. In addition, the quality of fuel load representation in coupled models is a critical issue (i.e., a broad fire–atmosphere–land coupling issue) when realistic fire simulations are the ultimate goal of the modelers. These kinds of sophisticated models have been used to simulate various cases of wildfires in Australia (e.g., [38,179,180]). The research from Australia suggests that the coupled simulations provide a valid representation of real-world fire growth processes. However, a coupled fire–atmosphere model has not been implemented in any Croatian wildfire cases or LLJ situations. The results from such a model would give insights into fire–atmosphere interactions that can occur along the Adriatic coast, which possess similarities and dissimilarities with the Australian fire events according to the review presented above.
Besides the importance of the local wind systems interacting with wildfire activity, high temperature and dryness are also critical issues. It is certainly too simplistic to separate the wildfire events between ‘wind-driven’ and ‘heat-driven’ (e.g., considering the effect of winds on surface evapotranspiration); our reviews have also shown that, in certain fire events, indeed, the abrupt drop in near-surface humidity is the major driver of fire occurrence. The mechanisms we have mentioned include boundary layer mixing of dry layer aloft and subsidence processes, which may be synoptic or mesoscale, of dry air. The study of these processes through observations and realizations based on numerical models are no less important than those for local wind systems.

6.2. Concluding Remarks

To conclude, the major meteorological and climate conditions of wildfire events in Croatia along the Adriatic coast and those in southeast Australia including Tasmania have been reviewed. How the researchers from these two regions have applied different weather indices and numerical model sophistications has also been discussed. With a future perspective, the status of estimating fire potential under climate change for both regions has been evaluated. New knowledge from this comparative study can contribute to a better understanding of the dynamics of those complex interactions between land, atmosphere and human influence, in order to improve fire weather forecasts, firefighting and risk management for both geographic regions.

Author Contributions

Conceptualization, I.Č.T., K.K.W.C. and V.V.; methodology, I.Č.T., K.K.W.C., V.V. and P.F.-H.; software, I.Č.T.; investigation, I.Č.T.; resources, I.Č.T. and V.V.; writing—original draft preparation, I.Č.T. and K.K.W.C.; writing—review and editing, I.Č.T., K.K.W.C., V.V. and P.F.-H.; visualization, I.Č.T.; supervision, K.K.W.C., V.V. and P.F.-H.; project administration, K.K.W.C. and V.V.; All authors have read and agreed to the published version of the manuscript.

Funding

This research received no external funding.

Informed Consent Statement

Not applicable.

Data Availability Statement

Not applicable.

Acknowledgments

The first author (IČT) is supported by the Macquarie University Cotutelle Scholarship with the University of Zagreb, Croatia. Figure 1 was used under the Creative Commons Attribution 4.0 international License. We thank the journal Climate Research under Inter-Research Science Publisher for granting us the license to use Figure 6 (Figure 1 of Hasson et al. 2009).

Conflicts of Interest

The authors declare no conflict of interest.

References

  1. McAneney, J.; Sandercock, B.; Crompton, R.; Mortlock, T.; Musulin, R.; Pielke, R.; Gissing, A. Normalised insurance losses from Australian natural disasters: 1966–2017. Environ. Hazards 2019, 18, 414–433. [Google Scholar] [CrossRef] [Green Version]
  2. Zscheischler, J.; Westra, S.; Van Den Hurk, B.J.J.M.; Seneviratne, S.I.; Ward, P.J.; Pitman, A.; Aghakouchak, A.; Bresch, D.N.; Leonard, M.; Wahl, T.; et al. Future climate risk from compound events. Nat. Clim. Change 2018, 8, 469–477. [Google Scholar] [CrossRef]
  3. Di Virgilio, G.; Evans, J.P.; Blake, S.A.P.; Armstrong, M.; Dowdy, A.J.; Sharples, J.; McRae, R. Climate change increases the potential for extreme wildfires. Geophys. Res. Lett. 2019, 46, 8517–8526. [Google Scholar] [CrossRef]
  4. Ruffault, J.; Curt, T.; Moron, V.; Trigo, R.M.; Mouillot, F.; Koutsias, N.; Pimont, F.; Martin-St Paul, N.; Barbero, R.; Dupuy, J.L.; et al. Increased likelihood of heat-induced large wildfires in the Mediterranean basin. Sci. Rep. 2020, 10, 13790. [Google Scholar] [CrossRef]
  5. Brey, S.J.; Barnes, E.A.; Pierce, J.R.; Swann, A.L.S.; Fischer, E.V. Past variance and future projections of the environmental conditions driving western U.S. summertime wildfire burn area. Earths Future 2021, 9. [Google Scholar] [CrossRef]
  6. Vitolo, C.; Di Giuseppe, F.; Barnard, C.; Coughlan, R.; San-Miguel-Ayanz, J.; Libertá, G.; Krzeminski, B. ERA5-based global meteorological wildfire danger maps. Sci. Rep. 2020, 7, 216. [Google Scholar] [CrossRef]
  7. Chen, B.; Jin, Y.; Scaduto, E.; Moritz, M.A.; Goulden, M.L.; Randerson, J.T. Climate, fuel, and land use shaped the spatial pattern of wildfire in California’s Sierra Nevada. J. Geophys. Res. Biogeosci. 2021, 126. [Google Scholar] [CrossRef]
  8. Abatzoglou, J.T.; Hatchett, B.J.; Fox-Hughes, P.; Gershunov, A.; Nauslar, N.J. Global climatology of synoptically-forced downslope winds. Int. J. Climatol. 2020, 41, 1–20. [Google Scholar] [CrossRef]
  9. Potter, B.E. Atmospheric interactions with wildland fire behaviour—I. Basic surface interactions, vertical profiles and synoptic structures. Int. J. Wildland Fire 2012, 21, 779–801. [Google Scholar] [CrossRef]
  10. VBRC (Victorian Bushfire Royal Commission). The Fires and the Fire-Related Deaths; Final report; Victoria Government: Melbourne, Australia, 2009; Volume 1.
  11. Lagouvardos, K.; Kotroni, V.; Giannaros, T.M.; Dafis, S. Meteorological conditions conducive to the rapid spread of the deadly wildfire in Eastern Attica, Greece. Bull. Am. Meteorol. Soc. 2019, 100, 2137–2145. [Google Scholar] [CrossRef]
  12. Brown, T.; Leach, S.; Wachter, B.; Gardunio, B. The northern California 2018 extreme fire season. In ‘Explaining extremes of 2018 from a climate perspective’. Bull. Am. Meteorol. Soc. 2020, 101, S1–S4. [Google Scholar] [CrossRef] [Green Version]
  13. Mass, C.F.; Ovens, D. The synoptic and mesoscale evolution accompanying the 2018 camp fire of Northern California. Bull. Am. Meteorol. Soc. 2021, 102, E168–E192. [Google Scholar] [CrossRef]
  14. Wllis, S.; Kanowski, P.; Whelan, R. National Inquiry on Bushfire Mitigation and Management; Council of Australian Government (COAG): Canberra, Australia, 2004.
  15. Cheney, N.P. Bushfire Disasters in Australia, 1945–1975. Aust. For. 1976, 39, 245–268. [Google Scholar] [CrossRef]
  16. Borchers Arriagada, N.; Palmer, A.J.; Bowman, D.; Morgan, G.G.; Jalaludin, B.B.; Johnston, F.H. Unprecedented smoke-related health burden associated with the 2019–2020 bushfires in eastern Australia. Med. J. Aust. 2020, 213, 282–283. [Google Scholar] [CrossRef] [PubMed]
  17. Burgess, T.; Burgmann, J.R.; Hall, S.; Holmes, D.; Turner, E. Black Summer: Australian Newspaper Reporting on the Nation’s Worst Bushfire Season; Monash Climate Change Communication Research Hub; Monash University: Melbourne, Australia, 2020; 30p. [Google Scholar]
  18. Tariq, A.; Shu, H.; Li, Q.; Altan, O.; Riaz Khan, M.; Fahad Baqa, M.; Lu, L. Quantitative analysis of forecast fires in Southeastern Australia using SAR data. Remote Sens. 2021, 13, 2386. [Google Scholar] [CrossRef]
  19. McCaw, W.L. Managing forest fuels using prescribed fire—A perspective from southern Australia. For. Ecol. Manag. 2013, 294, 217–224. [Google Scholar] [CrossRef]
  20. You, C.; Yao, T.; Xu, C. Recent increases in wildfires in the Himalayas and surrounding regions detected in central Tibetan ice core records. J. Geophys. Res. Atmos. 2018, 123, 3285–3291. [Google Scholar] [CrossRef]
  21. Barlow, J.; Berenguer, E.; Carmenta, R.; França, F. Clarifying Amazonia’s burning crisis. Glob. Change Biol. 2019, 26, 319–321. [Google Scholar] [CrossRef] [Green Version]
  22. Bento-Gançalves, A.; Vieira, A. Wildfires in the wildland-urban interface: Key concepts and evaluation methodologies. Sci. Total Environ. 2019, 707, 135592. [Google Scholar] [CrossRef]
  23. Williams, J. Exploring the onset of high-impact mega-fires through a forest land management prism. For. Ecol. Manag. 2013, 294, 4–10. [Google Scholar] [CrossRef]
  24. San-Miguel-Ayanz, J.; Moreno, J.M.; Camia, A. Analysis of large fires in European Mediterranean landscapes: Lessons learned and perspectives. For. Ecol. Manag. 2013, 294, 11–22. [Google Scholar] [CrossRef]
  25. Dimitrakopoulos, A.; Gogi, C.; Stamatelos, G.; Mitsopoulos, I. Statistical analysis of the fire environment of large forest fires (>1000 ha) in Greece. Pol. J. Environ. Stud. 2011, 20, 327–332. [Google Scholar]
  26. Coen, J.L.; Stavros, E.N.; Fites-Kaufman, J.A. Deconstructing the King megafire. Ecol. Appl. 2018, 28, 1565–1580. [Google Scholar] [CrossRef] [PubMed]
  27. De la Barrera, F.; Barraza, F.; Favier, P.; Ruiz, V.; Quense, J. Megafires in Chile 2017: Monitoring multiscale environmental impacts of burned ecosystems. Sci. Total Environ. 2018, 637–638, 1526–1536. [Google Scholar] [CrossRef] [PubMed]
  28. Stephens, S.L.; Burrows, N.; Buyantuyev, A.; Gray, R.W.; Keane, R.E.; Kubian, R.; Liu, S.; Seijo, F.; Shu, L.; Tolhurst, K.G.; et al. Temperate and boreal forest mega-fires: Characteristics and challenges. Front. Ecol. Environ. 2014, 12, 115–122. [Google Scholar] [CrossRef] [Green Version]
  29. Strauss, D.; Bednar, L.; Mees, R. Do one percent of forest fires cause ninety-nine percent of the damage? For. Sci. 1989, 35, 319–328. [Google Scholar]
  30. Bartlett, T.; Leonard, M.; Morgan, G. The megafire phenomenon: Some Australian perspectives. In The 2007 Institute of Foresters of Australia and New Zealand Institute of Forestry Conference: Programme, Abstracts and Papers; Institute of Foresters of Australia: Canberra, Australia, 2007. [Google Scholar]
  31. Buckland, M.K. What is a Megafire? Defining the Social and Physical Dimensions of Extreme U.S. Wildfires (1988–2014). Master’s Thesis, Department of Geography, Faculty of the Graduate School, University of Colorado, Boulder, CO, USA, 2019. [Google Scholar]
  32. Vines, R.G. Physics and chemistry of rural fires. In Fire and the Australian Biota; Gill, A.M., Groves, R.H., Noble, I.R., Eds.; Australian Academy of Sciences: Canberra, Australia, 1981; pp. 129–149. [Google Scholar]
  33. Sharples, J.J.; Cary, G.J.; Fox-Hughes, P.; Mooney, S.; Evans, J.P.; Fletcher, M.S.; Fromm, M.; Grierson, P.F.; McRae, R.; Baker, P. Natural hazards in Australia: Extreme bushfire. Clim. Change 2016, 139, 85–99. [Google Scholar] [CrossRef]
  34. Potter, B.E. Atmospheric interactions with wildland fire behaviour—II. Plume and vortex dynamics. Int. J. Wildland Fire 2012, 21, 802–817. [Google Scholar] [CrossRef]
  35. Dowdy, A.J.; Fromm, M.D.; McCarthy, N. Pyrocumulonimbus lightning and fire ignition on Black Saturday in southeast Australia. J. Geophys. Res. Atmos. 2017, 122, 7342–7354. [Google Scholar] [CrossRef]
  36. McRae, R.; Sharples, J.J.; Wilkes, S.R.; Walker, A. An Australian pyro-tornadogenesis event. Nat. Hazards 2013, 65, 1801–1811. [Google Scholar] [CrossRef]
  37. Laureau, N.P.; Nauslar, N.J.; Abatzoglou, J.T. The Carr fire vortex: A case of pyrotornadogenesis? Geophys. Res. Lett. 2019, 45, 107–113. [Google Scholar] [CrossRef]
  38. Peace, M.; Hanstrum, B.; Greenslade, J.; Zovko-Rajak, D.; Santra, A.; Kepert, J.; Fox-Hughes, P.; Ye, H.; Shermin, T.; Jones, J. Coupled Fire-Atmosphere Simulations of Five Black Summer Fires Using the ACCESS-Fire Model—Black Summer Final Report; Bushfire and Natural Hazards CRC: Melbourne, Australia, 2021. [Google Scholar]
  39. Cunningham, P.; Reeder, M.J. Severe convective storms initiated by intense wildfires: Numerical simulations of pyro-convection and pyro-tornadogenesis. Geophys. Res. Lett. 2009, 36, L12812. [Google Scholar] [CrossRef]
  40. Fromm, M.; Tupper, A.; Rosenfeld, D.; Servranck, R.; McRae, R. Violent pyro-convective storm devastates Australia’s capital and pollutes the stratosphere. Geophys. Res. Lett. 2006, 33, L05815. [Google Scholar] [CrossRef]
  41. Cruz, M.G.; Sullivan, A.L.; Gould, J.S.; Sims, N.C.; Bannister, A.J.; Hollis, J.J.; Hurley, R.J. Anatomy of a catastrophic wildfire: The Black Saturday Kilmore East fire in Victoria, Australia. For. Ecol. Manag. 2012, 284, 269–285. [Google Scholar] [CrossRef]
  42. Field, R.D.; Luo, M.; Fromm, M.; Voulgarakis, A.; Mangeon, S.; Worden, J. Simulating the Black Saturday 2009 smoke plume with an interactive composition-climate model: Sensitivity to emissions amount, timing, and injection height. J. Geophys. Res. Atmos. 2016, 121, 4296–4316. [Google Scholar] [CrossRef] [PubMed] [Green Version]
  43. Ndalila, M.N.; Williamson, G.J.; Fox-Hughes, P.; Sharples, J.; Bowman, D.M.J.S. Evolution of an extreme pyrocumulonimbus-driven wildfire event in Tasmania, Australia. Nat. Hazards Earth Syst. Sci. 2019, 20, 1497–1511. [Google Scholar] [CrossRef]
  44. Peterson, D.A.; Campbell, J.R.; Hyer, E.J.; Fromm, M.D.; Kablick, P., III; Cossuth, J.H.; Deland, M.T. Wildfire-driven thunderstorms cause a volcano-like stratospheric injection of smoke. Npj Clim. Atmos. Sci. 2018, 1, 30. [Google Scholar] [CrossRef] [Green Version]
  45. Peterson, D.A.; Fromm, M.D.; McRae, R.H.; Campbell, J.R.; Hyer, E.J.; Taha, G.; Camacho, C.P.; Kablick, G.P.; Schmidt, C.C.; DeLand, M.T. Australia’s Black Summer pyrocumulonimbus super outbreak reveals potential for increasingly extreme stratospheric smoke events. Npj Clim. Atmos. Sci. 2021, 4, 1–16. [Google Scholar] [CrossRef]
  46. Mifka, B.; Vučetić, V. Weather analysis during extreme forest fire on island of Brač from 14 to 17 July 2011. Firef. Manag. 2012, 1, 13–25. (In Croatian) [Google Scholar]
  47. Werth, P.A.; Potter, B.E.; Clements, C.B.; Finney, M.A.; Forthofer, J.A.; McAllister, S.S.; Goodrick, S.L.; Alexander, M.E.; Cruz, M.G. Synthesis of Knowledge of Extreme Fire Behavior: Volume I for Fire Managers, JFSP Synthesis Reports; Department of Agriculture, Forest Service: Portland, OR, USA, 2011.
  48. Werth, P.A. Critical fire weather patterns. Fire Manag. Today 2017, 1, 28–32. [Google Scholar]
  49. Luke, R.; McArthur, A. Bushfires in Australia; Australian Government Publishing Service: Canberra, Australia, 1978. [Google Scholar]
  50. Potter, B.E. Atmospheric Properties Associated with Large Wildfires. Int. J. Wildland Fire 1996, 6, 71–76. [Google Scholar] [CrossRef]
  51. Lucas, C. On developing a historical fire weather data-set for Australia. Aust. Meteorol. Oceanogr. J. 2010, 60, 1–14. [Google Scholar] [CrossRef] [Green Version]
  52. Flannigan, M.D.; Krawchuk, M.A.; de Groot, W.J.; Wotton, B.M.; Gowman, L.M. Implications of changing climate for global wildland fire. Int. J. Wildland Fire 2009, 18, 483–507. [Google Scholar] [CrossRef]
  53. Flannigan, M.D.; Stocks, B.J.; Wotton, B.M. Climate change and forest fires. Sci. Total Environ. 2000, 262, 221–229. [Google Scholar] [PubMed]
  54. Flannigan, M.D.; Harrington, J.B. A study of the relation of meteorological variables to monthly provincial area burned by wildfire in Canada 1953–80. J. Appl. Meteorol. 1988, 27, 441–452. [Google Scholar] [CrossRef]
  55. Johnson, E.A.; Wowchuk, D.R. Wildfires in the southern Canadian Rocky Mountains and their relationship to mid-tropospheric anomalies. Can. J. For. Res. 1993, 23, 1213–1222. [Google Scholar] [CrossRef]
  56. Swetnam, T.W. Fire history and climate change in giant sequoia groves. Science 1993, 262, 885–889. [Google Scholar] [CrossRef]
  57. Flannigan, M.D.; Logan, K.A.; Amiro, B.D.; Skinner, W.R.; Stocks, B.J. Future Area Burned in Canada. Clim. Change 2005, 72, 1–16. [Google Scholar] [CrossRef]
  58. Turco, M.; Von Hardenberg, J.; AghaKouchak, A.; Llasat, M.C.; Provenzale, A.; Trigo, R.M. On the key role of droughts in the dynamics of summer fires in Mediterranean Europe. Sci. Rep. 2017, 7, 81. [Google Scholar] [CrossRef] [Green Version]
  59. Millán, M.M.; Estrela, M.J.; Badenas, C. Meteorological processes relevant to forest fire dynamics on the Spanish Mediterranean coast. J. Appl. Meteorol. 1998, 37, 83–100. [Google Scholar] [CrossRef]
  60. Lionello, P.; Malanotte-Rizzoli, P.; Boscolo, R.; Alpert, P.; Artale, V.; Li, L.; Luterbacher, J.; May, W.; Trigo, R.M.; Tsimplis, M.; et al. The Mediterranean climate: An overview of the main characteristics and issues. In Mediterranean, Developments in Earth and Environmental Sciences; Lionello, P., Malanotte-Rizzoli, P., Boscolo, R., Eds.; Elsevier: Amsterdam, The Netherlands, 2006; pp. 1–26. [Google Scholar] [CrossRef]
  61. Scorer, R.S. Mountain-gap winds: A study of surface winds at Gibraltar. Q. J. R. Meteorol. Soc. 1952, 78, 53–61. [Google Scholar] [CrossRef]
  62. Hoinka, K.P.; de Castro, M. The Iberian Peninsula thermal low. Q. J. R. Meteorol. Soc. 2003, 129, 1491–1511. [Google Scholar] [CrossRef] [Green Version]
  63. Jézéquel, A.; Cattiaux, J.; Naveau, P.; Radanovics, S.; Ribes, A.; Vautard, R.; Vrac, M.; Yiou, P. Trends of atmospheric circulation during singular hot days in Europe. Environ. Res. Lett. 2018, 13, 54007. [Google Scholar] [CrossRef]
  64. Sousa, P.M.; Trigo, R.M.; Barriopedro, D.; Soares, P.M.M.; Santos, J.A. European temperature responses to blocking and ridge regional patterns. Clim. Dyn. 2018, 50, 457–477. [Google Scholar] [CrossRef]
  65. Fink, A.H.; Brücher, T.; Krüger, A.; Leckebusch, G.C.; Pinto, J.G.; Ulbrich, U. The 2003 European summer heatwaves and drought—Synoptic diagnosis and impacts. Weather 2004, 59, 209–216. [Google Scholar] [CrossRef] [Green Version]
  66. Pereira, M.G.; Trigo, R.M.; Da Camara, C.C.; Pereira, J.M.C.; Leite, S.M. Synoptic patterns associated with large summer forest fires in Portugal. Agric. For. Meteorol. 2005, 129, 11–25. [Google Scholar] [CrossRef]
  67. Trigo, R.M.; Pereira, J.M.C.; Pereira, M.G.; Mota, B.; Calado, T.J.; Dacamara, C.C.; Santo, F.E. Atmospheric conditions associated with the exceptional fire season of 2003 in Portugal. Int. J. Climatol. 2006, 26, 1741–1757. [Google Scholar] [CrossRef]
  68. Amraoui, M.; Liberato, M.L.R.; Calado, T.J.; DaCamara, C.C.; Coelho, L.P.; Trigo, R.M.; Gouveia, C.M. Fire activity over Mediterranean Europe based on information from Meteosat-8. For. Ecol. Manag. 2013, 294, 62–75. [Google Scholar] [CrossRef]
  69. Rasilla, D.F.; García-Codron, J.C.; Carracedo, V.; Diego, C. Circulation patterns, wildfire risk and wildfire occurrence at continental Spain. Phys. Chem. Earth 2010, 35, 553–560. [Google Scholar] [CrossRef]
  70. Cardil, A.; Eastaugh, C.S.; Molina, D.M. Extreme temperature conditions and wildland fires in Spain. Theor. Appl. Climatol. 2015, 122, 219–228. [Google Scholar] [CrossRef]
  71. Trigo, R.M.; Sousa, P.M.; Pereira, M.G.; Rasilla, D.; Gouveia, C.M. Modelling wildfire activity in Iberia with different atmospheric circulation weather types. Int. J. Climatol. 2016, 36, 2761–2778. [Google Scholar] [CrossRef]
  72. Cardil, A.; Salis, M.; Spano, D.; Delogu, G.; Molina, T.D. Large wildland fires and extreme temperatures in Sardinia (Italy). iForest 2014, 7, 161–168. [Google Scholar] [CrossRef] [Green Version]
  73. Kassomenos, P. Synoptic circulation control on wild fire occurrence. Phys. Chem. Earth 2010, 35, 544–552. [Google Scholar] [CrossRef]
  74. Papadopoulos, A.; Paschalidou, A.K.; Kassomenos, P.A.; McGregor, G. Investigating the relationship of meteorological/climatological conditions and wildfires in Greece. Theor. Appl. Climatol. 2013, 112, 113–126. [Google Scholar] [CrossRef]
  75. Levin, N.; Saaroni, H. Fire weather in Israel—Synoptic climatological analysis. GeoJournal 1999, 47, 523–538. [Google Scholar] [CrossRef]
  76. Newark, M.J. The relationship between forest fire occurrence and 500-mb longwave ridging. Atmosphere 1975, 13, 26–33. [Google Scholar] [CrossRef] [Green Version]
  77. Skinner, W.R.; Stocks, B.J.; Martell, D.L.; Bonsal, B.; Shabbar, A. The association between circulation anomalies in the mid-troposphere and area burned by wildland fire in Canada. Theor. Appl. Climatol. 1999, 63, 89–105. [Google Scholar] [CrossRef]
  78. Nimchuk, N. Wildfire Behavior Associated with Upper Ridge Breakdown, Report Number T/50; Alberta Energy and Natural Resources Forest Service: Edmonton, AB, Canada, 1983. [Google Scholar]
  79. Efimov, V.V.; Stanichnyi, S.V.; Shokurov, M.V.; Yarovaya, D.A. Observations of a quasi-tropical cyclone over the Black Sea. Russ. Meteorol. Hydrol. 2008, 33, 233239. [Google Scholar] [CrossRef]
  80. Kartsios, S.; Karacostas, T.; Pytharoulis, I.; Dimitrakopoulos, A.P. Numerical investigation of atmosphere-fire interactions during high-impact wildland fire events in Greece. Atmos. Res. 2021, 247, 105253. [Google Scholar] [CrossRef]
  81. Barešić, D. The Impact of Climate Change on the Potential Risk of Forest Fires in Croatia. Master’s Thesis, Faculty of Science, University of Zagreb, Zagreb, Croatia, 2011. (In Croatian). [Google Scholar]
  82. DUSZ (National Protection and Rescue Directorate). Report on the Realization of the Program of Activities in the Implementation of Special Measures of Protection from Forest Fires in Republic of Croatia in 2017; National Protection and Rescue Directorate: Zagreb, Croatia, 2018. (In Croatian) [Google Scholar]
  83. Tomašević, I.Č.; Cheung, K.K.W.; Vučetić, V.; Fox-Hughes, P.; Horvath, K.; Prtenjak, M.T.; Beggs, P.J.; Malečić, B.; Milić, V. The 2017 Split wildfire in Croatia: Evolution and the role of meteorological conditions. Nat. Hazards Earth Syst. Sci. 2022; submitted. [Google Scholar]
  84. Vučetić, M. Meteorological conditions of a catastrophic forest fire on Korčula in 1985. Croat. Meteorol. J. (Rasprave) 1987, 22, 67–72. (In Croatian) [Google Scholar]
  85. Vučetić, M. Weather phenomena during the 13–31 July 1990 forest fire on the island of Hvar. Croat. Meteorol. J. 1992, 27, 69–76. (In Croatian) [Google Scholar]
  86. Vučetić, M. The influence of weather condition on forest fire on the island of Hvar, 28 July–4 August 1997. In Proceedings of the International Conference on Forest Fire Research and 14th Conference on Fire and Forest Meteorology, Luso, Portugal, 16–20 November 1998; pp. 1295–1303. [Google Scholar]
  87. Vučetić, M.; Vučetić, V. Different types of the forest fires on the Croatian coast. In Forest Fires: Needs & Innovations; Organised by CINAR: Athens, Greece, 1999; pp. 365–369. [Google Scholar]
  88. Byram, G.M. Atmospheric Conditions Related to Blowup Fires, Station Paper SE-SP-35, USDA-Forest Service; Southeastern Forest Experiment Station: Asheville, NC, USA, 1954. [Google Scholar]
  89. Vučetić, V.; Ivatek Šahdan, S.; Tudor, M.; Kraljević, L.; Ivančan-Picek, B.; Strelec-Mahović, N. Weather analysis during the Kornat fire on 30 August 2007. Croat. Meteorol. J. 2007, 42, 41–65. (In Croatian) [Google Scholar]
  90. Vučetić, M.; Vučetić, V. Fire risk analysis during the Kornat fire on 30 August 2007. Firef. Manag. 2011, 1, 12–25. (In Croatian) [Google Scholar]
  91. Tomašević, I. Vertical Atmospheric Profiles during the Large Wild-Land Fires. Master’s Thesis, Faculty of Science, University of Zagreb, Zagreb, Croatia, 2012. (In Croatian). [Google Scholar]
  92. Vučetić, V.; Čavlina Tomašević, I.; Mifka, B. Low level jet and large wildfires in Croatia. In Proceedings of the 6th International Fire Behavior and Fuels Conference, Marseille, France, 29 April–3 May 2019. [Google Scholar]
  93. Kozarić, T.; Mokorić, M. Kvarner fire 23rd and 24th July 2012—Weather analysis. Firef. Manag. 2012, 2, 53–66. (In Croatian) [Google Scholar]
  94. Mills, G.H. A re-examination of the synoptic and mesoscale meteorology of Ash Wednesday 1983. Aust. Met. Mag. 2005, 54, 35–55. [Google Scholar]
  95. Omazić, B.; Vučetić, V. Weather condition analysis during wildfires on the Pelješac Peninsula in July 2015. Firef. Manag. 2017, 7, 6–23. (In Croatian) [Google Scholar]
  96. Westerling, A.L.; Cayan, D.R.; Brown, T.J.; Hall, B.L.; Riddle, L.G. Climate, Santa Ana winds and autumn wildfires in southern California. Eos Trans. AGU 2004, 85, 289–296. [Google Scholar] [CrossRef]
  97. Kuraži, D.; Vučetić, V. Weather analysis of a large forest fire on Mount Strahinjčica in March 2012. Firef. Manag. 2015, 5, 5–16. (In Croatian) [Google Scholar]
  98. Foley, J.C. A Study of Meteorological Conditions Associated with Bush and Grass Fires and Fire Protection Strategy in Australia, Bulletin Number 38; Bureau of Meteorology: Melbourne, Australia, 1947.
  99. Reeder, M.J.; Smith, R.K. Australian spring and summer cold fronts. Aust. Meteorol. Mag. 1992, 41, 101–124. [Google Scholar]
  100. Mills, G.A. A case of coastal interaction with a cool change. Aust. Meteorol. Mag. 2002, 51, 203–211. [Google Scholar]
  101. Mills, G.A.; Pendlebury, S. Processes leading to a severe windshear incident at Hobart Airport. Aust. Meteorol. Mag. 2003, 52, 171–188. [Google Scholar]
  102. Reeder, M.J.; Smith, R.K. Mesoscale meteorology. In Meteorology of the Southern Hemisphere; Vincent, D., Karoly, D.J., Eds.; American Meteorological Society: Boston, MA, USA, 1998; pp. 201–241. [Google Scholar]
  103. Reeder, M.J.; Spengler, T.; Musgrave, R. Rossby waves, extreme fronts, and wildfires in southeastern Australia. Geophys. Res. Lett. 2015, 42, 2015–2023. [Google Scholar] [CrossRef]
  104. Long, M. A climatology of extreme fire weather days in Victoria. Aust. Met. Mag. 2006, 55, 3–18. [Google Scholar]
  105. BoM (Bureau of Meteorology). Meteorological Aspects of the 7 February 2009 Victorian Fires, An Overview. Bureau of Meteorology Report for the 2009 Victorian Bushfires Royal Commission; Bureau of Meteorology: Melbourne, Australia, 2009.
  106. Engel, C.B.; Lane, T.P.; Reeder, M.J.; Rezny, M. The meteorology of Black Saturday. Q. J. R. Meteorol. Soc. 2013, 139, 585–599. [Google Scholar] [CrossRef]
  107. Bond, H.G.; Mackinnon, K.; Noar, P.F. Report on the Meteorological Aspects of the Catastrophic Bushfires in the South-Eastern Tasmania on 7 February 1967; Bureau of Meteorology: Melbourne, Australia, 1967.
  108. BoM (Bureau of Meteorology). Tasmanian Bushfires Inquiry; Bureau of Meteorology: Hobart, Australia, 2013.
  109. Collins, L.; Bradstock, R.A.; Clarke, H.; Clarke, M.F.; Nolan, R.H.; Penman, T.D. The 2019/2020 mega-fires exposed Australian ecosystems to an unprecedented extent of high-severity fire. Environ. Res. Lett. 2021, 16, 044029. [Google Scholar] [CrossRef]
  110. Hasson, A.E.A.; Mills, G.A.; Timbal, B.; Walsh, K. Assessing the impact of climate change on extreme fire weather events over southeastern Australia. Clim. Res. 2009, 39, 159–172. [Google Scholar] [CrossRef] [Green Version]
  111. Grose, M.R.; Fox-Hughes, P.; Harris, R.M.B.; Bindoff, N.L. Changes to the drivers of fire weather with a warming climate—A case study of southeast Tasmania. Clim. Change 2014, 124, 255–269. [Google Scholar] [CrossRef]
  112. Sharples, J.J.; Mills, G.A.; McRae, R.H.D.; Weber, R.O. Foehn-Like winds and elevated fire danger conditions in southeastern Australia. J. Appl. Meteorol. Climatol. 2010, 49, 1067–1095. [Google Scholar] [CrossRef]
  113. Brinkmann, W.A.R. What is a foehn? Weather 1971, 26, 230–239. [Google Scholar] [CrossRef]
  114. Whiteman, C.D. Mountain Meteorology: Fundamentals and Applications; Oxford University Press: New York, NY, USA, 2000. [Google Scholar]
  115. McArthur, A.G. Fire Behaviour in Eucalypt Forests, Leaflet Number 107; Commonwealth of Australia Department of National Development, Forestry and Timber Bureau: Canberra, Australia, 1967.
  116. Fox-Hughes, P.; Harris, R.M.B.; Lee, G.; Grose, M.R.; Bindoff, N.L. Future fire danger climatology for Tasmania, Australia, using a dynamically downscaled regional climate model. Int. J. Wildland Fire 2014, 23, 309–321. [Google Scholar] [CrossRef]
  117. Marsh, L. Fire Weather Forecasting in Tasmania, Meteorological Note 171; Bureau of Meteorology: Melbourne, Australia, 1987; 47p.
  118. Fox-Hughes, P. Springtime fire weather in Tasmania, Australia: Two case studies. Weather Forecast. 2012, 27, 379–395. [Google Scholar] [CrossRef] [Green Version]
  119. Mills, G.A. Abrupt surface drying and fire weather Part 1: Overview and case study of the South Australian fires of 11 January 2005. Aust. Meteorol. Mag. 2008, 57, 299–309. [Google Scholar]
  120. Mills, G.A. Abrupt surface drying and fire weather Part 2: A preliminary synoptic climatology in the forested areas of southern Australia. Aust. Meteorol. Mag. 2008, 57, 311–328. [Google Scholar]
  121. Haines, D.A. A lower atmosphere severity index for wildlife fires. Natl. Weather Dig. 1988, 13, 23–27. [Google Scholar]
  122. Bally, J. The Haines Index as a predictor of fire activity in Tasmania. In Proceedings of the Bushfire ’95, Australian Bushfire Conference, Hobart, Australia, 27–30 September 1995. [Google Scholar]
  123. BoM (Bureau of Meteorology). Fire Weather Directive—Tasmania and Antarctic Regional Office; Bureau of Meteorology: Hobart, Australia, 2008; 53p.
  124. Mills, G.A.; McCaw, L. Atmospheric Stability Environments and Fire Weather in Australia—Extending the Haines Index, CAWCR Technical Report No. 20; Centre for Australian Weather and Climate Research: Melbourne, Australia, 2010.
  125. Tory, K.J.; Kepert, J.D. Pyrocumulonimbus Firepower Threshold: Assessing the atmospheric potential for pyroCb. Weather Forecast. 2021, 36, 439–456. [Google Scholar] [CrossRef]
  126. Turco, M.; Rosa-Cánovas, J.J.; Bedia, J.; Jerez, S.; Montávez, J.P.; Llasat, M.C.; Provenzale, A. Exacerbated fires in Mediterranean Europe due to anthropogenic warming projected with nonstationary climate-fire models. Nat. Commun. 2018, 9, 3821. [Google Scholar] [CrossRef]
  127. IPCC. Climate Change 2021: The Physical Science Basis. In Contribution of Working Group I to the Sixth Assessment Report of the Intergovernmental Panel on Climate Change; Masson-Delmotte, V., Zhai, P., Pirani, A., Connors, S.L., Péan, C., Berger, S., Caud, N., Chen, Y., Goldfarb, L., Gomis, M.I., et al., Eds.; Cambridge University Press: London, UK, 2021. [Google Scholar]
  128. Nicholls, N. The changing nature of Australian droughts. Clim. Change 2004, 63, 323–336. [Google Scholar] [CrossRef]
  129. Hennessy, K.; Lucas, C.; Nicholls, N.; Bathols, J.; Suppiah, R.; Ricketts, J. Climate Change Impacts on Fire Weather in Southeast Australia. CSIRO Marine and Atmospheric Research Report; CSIRO Marine and Atmospheric Research: Aspendale, Australia, 2005. [Google Scholar]
  130. Nolan, R.H.; Boer, M.M.; Collins, L.; Resco de Dios, V.; Clarke, H.G.; Jenkins, M.; Kenny, B.; Bradstock, R.A. Causes and consequences of eastern Australia’s 2019–20 season of mega-fires. Glob. Change Biol. 2020, 26, 1039–1041. [Google Scholar] [CrossRef] [Green Version]
  131. Abram, N.J.; Henley, B.J.; Gupta, A.S.; Lippmann, T.J.; Clarke, H.; Dowdy, A.J.; Sharples, J.J.; Nolan, R.H.; Zhang, T.; Wooster, M.J.; et al. Connections of climate change and variability to large and extreme forest fires in southeast Australia. Commun. Earth Environ. 2021, 2, 1–17. [Google Scholar] [CrossRef]
  132. Van Oldenborgh, G.J.; Krikken, F.; Lewis, S.; Leach, N.J.; Lehner, F.; Saunders, K.R.; van Weele, M.; Haustein, K.; Li, S.; Wallom, D.; et al. Attribution of the Australian bushfire risk to anthropogenic climate change. Nat. Hazards Earth Syst. Sci. 2021, 21, 941–960. [Google Scholar] [CrossRef]
  133. Kelly, L.T.; Giljohann, K.M.; Duane, A.; Aquilué, N.; Archibald, S.; Batllori, E.; Bennett, A.F.; Buckland, S.T.; Canelles, Q.; Clarke, M.F.; et al. Fire and biodiversity in the Anthropocene. Science 2020, 370. [Google Scholar] [CrossRef] [PubMed]
  134. Dowdy, A.J.; Mills, G.A.; Finkele, K.; de Groot, W. Australian Fire Weather as Represented by the McArthur Forest Fire Danger Index and the Canadian Forest Fire Weather Index. CAWCR Technical Report No. 10; Centre for Australian Weather and Climate Research: Melbourne, Australia, 2009.
  135. Fox-Hughes, P. Impact of More Frequent Observations on the Understanding of Tasmanian Fire Danger. J. Appl. Meteorol. Climatol. 2011, 50, 1617–1626. [Google Scholar] [CrossRef]
  136. Clarke, H.G.; Lucas, C.; Smith, P.L. Changes in Australian fire weather between 1973 and 2010. Int. J. Climatol. 2013, 33, 931–944. [Google Scholar] [CrossRef]
  137. Harris, S.; Mills, G.; Brown, T. Variability and drivers of extreme fire weather in fire-prone areas of south-eastern Australia. Int. J. Wildland Fire 2017, 26, 177–190. [Google Scholar] [CrossRef]
  138. Enright, N.J.; Fontaine, J.B. Climate Change and the Management of Fire-Prone Vegetation in Southwest and Southeast Australia. Geogr. Res. 2013, 52, 34–44. [Google Scholar] [CrossRef]
  139. Lucas, C.; Hennessy, K.; Mills, G.; Bathols, J. Bushfire Weather in Southeast Australia: Recent Trends and Projected Climate Change Impacts, Consultancy Report Prepared for The Climate Institute of Australia; Bureau of Meteorology Research Centre: Melbourne, Australia, 2007.
  140. Dowdy, A.J. Climatological Variability of Fire Weather in Australia. J. Appl. Meteorol. Climatol. 2018, 57, 221–234. [Google Scholar] [CrossRef]
  141. Dowdy, A.J.; Pepler, A. Pyroconvection risk in Australia: Climatological changes in atmospheric stability and surface fire weather conditions. Geophys. Res. Lett. 2018, 45, 2005–2013. [Google Scholar] [CrossRef]
  142. Clarke, H.G.; Evans, J.P. Exploring the future change space for fire weather in southeast Australia. Theor. Appl. Climatol. 2019, 136, 513–527. [Google Scholar] [CrossRef] [Green Version]
  143. Vučetić, M. Weather conditions and forest fires on the coastal area of Croatia during 2000. J. For. 2001, 7–8, 367–378. (In Croatian) [Google Scholar]
  144. Vučetić, M. Weather conditions and a comparison of the forest fire season 2001 with long-term mean values. J. For. 2002, 11–12, 563–574. (In Croatian) [Google Scholar]
  145. Bakšić, N.; Vučetić, M.; Španjol, Ž. A potential risk of fire on open space in the Republic of Croatia. Firef. Manag. 2015, 5, 30–40. (In Croatian) [Google Scholar]
  146. Tomašević, I.; Vučetić, V. Rating the fire season 2013 and comparison with the fire season 2012. Firef. Manag. 2014, 4, 19–35. (In Croatian) [Google Scholar]
  147. Vučetić, M.; Vučetić, V. Wildfire risk in Croatia using the Canadian Forest Fire Weather Index System. In Proceedings of the 6th International Fire Behavior and Fuels Conference, Marseille, France, 29 April–3 May 2019. [Google Scholar]
  148. Vučetić, M.; Vučetić, V.; Španjol, Ž.; Barčić, D.; Rosavec, R.; Mandić, A. Secular variations of monthly severity rating on the Croatian Adriatic coast during the forest fire season. For. Ecol. Manag. 2006, 234 (Suppl. 1), 251. [Google Scholar]
  149. Boegelsack, N.; Withey, J.; O’Sullivan, G.; McMartin, D. A critical examination of the relationship between wildfires and climate change with consideration of the human impact. J. Environ. Prot. Sci. 2018, 9, 461–467. [Google Scholar] [CrossRef] [Green Version]
  150. Bowman, D.M.J.; Balch, J.K.; Artaxo, P.; Bond, W.J.; Carlson, J.M.; Cochrane, M.A.; D’Antonio, C.M.; DeFries, R.S.; Doyle, J.C.; Harrison, S.P.; et al. Fire in the Earth System. Science 2009, 324, 481–484. [Google Scholar] [CrossRef]
  151. Moritz, M.A.; Parisien, M.A.; Batllori, E.; Krawchuk, M.A.; Van Dorn, J.; Ganz, D.J.; Hayhoe, K. Climate change and disruptions to global fire activity. Ecosphere 2012, 3, 49. [Google Scholar] [CrossRef]
  152. Keeley, J.E. Fire in Mediterranean climate ecosystems—A comparative overview. Isr. J. Ecol. Evol. 2012, 58, 123–135. [Google Scholar] [CrossRef]
  153. Keeley, J.E.; Syphard, A.D. Climate change and future fire regimes: Examples from California. Geosci. J. 2016, 6, 37. [Google Scholar] [CrossRef] [Green Version]
  154. Flannigan, M.D.; Cantin, A.S.; de Groot, W.J.; Wotton, M.; Newbery, A.; Gowman, L.M. Global wildland fire season severity in the 21st century. For. Ecol. Manag. 2013, 294, 54–61. [Google Scholar] [CrossRef]
  155. Giorgi, F. Climate change hot-spots. Geophys. Res. Lett. 2006, 33, L08707. [Google Scholar] [CrossRef]
  156. Rodriguesa, M.; Trigod, R.M.; Vega-Garcíaa, C.; Cardil, A. Identifying large fire weather typologies in the Iberian Peninsula. Agric. For. Meteorol. 2020, 280, 107789. [Google Scholar] [CrossRef]
  157. Bedia, J.; Herrera, S.; Camia, A.; Moreno, J.M.; Gutiérrez, J.M. Forest fire danger projections in the Mediterranean using ENSEMBLES regional climate change scenarios. Clim. Change 2014, 122, 185–199. [Google Scholar] [CrossRef] [Green Version]
  158. Turco, M.; Llasat, M.C.; Von Hardenberg, J.; Provenzale, A. Climate change impacts on wildfires in a Mediterranean environment. Clim. Change 2014, 125, 369–380. [Google Scholar] [CrossRef]
  159. Fargeon, H.; Pimont, F.; Martin-St Paul, N.; de Caceres, M.; Ruffault, J.; Barbero, R.; Dupuy, J.L. Projections of fire danger under climate change over France: Where do the greatest uncertainties lie? Clim. Change 2020, 160, 479–493. [Google Scholar] [CrossRef]
  160. Dupuy, J.L.; Fargeon, H.; Martin-St Paul, N.; Pimont, F.; Ruffault, J.; Guijarro, M.; Hernando, C.; Madrigal, J.; Fernandes, P. Climate change impact on future wildfire danger and activity in southern Europe: A review. Ann. For. Sci. 2020, 77. [Google Scholar] [CrossRef]
  161. Camia, A.; Amatulli, G.; San-Miguel-Ayanz, J. Past and Future Trends of Forest Fire Danger in Europe, JRC Scientific and Technical Reports No. 6; European Commission, Joint Research Centre: Ispra, Italy, 2008. [Google Scholar]
  162. Moriondo, M.; Good, P.; Durao, R.; Bindi, M.; Giannakopoulos, C.; Corte-Real, J. Potential impact of climate change on fire risk in the Mediterranean area. Clim. Res. 2006, 31, 85–95. [Google Scholar] [CrossRef]
  163. Williams, A.A.J.; Karoly, D.J.; Tapper, N. The sensitivity of Australian fire danger to climate change. Clim. Change 2001, 49, 171–191. [Google Scholar] [CrossRef]
  164. Cary, G.J. Importance of a changing climate for fire regimes in Australia. In Flammable Australia: The Fire Regimes and Biodiversity of a Continent; Bradstock, R.A., Williams, J.E., Gill, A.M., Eds.; Cambridge University Press: Cambridge, UK, 2002. [Google Scholar]
  165. Pitman, A.J.; Narisma, G.T.; McAneney, J. The impact of climate change on the risk of forest and grassland fires in Australia. Clim. Change 2007, 84, 383–401. [Google Scholar] [CrossRef]
  166. Bradstock, R.A.; Cohn, J.S.; Gill, A.M.; Bedward, M.; Lucas, C. Prediction of the probability of large fires in the Sydney region of south-eastern Australia using fire weather. Int. J. Wildland Fire 2009, 18, 932–943. [Google Scholar] [CrossRef]
  167. Clarke, H.G.; Smith, P.L.; Pitman, A.J. Regional signatures of future fire weather over eastern Australia from global climate models. Int. J. Wildland Fire 2011, 20, 550–562. [Google Scholar] [CrossRef]
  168. Teague, B.; McLeod, R.; Pascoe, S. 2009 Final Report Summary, Victorian Bushfires Royal Commission; Parliament of Victoria: Melbourne, Australia, 2010.
  169. Di Virgillo, G.; Evans, J.P.; Clarke, H.; Sharples, J.; Hirsch, A.L.; Hart, M.A. Climate Change Significantly Alters Future Wildfire Mitigation Opportunities in Southeastern Australia. Geophys. Res. Lett. 2020, 47. [Google Scholar] [CrossRef]
  170. Krawchuk, M.A.; Moritz, M.A.; Parisien, M.-A.; Van Dorn, J.; Hayhoe, K. Global Pyrogeography: The Current and Future Distribution of Wildfire. PLoS ONE 2009, 4, e5102. [Google Scholar] [CrossRef] [PubMed]
  171. Keegan, K.M.; Albert, M.R.; McConnell, J.R.; Baker, I. Climate change and forest fires synergistically drive widespread melt events of the Greenland Ice Sheet. Proc. Nat. Acad. Sci. USA 2014, 111, 7964–7967. [Google Scholar] [CrossRef] [PubMed] [Green Version]
  172. Andela, N.; Morton, D.C.; Giglio, L.; Chen, Y.; van der Werf, G.F.; Kasibhatla, P.S.; DeFries, R.S.; Collatz, R.J.; Hantson, S.; Kloster, S.; et al. A human-driven decline in global burned area. Science 2017, 356, 1356–1362. [Google Scholar] [CrossRef] [Green Version]
  173. Grisogono, B.; Belušić, D. A review of recent advances in understanding the meso- and micro-scale properties of the severe Bora wind. Tellus A Dyn. Meteorol. Oceanogr. 2009, 61, 1–16. [Google Scholar] [CrossRef]
  174. Romanić, D. Local winds of Balkan Peninsula. Int. J. Climatol. 2019, 39, 117. [Google Scholar] [CrossRef] [Green Version]
  175. Juliano, T.W.; Parish, T.R.; Rahn, D.A.; Leon, D.C. An atmospheric hydraulic jump in the Santa Barbara Channel. J. Appl. Meteorol. Climatol. 2017, 56, 29812998. [Google Scholar] [CrossRef]
  176. Huang, C.; Lin, Y.L.; Kaplan, M.L.; Charney, J.J. Synoptic-scale and mesoscale environments conducive to forest fires during the October 2003 extreme fire event in Southern California. J. Appl. Meteorol. Climatol. 2009, 48, 553–579. [Google Scholar] [CrossRef]
  177. Mass, C.F.; Ovens, D. The Northern California Wildfires of 8–9 October 2017: The Role of a Major Downslope Wind Event. Bull. Am. Meteorol. Soc. 2019, 100, 235–256. [Google Scholar] [CrossRef]
  178. Nauslar, N.; Abatzoglou, J.; Marsh, P. The 2017 North Bay and Southern California fires: A case study. Fire 2018, 1, 18. [Google Scholar] [CrossRef] [Green Version]
  179. Peace, M.; Mattner, T.; Mills, G.; Kepert, J.; McCaw, L. Fire-modified meteorology in a coupled fire-atmosphere model. J. Appl. Meteorol. Climatol. 2015, 54, 704–720. [Google Scholar] [CrossRef]
  180. Peace, M.; Mattner, T.; Mills, G.; Kepert, J.; McCaw, L. Coupled fire-atmosphere simulations of the Rocky River fire using WRF-SFIRE. J. Appl. Meteorol. Climatol. 2016, 55, 1151–1168. [Google Scholar] [CrossRef]
Figure 1. Global distribution of the (upper) Fire Weather Index (FWI) and (bottom) annual number of days during which downslope winds criteria are met (see details in text). Adapted from [6] and [8] respectively.
Atmosphere 13 00755 g001aAtmosphere 13 00755 g001b
Figure 2. Extreme fire events on the 4 January 2020 over southeast Australia as shown by the Moderate Resolution Imaging Spectroradiometer (MODIS) on NASA’s Aqua satellite. In the image, smoke (tan in colour) and clouds (bright white) can be seen, while the white patches above the smoke may be pyrocumulonimbus clouds (source: Earth Observatory of NASA, available at https://earthobservatory.nasa.gov/images/146110/fires-and-smoke-engulf-southeastern-australia accessed on 30 April 2022, 16:49 Australian EST).
Atmosphere 13 00755 g002
Figure 3. (a) Photo of pyrocumulonimbus cloud in the Grampians Fire, Victoria, Australia, 21 February 2014 (Photo taken by Randall Bacon; [33]), and (b) pyrocumulus or possible case of pyrocumulonimbus on the island of Brač, Croatia, 14 July 2011 (Photo taken by Siniša Miličić; [46]).
Atmosphere 13 00755 g003
Figure 4. (a) Mean sea level pressure analysis over Europe (Deutscher Wetterdienst, DWD) on 11 August 2001 at 00 UTC, and (b) wind speed vertical profile (ms−1) at Split-Marjan meteorological station on the same day, simulated from the numerical mesoscale ALADIN model [91].
Atmosphere 13 00755 g004
Figure 5. The Black Saturday synoptic features represented by mean sea level pressure (MSLP) analysis at 1700 local time (LT) on 7 February 2009 [105].
Atmosphere 13 00755 g005
Figure 6. The NCEP/NCAR reanalysis of 850-hPa temperature field [K] at 1200 UTC, 16 February 1983 (Ash Wednesday; [110]).
Atmosphere 13 00755 g006
Table 1. Summary and comparison of the multiscale drivers of wildfire over the Adriatic Coast and Southeast Australia. The last column describes their impacts.
Adriatic CoastSE AustraliaImpacts
Synoptic
Pattern
Azores anticyclone; Karachi (monsoon) depression;
Blocking; Blocking ridge
Tasman Sea Anticyclone driving hot and dry air from the centre of the continent;
Strong east–west temperature gradient
Set up of background for hot and dry conditions
Strong Winds—SynopticCold frontCold front, especially summerOverriding the local coastline circulation; Leading to abrupt change in wind speed and direction
Strong Winds—meso- /
micro-scale
circulation
Orographic wave; hydraulic jump;
Low-level jet (LLJ): Examples are jugo (SE), bura (NE) and maestral (NW) winds
Cross-mountain flow; Foehn wind with topographically induced atmospheric wave;
Upper-level jet circulation induces dry air to descend
Downslope transport of energy to the lee side;
Abrupt warming and drying through adiabatic compression/introduction of upper tropospheric air
Atmospheric
Stability
Unstable atmosphere favourable for updraft of warm airUnstable atmospheric favourable for updraft;
Plume-dominated wildfire
Favourable for low-level fire inflow, smoke removal and pyroconvection
Boundary layerLLJ leads to strong vertical wind shear and turbulent kinetic energyDevelopment of deep boundary layer that allows mixing with mid-tropospheric dry air; overnight LLJ developmentFavourable for abrupt surface drying and increase in windspeed; overnight progression of elevated fires
Publisher’s Note: MDPI stays neutral with regard to jurisdictional claims in published maps and institutional affiliations.

