Article

Retrieval of High-Resolution Aerosol Optical Depth for Urban Air Pollution Monitoring

1
School of Environmental Science and Spatial Informatics, China University of Mining and Technology, Xuzhou 221116, China
2
School of Computing and Engineering, University of Derby, Derby DE22 1GB, UK
*
Author to whom correspondence should be addressed.
Atmosphere 2022, 13(5), 756; https://doi.org/10.3390/atmos13050756
Submission received: 14 March 2022 / Revised: 1 May 2022 / Accepted: 5 May 2022 / Published: 7 May 2022
(This article belongs to the Topic Recent Progress in Aerosol Remote Sensing and Products)

Abstract

:
Aerosol Optical Depth (AOD) is one of the most important parameters of aerosol and a key physical quantity to characterize atmospheric turbidity and air pollution. Accurate retrieval of AOD is of great significance for air quality assessment. However, the spatial resolution of the currently widely used Moderate Resolution Imaging Spectroradiometer (MODIS) AOD products is too low to meet the application research of atmospheric environment at the regional scale. In 2013, China launched the Gaofen-1 (GF-1) satellite, which provides a new idea for AOD retrieval. In this paper, we apply the synergetic use of TERRA and AQUA satellite MODIS data to calculate the high-resolution AOD over Beijing based on the Synergetic Retrieval of Aerosol Properties algorithm (SRAP) and discussed scale conversion problems between AODs with different resolutions. To obtain the 100 m MODIS data, we use GF-1 wide-field-of-view data to downscale 1 km MODIS data based on mutual information method. The retrieved AOD has a spatial resolution of 100 m and can cover many land surface types. Preliminary validation was carried out with the Aerosol Robotic Network (AERONET) ground observation data. The correlation coefficient is about 0.88, and the root-mean-square error is about 0.15. Due to the high resolution of retrieved results, more detailed features can be provided in the spatial distribution. The experimental results show that the method has high precision, and further verification work is continuing.

Graphical Abstract

1. Introduction

Global eco-environmental problems such as ozone layer destruction, acid rain, land desertification, marine pollution and the sharp decline in biodiversity are threatening the survival of human beings. Therefore, accurate air quality monitoring has become an indispensable means for environmental protection departments. Atmospheric aerosol is a heterogeneous system composed of the atmosphere and suspended solid and liquid particles. As an important component of the atmosphere, atmospheric aerosols play a key role in the radiation balance of the Earth–atmosphere system and global climate change. Aerosol optical depth (AOD) is a key parameter to describe the effect of aerosol on light attenuation. It can be quantitatively obtained by remote sensing technology and is widely applied to the estimation of atmospheric visibility, the atmospheric correction of remote sensing images and atmospheric pollution monitoring [1].
With the rapid development of aerospace technology, a series of satellites have been launched successively and have provided effective aerosol monitoring data. Extracting aerosol-related parameters from satellite remote sensing images has been facing great difficulties, especially how to remove the surface contributions and determine the aerosol types. Therefore, numerous aerosol retrieval algorithms based on satellite data have been developed and have come a long way in recent years [2,3,4,5]. In order to address the problem that the surface contribution is difficult to be separated from the reflection signal at the top of the atmosphere, Xue et al. [6] proposed the Synergetic Retrieval of Aerosol Properties (SRAP) based on TERRA and AQUA satellite MODIS (Moderate Resolution Imaging Spectroradiometer) data to retrieve AOD over Beijing. This algorithm does not need the prior assumption of aerosol type, estimation of surface albedo or other parameters. It can realize the simultaneous retrieval of surface reflectance as well as AOD and is applicable for all kinds of terrain.
With the acceleration of urbanization and industrialization, the intensification of aerosol pollution such as haze and high particle concentration has brought unprecedented challenges to urban air quality monitoring. The demand for high temporal resolution (0.5 –1 h) and high spatial resolution (10 –1 km) observations is increasing [7]. However, most of the currently released AOD products targeting complex surfaces such as urban areas are based on low and medium spatial resolution remote sensing images, and their coverage is limited, which cannot meet the needs of fine air pollution monitoring [8]. In recent years, scholars have carried out related research [9,10,11].
In this paper, we use the SRAP algorithm to retrieve 100 m × 100 m AOD by synergy of TERRA and AQUA MODIS data over Beijing. In order to obtain high-resolution AOD, we use the mutual information (MI) algorithm to downscale MODIS data with the help of GF-1 wide-field-of-view (WFV) data. The second section introduces the study area and datasets. The third section describes the model algorithm and processing flow. The fourth section evaluates the retrieval results of the algorithm by comparing with the AERONET ground-based observations. The problem of scale conversion between different resolution AODs were discussed in the fifth section. Finally, Section six discusses the applicability and limitations of the algorithm.

2. Study Area and Datasets

2.1. Study Area

Beijing (115°25′–117°30′ E, 39°26′–41°3′ N) is located in the north of the North China Plain with a total area of 16410.54 km2 (Figure 1). With the continuous and rapid development of urbanization and industrialization, the pollution emissions in Beijing are increasing year by year.

2.2. Datasets

2.2.1. MODIS Data

MODIS, the main sensor of TERRA and AQUA satellites, is an important instrument for observing global biological and physical processes. In this study, we selected TERRA/AQUA MODIS data that passed through the territory of Beijing from 1 January 2020 to 31 December 2020 while ensuring that these images have the same transit date with the GF-1 satellite. There are various MODIS data products used in the study, including 1 km resolution 1B level data (MOD/MYD02), 10 km resolution AOD retrieval products (MOD/MYD04) and 1 km resolution geographic positioning data (MOD/MYD03). The above data are downloaded via the LAADS website (https://ladsweb.modaps.eosdis.nasa.gov/, accessed on 13 March 2022) for AOD retrieval.

2.2.2. GF-1 WFV Data

In order to downscale the low-resolution MODIS binary data to high-resolution, the study selected bands 1–3 of cloud-free or cloud-less images with a spatial resolution of 16 m and a temporal resolution of 4 days provided by GF-1 WFV data. The detailed characteristics of GF-1 WFV sensors are summarized in Table 1. Here, we collected 52 images of GF-1 WFV cameras in Beijing from 1 January 2020 to 31 December 2020 (http://www.cresda.com/CN/, accessed on 13 March 2022). The 1, 2 and 3 bands of WFV data corresponding to the 3, 4 and 1 bands of MODIS 1 km spatial resolution are chosen for preprocessing, respectively.

3. Methodology

3.1. AOD Retrieval Algorithm

Xue and Cracknell [12] replaced the integral differential equation of radiation intensity with the ordinary differential equation of upgoing and downgoing radiation flux density. By solving the radiative transfer equation, the relationship between surface reflectance A of wavelength λ and apparent reflectance of the Earth system albedo A were obtained, as shown in Equation (1):
{ A   i j = ( A   i j b a   ) + a   ( 1 A   i j ) exp [ ( a   b ) ε τ 0 λ   s e c θ ] ( A   i j b a   ) + b ( 1 A   i j ) exp [ ( a   b ) ε τ 0 λ   s e c θ ] A 1 , j A 2 , j = K
where i = 1, 2 means the two satellite observations; j = 1, 2, 3 means the three bands of 470, 550, 660 nm; and a = s e c θ , b = 2, ε is the backscattering coefficient, usually taking the value of 0.1. Through the formula of declination and hour angle, the solar zenith angle θ was calculated by using the longitude and latitude of each pixel and the imaging time of the image. The atmospheric optical depth τ 0 λ   is related to the atmospheric turbidity. The ratio K is a constant, which is assumed to depend only on the variation in the surface reflectance with the geometry.
The premise of the Synergetic Retrieval of Aerosol Properties (SRAP) model is based on the following assumptions: (1) If there is no change in surface characteristics between two consecutive observations, it is assumed that the surface reflection characteristics remain unchanged in this process. (2) It should be assumed that the types and properties of aerosols are almost unchanged between two continuous satellite observations, only the concentration of aerosol particles changes. That is, the wavelength index α is constant, and the Ångström turbidity index β changed.

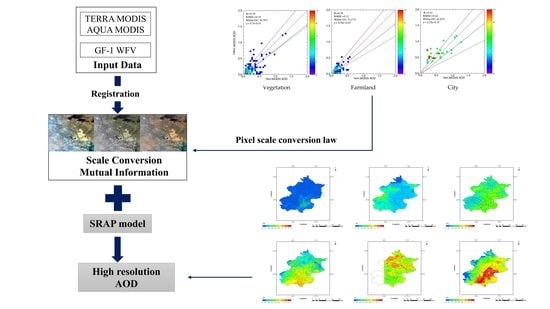
3.2. Downscaling Method

The above nonlinear Equation (1) elaborates the SRAP radiative transfer model for AOD retrieval using TERRA-MODIS and AQUA-MODIS data. In order to obtain high-resolution AODs, a scale conversion method based on maximum mutual information (MI) was used in our study [10]. The concept of MI represents a measure of relative entropy between two random variables. From the perspective of remote sensing, the maximum value of MI can be achieved when the two images are identical.
Assuming that X and Y are two images, then the M I ( X , Y ) is the relative entropy of joint probability distribution p ( x , y ) and marginal probability distributions p ( x ) and p ( y ) , of X and Y.
M I ( X , Y ) = x , y p ( x , y ) log p ( x , y ) p ( x ) p ( y )
In this process, we selected bands 1, 2, 3 from GF-1 satellite 16 m resolution WFV data, as well as bands 3, 4, 1 from TERRA/AQUA satellite 1 km resolution MODIS data, corresponding to the center wavelength of GF-1, respectively, participating in the operation. In order to improve the computational speed and signal-to-noise ratio, the WFV data were resampled to 100 m resolution at first. Next, the WFV data were taken as the base map to register 1 km MODIS data. At the same time, the ratio of rows and columns of two images was guaranteed to be 10:1. Finally, based on the MI method, the 1 km MODIS data were downscaled to 100 m, where each 1 km MODIS pixel corresponded to 10 × 10 100 m WFV pixels. In the process of using this method to downscale images, the following three conditions need to be satisfied:
(1)
Before downscaling, WFV and MODIS data should be reprojected and registered; consequently, RMSE should be less than 0.5 pixels.
(2)
The downscaled 100 m MODIS image should retain as much information as possible from the original 1 km MODIS image and the 100 m WFV image, and the maximum likelihood ratio between the two should be maximized. After downscaling, the physical meaning of each pixel and the range of pixel values should not be changed.
(3)
The downscaling process is reversible. That is to say, when the resolution of the downscaled 100 m MODIS Image reaches 1 km resolution, it can be restored to the same as the original image.
When downscaling 1 km MODIS binary data to 100 m resolution, the downscaling equation corresponding to each pixel can be expressed as:
ρ M O D I S 100 m ( i , j ) = k 1 ρ M O D I S 1 k m + k 2 ρ W F V 100 m ( i , j ) + k 3    
where ρ M O D I S 1 k m is the reflectance of the original 1 km MODIS data;   ρ W F V 100 m is the reflectance of the i row and j column in the corresponding 100 m WFV 10 × 10 windows;   ρ M O D I S 100 m is the reflectance of the downscaled 100 m MODIS pixel; k 1 and k 2 are weight coefficients, representing the weight of 1 km MODIS and 100 m WFV images, respectively; and k 3 is the adjusted coefficient. Through continuous test and adjustment of k 1 ,   k 2 and k 3 , the mutual information between the downscaled MODIS Image and upscaled WFV image with 100 m resolution can achieve maximum value, thus realizing the downscaling conversion of 100 m MODIS Image.

4. Results and Validation

4.1. Downscaled Results

TERRA/AQUA MODIS images at 1 km resolution were downscaled to 100 m resolution using the MI method, which preserves the original information and contains more texture features and ground details. Figure 2 shows three satellite images over Beijing area on 5 December 2020, from which a stark contrast can be seen. Figure 2c is a downscaled 100 m resolution MODIS Image based on the MI method. Compared to Figure 2a, the resolution is improved while including more detailed features.

4.2. Spatial Distributions of Retrieved AOD Results over Beijing

Using the SRAP model algorithm and data processing method, the retrieved results of the 100 m AOD were obtained for all available images in the Beijing area from January to December 2020. Figure 3 shows some of the retrieved results. The obtained results have higher resolution and larger coverage area which realizes AOD retrieval of various surface types under cloudless conditions. As can be seen from the figure, on sunny days (Figure 3a–c), the AOD results were low, showing a uniform spatial distribution. On the dates of high pollution or foggy days (Figure 3d–f), the AOD results changed significantly and reasonably and are still valid for the surfaces with high reflectivity.

4.3. Comparison with Ground Measurements

AERONET (Aerosol Robotic Network) is a global ground-based aerosol observation network established by the National Aeronautics and Space Administration (NASA) and Centre national de la recherche Scientifique (CNRS).
In this paper, we collect the ground observation data from Level 1.5, the third version of AERONET (Aerosol Robotic Network) sites [13]: Beijing (39.98° N, 116.38° E), Beijing_CAMS (39.93° N, 116.32° E), Beijing_RADI (40.01° N, 116.38° E) to validate the retrieval results. The AERONET data of 550 nm band is obtained by quadratic polynomial interpolation. By matching the retrieval results with the AERONET ground-based observation data (Table 2), a total of 180 pairs of effective data are obtained. During the 100 m AOD verification process, it is necessary to select a larger window (5 × 5) to obtain more matching data, so as to overcome the defect of less effective inversion data in the verification period. To increase the reliability of the validation results, the 10 km MODIS AODs at the corresponding stations on the corresponding dates were selected for comparison, and the AOD values of the 3 × 3 pixels windows corresponding to the ground observation sites were taken for regression analysis. A variety of statistical indicators were used for verification, including univariate linear regression equation, R, RMSE and expected error interval. The calculation formula of the expected error interval EE is as follows [4]:
E E = ± 0.05 ± 0.2 τ α
where τ α is the real measured value of AERONET sites.
The correlation between the 100 m AOD retrieved by SRAP algorithm and the ground measurement data is shown in Figure 4, and the blue line in the figure is the expected error (EE) line. The R is 0.88, and the RMSE is 0.15. In total, 48.33% of the retrieval results fall within the expected error line (EE = 48.33%). Figure 5 shows the accuracy verification results of the MODIS AOD over the same period. The results showed that the correlation coefficient R between MODIS AOD products and the AERONET data is 0.76, and the RMSE is 0.21.

5. Research on the Pixel Scale of AOD Results with Different Resolutions

In the process of using the SRAP algorithm to retrieve AOD, we noticed that there is a scale conversion problem between pixels when high-resolution AOD is resampled to a lower resolution. For example, when the retrieved 100 m AOD is resampled to 10 km for validation with MODIS DB AOD products, the single-pixel value of the resampled high-resolution AOD is not completely equivalent to the corresponding pixel value of 10 km MODIS DB AOD. Therefore, we discuss the scale relationship of AOD products with different resolutions, mainly to explore the pixel scale between the AOD products released by NASA and the high-resolution AOD products retrieved in this paper.
NASA has released 10 km (MOD/MYD04), 3 km (MOD/MYD04_3K) and 1 km (MCD19-A2) AOD products based on the MODIS Sensor. In this paper, the three AOD products as well as the high-resolution 100 m and 50 m AOD retrieved by the SRAP algorithm are selected to carry out experiments based on all available images in Beijing in October 2020.
Different land use types are associated with different degrees of human activity intensity and different aerosol emission sources, which may have different effects on regional atmospheric quality. Therefore, the AOD values of different surface types vary widely. According to the classified land use types (Figure 6 and Figure 7), vegetation, farmland, city, bare land and water were selected based on the GF-1 16 m resolution images, in which water is ignored due to the lack of valid AOD retrieved results, and bare soil was merged into the vegetation category to participate in the calculation because of its fragmented distribution, as well as its geographic location mostly adjacent to vegetation.
As Beijing’s terrain is high in the west and low in the east, most of the population, factories and buildings are concentrated in the southeast. The complex monsoon climate and topographic features that are not conducive to the diffusion of pollution, coupled with traffic exhaust gas and industrial pollution emissions, make Beijing’s air pollution such as dust and sandstorms more serious. The central urban area in southeast Beijing is a concentrated area of high AOD value. The research on aerosol optical properties in the past 10 years shows that the AOD value of the city throughout the year and most seasons (spring, autumn and winter) are significantly higher than the AOD value of the other two land use types; the annual and quarterly AOD of farmland is slightly higher than that of vegetation.
The corresponding relationships between pixel scales of various surface types of 10 km and 1 km, 3 km and 1 km MODIS AOD products as well as AOD with high-resolution at 100 m and 50 m obtained by SRAP algorithm are statistics, where a 10 km pixel corresponds to 10 × 10 window 1 km pixels, a 3 km pixel corresponds to 3 × 3 window 1 km pixels and a 100 m pixel corresponds to 2 × 2 window 50 m pixels, respectively. We can see the true color image and its corresponding gray pixels at 50 m/100 m resolution over different surface types in 23 October 2020 clearly from Table 3.
Figure 8 shows the results of 10 km, 3 km and 1 km MODIS AOD on 18 October 2020, in which the 10 km and 3 km AOD results cover the whole study area by 180 and 1938 pixels, respectively. According to the results of the 10 km resolution AOD, combined with the classification results (Figure 7) and the GF-1 true color image of the Beijing area (Figure 1), we can see in the southeastern region, where cities and farmland are alternately distributed in close proximity to each other, are covered by 67 pixels. A single 10 km pixel is mixed with multiple land use types. If the 10 × 10 window 1 km resolution AOD pixel values are simply averaged, the calculated value is not equal to its corresponding 10 km AOD pixel value, and the difference is large. The vegetation types in the northwest area are quite different from the urban and farmland areas, but there are still some certain intersections. The 10 km AOD image covers all the vegetation areas through 113 pixels. As can be seen from Figure 9, the correlation between the average AOD of 10 km and the corresponding window of 1 km in vegetation type is not high, but it is slightly higher than that of the farmland and city types. The correlation between the average AOD of 10 km and 1 km in the city type is the lowest. Therefore, we cannot perform single AOD averaging in the scale conversion between 10 km and 1 km but rather need to consider the influence of mixed pixels of different types of ground objects. The scale exploration between 3 km and 1 km is carried out using the same method. Table 4 lists the 1 km AOD 3 × 3 window average value and corresponded 3 km pixel value of typical vegetation, farmland, and city single pixel, which can more clearly verify the conversion law similar to the 10 km scale conversion.
Some example results of the scale conversion correlation between 100 m and 50 m AOD calculated by the SRAP algorithm are shown in Table 4, from which the following conclusions can be obtained:
(1)
For the vegetation areas, there is a little difference between the 50 m and 100 m AOD values. Each 100 m AOD pixel value is almost equal to the average of the sum of 4 50 m AOD pixel values, the gap between them is only two to three decimal places. From the classification results of GF-1 WFV images in Beijing, it can be clearly seen that the vegetation type has a high degree of separation, strong independence and single types. Therefore, 50 m resolution AOD can be calculated by a simple average of 100 m resolution AOD.
(2)
For the farmland areas, the pattern of the AOD scale conversion between 50 m and 100 m is not stable. Although most of 50 m AOD pixel values can be expressed as the average of the sum of 4 pixel values at 100 m resolution, there is a large gap between some pixels. By analyzing the land use types of Beijing, it can be seen that most of the farmland is distributed in the middle of the city or at the city boundary, which is easy to mix with the city and vegetation, resulting in mixed pixels. Moreover, due to the different crops, the farmland types will also be different, causing the unstable law between the two scales.
(3)
For urban areas, the regularity of the AOD between the 50 m and 100 m resolutions is not obvious. In some cases, the average of the 50 m 2 × 2 window is higher than 100 m, and sometimes, it is lower than 100 m. The two are quite different and have no regularity. This is because the urban land surface is complex. Therefore, almost every pixel is a mixed pixel with great uncertainty. As a result, the gap and law between the two cannot be determined in the end.

6. Conclusions and Future Work

In this paper, the GF-1 WFV data are used to downscale the TERRA and AQUA satellite MODIS data, and the SRAP algorithm is used to calculate the AOD with a resolution of 100 m over Beijing. The retrieval results are consistent with the spatial distribution of MODIS aerosol products over the same period. Meanwhile, the resolution is greatly improved. The statistical indicators show more structural characteristics of aerosol spatial distribution. Therefore, our retrieval results can supplement the existing aerosol products and provide ideas for urban fine-grained aerosol monitoring.
In addition, based on different land use types, this paper also discusses the problems existing in the scale conversion of high-resolution AOD products and low-resolution AOD products. The results show that AOD products of different resolutions cannot simply be averaged or resampled, and the effect of mixed pixels needs to be considered if the accuracy is to be improved.
Further research will include continuous observations of aerosol information in different areas with mobile aerosol observation instruments to determine the spatial variation in the accuracy of AOD products and to optimize satellite cloud detection algorithm.

Author Contributions

Conceptualization, Y.X. and R.B.; methodology, Y.X.; software, R.B.; validation, R.B., Y.S. and X.J.; formal analysis, C.J.; investigation, R.B.; resources, R.B.; data curation, R.B.; writing—original draft preparation, R.B.; writing—review and editing, R.B.; visualization, Y.X.; supervision, Y.X.; project administration, Y.X.; funding acquisition, Y.X. All authors have read and agreed to the published version of the manuscript.

Funding

This work was supported in part by the National Natural Science Foundation of China (NSFC) under Grant 41871260.

Institutional Review Board Statement

Not applicable.

Informed Consent Statement

Not applicable.

Data Availability Statement

Not applicable.

Conflicts of Interest

The authors declare no conflict of interest.

References

  1. She, L.; Mei, L.; Xue, Y.; Che, Y.; Guang, J. SAHARA: A Simplified Atmospheric Correction Algorithm for Chinese GaoFen Data: 1. Aerosol Algorithm. Remote Sens. 2017, 9, 253. [Google Scholar] [CrossRef] [Green Version]
  2. Kaufman, Y.J.; Sendra, C. Algorithm for automatic atmospheric corrections to visible and near-IR satellite imagery. Int. J. Remote Sens. 1988, 9, 1357–1381. [Google Scholar] [CrossRef]
  3. Remer, L.A.; Mattoo, S.; Levy, R.C.; Munchak, L. MODIS 3 km aerosol product: Algorithm and global perspective. Atmos. Meas. Tech. 2013, 6, 69–112. [Google Scholar] [CrossRef] [Green Version]
  4. Levy, R.C.; Mattoo, S.; Munchak, L.A.; Remer, L.A.; Hsu, N.C. The collection 6 MODIS aerosol products over land and ocean. Atmos. Meas. Tech. 2013, 6, 159–259. [Google Scholar] [CrossRef] [Green Version]
  5. Hsu, N.C.; Jeong, M.J.; Bettenhausen, C.; Sayer, A.M.; Hansell, R.; Seftor, C.S.; Huang, J.; Tsay, S.C. Enhanced Deep Blue aerosol retrieval algorithm: The second generation. J. Geophys. Res. Atmos. 2013, 118, 9296–9315. [Google Scholar] [CrossRef]
  6. Xue, Y.; He, X.W.; Xu, H.; Guang, J.; Guo, J.P.; Mei, L.L. China Collection 2.0: The aerosol optical depth dataset from the synergetic retrieval of aerosol properties algorithm. Atmos. Environ. 2014, 95, 45–58. [Google Scholar] [CrossRef]
  7. Xue, Y.; Li, Y.; Guang, J.; Zhang, X.; Guo, J. Small satellite remote sensing and applications—History, current and future. Int. J. Remote Sens. 2008, 29, 4339–4372. [Google Scholar] [CrossRef]
  8. Guo, J.; Xue, Y.; Cao, C.; Zhang, H.; Guang, J.; Zhang, X.; Li, X. A synergic algorithm for retrieval of aerosol optical depth over land. Adv. Atmos. Sci. 2009, 26, 973–983. [Google Scholar] [CrossRef]
  9. Sun, K.; Chen, X.; Zhu, Z.; Zhang, T. High Resolution Aerosol Optical Depth Retrieval Using Gaofen-1 WFV Camera Data. Remote Sens. 2017, 9, 89. [Google Scholar] [CrossRef] [Green Version]
  10. Li, Y.; Xue, Y.; He, X.; Jie, G. High-resolution aerosol remote sensing retrieval over urban areas by synergetic use of HJ-1 CCD and MODIS data. Atmos. Environ. 2012, 46, 173–180. [Google Scholar] [CrossRef]
  11. Zhong, B.; Wu, S.; Yang, A.; Liu, Q. An improved aerosol optical depth retrieval algorithm for moderate to high spatial resolution optical remotely sensed imagery. Remote Sens. 2017, 9, 555. [Google Scholar] [CrossRef] [Green Version]
  12. Xue, Y.; Cracknell, A.P. Operational bi-angle approach to retrieve the Earth surface albedo from AVHRR data in the visible band. Int. J. Remote Sens. 1995, 16, 417–429. [Google Scholar] [CrossRef]
  13. Holben, B.N.; Eck, T.F.; Slutsker, I.; Tanre, D.; Buis, J.P.; Setzer, A.; Vermote, E.; Reagan, J.A.; Kaufman, Y.J.; Nakajima, T.; et al. AERONET—A federated instrument network and data archive for aerosol characterization. Remote Sens. Environ. 1998, 66, 1–16. [Google Scholar] [CrossRef]
Figure 1. Geolocation of Beijing shown by GF-1 WFV image.
Atmosphere 13 00756 g001
Figure 2. The downscaled result based on MI method: (a) is preprocessed 1 km MODIS image; (b) is 100 m GF-1 WFV image aggregated from a 16 m image; (c) is 100 m MODIS image based on MI method.
Atmosphere 13 00756 g002
Figure 3. The AOD retrieval results from TERRA/AQUA MODIS data during the sunny days and foggy days: (ac) are the AOD results of sunny days on 19 September, 7 November and 13 January 2020, respectively; (df) are the AOD results of foggy days on 25 January, 12 January and 11 February 2020, respectively.
Atmosphere 13 00756 g003
Figure 4. Comparison Between Retrieved AOD Using SRAP Algorithm and AOD Measured by AERONET Stations.
Atmosphere 13 00756 g004
Figure 5. Comparison Between MODIS DB AOD and AOD Measured by AERONET Stations.
Atmosphere 13 00756 g005
Figure 6. Types and proportion of features in Beijing.
Atmosphere 13 00756 g006
Figure 7. Classification results of GF-1 WFV images in Beijing.
Atmosphere 13 00756 g007
Figure 8. Results of 10 km, 3 km and 1 km MODIS AOD pretreatment in Beijing on October 18, 2020: (a) is 10 km AOD result, (b) is 3 km AOD result, (c) is 1 km AOD result.
Atmosphere 13 00756 g008aAtmosphere 13 00756 g008b
Figure 9. Correlation analysis of vegetation, farmland and city in 10 km and 1 km AOD results: (ac) are the correlation analysis of 10 km and 1 km AOD results for vegetation, farmland, and city areas, respectively.
Atmosphere 13 00756 g009
Table 1. Main techno-parameters of WFV cameras aboard on Gaofen-1 satellite.
Satellite SensorSpectral RangeSpatial ResolutionSwath WidthRe-Visiting Period
GF-1
WFV
0.45–0.52 μm16 m200 km
(mosaic of four WFV ≥ 800 km)
4 Days
0.52–0.59 μm
0.63–0.69 μm
0.77–0.89 μm
Table 2. Observation times of satellite and ground-based data for AOD retrieval (Take any two days of each month as an example).
Date
(dd-mm-yy)
Terra-MODIS
(hh:mm)
Aqua-MODIS
(hh:mm)
Beijing
(hh:mm)
Beijing_CAMS
(hh:mm)
Beijing_RADI
(hh:mm)
21 January 2020AM03:30--03:2603:26
PM-05:10-05:1105:11
11 February 2020AM02:10--02:1102:07
PM-05:25-05:2105:29
23 March 2020AMe--03:4003:52
PM-05:20-04:5205:22
25 April 2020AM02:45---02:43
PM-04:25--04:28
15 May 2020AM02:20--02:1702:26
PM-05:40-05:3805:11
12 June 2020AM02:45-02:4002:43-
PM-04:2504:3604:34-
15 July 2020AM03:25-03:2003:2103:20
PM-05:1005:2005:064:50
18 August 2020AM02:30-02:3602:3302:36
PM-04:15-04:2104:21
19 September 2020AM03:15-03:1803:21-
PM-04:5504:5404:54-
13 October 2020AM02:25-02:3102:25-
PM-05:4505:4605:46-
2 November 2020AM03:40-03:4403:41-
PM-05:2005:1405:20-
23 December 2020AM02:30-02:2802:3202:35
PM-05:5005:4405:5005:44
Table 3. True color image and its corresponding gray pixels at 50 m/100 m resolution over different surface types in 23 October 2020.
True Color Image (RGB) CompositedGray Pixel Corresponding to 50 m ResolutionGray Pixel Corresponding to 100 m Resolution
Vegetation Atmosphere 13 00756 i001 Atmosphere 13 00756 i002 Atmosphere 13 00756 i003
Farmland Atmosphere 13 00756 i004 Atmosphere 13 00756 i005 Atmosphere 13 00756 i006
City Atmosphere 13 00756 i007 Atmosphere 13 00756 i008 Atmosphere 13 00756 i009
Table 4. The 50 m AOD 2 × 2 window average value and corresponding 100 m pixel value of typical vegetation, farmland and city single pixels on 23 October 2020 and the 1 km AOD 3 × 3 window average value and corresponding 3 km pixel value of typical vegetation, farmland and city single pixels on 5 October 2020.
23 October 20205 October 2020
Classification50 m AOD 2 × 2 Window Average Value100 m AOD Pixel Value1 km AOD 3 × 3 Window Average Value3 km AOD Pixel Value
Vegetation 10.08510.0877270.051750.052173
Vegetation 20.04810.0477310.22730.229701
Vegetation 30.026870.0275390.020990.022081
Vegetation 40.0089650.0093200.045870.045361
Vegetation 50.05530.0541160.033120.032199
Farmland 10.04680.0465940.25680.225263
Farmland 20.06020.0571190.46970.561698
Farmland 30.083420.0838750.0008910.000865
Farmland 40.090150.1070220.021580.025414
Farmland 50.07460.0730150.033510.035428
City 10.13970.1078291.40741.127412
City 20.10780.0254771.9722.06016
City 30.16390.1710340.07380.194221
City 40.09770.1275771.54491.732724
City 50.24870.1918711.1124881.493611
Publisher’s Note: MDPI stays neutral with regard to jurisdictional claims in published maps and institutional affiliations.

