Abstract
Canadian high-frequency temperature time series exhibit physical heterogeneity in the coexistence of radiative and advective populations in the total air temperature sample. This work examines forty-five Canadian hourly air temperature records to study seasonal characteristics and variability of radiative and advective population counts and their corresponding temperature biases and trends. The Linear Pattern Discrimination algorithm, conceptualized in a previous study, was adjusted to seasonal analysis on the equinox-to-equinox time scale. Count analysis of radiative and advective days supports the existence of two distinct thermal regimes, Spring–Summer and Fall–Winter. Further, seasonal advective counts for the majority of examined stations typically decrease in numbers. The consistently warmer winter radiative temperature extrema points to the critical role of the advective population in control of the overall temperature magnitude. Canadian northwest warming trends are found to be the highest, indicating the amplifying effect of decreasing advective counts with rapidly increasing temperatures that weaken the advective population’s moderating ability to control the magnitude of the total temperature population.
1. Introduction
The observed increase in global air temperature, complicated by intensified changes in weather patterns, presents a complex climatological construct for analysis [1,2]. While the clear demarcation of climate from the weather is far from reach, the apparent changes in daily temperature variation lend themselves to the delimitation of homogeneous air temperature populations within the temperature time series.
The identification of different populations within temperature time series is of great importance for the analysis of climatic variation apart from weather anomalies. There has not been a known attempt until recently, to divide the total temperature sample based on the diurnal temperature pattern. Although a notion of a diurnal temperature pattern (DTP) deduced from daily extrema exists [3,4], the correlation of a DTP with common atmospheric drivers of daily air temperature variation presents a novel concept initially introduced in [5].
The previous research has extensively examined a typical temperature variation for the purpose of temperature modeling covering various scientific fields and applications [6,7,8,9,10,11,12,13]. Additionally, the majority of works related to the quality of air temperature time series focus on the identification and elimination of artificial inhomogeneities [14,15,16,17,18,19,20,21]. A traditional approach to the elimination of non-climatic effects from an air temperature time series routinely overlooks the coexistence of different temperature populations. However, variation in the shape of the daily temperature curve between the commonly encountered sinusoidal and less frequent, quasi-linear diurnal temperature distribution provides convincing evidence for the presence of physically different air temperature populations within the temperature time series.
Physical heterogeneity of the Long-Term High-Frequency (LTHF) time series refers to the presence of more than one population characterized by a unique DTP that reflects the dominant daily heat exchange mechanism. Radiative and advective air temperature populations within the LTHF time series represent, therefore, the homogeneous parts of the total temperature sample consisting only of days with orderly or distorted DTP.
This study builds on an earlier implementation of the Linear Pattern Discrimination (LPD) algorithm in [5] preliminary used for the separation of temperature time series to physically homogeneous populations. While the initial study [5] reported on the design and implementation of the LPD algorithm and annual analysis of radiative and advective populations, the unique aspect of this study is the alteration of the annual algorithm to accommodate the seasonal analysis of extrema time series. The alteration consists of an adjustment to the astronomical calendar for identifying radiative and advective days on the equinox-to-equinox time scale for seasonal and semi-annual time steps.
This work aims to identify the main thermal characteristics of seasonal temperature populations through analysis of radiative and advective day counts and trend analysis of radiative and advective temperature populations within major Canadian climate regions.
Seasonal analysis of the Canadian radiative and advective extrema series identified large positive temperature trends across the stations. Time evolution of air temperature population counts and particularly high warming rates at Canadian northwest stations indicate an increase in atmospheric heat retention based on the fact that the most intense changes are observed on orderly, radiative days. Additionally, the consistently warmer Fall–Winter radiative extrema indicate the diminishment of the critical “cooling” role of the advective population in controlling the magnitude of the total temperature sample.
2. Materials and Methods
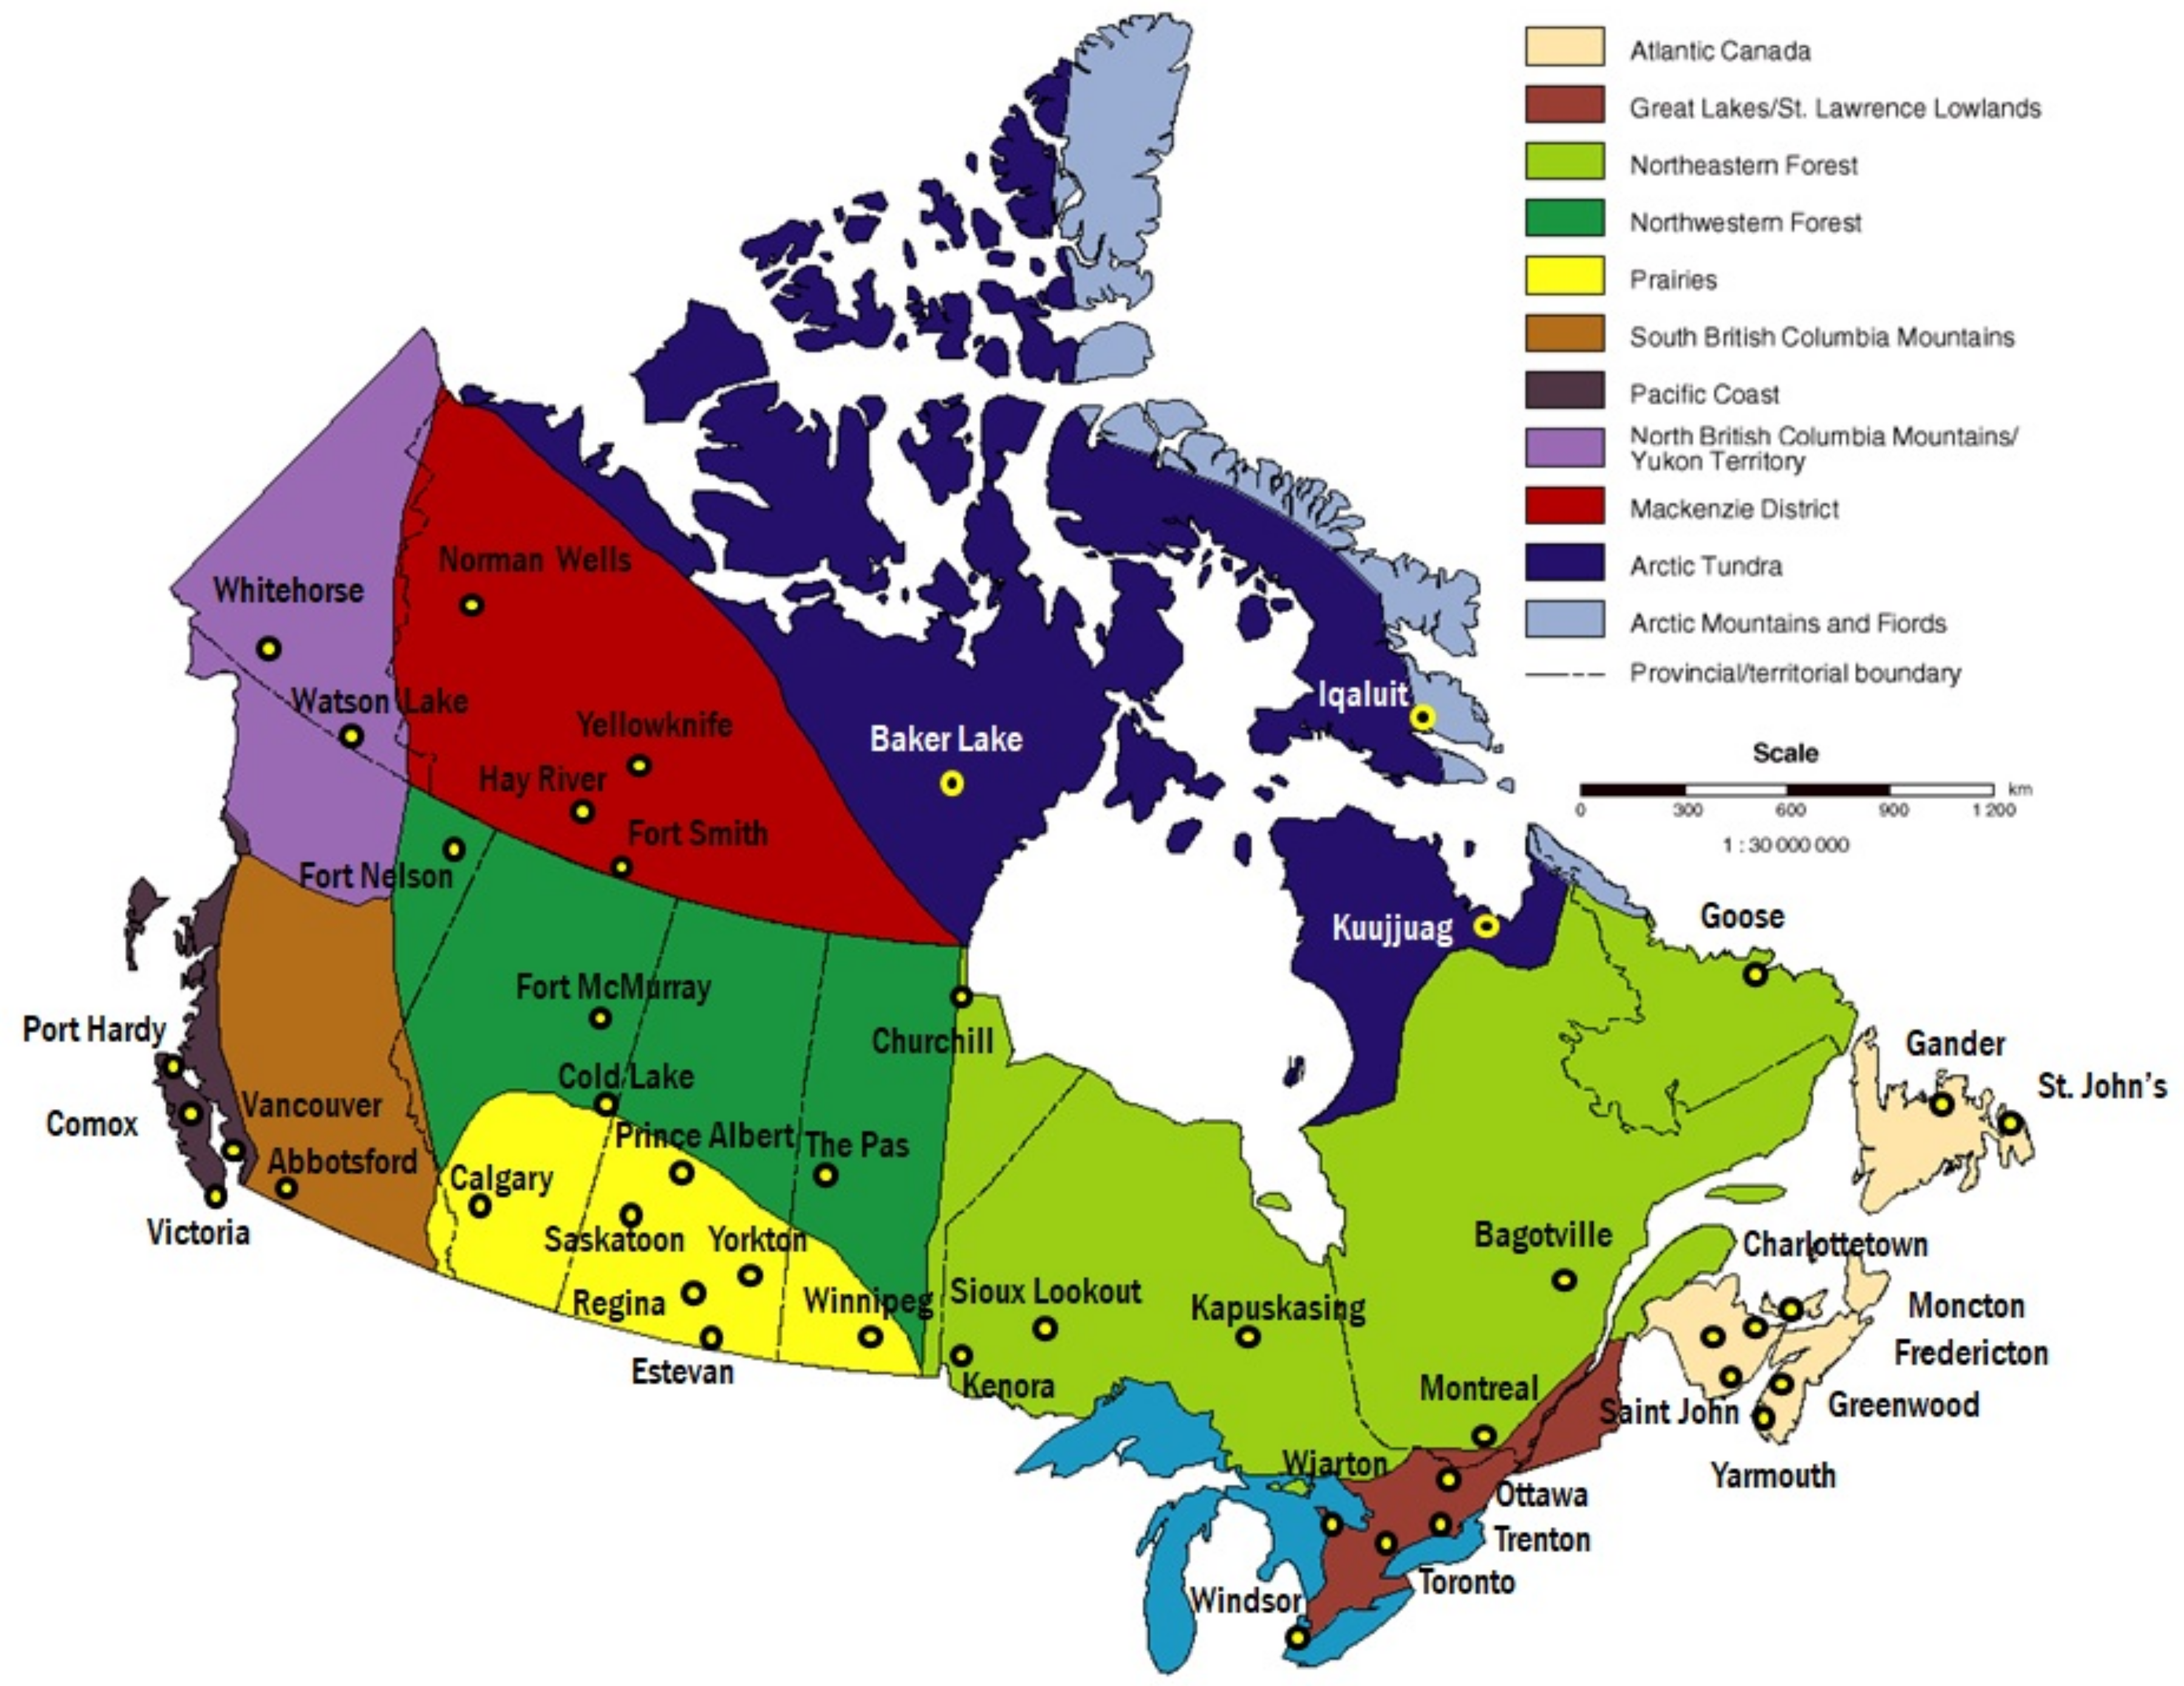
Forty-five long-term records of air temperature data used in this work were obtained from the archive maintained by Environment and Climate Canada [22] (https://climate.weather.gc.ca/historical_data (accessed on 10 April 2022)). Hourly air temperature time series, recorded at international and local airports (Environment and Climate Change Canada, 2022) were chosen for their availability of unaltered high-frequency records. The climate stations identified in Figure 1 were selected to represent the majority of Canadian climate regions presented in Figure 2. Table 1 lists the station’s geographic coordinates, data ranges, and percentages of missing data. Locations of stations range from 42.3° N (Windsor) to 65.3° N (Norman Wells) in latitude and from 52.3° W (St. John’s) to 135.1° W (Whitehorse) in longitude. The majority of temperature records span over 69 years in length except for Baker Lake, St. John’s, Norman Wells, and Cold Lake stations with records ranging between 58 and 66 years. The percent of missing data for the stations used varied from 0.03 (Gander, Moncton, Toronto, Regina, Vancouver) to 1.49 (Trenton) percent of hourly temperature measurements.
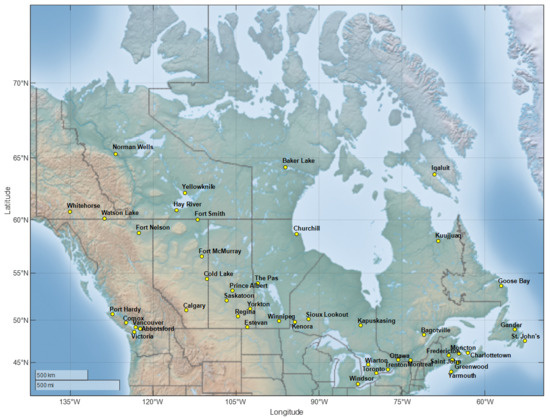
Figure 1.
Map of Canada with locations of climate stations.

Figure 2.
Positions of climate stations on the map of Canadian Climate Regions. (Adapted from Climate Trends and Variations Bulletin for Canada, Ottawa. Environment Canada, Atmospheric Environment Service, Climate Research Branch, 1998).

Table 1.
List of climate stations with latitude, longitude, data range, and percentage of missing data. “PD” represents “political division”. AB—Alberta, BC—British Columbia, MB–Manitoba, NB—New Brunswick, NL—Newfoundland and Labrador, NS—Nova Scotia, NT—Northwest Territories, NU—Nunavut, ON—Ontario, PE—Prince Edward Island, QC—Quebec, SK—Saskatchewan, and YU—Yukon.
Data processing, statistical analysis and graphical presentation were conducted in R programming environment using ‘dplyr’, ‘stringr’, ‘Kendall’, ‘ggplot2′, and ‘gridExtra’ packages [23].
The following subsection briefly describes the methodology previously used in [5] applied in this work to seasonal analysis and an extended number of stations.
Framework for Seasonal Analysis of Homogeneous Air Temperature Populations
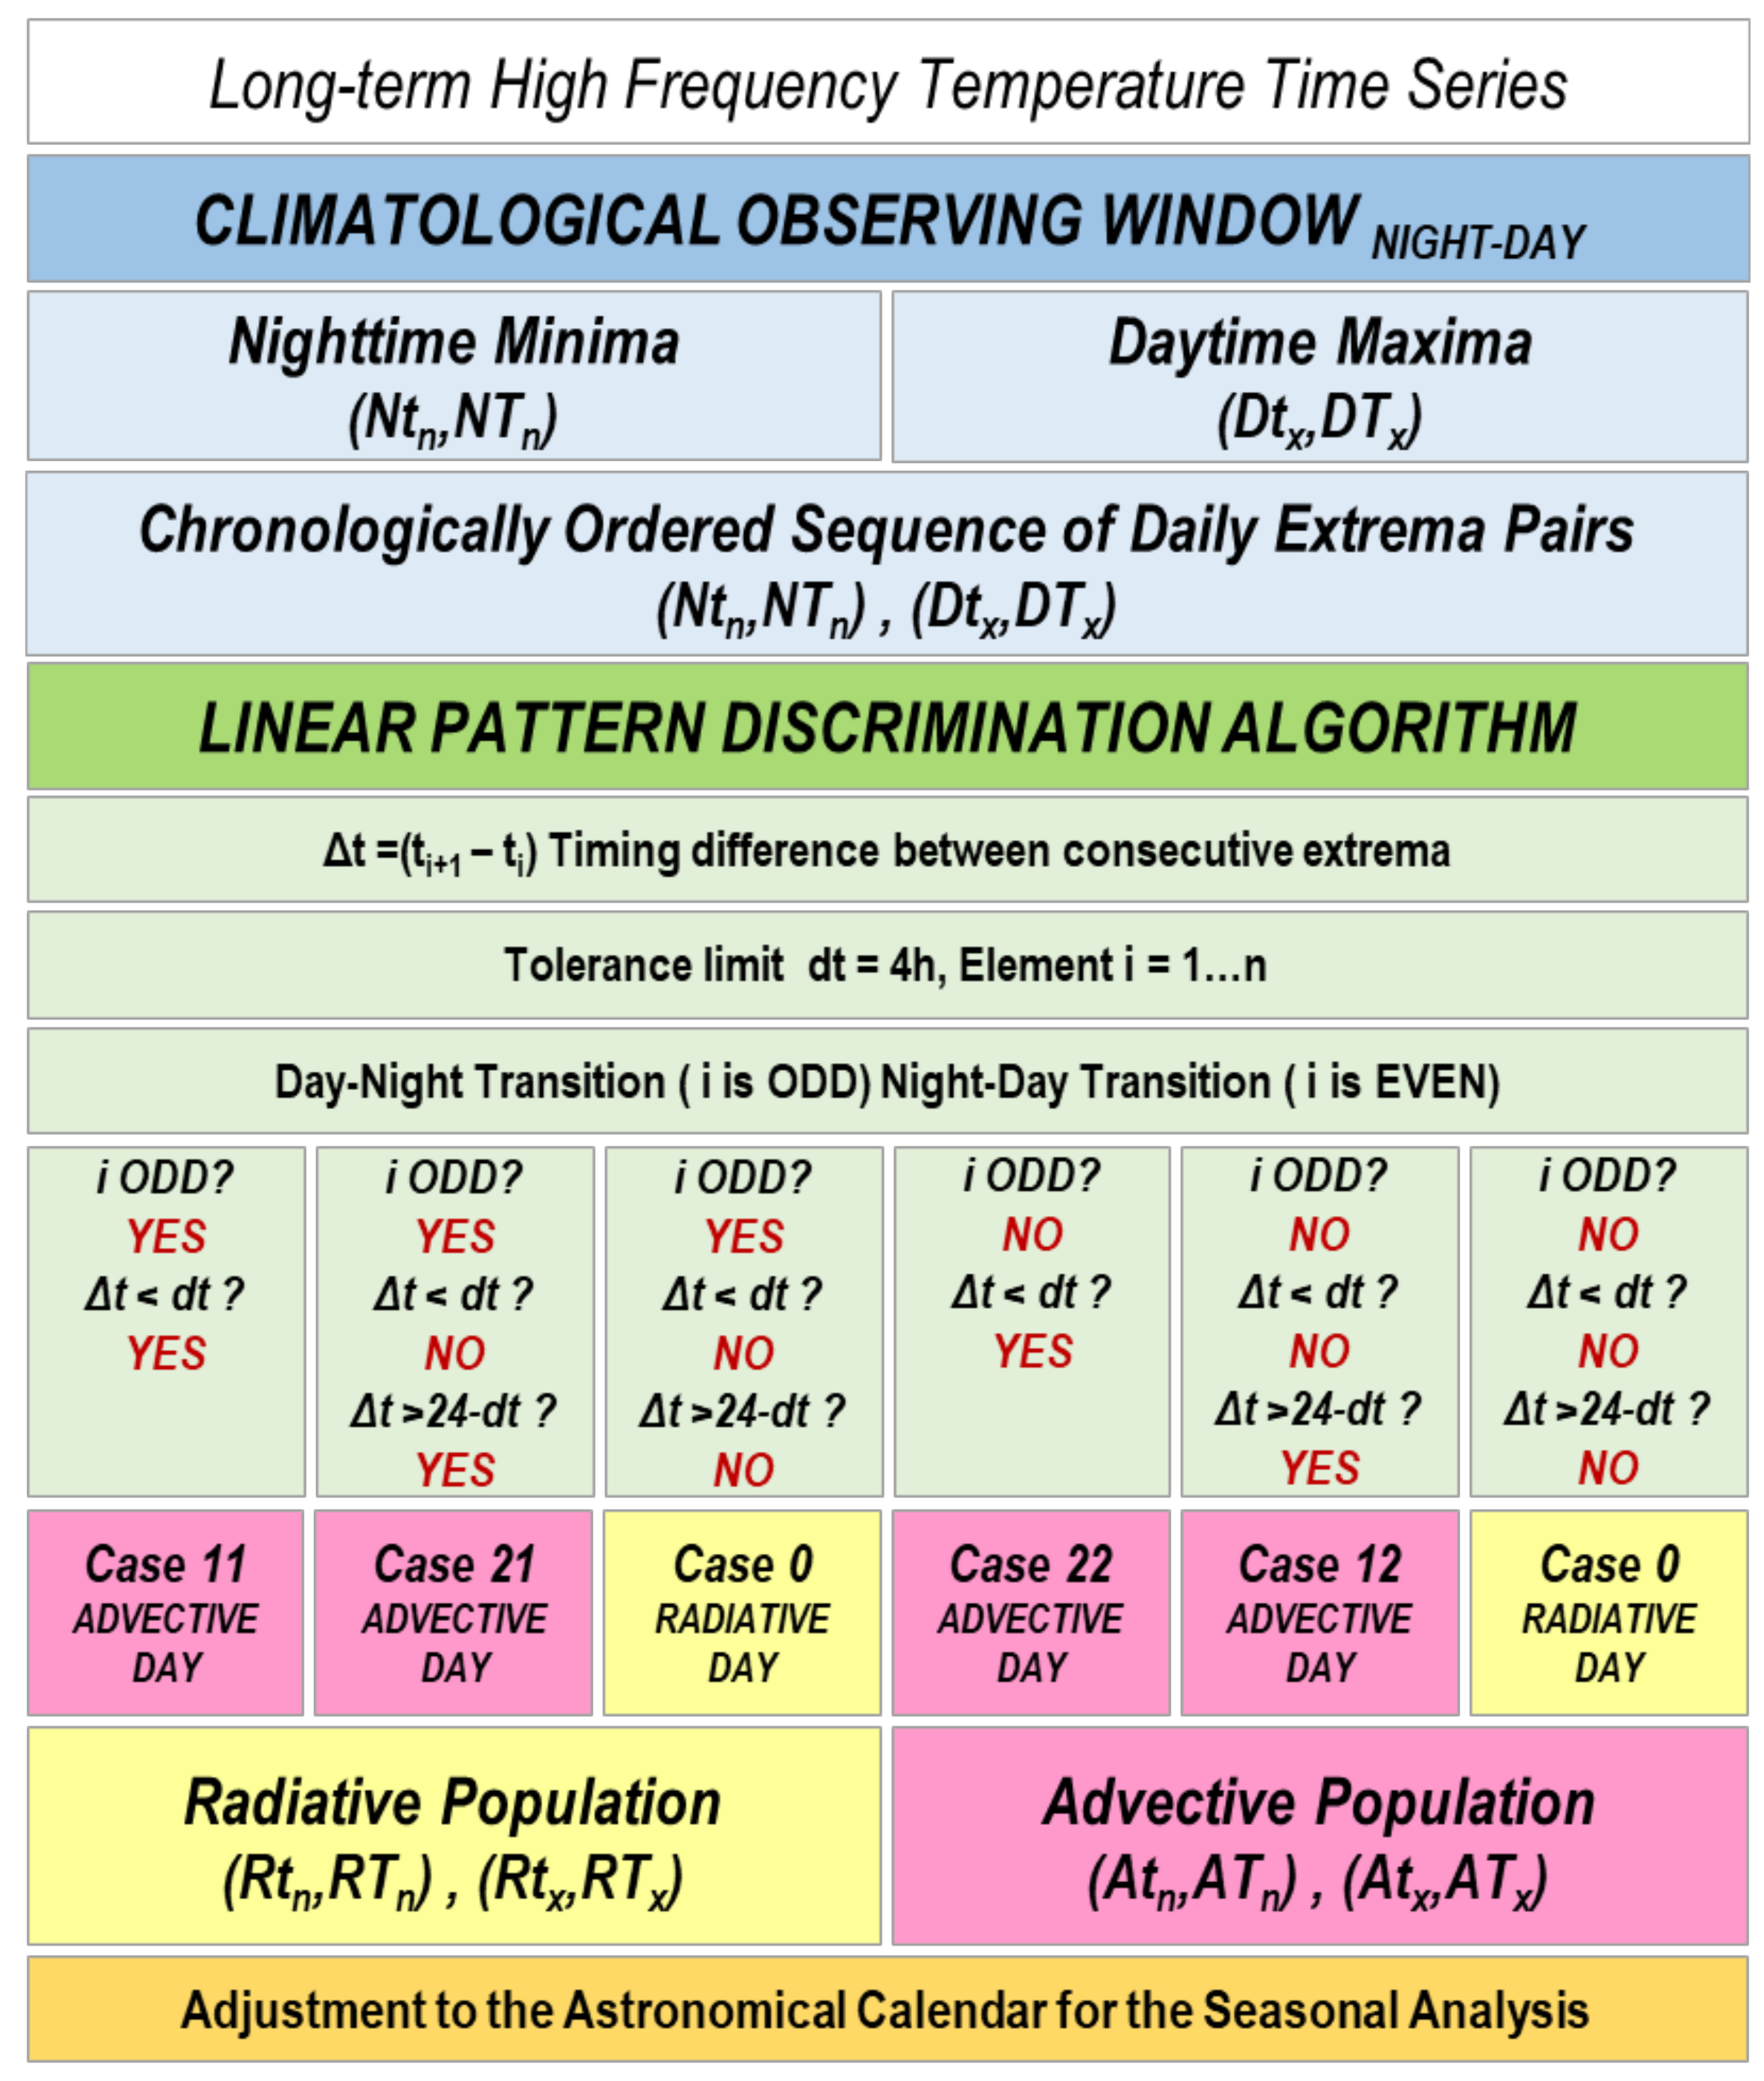
The seasonal analysis of physically homogeneous temperature populations consists of several procedures presented in Figure 3. Daily mathematical minima and maxima are derived from hourly records using the Climatological Observing WindowNight-Day (COWND), a time frame for extrema identification conceptualized in [24]. Daily minima and maxima pairs (t, T), which consist of timing and temperature of a nighttime minimum (Ntn, NTn) and timing and temperature of a daily maximum (Dtx, DTx), were identified at points on the air temperature–time curve where daily temperature trend changes its sign, and the derivative of temperature function equals zero [24].
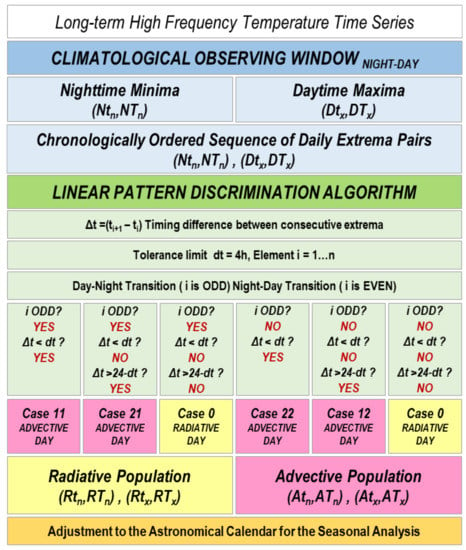
Figure 3.
Steps for identification of daily mathematical extrema and partitioning of radiative and advective temperature populations.
Identified mathematical extrema form a chronologically ordered sequence of daily temperature–time extrema pairs that is subsequently subjected to the LPD algorithm.
A radiatively-driven daily air temperature variation is represented by a sinusoidal diurnal temperature pattern that is compliant with the daily solar cycle and characterized by a nighttime minimum and daytime temperature maximum. An advectively driven temperature variation is, on the other hand, represented by a quasi-linear temperature pattern, caused by the horizontal transport of cold or warm air. Typical advective days are characterized by either nearly equal diurnal extrema timing identified at sunrise or sunset delineations (1 to 4 h apart) or diametrically distant points (more than 20 h apart) at end-of-day intervals.
The identification of a Diurnal Temperature Pattern (DTP) with the LPD algorithm is performed through the evaluation of extrema pairs at each transition between consecutive daytime and nighttime periods. In this methodology, the DTP serves as a separation tool for delineation of “orderly”, i.e., radiatively-driven days from days with a DTP distorted by thermal advection. Timing (t) of daily extrema is used as the main criterion for the DTP identification and partitioning of advective days from the total temperature population. The LPD algorithm identifies four common theoretical cases of advectively driven daily air temperature variation conceptualized in [5], Case 11, Case 12, Case 21, and Case 22, each describing a specific type of a quasi-linear DTP characterizing an advective day. The timing criterion (dt) for the separation of radiative and advective temperature populations is 4 h. Contrary to advective days, radiative days as a rule exhibit an orderly DTP with a clear separation in the timing of a minimum and maximum. The LPD algorithm selects the days with minima and maxima that are found within the time interval of 4 h apart and feeds them into the advective population while labeling the remaining days with daily extrema with 4 to 20 h apart as radiative (Case 0) to assign them to the radiative population (Figure 3).
The chronological series of radiative and advective days are identified according to the astronomical calendar. Seasonal demarcation for the identification of temperature populations is based on the exact solstice and equinox times.
Aspects of seasonal analysis in this study encompass the evolution of population counts and identification of radiative and advective temperature population trends and biases. The examination of total and individual homogeneous air temperature population trends involves the nonparametric Mann–Kendall (MK) trend test in the R programming language. The MK test is commonly used for assessing the significance of monotonic trends in variables with no assumption on the data to be normally distributed.
The scope of the assessment includes the analysis of seasonally averaged population counts followed by the analysis of total, radiative and advective populations of minimum and maximum temperatures.
3. Results
The results of the seasonal analysis of population counts and temperature biases and trends are presented in this section by climate regions.
Section 3.1 consists of a brief discussion of seasonal radiative and advective counts at individual stations, while Section 3.2 looks at the time evolution of seasonally averaged trends of population counts. Section 3.3 analyzes the magnitude of air temperature bias between homogeneous temperature populations and discusses radiative and advective temperature trends. Table 2 and Table 3 display radiative and advective population counts while Table 4 and Table 5 show slopes of the total, radiative, and advective temperature trends. Section 3.4 summarizes regional counts of radiative and advective annual and seasonal populations (Table 6 and Table 7) while Section 3.5 summarizes regional changes in extrema temperature trends of the total, radiative, and advective temperature populations (Table 8 and Table 9).
Table 2.
Radiative population counts, radiative population participation, and radiative population slope of counts reported per century (#/c.) “m” represents “slope”. RPC—Radiative Population Count, RPP—Radiative Population Participation, and mRPc—Slope of Radiative Population Count. “CR” represents “climate region”. ATL—Atlantic Canada, GRL—Great Lakes/St. Lawrence Lowlands, NEF—Northeastern Forest, NWF—Northwestern Forest, PRA—Prairies, SBC—South British Columbia Mountains, PAC—Pacific Coast, NBC—North British Columbia Mountains/Yukon Territory, MCD—Mackenzie District, ART—Arctic Tundra, and ARM—Arctic Mountains and Fiords.
Table 3.
Advective population counts, advective population participation, and advective population slope of counts reported per century (#/c.) “m” represents “slope”. APC—Advective Population Count, APP—Advective Population Participation, and mAPc—Slope of Advective Population Count. “CR” represents “climate region”. ATL—Atlantic Canada, GRL—Great Lakes/St. Lawrence Lowlands, NEF—Northeastern Forest, NWF—Northwestern Forest, PRA—Prairies, SBC—South British Columbia Mountains, PAC—Pacific Coast, NBC—North British Columbia Mountains/Yukon Territory, MCD—Mackenzie District, ART—Arctic Tundra, and ARM—Arctic Mountains and Fiords.
Table 4.
Temperature Minima Slopes reported in degrees Celsius per century (°C/c.) “m” represents “slope”. mTTn—Slope of Total Temperature Minimum, mRTn—Slope of Radiative Temperature Minimum, and mATn—Slope of Advective Temperature Minimum. “CR” represents “climate region”. ATL—Atlantic Canada, GRL—Great Lakes/St. Lawrence Lowlands, NEF—Northeastern Forest, NWF—Northwestern Forest, PRA—Prairies, SBC—South British Columbia Mountains, PAC—Pacific Coast, NBC—North British Columbia Mountains/Yukon Territory, MCD—Mackenzie District, ART—Arctic Tundra, and ARM—Arctic Mountains and Fiords.
Table 5.
Temperature Maxima Slopes reported in degrees Celsius per century (°C/c.) “m” represents “slope”. mTTx—Slope of Total Temperature Maximum, mRTx—Slope of Radiative Temperature Maximum, and mATx—Slope of Advective Temperature Maximum. “CR” represents “climate region”. ATL—Atlantic Canada, GRL—Great Lakes/St. Lawrence Lowlands, NEF—Northeastern Forest, NWF—Northwestern Forest, PRA—Prairies, SBC—South British Columbia Mountains, PAC—Pacific Coast, NBC—North British Columbia Mountains/Yukon Territory, MCD—Mackenzie District, ART—Arctic Tundra, and ARM—Arctic Mountains and Fiords.
Table 6.
Regional radiative population counts, radiative population participation, and radiative population slope of counts reported per century (#/c.) “m” represents “slope”. RPC—Radiative Population Count, RPP—Radiative Population Participation, and mRPc—Slope of Radiative Population Count. “CR” represents “climate region”. ATL—Atlantic Canada, GRL—Great Lakes/St. Lawrence Lowlands, NEF—Northeastern Forest, NWF—Northwestern Forest, PRA—Prairies, SBC—South British Columbia Mountains, PAC—Pacific Coast, NBC—North British Columbia Mountains/Yukon Territory, MCD—Mackenzie District, ART—Arctic Tundra, and ARM—Arctic Mountains and Fiords.
Table 7.
Regional advective population counts, advective population participation, and advective population slope of counts reported per century (#/c.) “m” represents “slope”. APC—Advective Population Count, APP—Advective Population Participation, and mAPc—Slope of Advective Population Count. “CR” represents “climate region”. ATL—Atlantic Canada, GRL—Great Lakes/St. Lawrence Lowlands, NEF—Northeastern Forest, NWF—Northwestern Forest, PRA—Prairies, SBC—South British Columbia Mountains, PAC—Pacific Coast, NBC—North British Columbia Mountains/Yukon Territory, MCD—Mackenzie District, ART—Arctic Tundra, and ARM—Arctic Mountains and Fiords.
Table 8.
Regional temperature minima slopes reported in degrees Celsius per century (°C/c.) “m” represents “slope”. mTTn—Slope of Total Temperature Maximum, mRTn—Slope of Radiative Temperature Maximum, and mATn—Slope of Advective Temperature Maximum. “CR” represents “climate region”. ATL—Atlantic Canada, GRL—Great Lakes/St. Lawrence Lowlands, NEF—Northeastern Forest, NWF—Northwestern Forest, PRA—Prairies, SBC—South British Columbia Mountains, PAC—Pacific Coast, NBC—North British Columbia Mountains/Yukon Territory, MCD—Mackenzie District, ART—Arctic Tundra, and ARM—Arctic Mountains and Fiords.
Table 9.
Regional temperature maxima slopes reported in degrees Celsius per century (°C/c.) “m” represents “slope”. mTTx—Slope of Total Temperature Maximum, mRTx—Slope of Radiative Temperature Maximum, and mATx—Slope of Advective Temperature Maximum. “CR” represents “climate region”. ATL—Atlantic Canada, GRL—Great Lakes/St. Lawrence Lowlands, NEF—Northeastern Forest, NWF—Northwestern Forest, PRA—Prairies, SBC—South British Columbia Mountains, PAC—Pacific Coast, NBC—North British Columbia Mountains/Yukon Territory, MCD—Mackenzie District, ART—Arctic Tundra, and ARM—Arctic Mountains and Fiords.
3.1. Seasonal Radiative and Advective Day Count Averages
Seasonal counts of radiative and advective air temperature populations indicate the existence of two distinct climatological periods, Spring–Summer (SS) extending between the Vernal and Autumn Equinox, and Fall–Winter (FW) extending between the Autumn and Vernal Equinox. The SS period is characterized by a high count of radiative days (~10,000–12,000) and a small number of advective days (~150–1000), while the FW period exhibits much higher counts of advective days (~2000–5000) and proportionally smaller counts of radiative days (~7500–10,500).
A systematic increase and large variability in counts of the radiative population are observed during the FW period along with the simultaneous decrease in advective counts at the majority of stations. During the SS period, radiative and advective counts maintain their ratios and low seasonal variability.
3.2. Time Evolution of Seasonally Averaged Trends of Radiative and Advective Day Counts
Table 2 lists radiative population counts (RPC), radiative population participation (RPP) and population rates of change denoted as slopes (m) of radiative population counts (RPc) reported in counts per century (#/c.). All radiative population count changes refer to a number of added radiative days at the expense of diminishing advective days from the total temperature population. Table 3 is a mirrored image of Table 2 values presented separately for evaluation of advective population counts, overall participation, and time evolution of trends in advective day counts. The values in Table 2, Table 3, Table 4 and Table 5 with an asterisk indicate statistically significant slopes of temperature populations assessed using the Mann–Kendall (MK) test for the identification of monotonic upward and downward trends.
Seasonal values of the RPC rates range between −1 and 22 counts per century (/c.) While an RPC range between 7 and 9/c. is considered substantial during the FW seasons, the RPC value of 3/c. during the SS season is considered elevated.
3.2.1. Atlantic Canada (ATL)
The rates of change in radiative and advective populations of the ATL region rank second to the lowest in Canada with an annual average of 9/c. The RPC rate of change is highest in the winter while other seasonal averages are low (Table 2). Low rates of the APC are observed at Saint John during fall and at Fredericton, during the spring (2/c.) The highest overall rate of change is observed at Greenwood and Moncton stations due to intense winter changes in radiative counts. The absence of any seasonal rate of change in RPC and APC is observed at Charlottetown (0/c.). Statistically significant rates of change in annual RPC are observed at Greenwood and Moncton as well as in seasonal RPC at Gander (4/c.) during spring.
3.2.2. Great Lakes/St. Lawrence Lowlands (GRL)
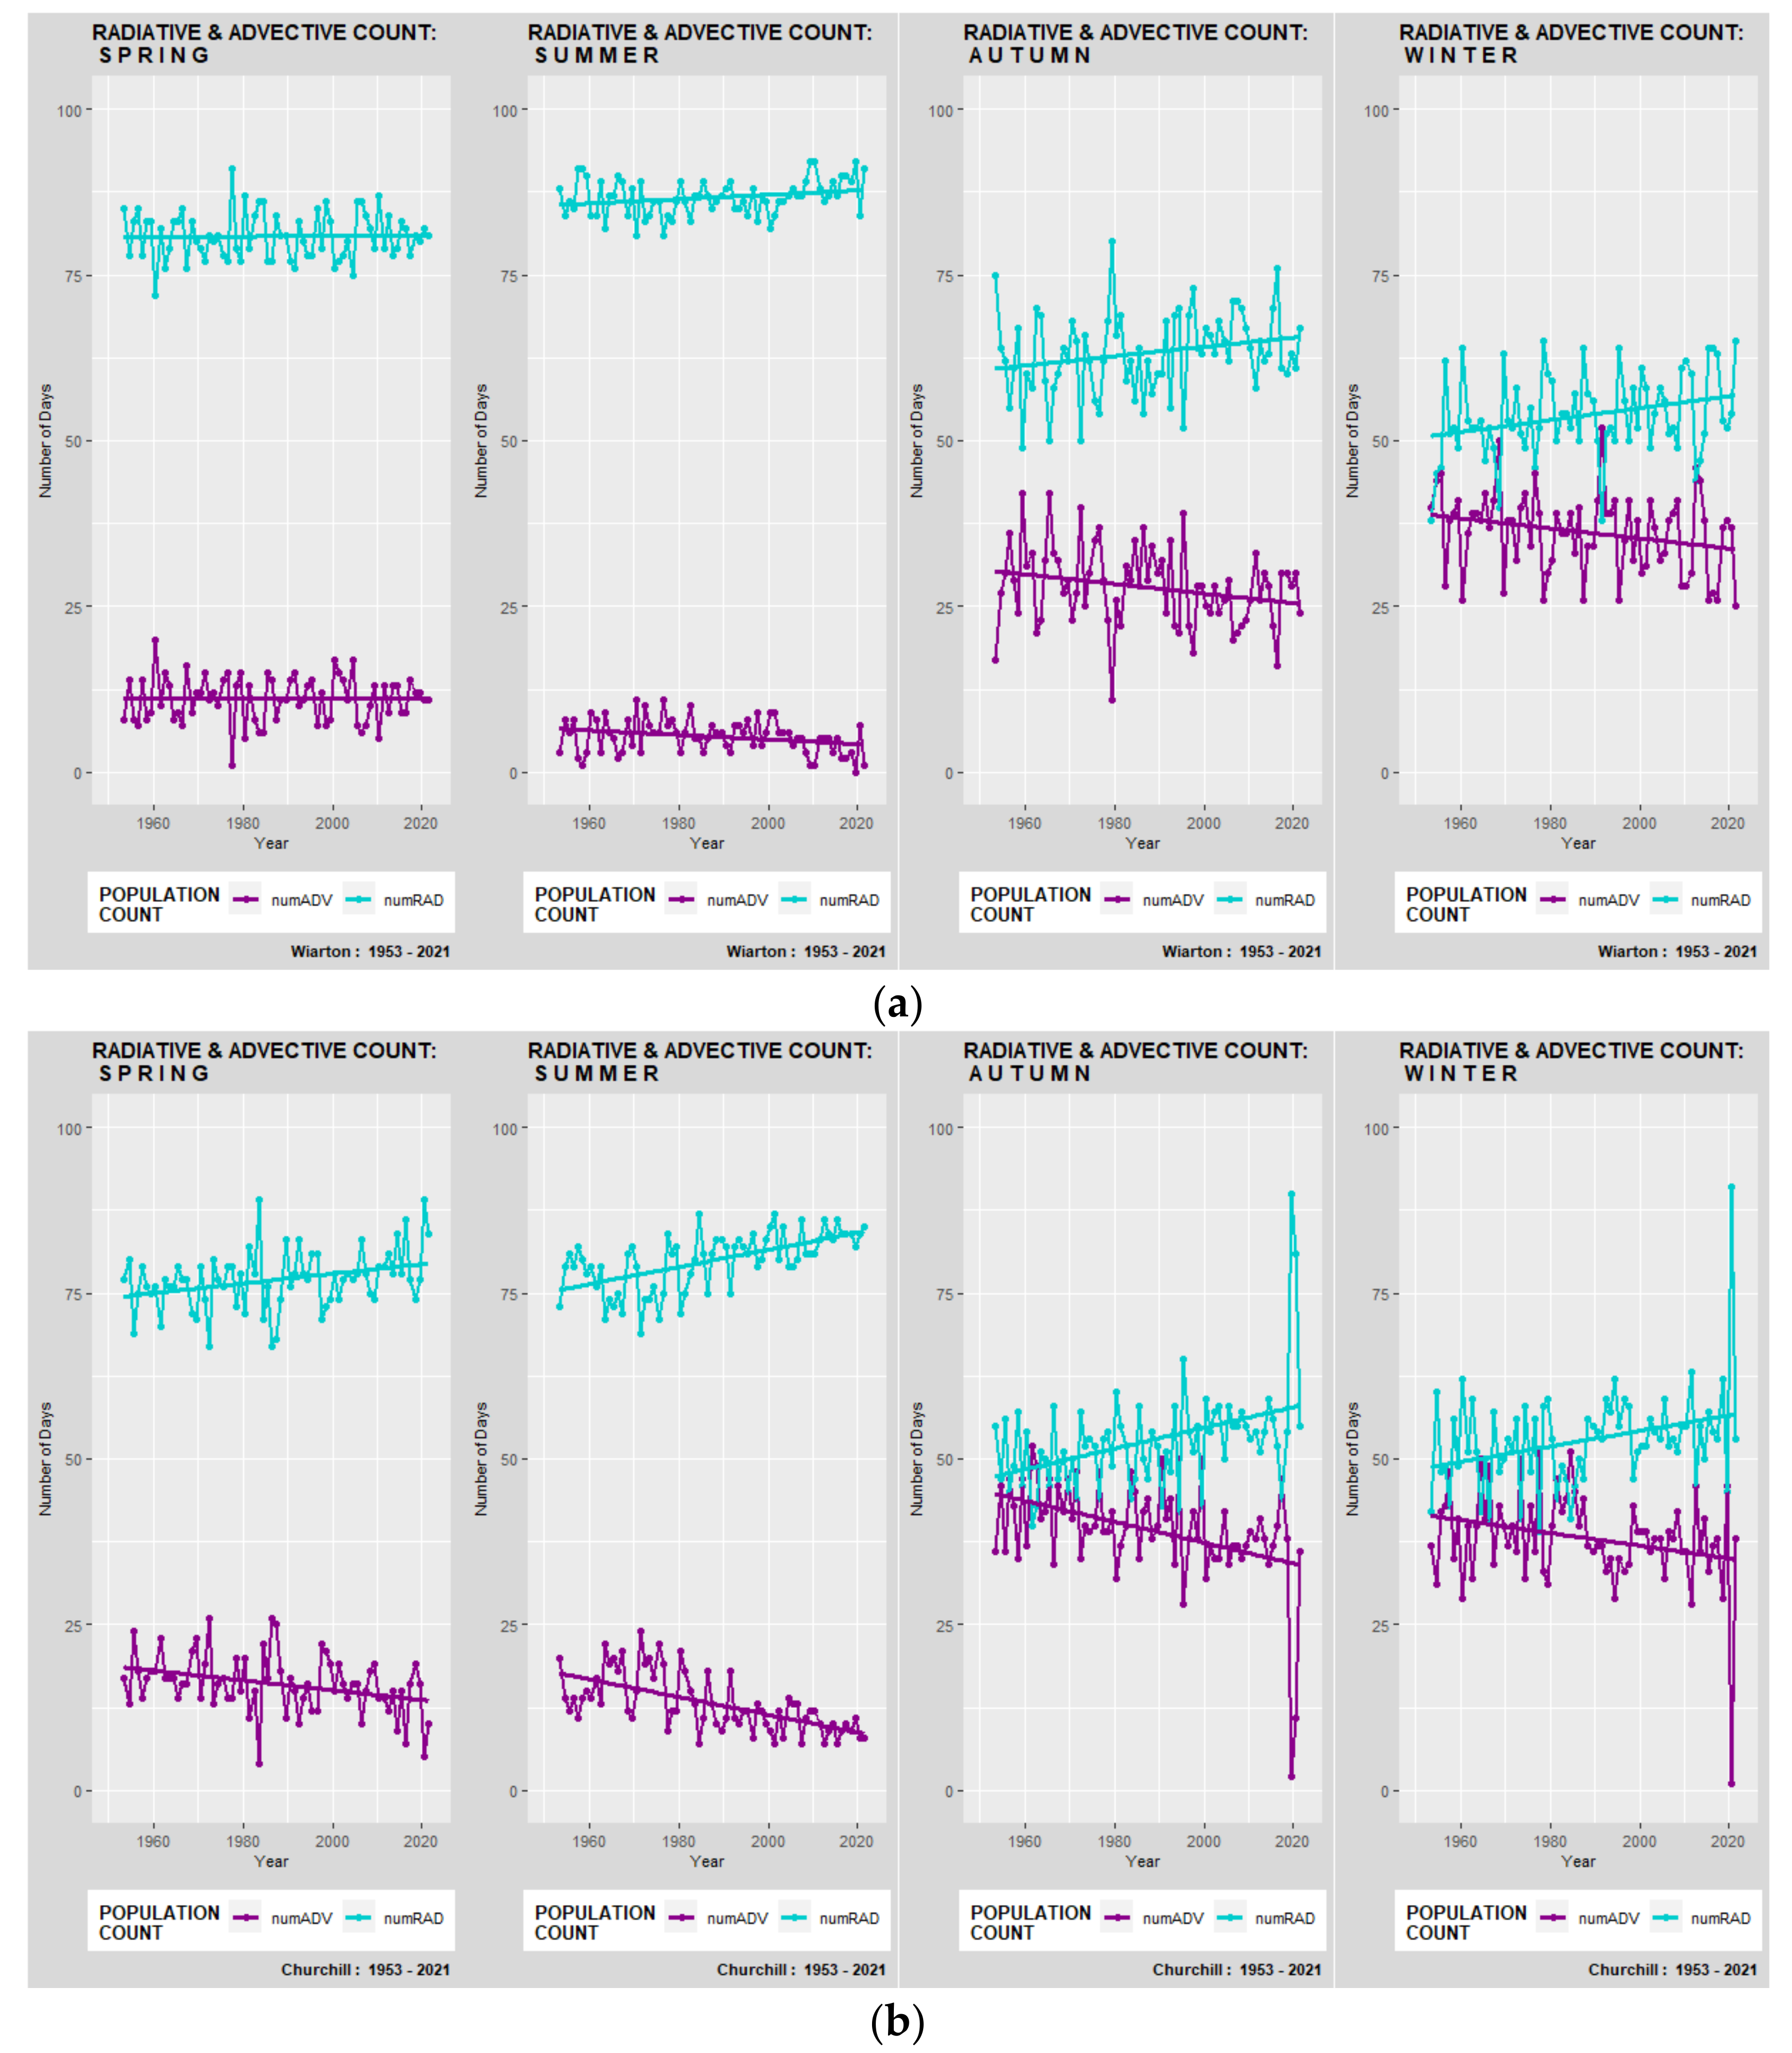
The rates of change in radiative temperature population are lowest in Canada in the GRL region (5/c.). Although generally low, the highest statistically significant annual rate in RPC among the GRL group is observed at Wiarton (19/c.) (Table 2 and Figure 4a). The RPC rates in summer (3/c.) and winter (9/c.) also display statistical significance. Since the increase in the RPC occurs at the expense of the APC (Table 3) the highest significant rate of change in the advective temperature population is observed at Wiarton (−19/c.).
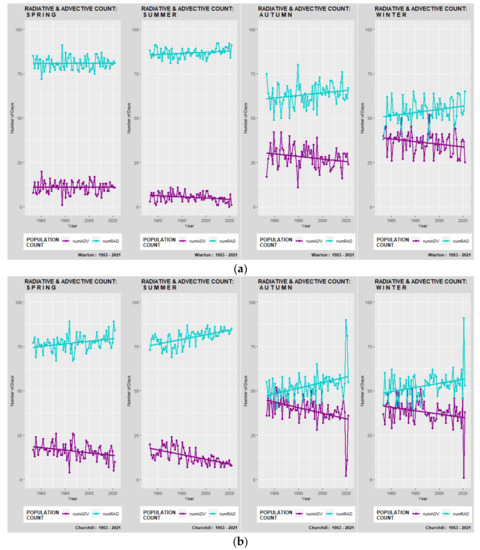
Figure 4.
(a)—Great Lakes/St. Lawrence Lowland (GRL); Wiarton (ON), (b)—Northeastern Forest (NEF); Churchill (MB). Seasonally averaged radiative and advective temperature population counts, listed in order of Spring, Summer, Autumn, and Winter. (a)—Radiative Population Count (RPC) (cyan blue), and Advective Population Count (APC) (purple).
3.2.3. Northeastern Forest (NEF)
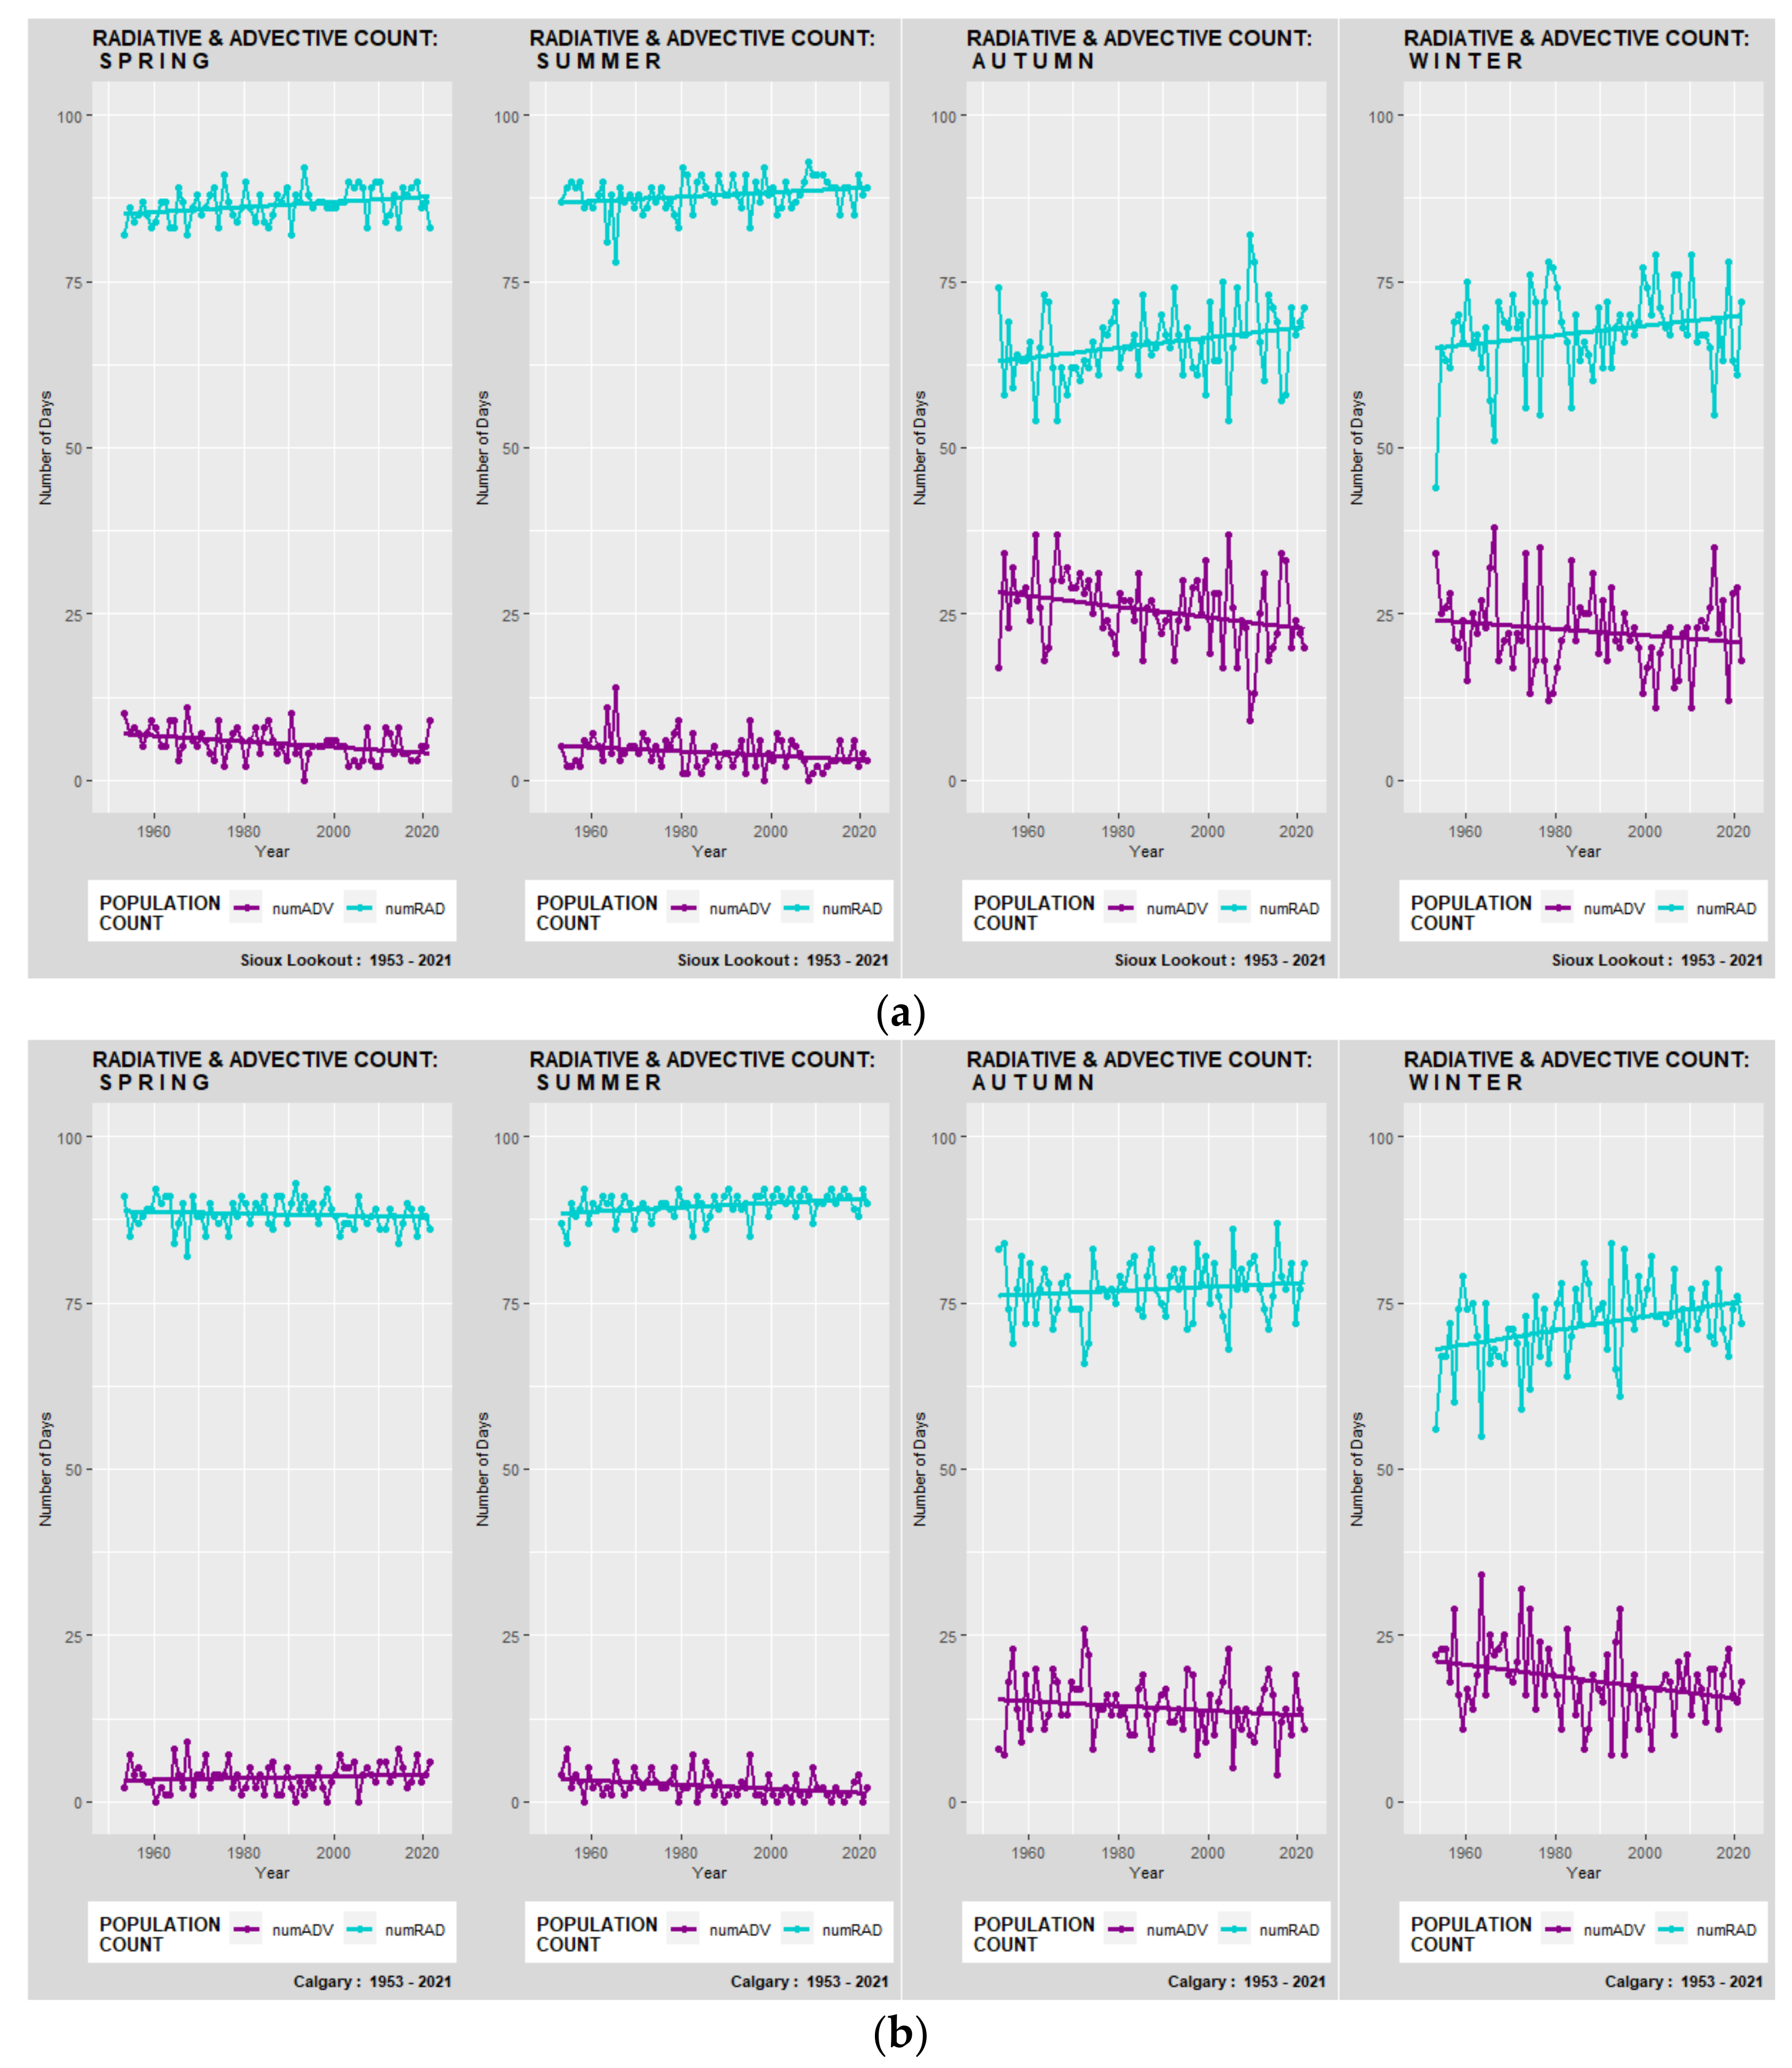
The highest statistically significant annual RPC rates in Canada are observed in the NEF climate region (21/c.) identified at Churchill (16/c.), Goose (12/c.), and Kenora (8/c.). The NEF region is also characterized by the highest summer RPC average (8.3/c.) due to the highest RPC rate observed at Churchill (13/c.) (Table 2). The RPC averages of the NEF stations (Figure 4b and Figure 5a) during the fall season range from anomalously high to high. The NEF stations are also characterized by large winter RPC counts that are statistically non-significant.
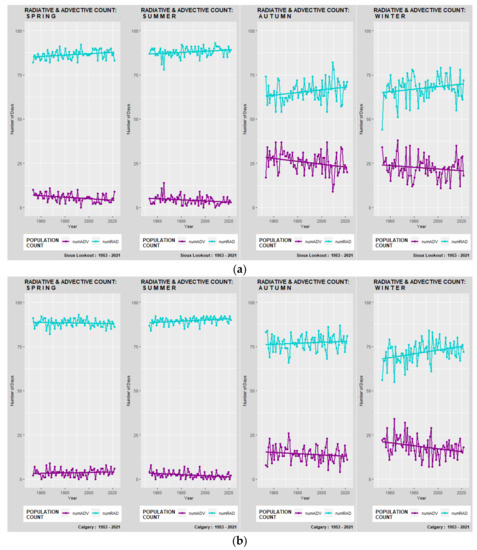
Figure 5.
(a)—Northeastern Forest (NEF); Sioux Lookout (ON), (b)—Prairies (PRA); Calgary (AB). Seasonally averaged radiative and advective temperature population counts, listed in order of Spring, Summer, Autumn, and Winter. (a)—Radiative Population Count (RPC) (cyan blue), and Advective Population Count (APC) (purple).
3.2.4. Northwestern Forest (NWF)
The NWF region is characterized by high statistically significant RPC annual rates. The highest overall rate of change is observed at The Pas (17/c.) followed by Cold Lake (16/c.) and Fort Mc Murray (14/c.). High positive RPC and negative APC rates at Cold Lake, and The Pas during the fall season as well as moderate summer rates at Cold Lake and McMurray are supported by statistical significance.
3.2.5. Prairies (PRA)
The PRA climate region is characterized by high annual statistically significant rates at Calgary (16/c.), Regina (14/c.), and Winnipeg (11/c.). The seasonal features of radiative and advective population counts of the PRA stations during the SS period are moderate to high spring RPC rates statistically significant only at Regina, and statistically significant moderate summer rates observed at Calgary, Estevan, and Regina. The FW period is characterized by the non-significant low RPC rates during the fall season, and high winter RPC rates with statistical significance observed at Calgary (11/c.) (Figure 5b).
3.2.6. South British Columbia Mountains (SBC)
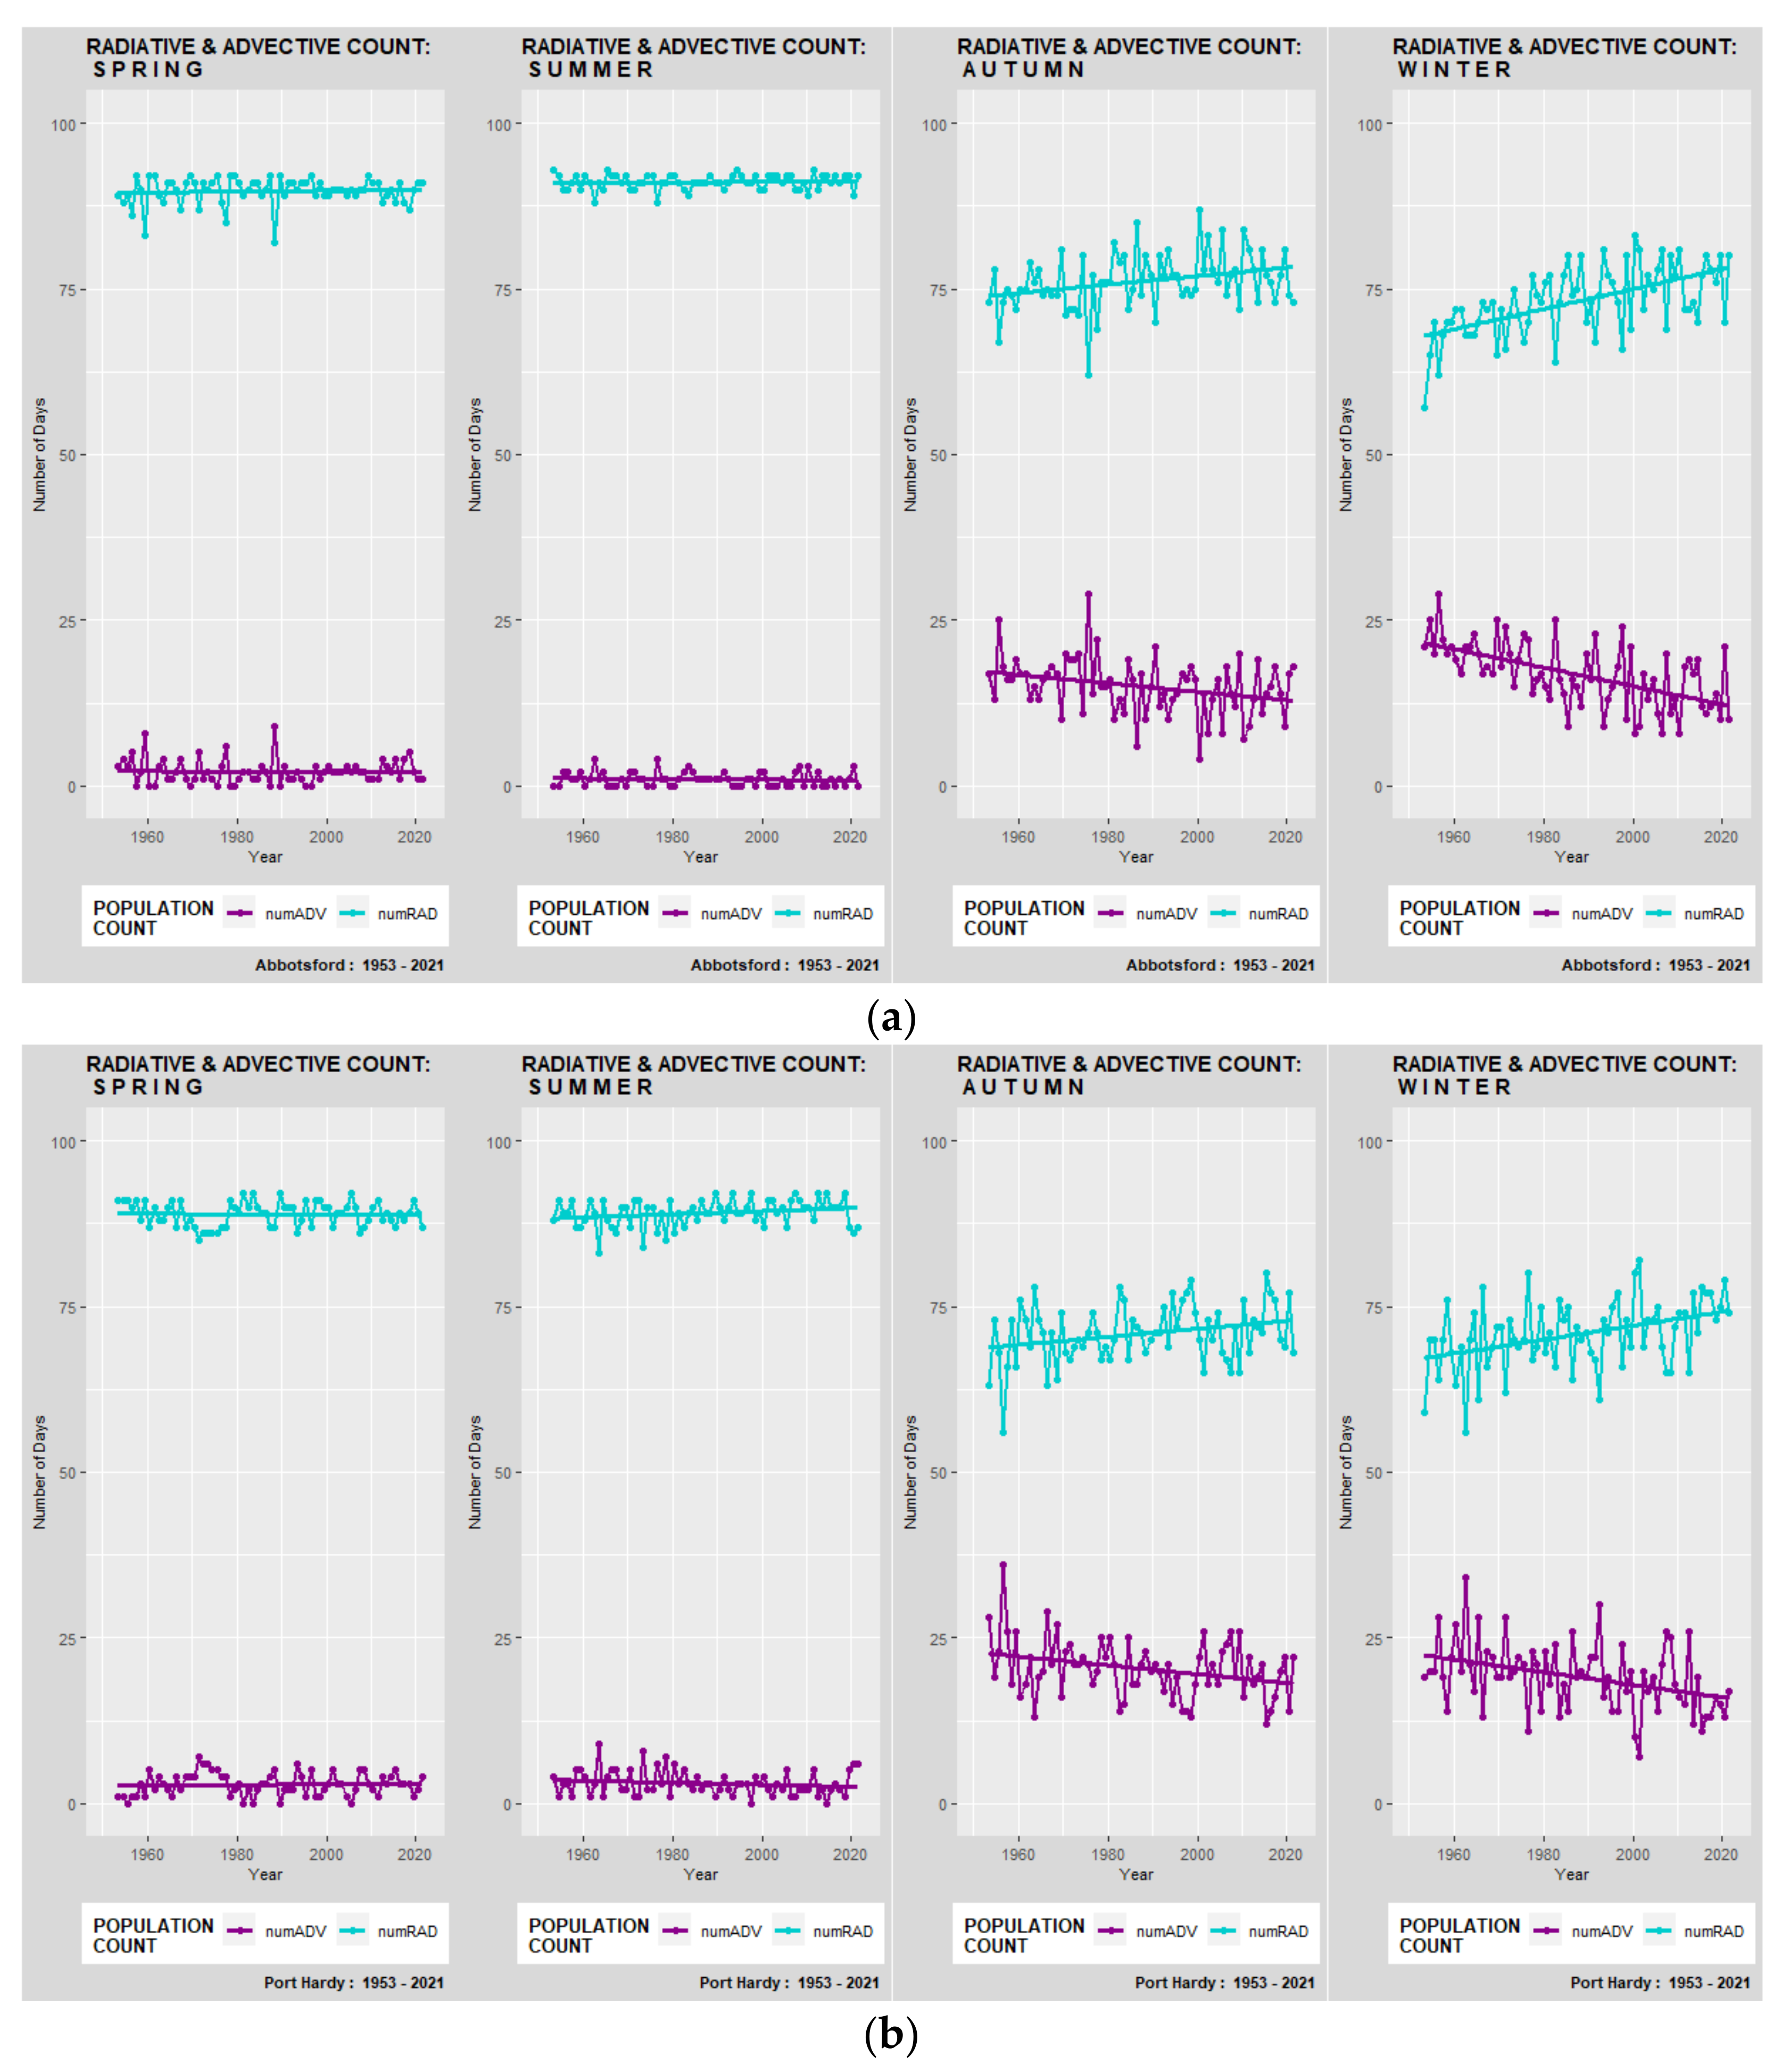
The SBC climate region is represented in this study with one station. The majority of Abbotsford’s substantial RPC (22/c.) is due to the highest rates of change observed during the winter (15/c.) and, to a lesser degree, fall (6/c.) seasons (Figure 6a). The APC decline rate is likewise among the highest statistically significant rates of change observed across the studied data sets.
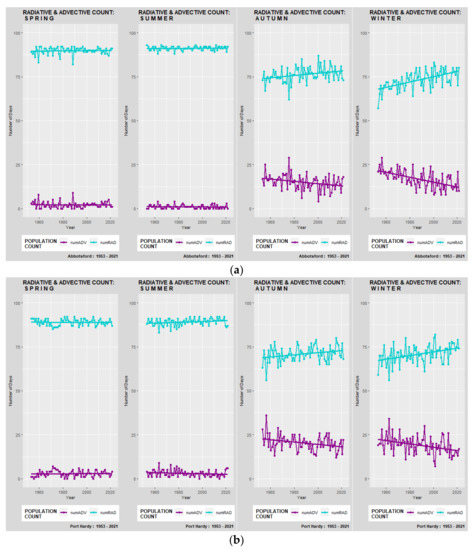
Figure 6.
(a)—South British Columbia Mountains (SBC); Abbotsford (BC), (b)—Pacific Coast (PAC); Port Hardy (BC). Seasonally averaged radiative and advective temperature population counts, listed in order of Spring, Summer, Autumn, and Winter. (a)—Radiative Population Count (RPC) (cyan blue), and Advective Population Count (APC) (purple).
3.2.7. Pacific Coast (PAC)
Members of the PAC climate group exhibit very high statistically significant RPC and APC rates of change at all stations. The highest annual RPC rates are observed at Port Hardy (19/c.) (Figure 6b), followed by Comox (18/c.), Victoria (17/c.), and Vancouver (14/c.) stations. Statistically significant positive RPC and negative APC rates are observed at Comox during spring, at Comox and Victoria during summer, at all stations except Victoria during the fall season, and at Port Hardy and Victoria during winter.
3.2.8. North British Columbia Mountains/Yukon Territory (NBC)
The NBC climate region is presented in this study by two stations with high RPC rates of change. Watson Lake is characterized by a high significant fall RPC rate (10/c.) while Whitehorse exhibits a high significant winter RPC rate (11/c.). The NBC members are characterized by the absence of summer changes (0/c.) or the significance of changes in the RTP and ATP rates during the spring season.
3.2.9. Mackenzie District (MCD)
The MCD group exhibits the second-highest statistically significant annual rates of change in the RPC and the ATC originating from large changes introduced during the fall rather than the winter season. High statistically significant RPC rate at Hay River (6/c.) (Figure 7a) during the spring and summer season and at Yellowknife (5/c.) during spring contribute to the overall magnitude of the RPC and APC change in the MCD region.
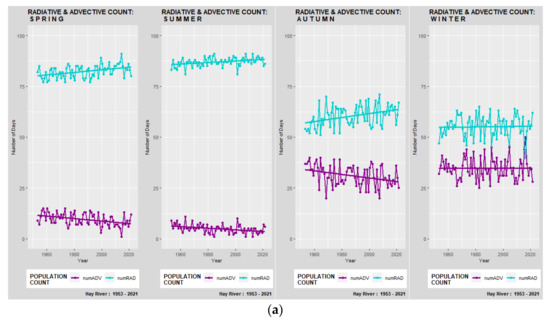
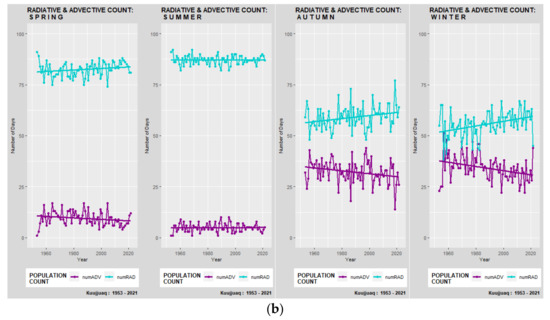
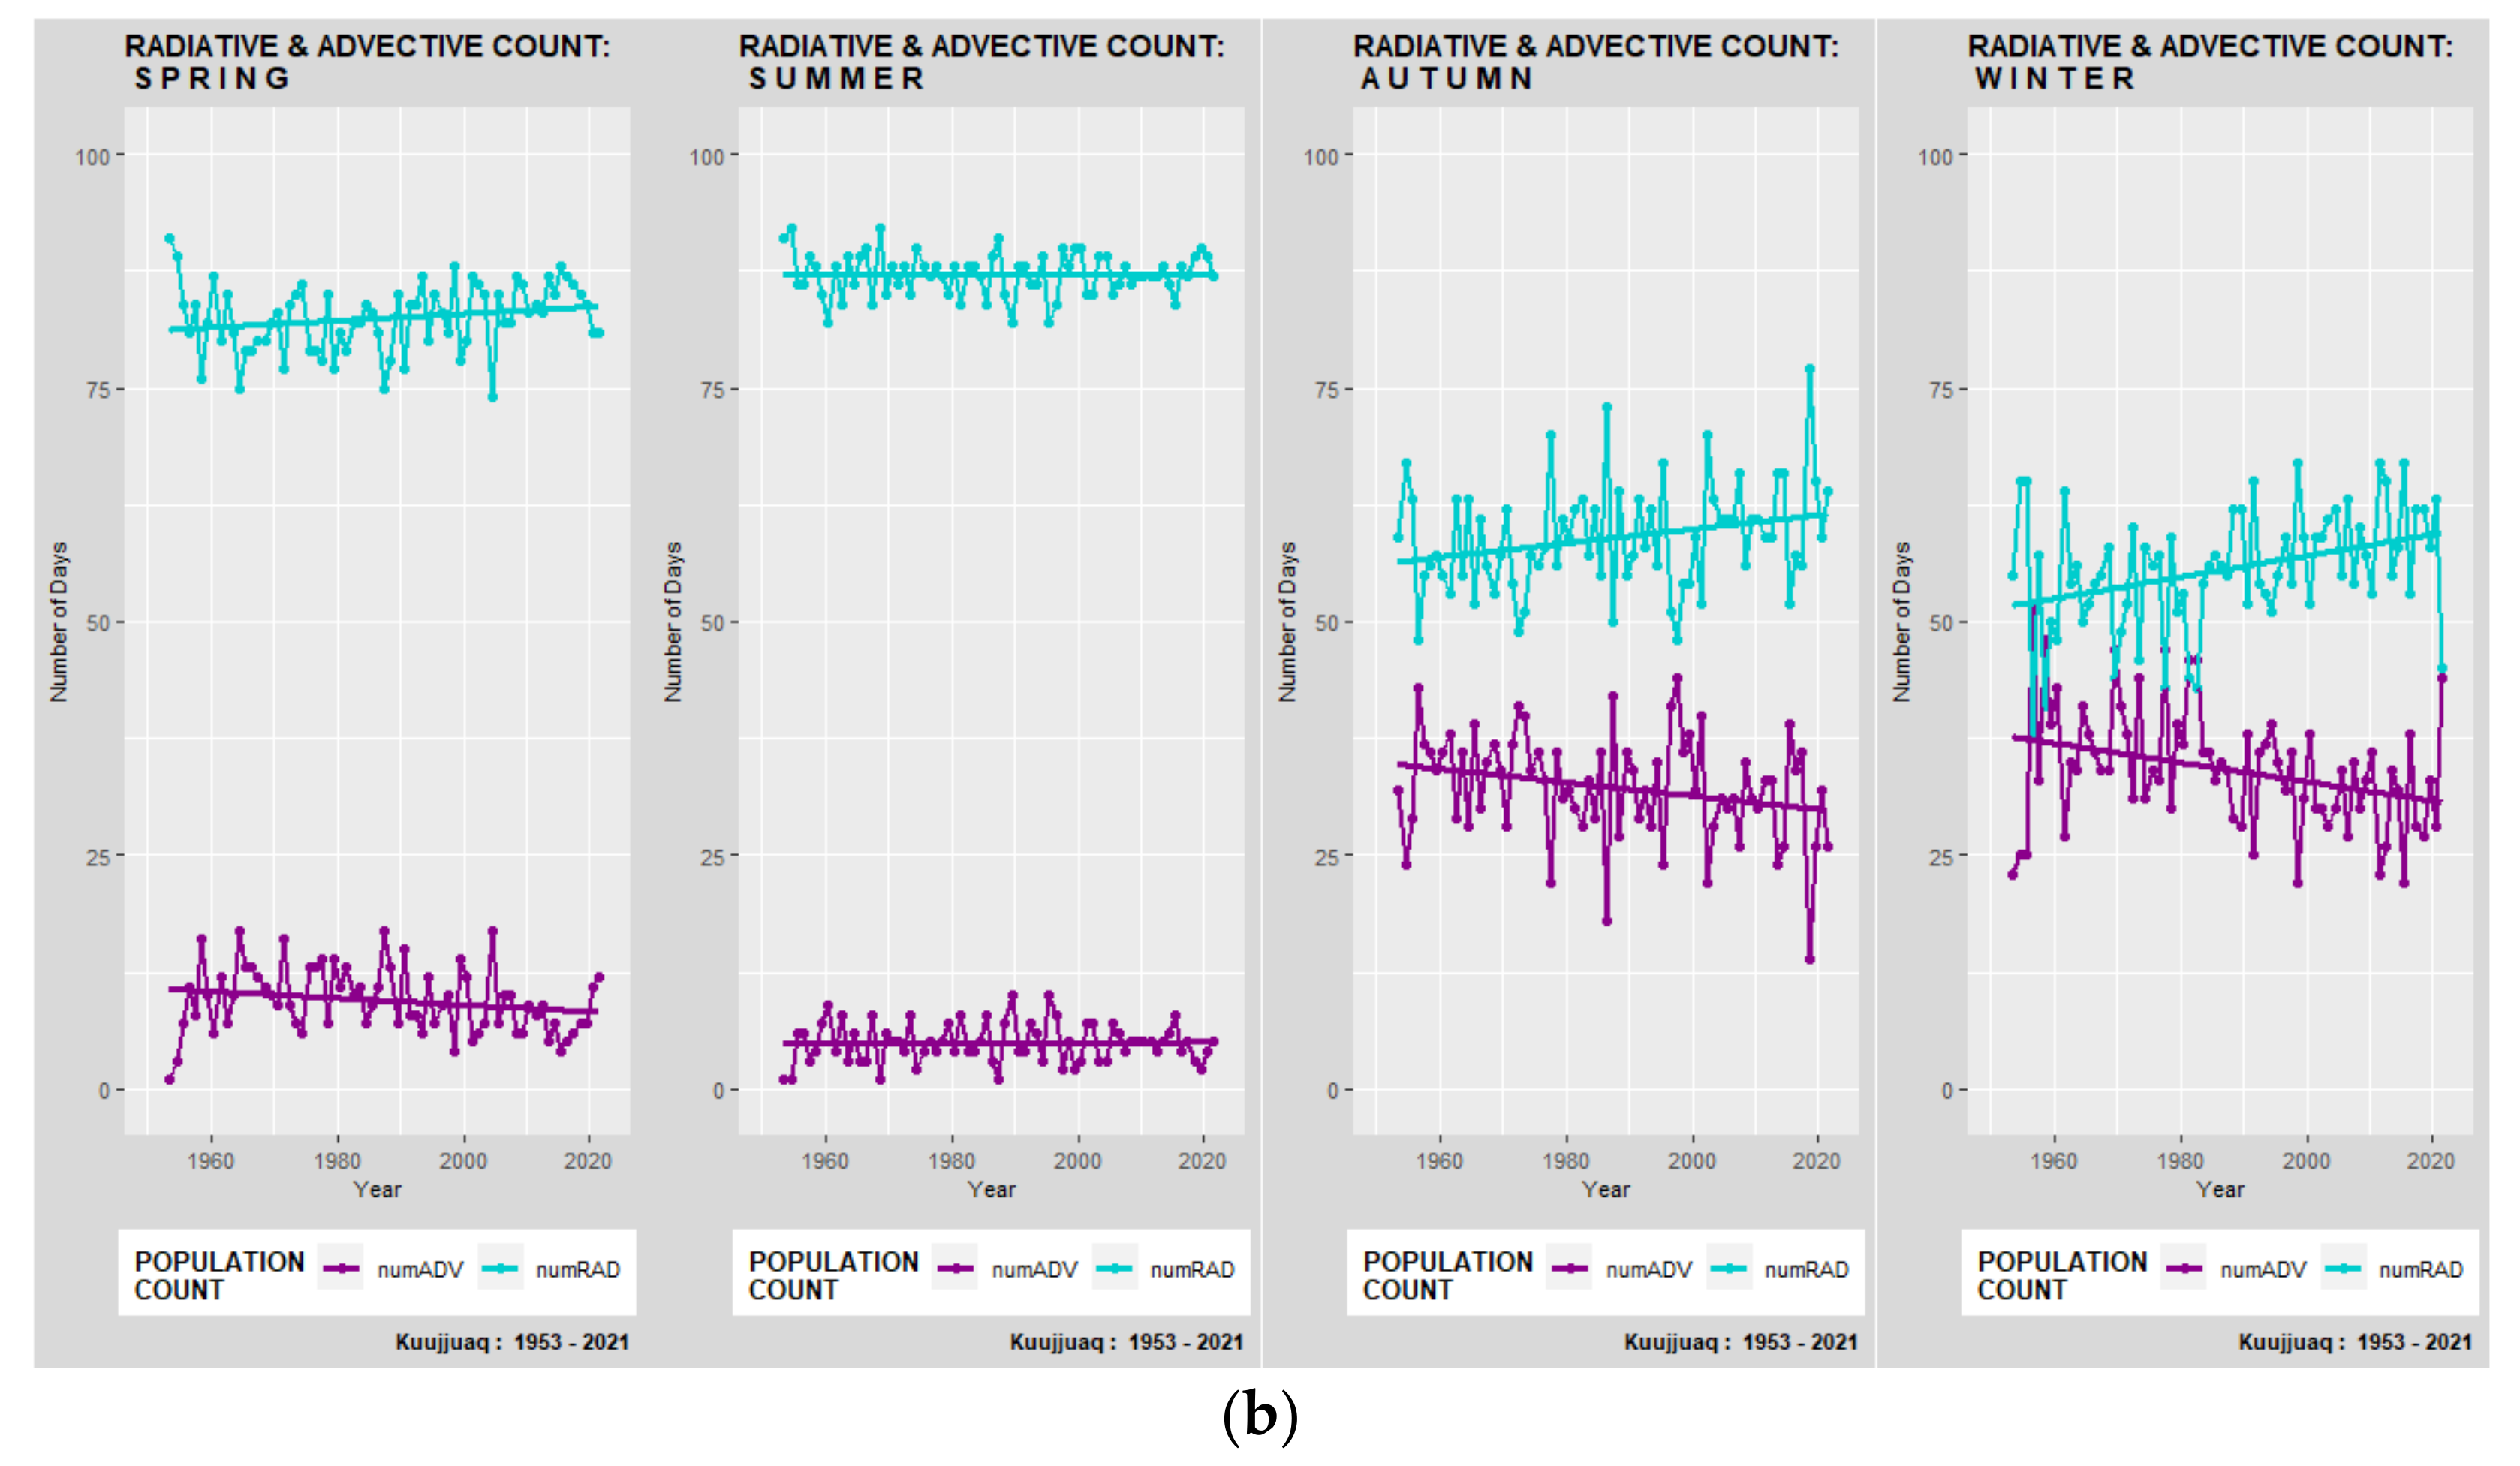
Figure 7.
(a)—Mackenzie District (MCD); Hay River (NT), (b)—Arctic Tundra (ART); Kuujjuaq (QC). Seasonally averaged radiative and advective temperature population counts, listed in order of Spring, Summer, Autumn, and Winter. (a)—Radiative Population Count (RPC) (cyan blue), and Advective Population Count (APC) (purple).
3.2.10. Arctic Tundra (ART)
The ART region is represented by two high latitude stations, Baker Lake (64.3° N) and Kuujjuaq (58.1° N) (Figure 7b) both characterized by high, statistically significant RPC rates (20/c. and 22/c.). Substantial changes in the RPC and APC rates in the ART region result from large, statistically significant fall rates in addition to a high winter (11/c.) and spring rate (4/c.) at Kuujjuaq.
3.2.11. Arctic Mountains and Fiords (ARM)
A single high latitude representative of the ARM climate region, the Iqaluit station (63.7° N) is characterized by statistically non-significant mid-range winter and fall RPC rates (5/c.), a low spring APC rate (1/c.), and the absence of any RPC or APC changes during the summer season.
3.3. Seasonal Biases and Trends of Total, Radiative, and Advective Temperature Populations
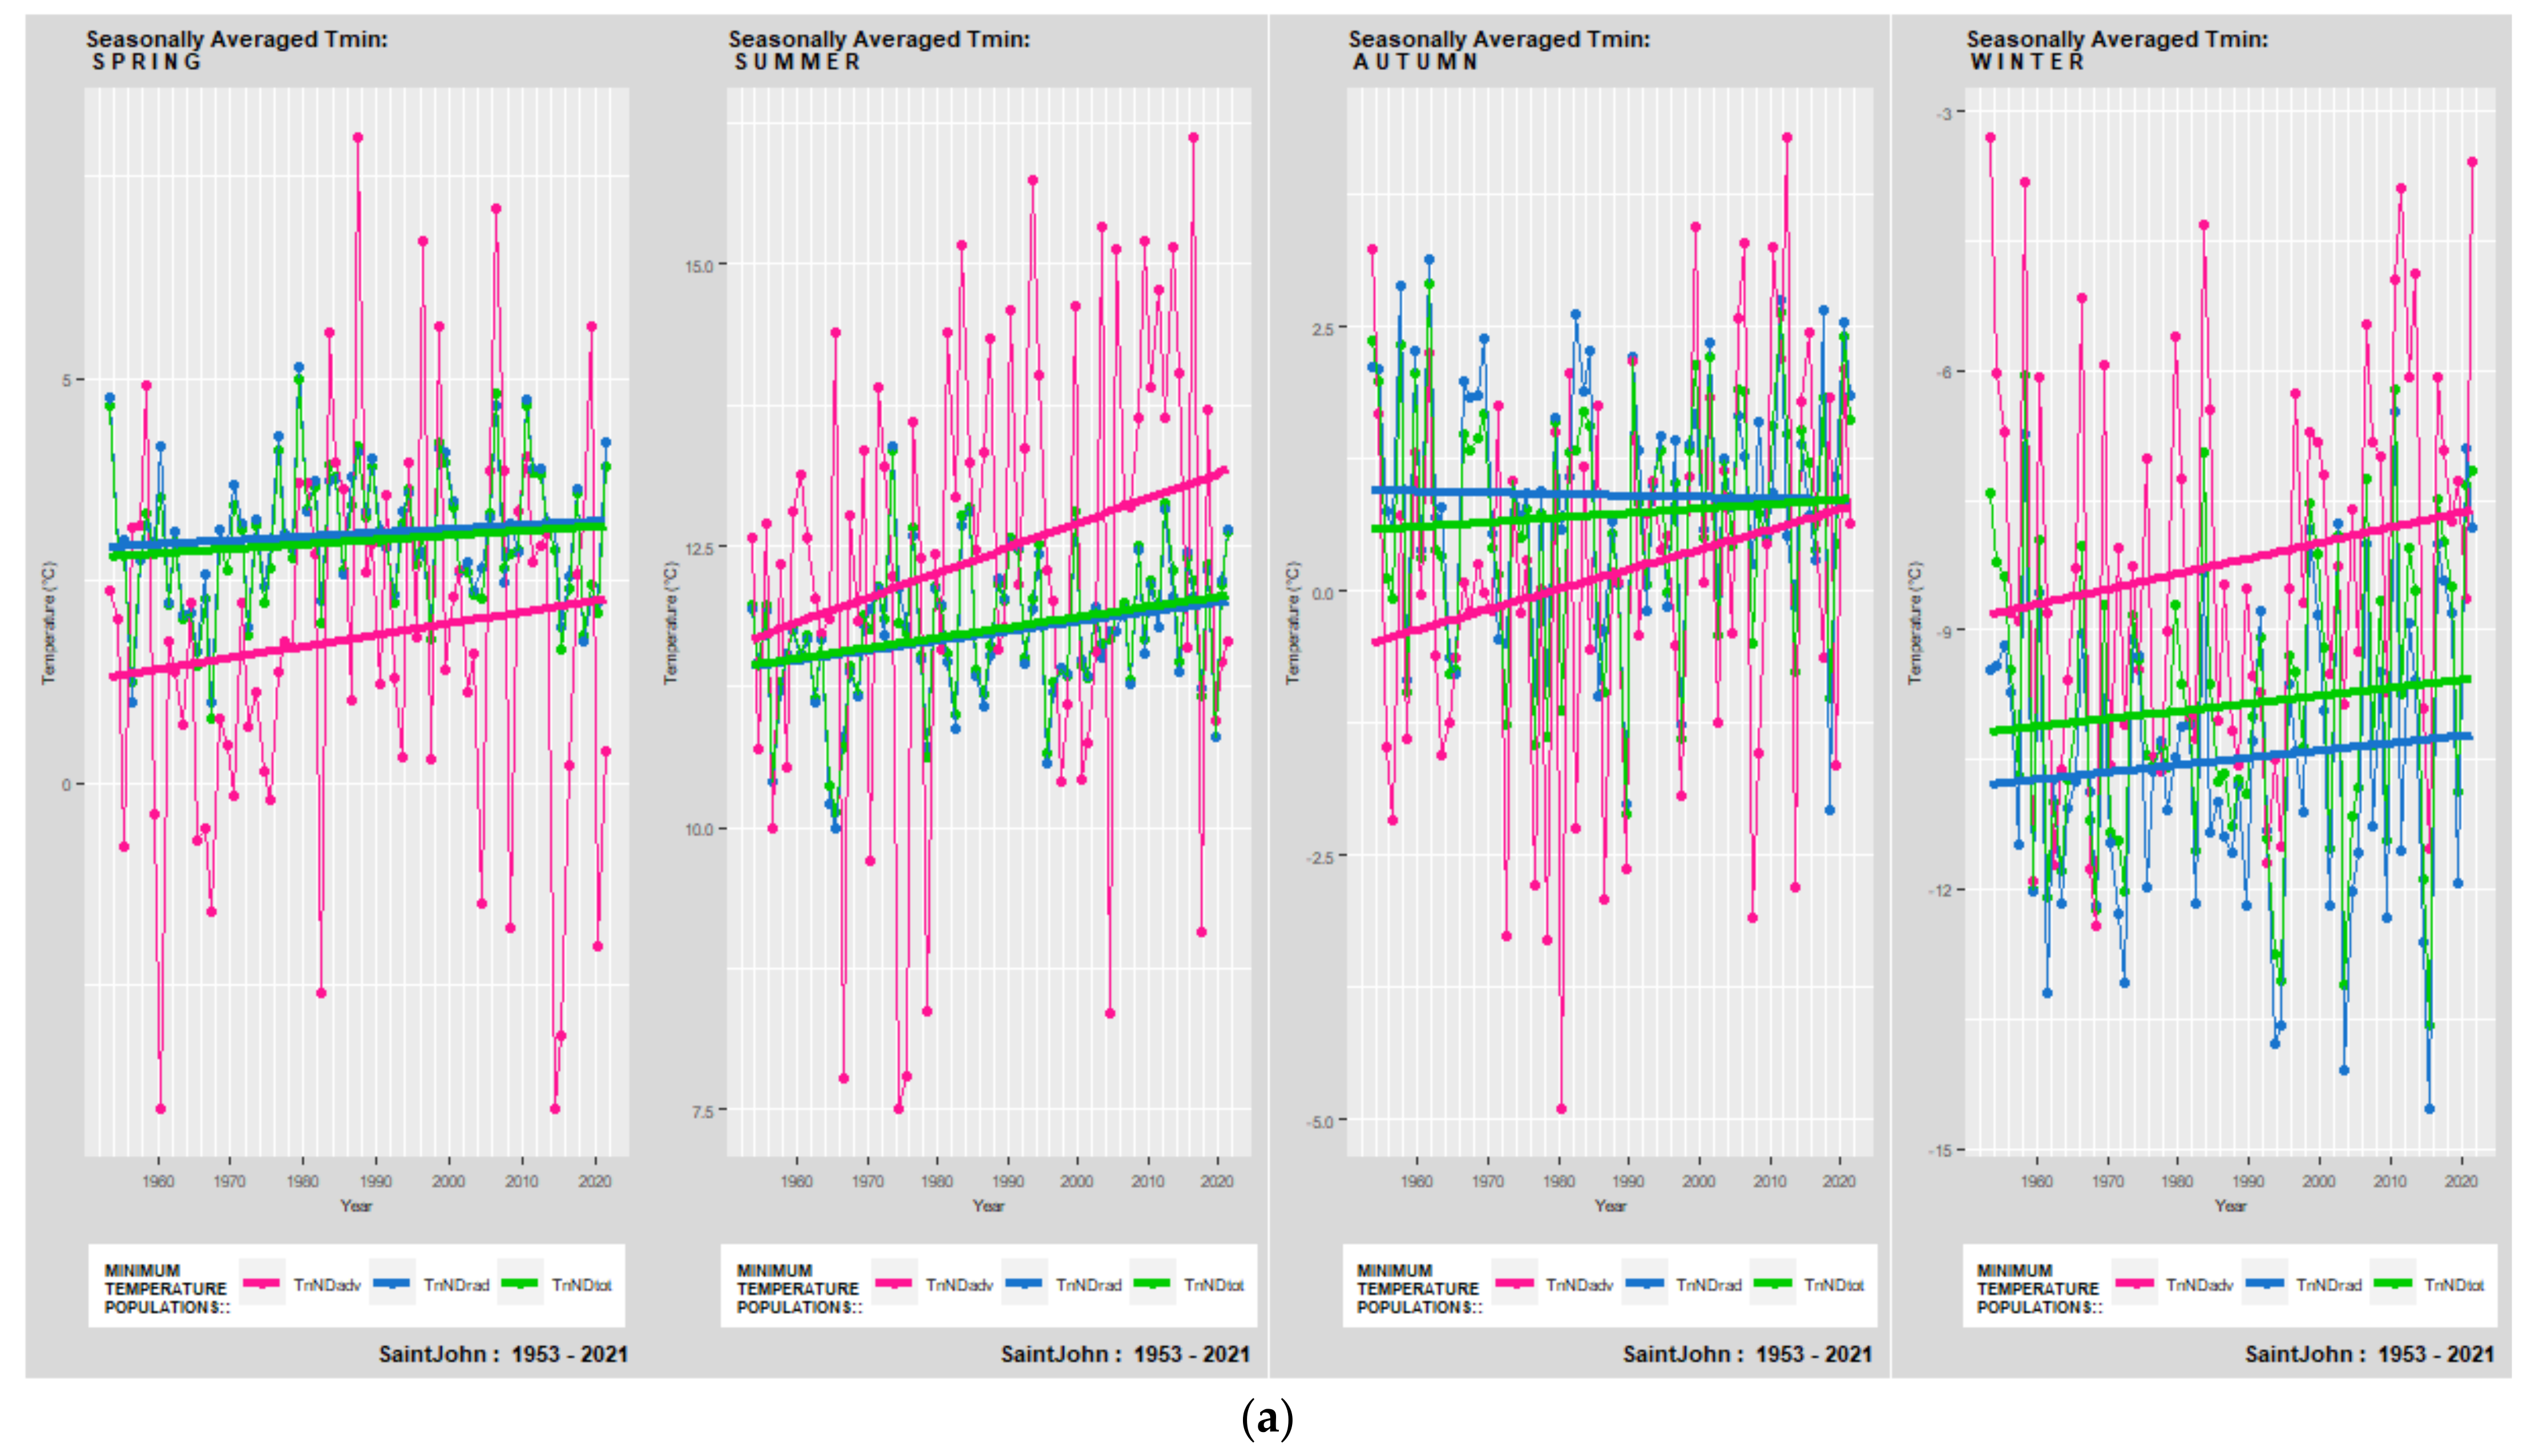
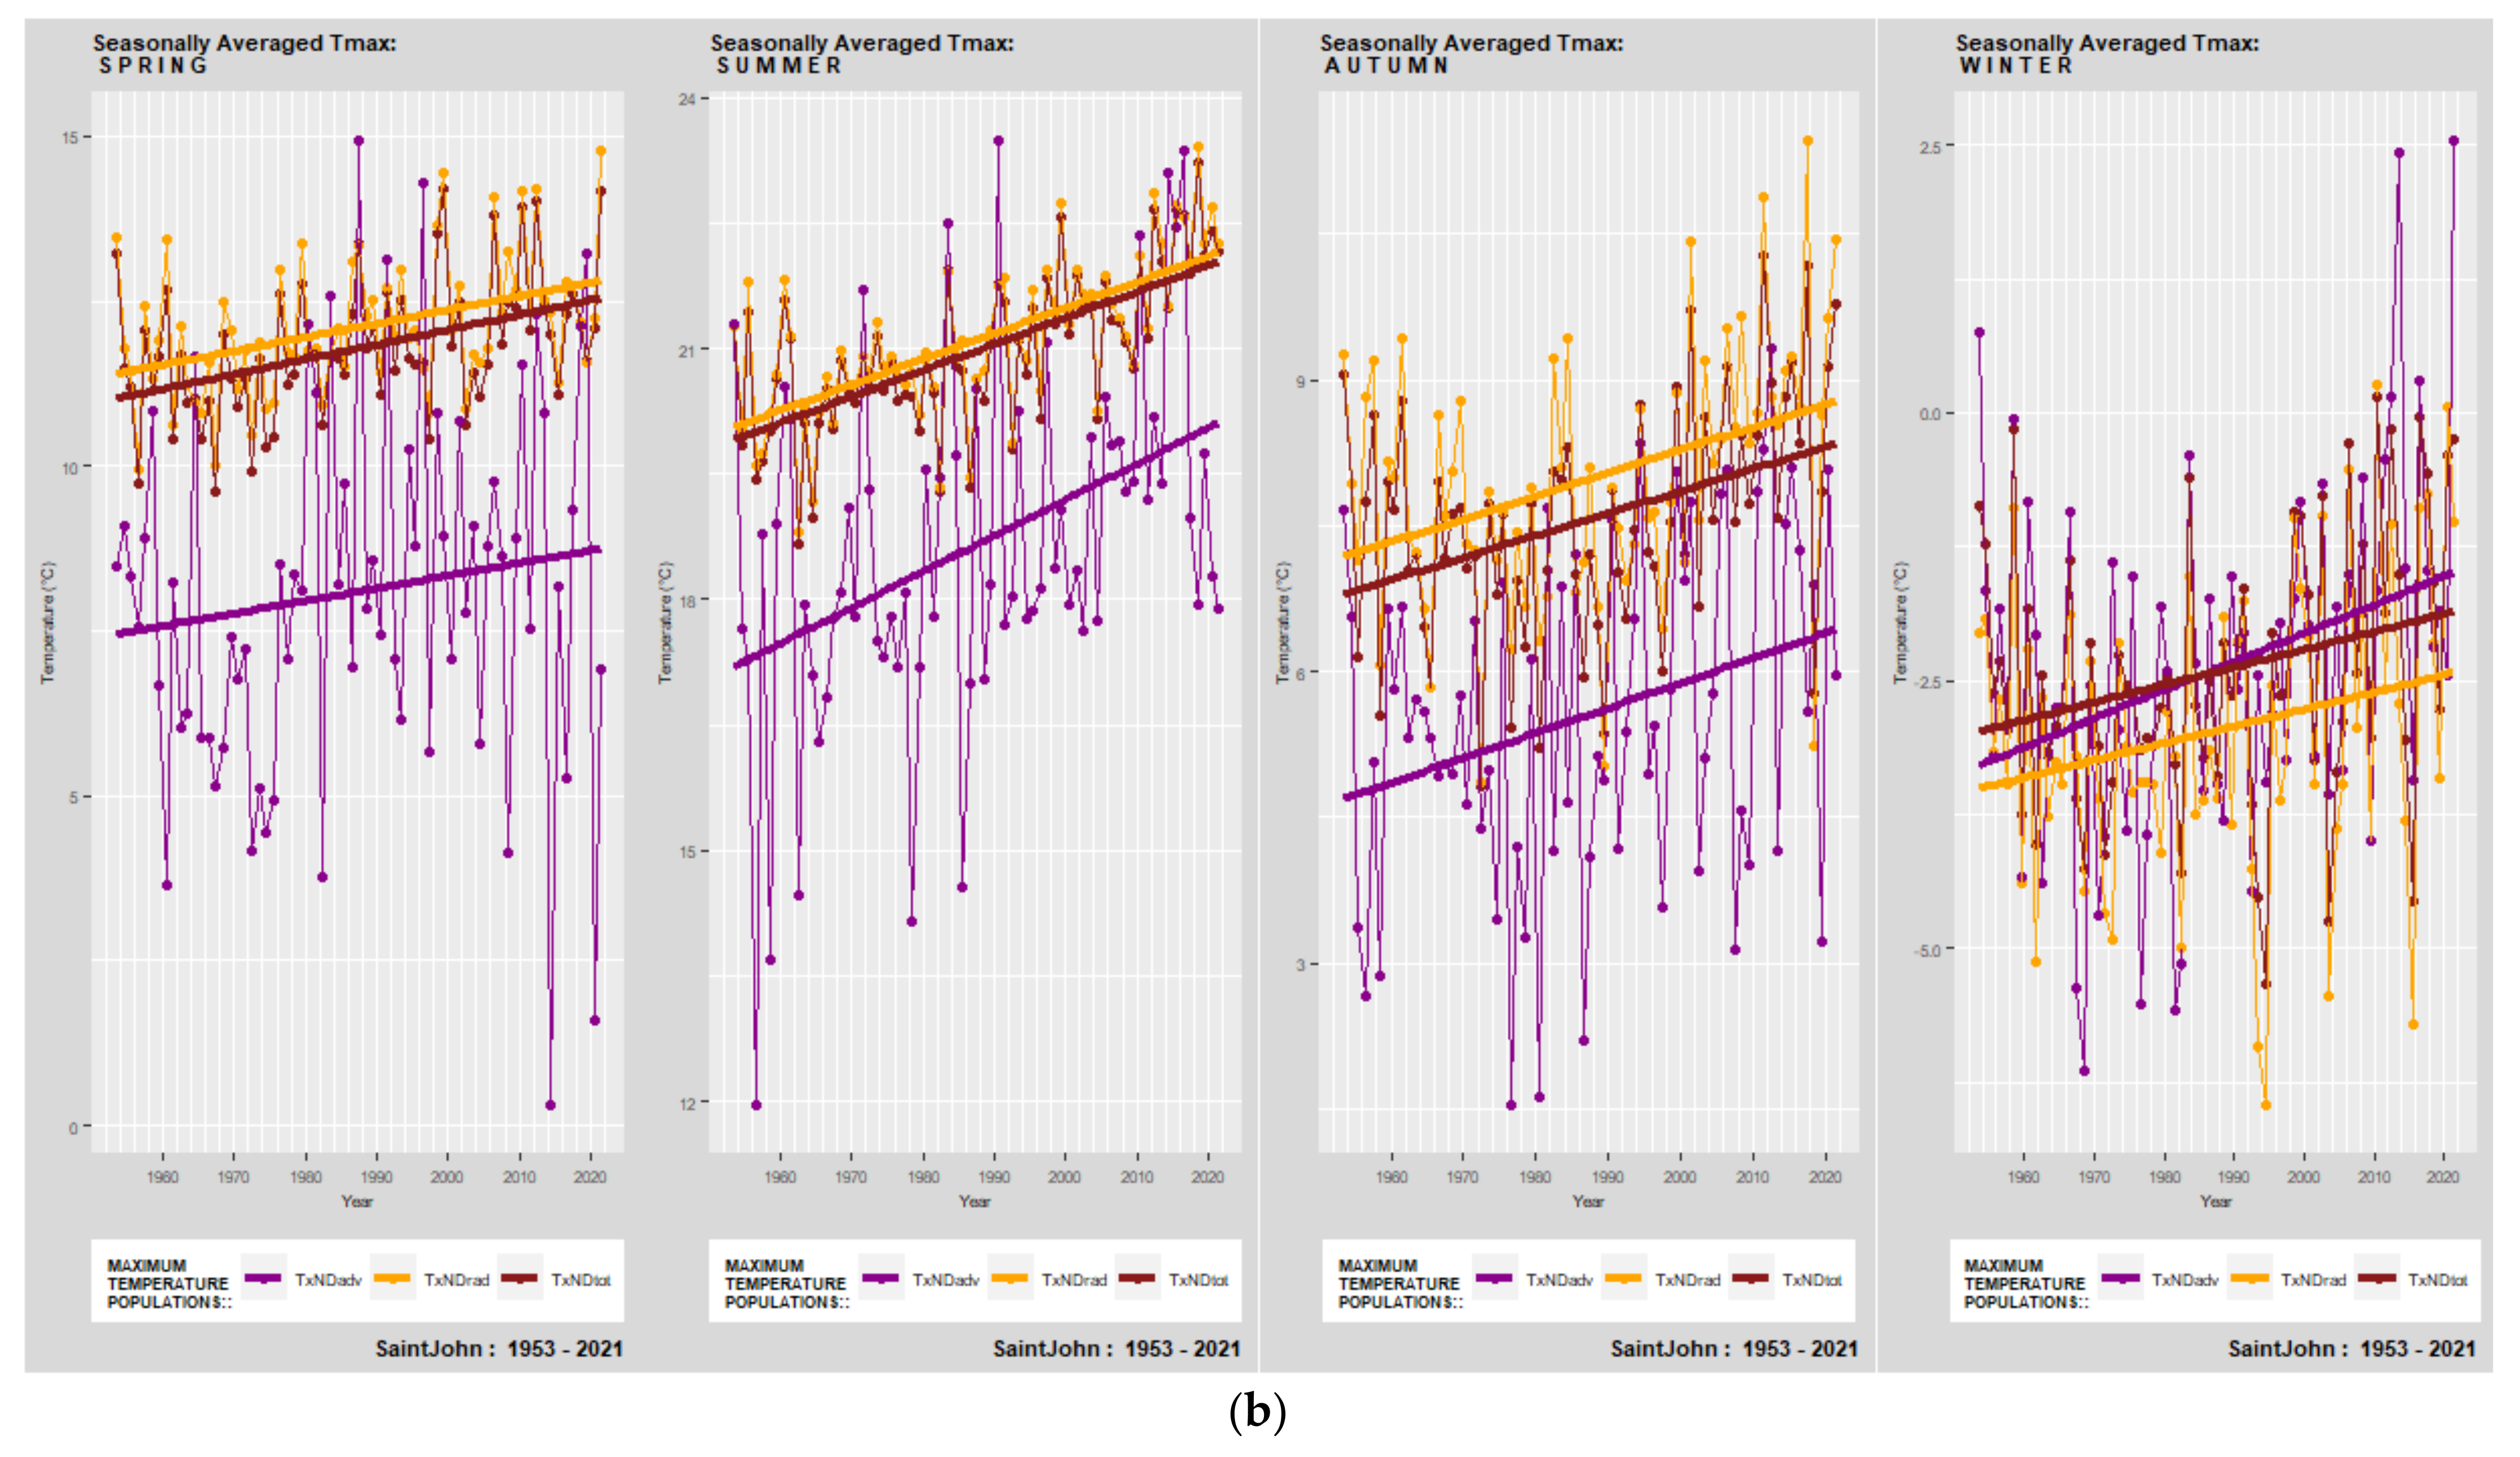
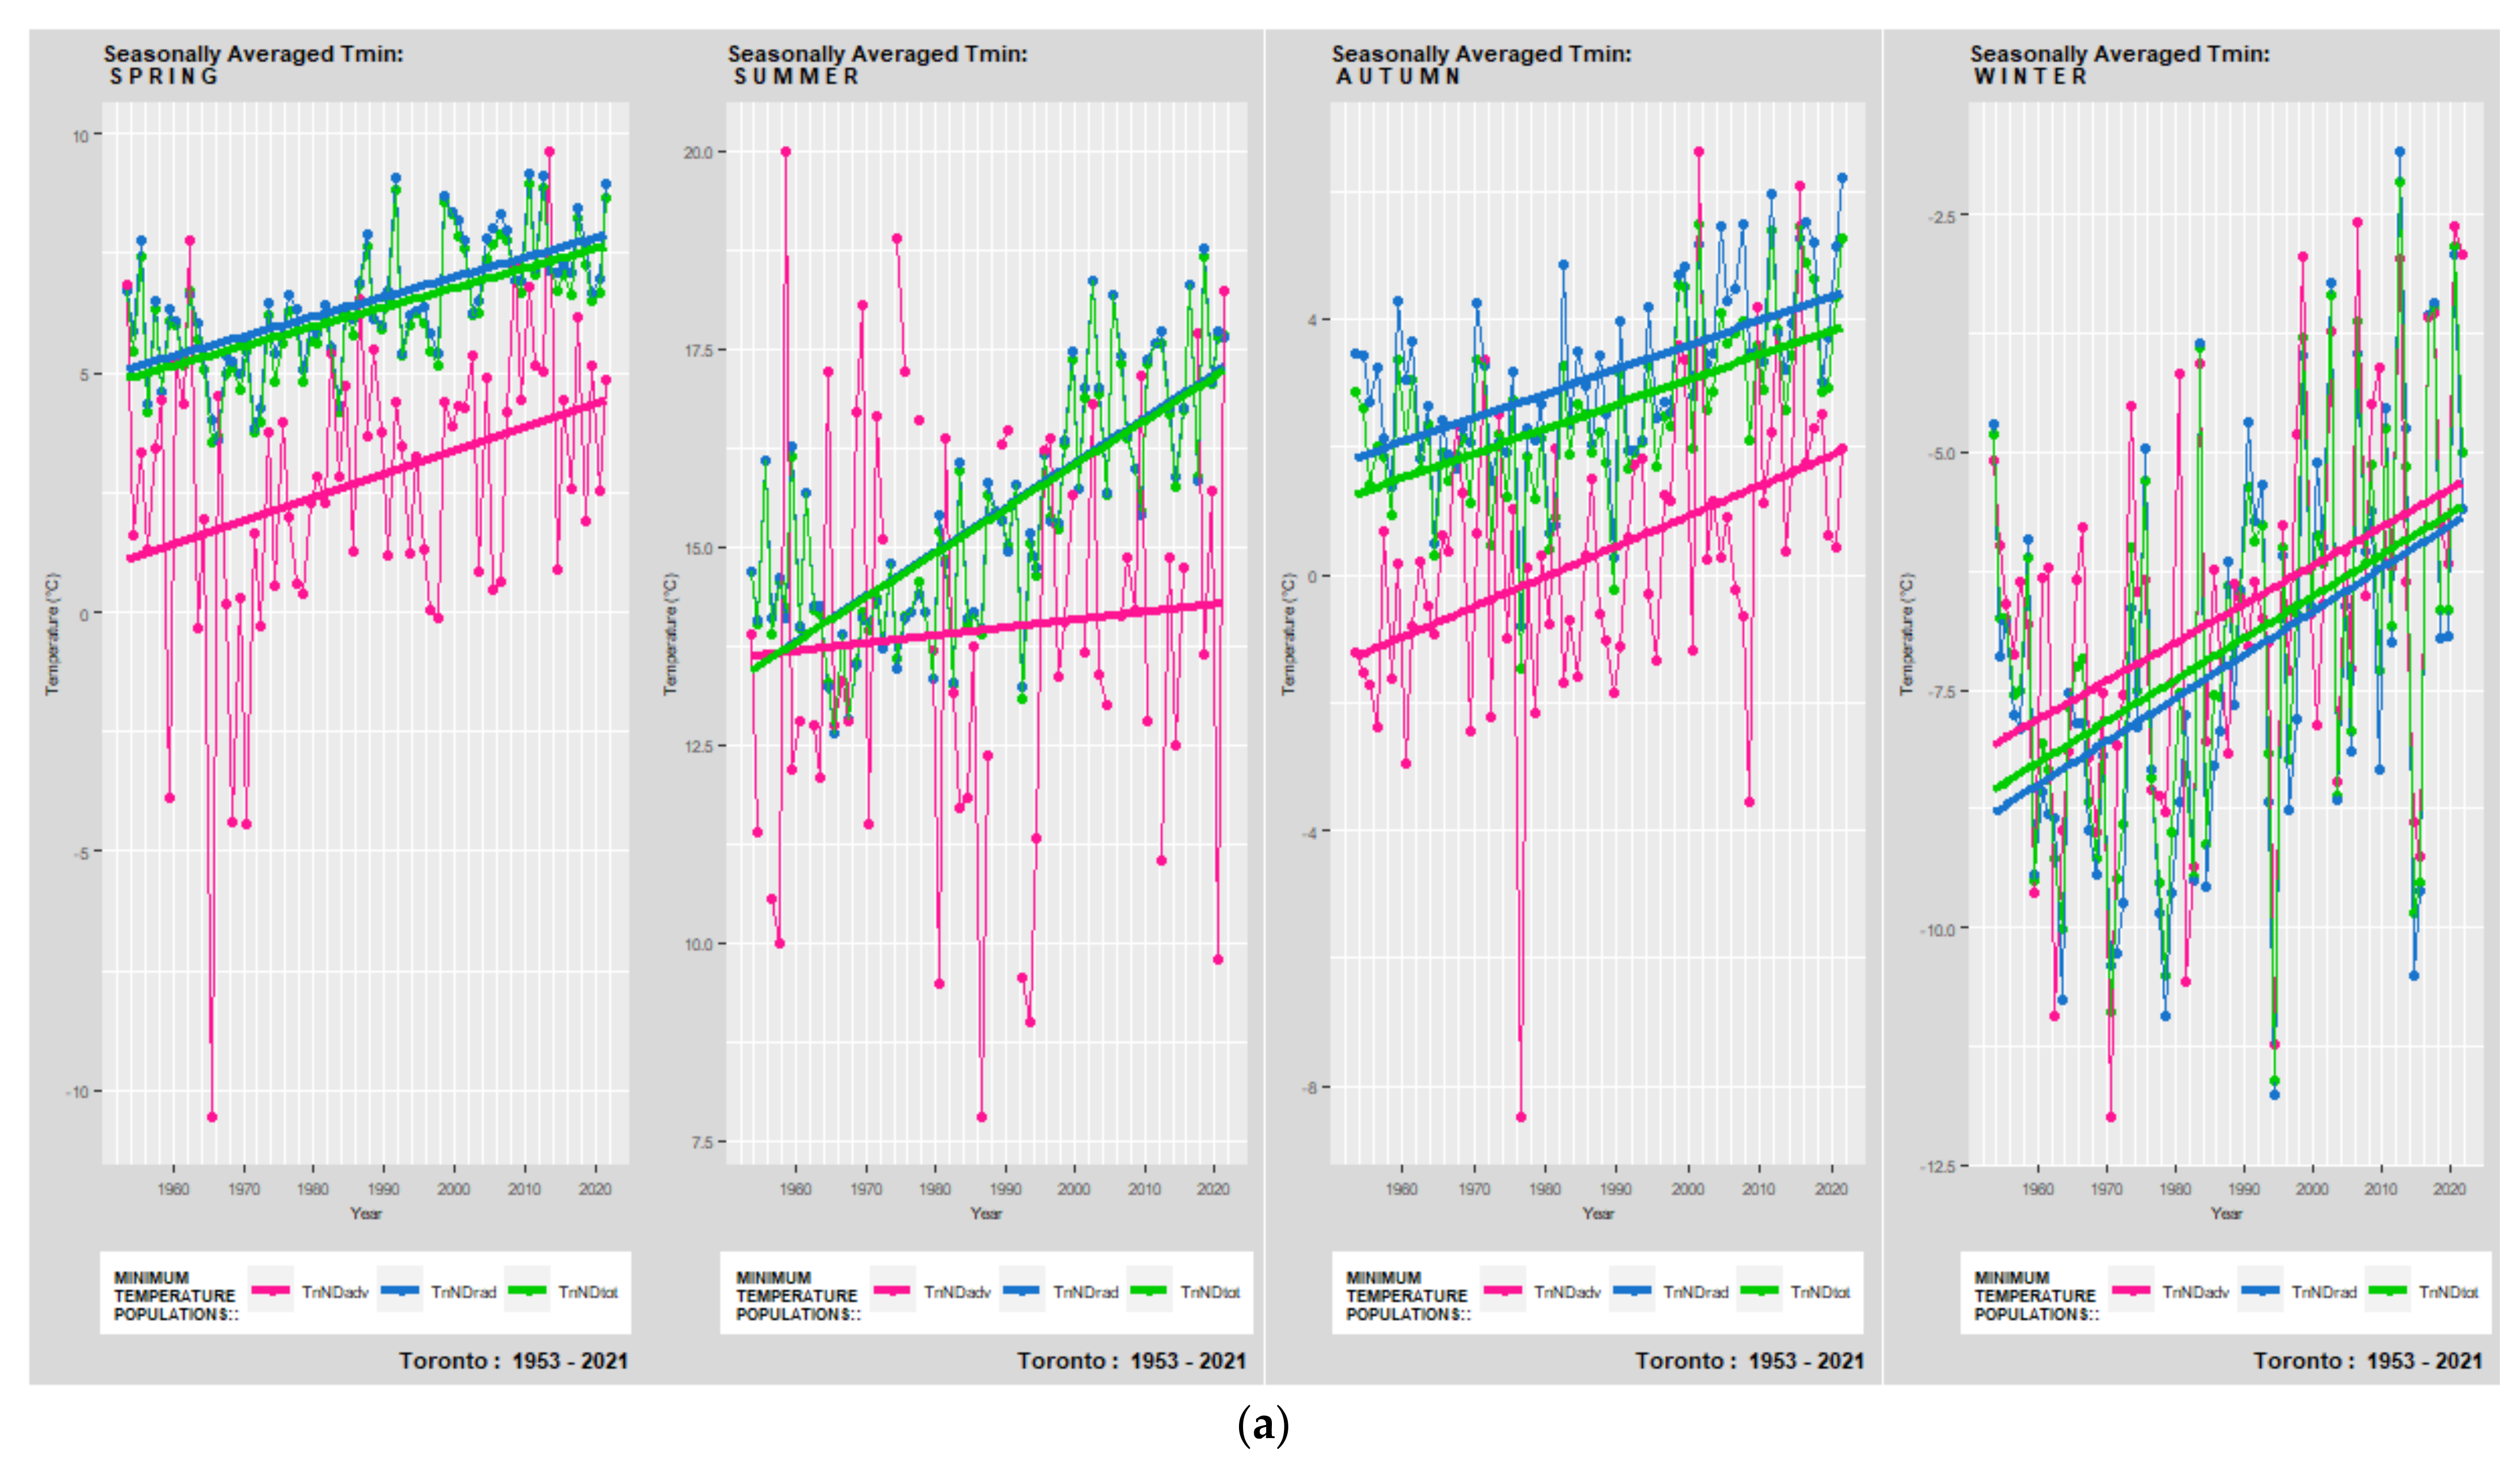
This section discusses seasonal bias between homogeneous temperature populations and the time evolution of their seasonal temperature trends. Table 4 and Table 5 present annual and seasonal slopes of total, radiative and advective minima and maxima temperature trends. Annually and seasonally averaged advective minima and maxima are substantially cooler than the radiative and total temperature populations. Figure 8, Figure 9, Figure 10, Figure 11, Figure 12 and Figure 13 present total, radiative and advective minima, and maxima air temperature populations at Saint John, Toronto, Churchill, Port Hardy, Norman Wells, and Baker Lake. The top graphs present the total temperature population of minima (TTn) (green), radiative temperature minima (TRn) (blue), and advective temperature minima (TAn) (pink). The lower graphs display the total temperature population of maxima (TTx) (brown), radiative temperature maxima (TRx) (orange), and advective temperature maxima (TAx) (purple).
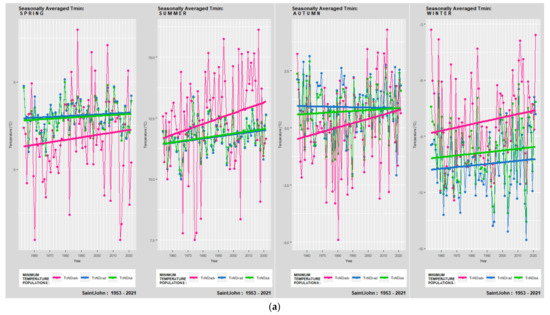
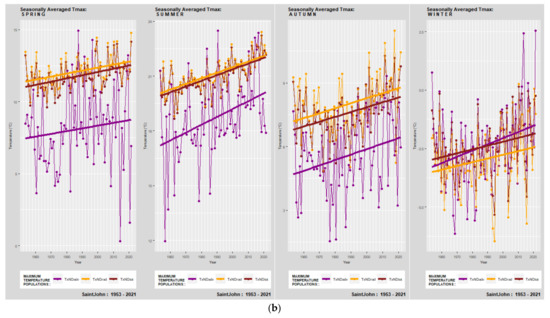
Figure 8.
Atlantic Canada (ATL); Saint John (NB). Seasonally averaged daily temperature minima (a) and maxima (b), listed in order of Spring, Summer, Autumn, and Winter. (a)—Total Temperature Minimum (TTn) (green), Radiative Temperature Minimum (RTn) (blue), and Advective Temperature Minimum (TTn) (pink); (b)—Total Temperature Maximum (TTx) (brown), Radiative Temperature Maximum (RTx) (orange), and Advective Temperature Maximum (TTx) (purple).


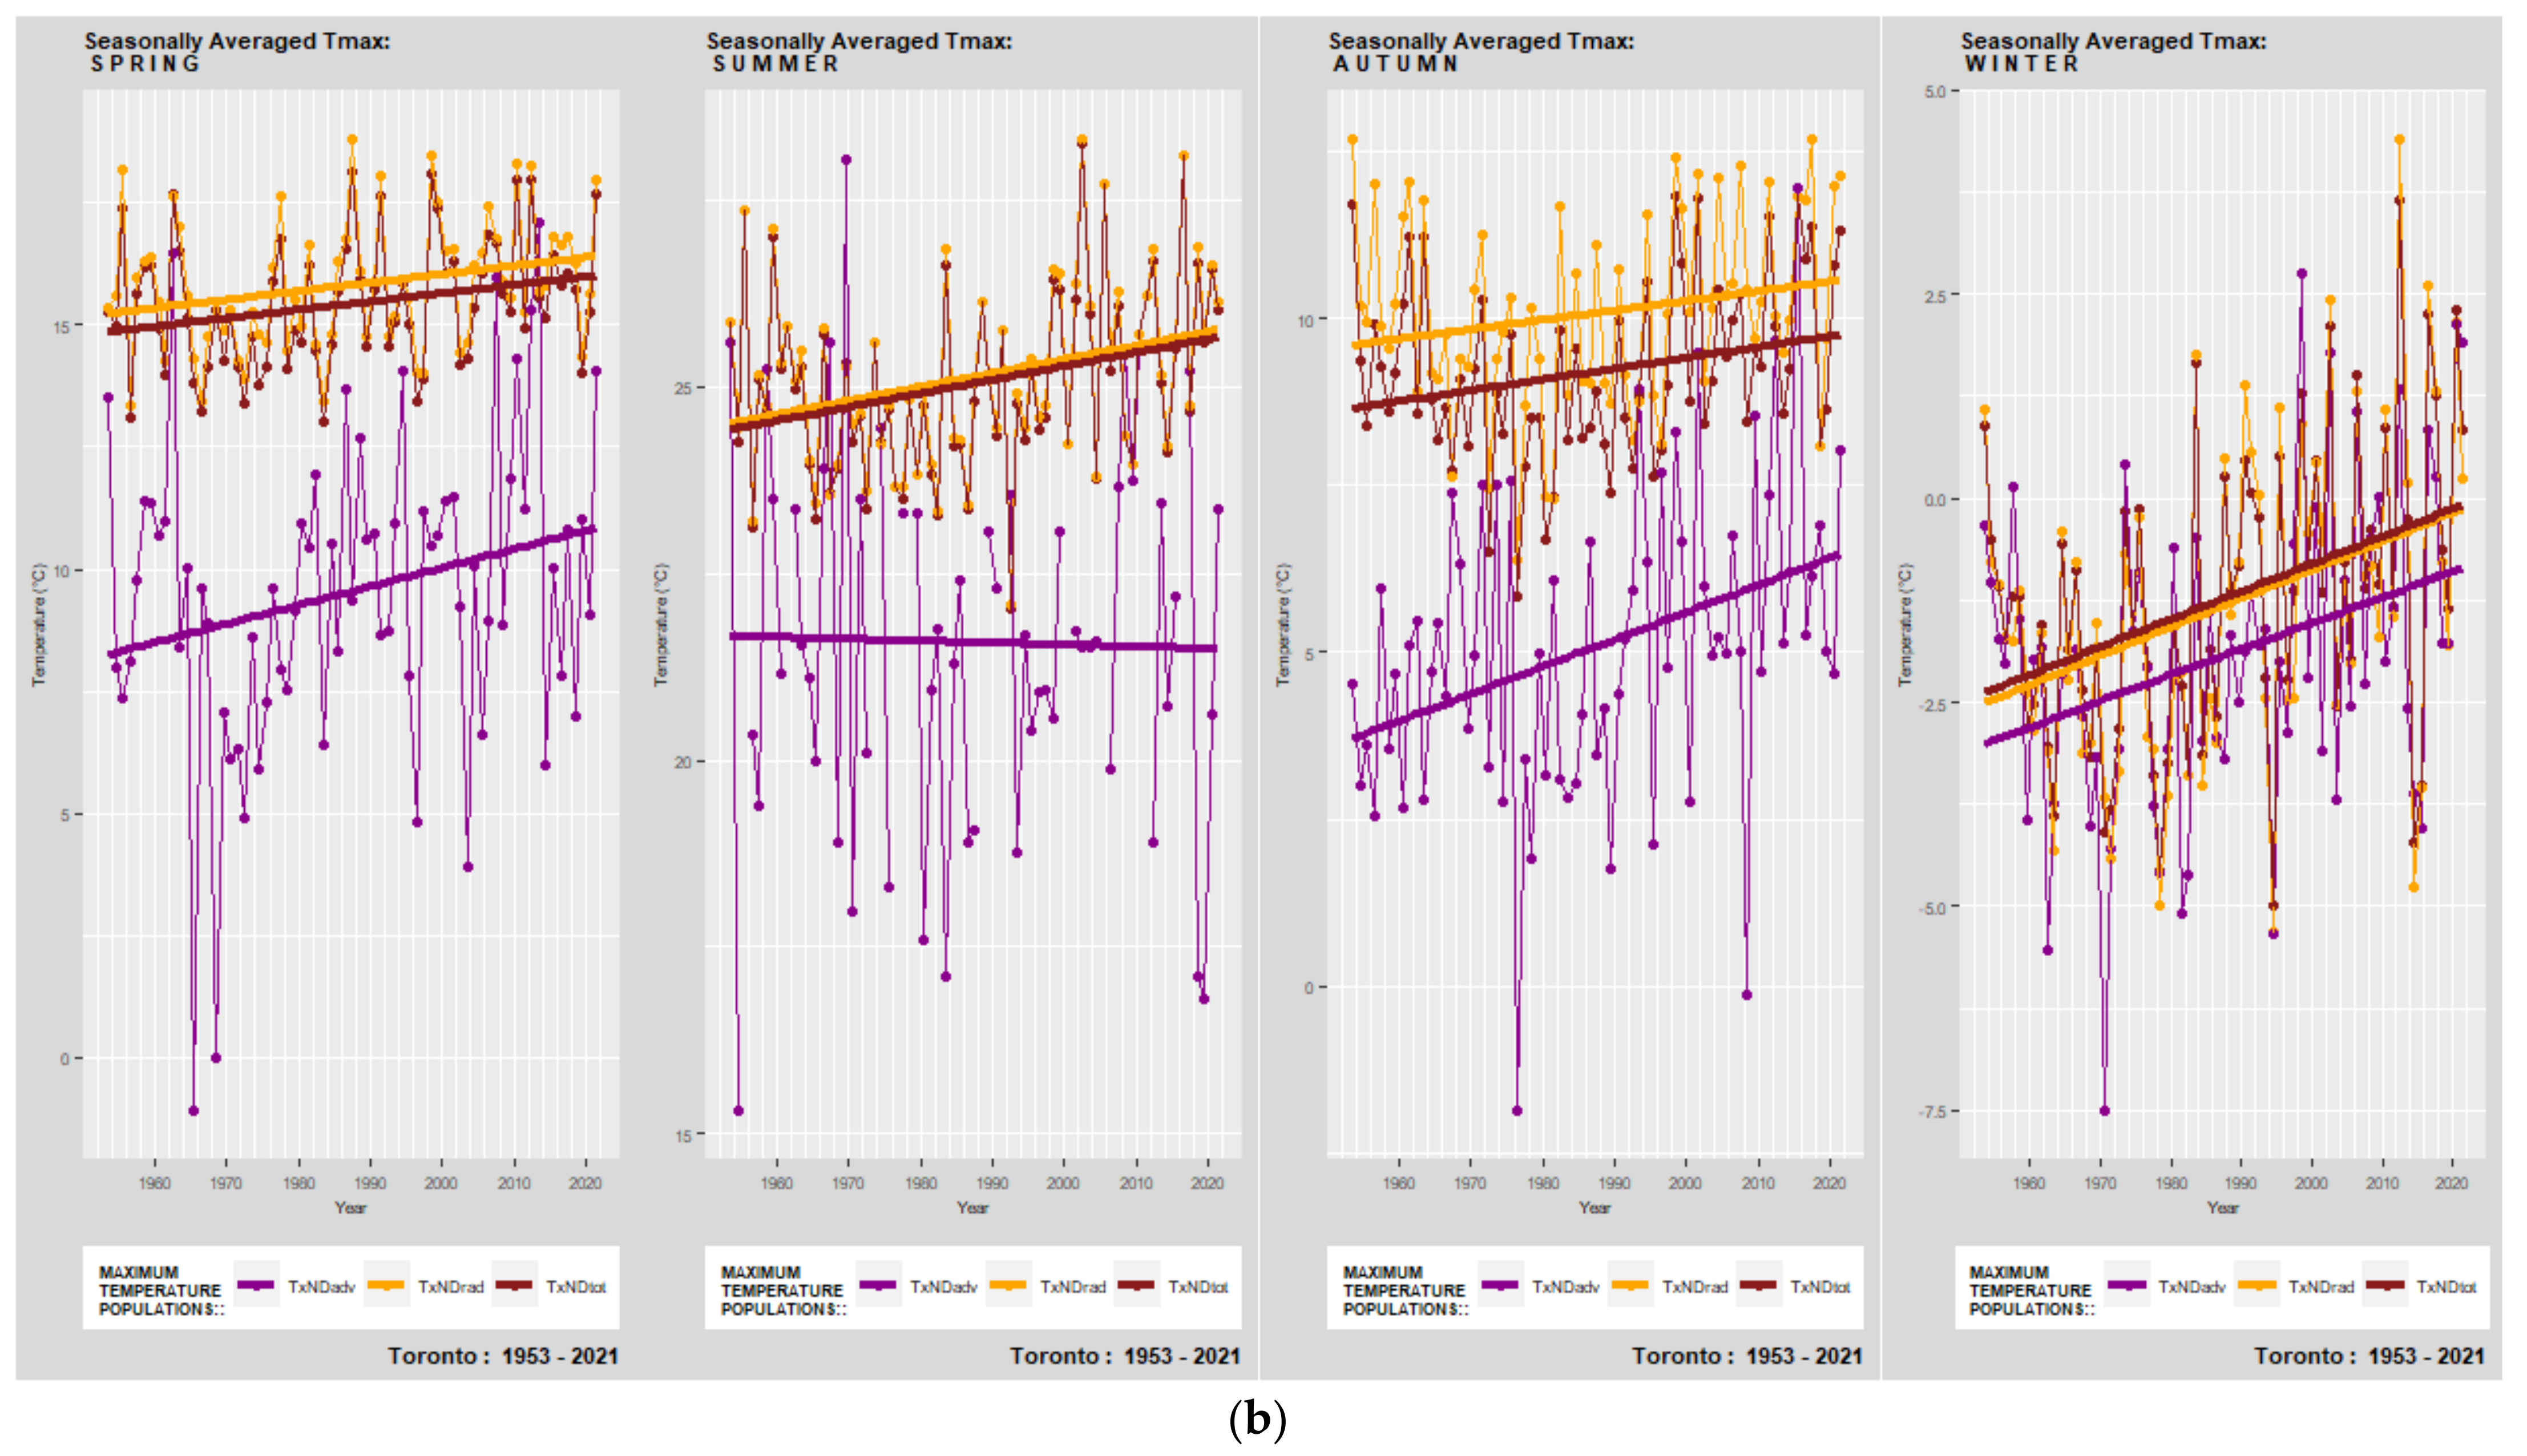
Figure 9.
Great Lakes/St. Lawrence Lowland (GRL); Toronto (ON). Seasonally averaged daily temperature minima (a) and maxima (b), listed in order of Spring, Summer, Autumn, and Winter. (a)—Total Temperature Minimum (TTn) (green), Radiative Temperature Minimum (RTn) (blue), and Advective Temperature Minimum (TTn) (pink); (b)—Total Temperature Maximum (TTx) (brown), Radiative Temperature Maximum (RTx) (orange), and Advective Temperature Maximum (TTx) (purple).
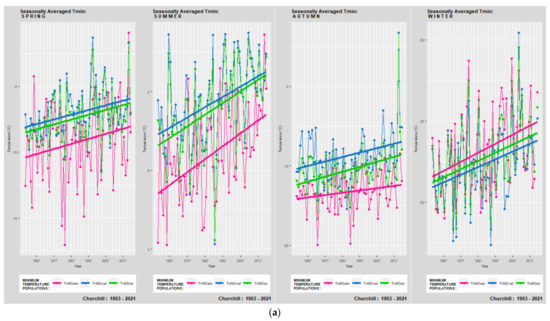
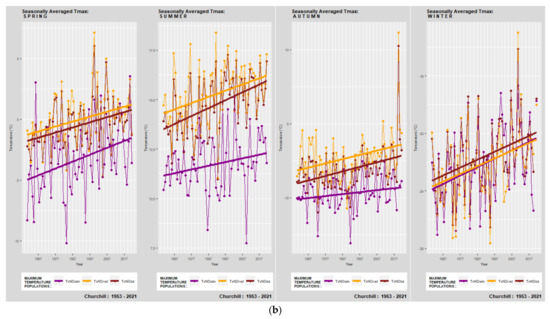
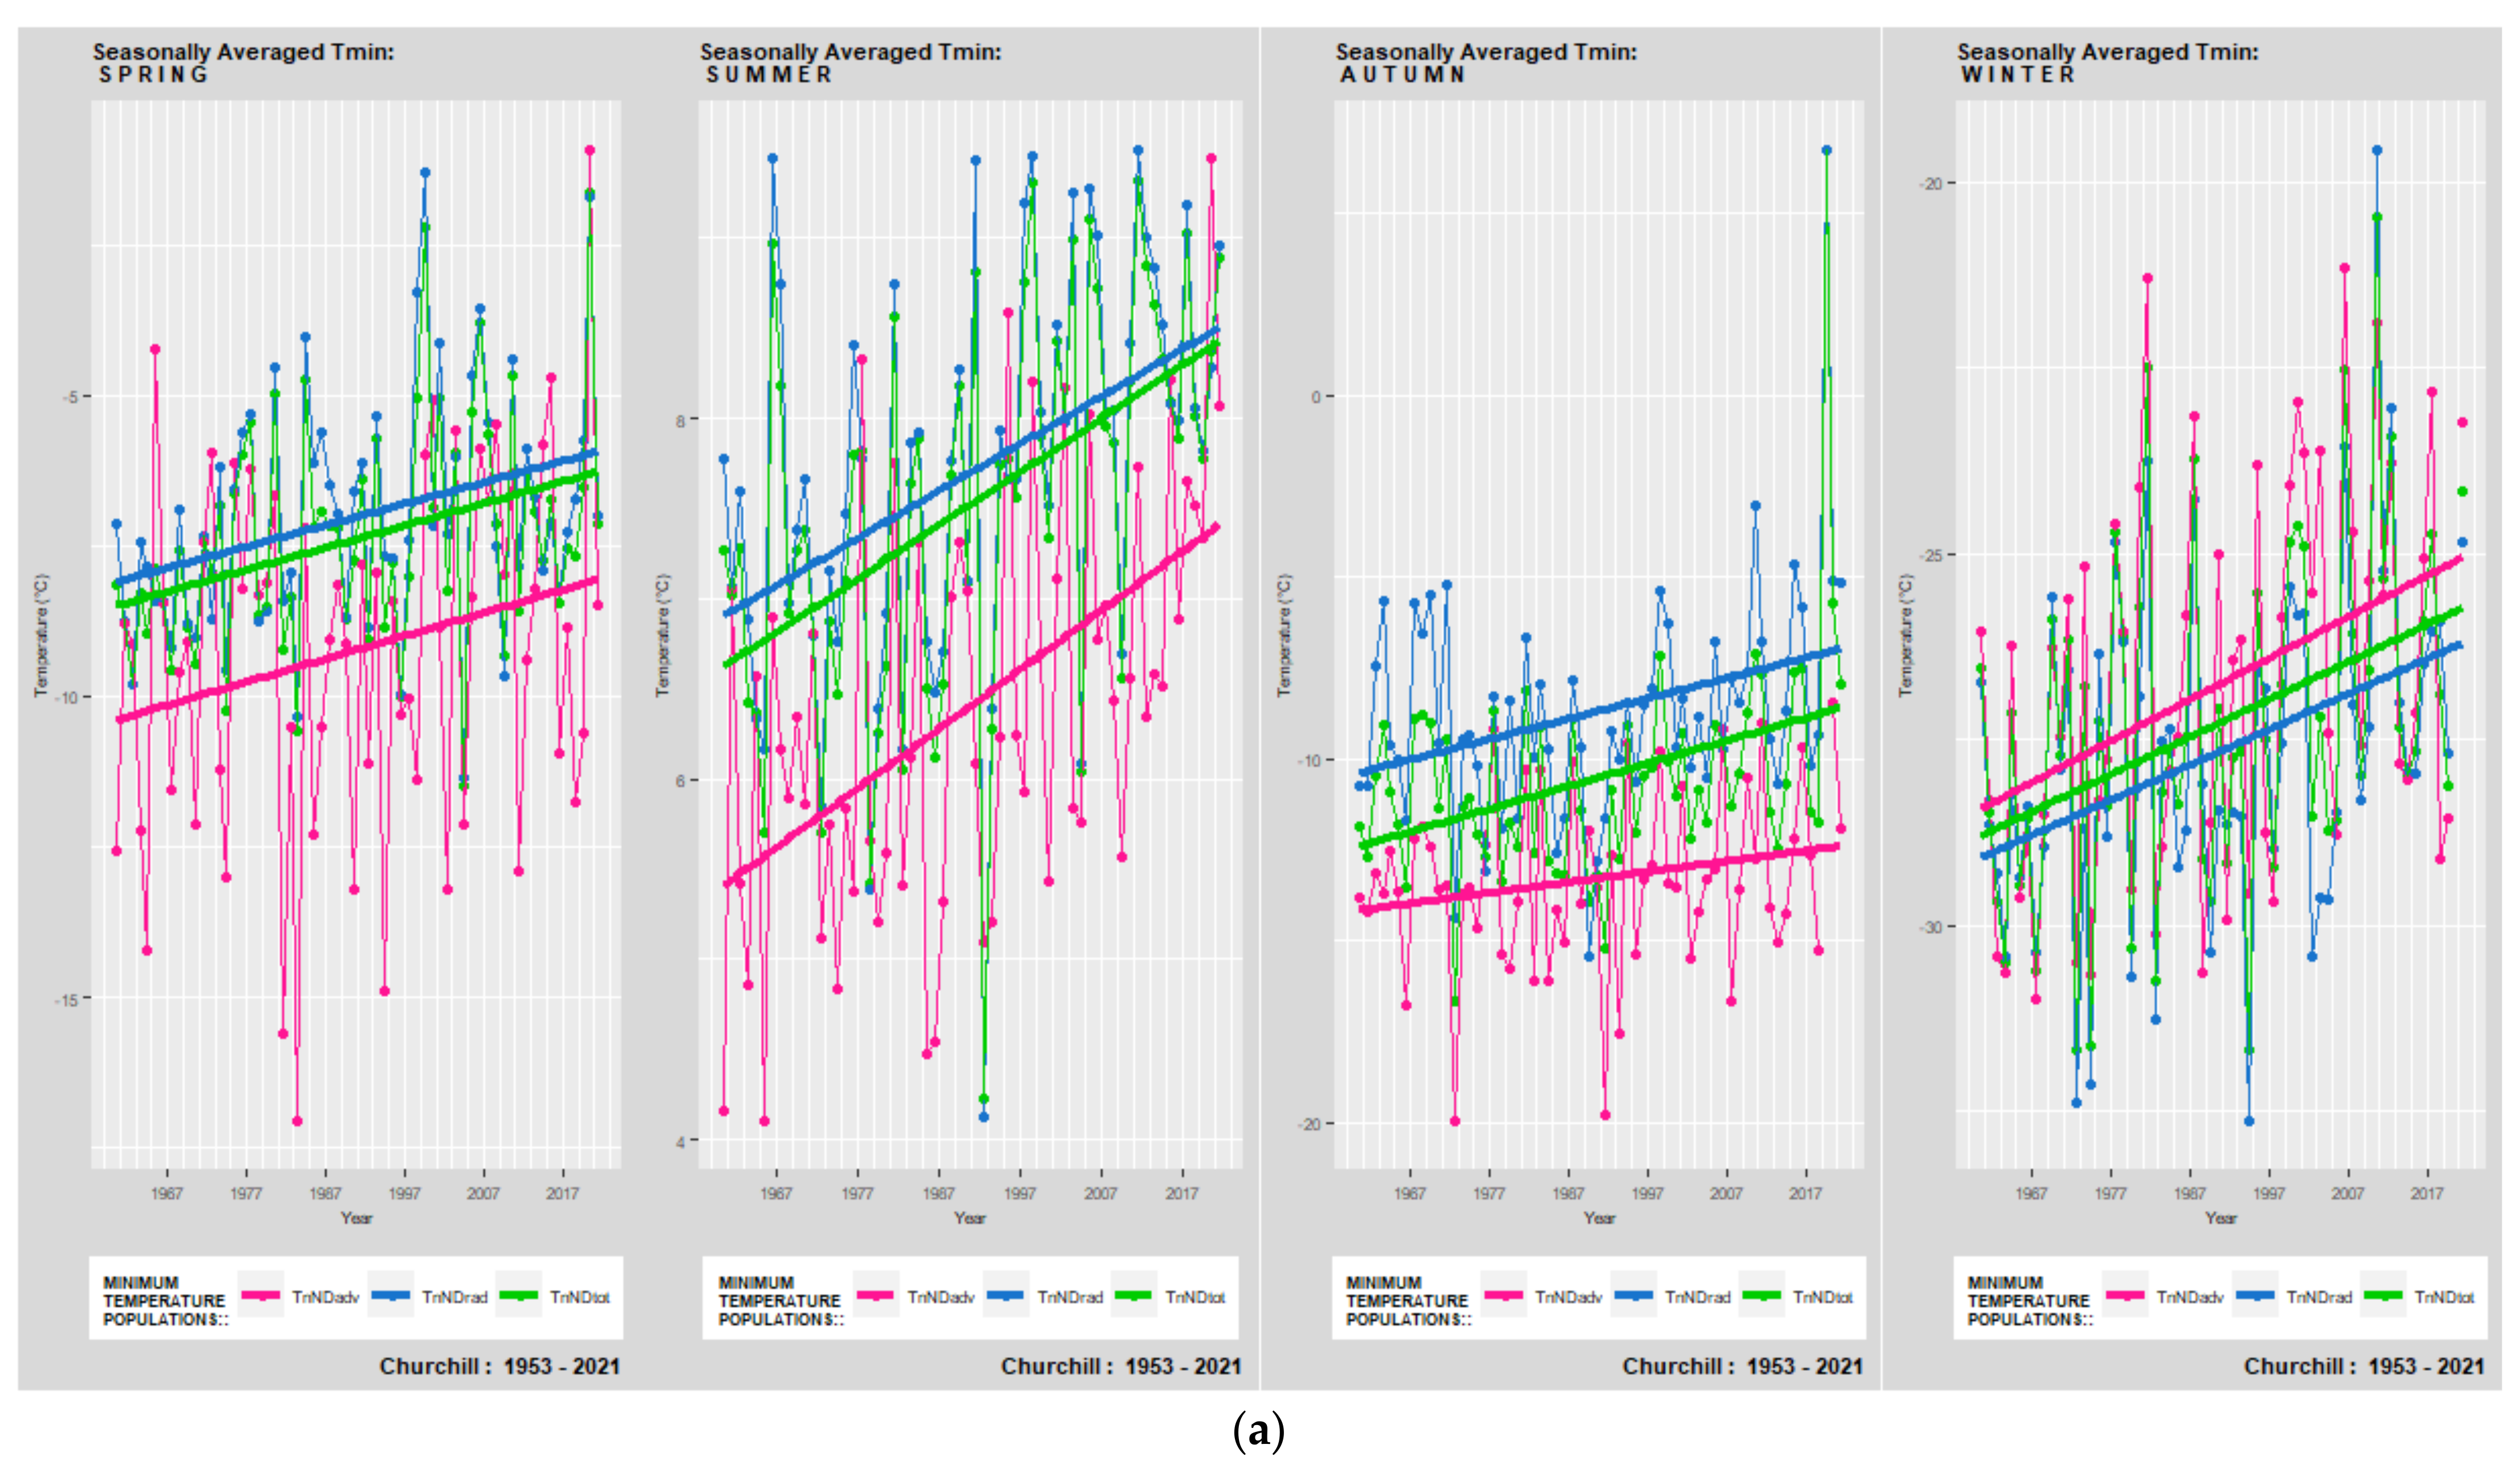
Figure 10.
Northeastern Forest (NEF); Churchill (MB). Seasonally averaged daily temperature minima (a) and maxima (b), listed in order of Spring, Summer, Autumn, and Winter. (a)—Total Temperature Minimum (TTn) (green), Radiative Temperature Minimum (RTn) (blue), and Advective Temperature Minimum (TTn) (pink); (b)—Total Temperature Maximum (TTx) (brown), Radiative Temperature Maximum (RTx) (orange), and Advective Temperature Maximum (TTx) (purple).
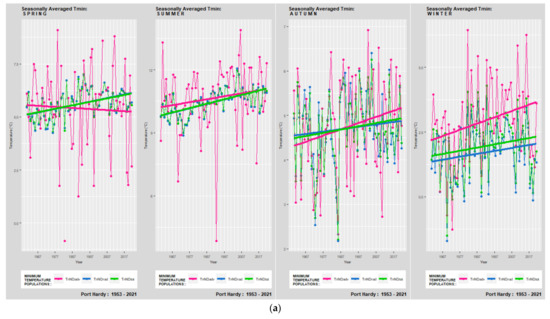
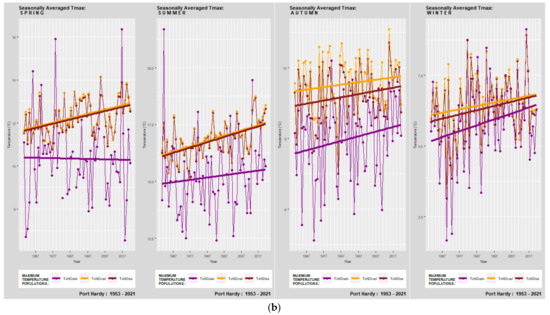
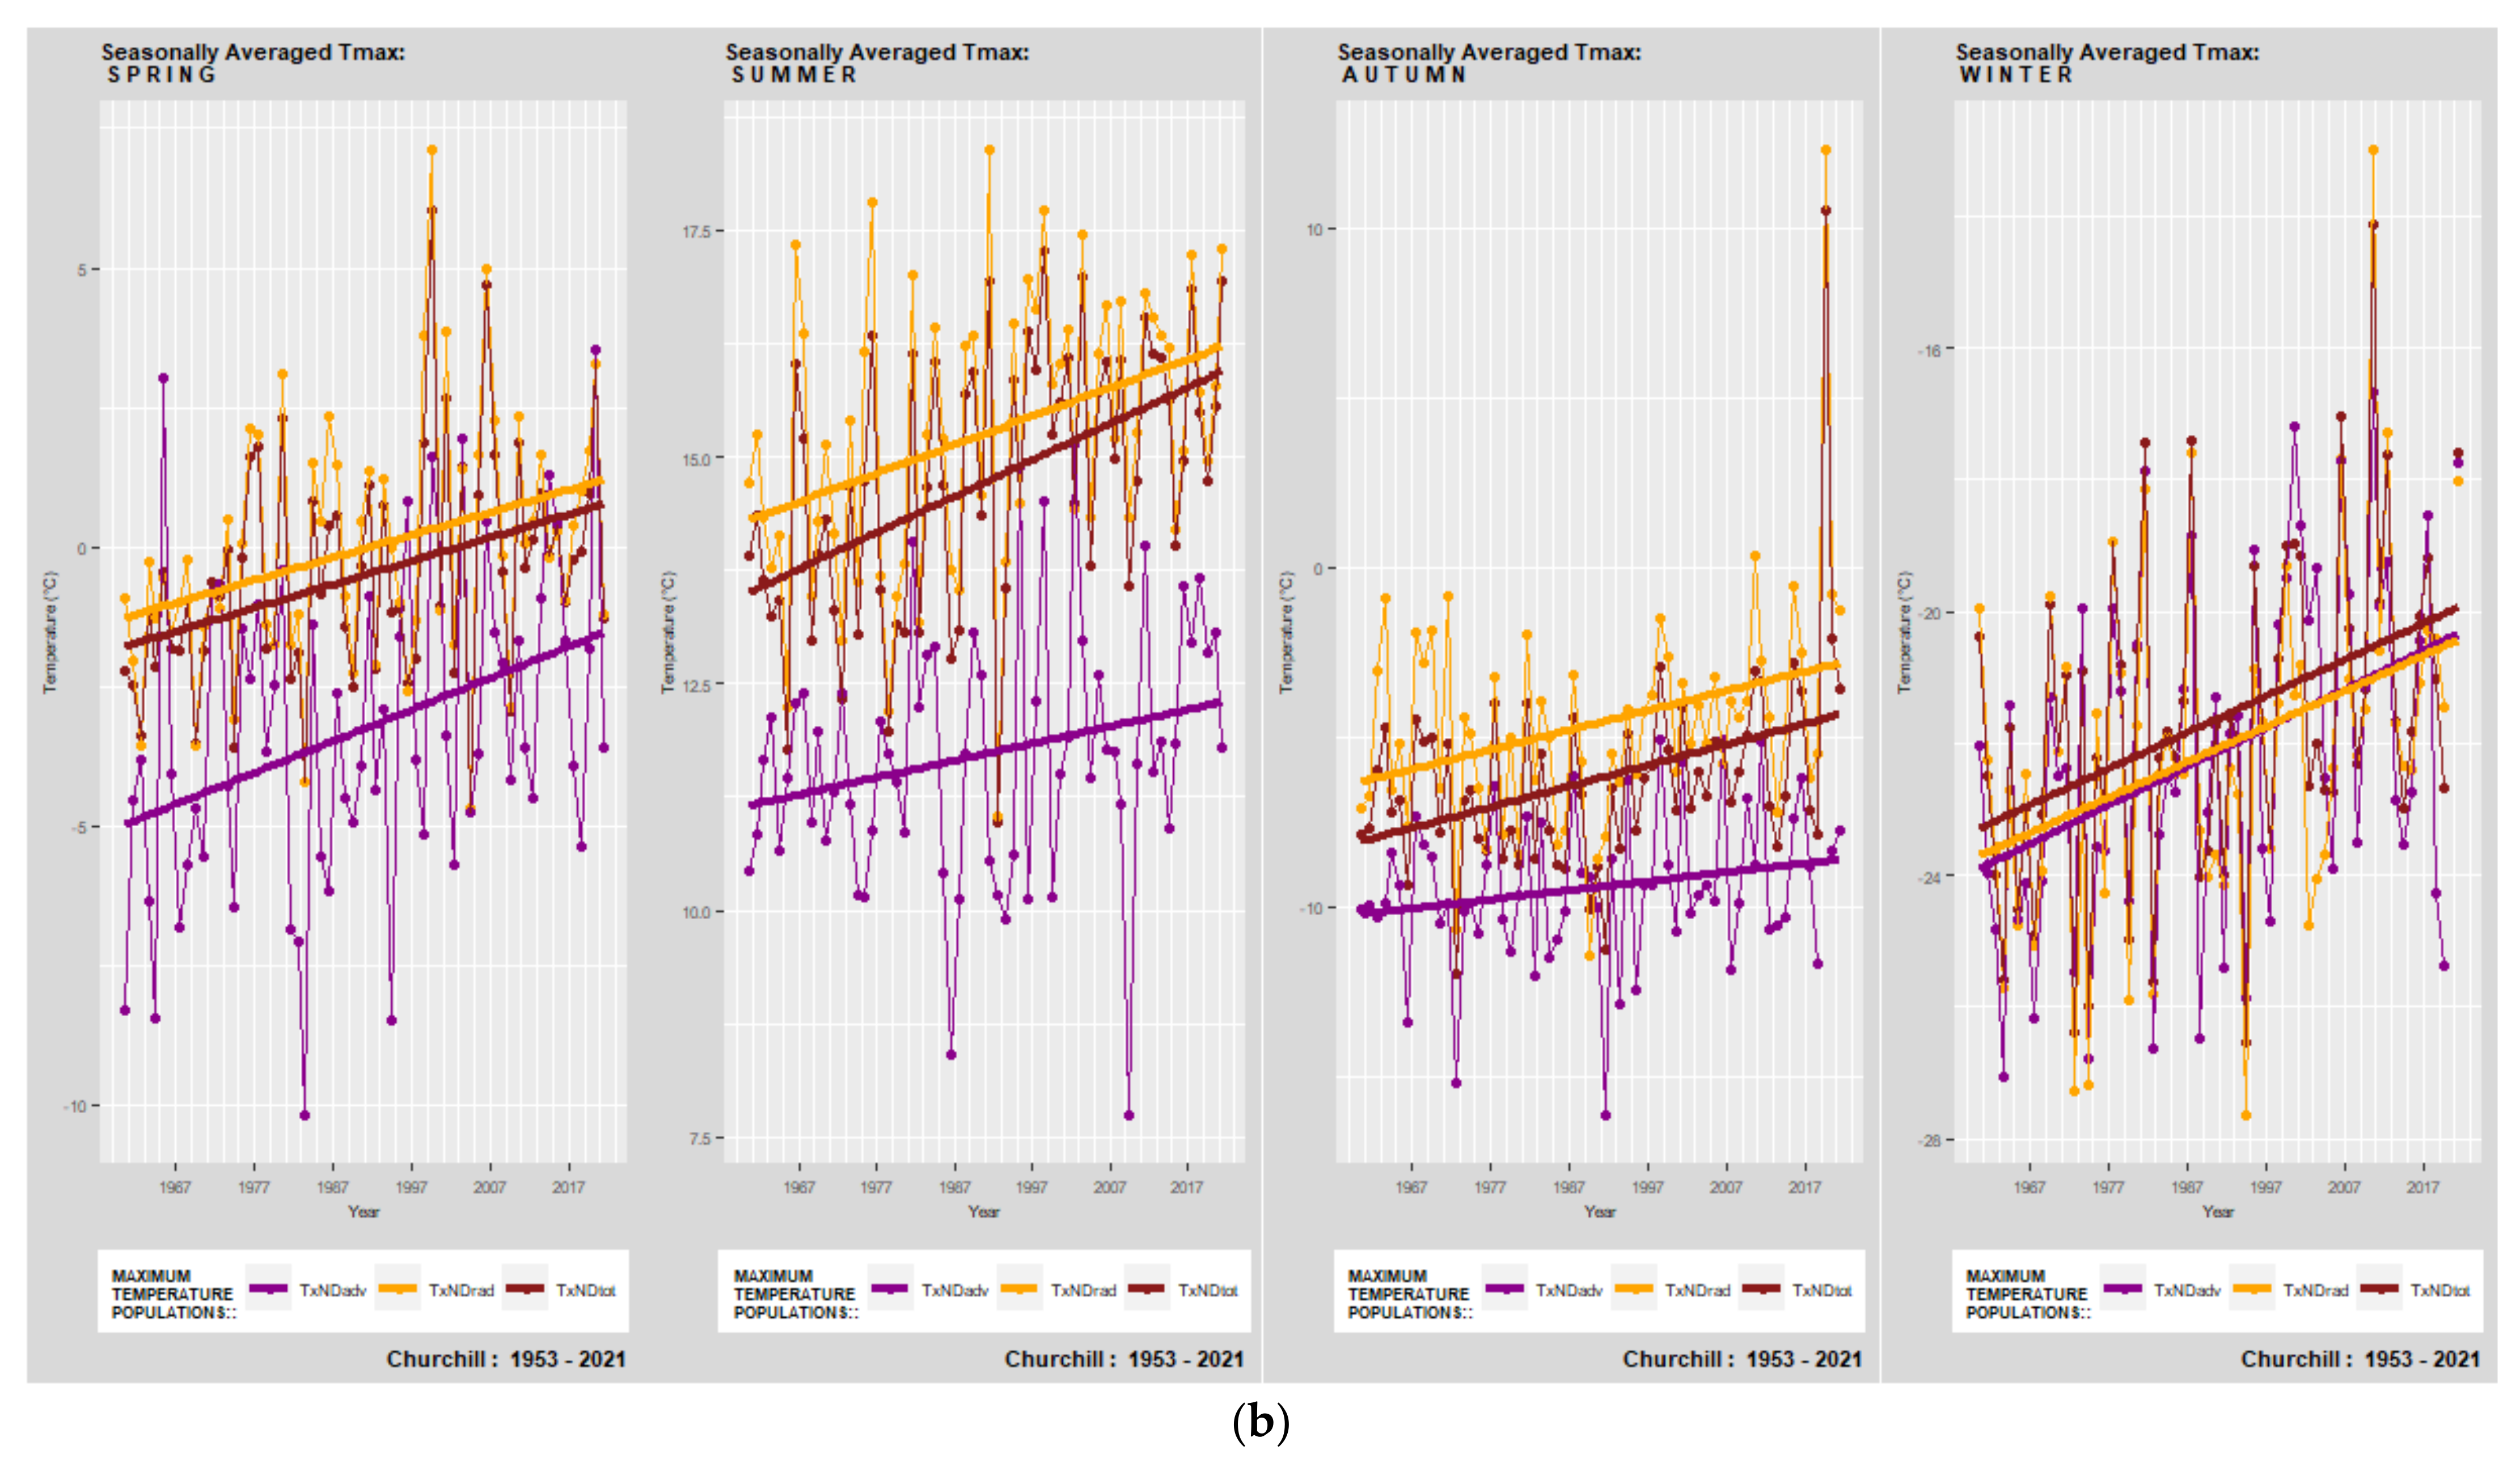
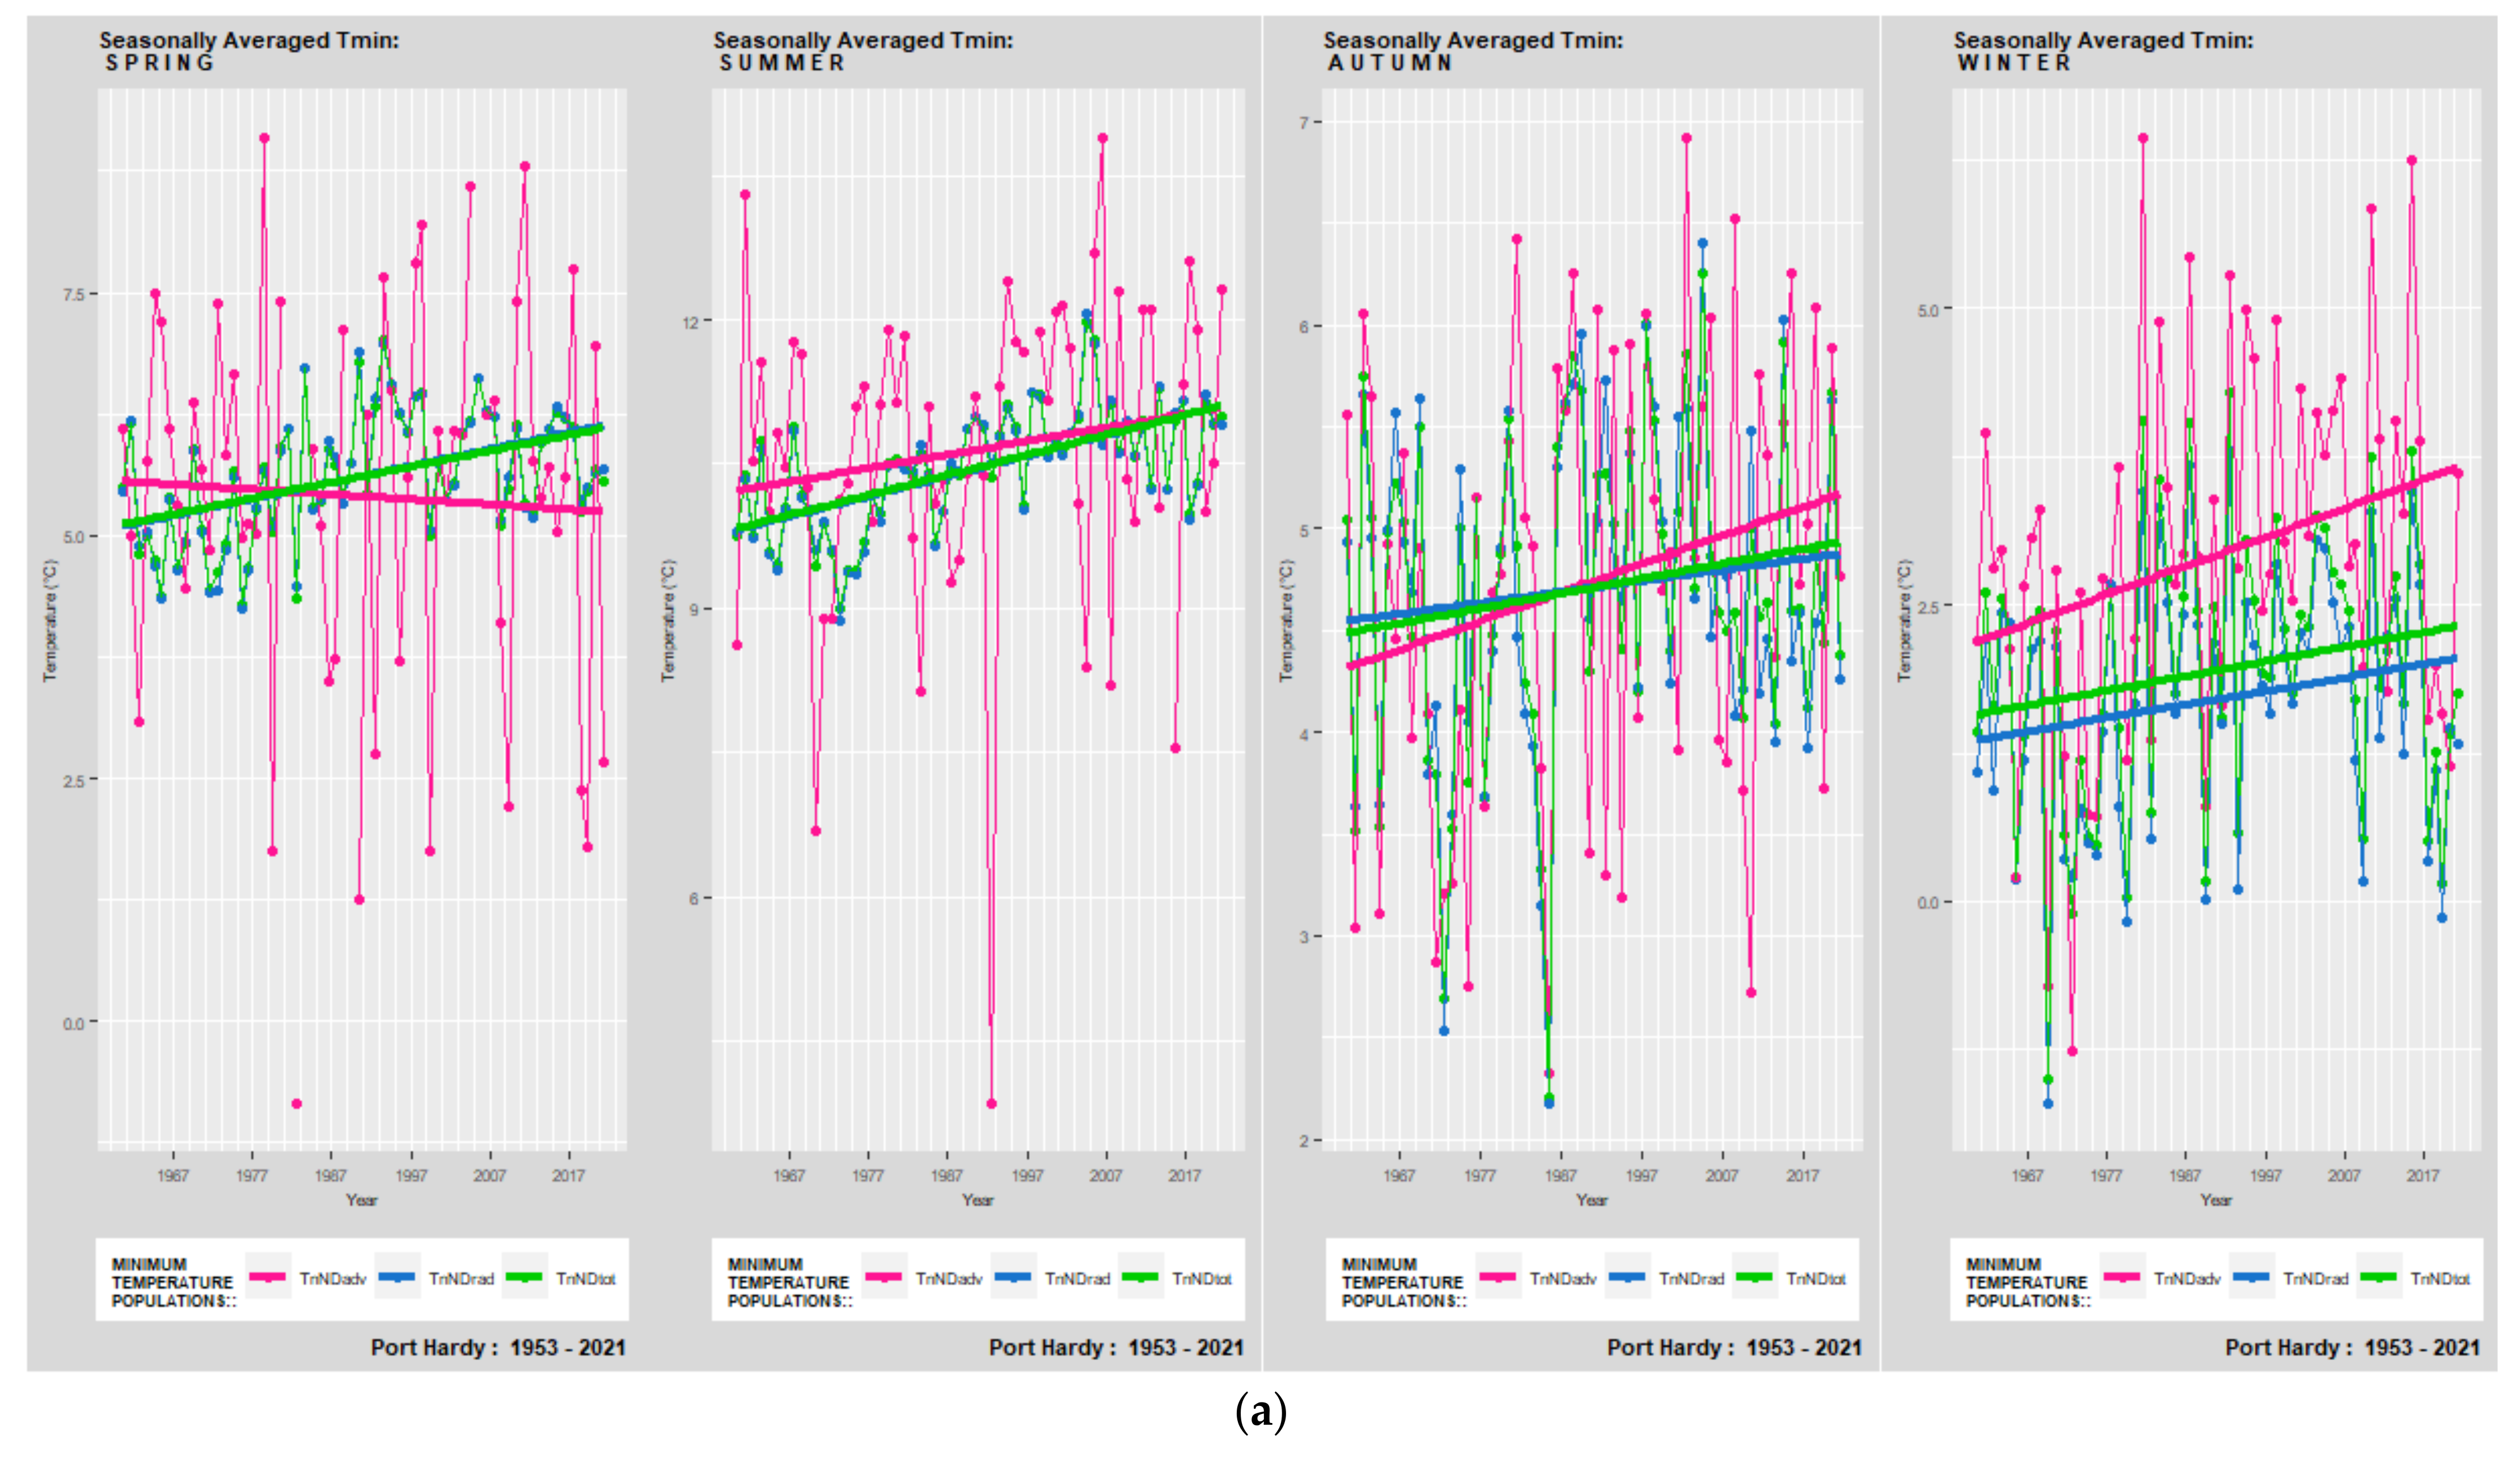
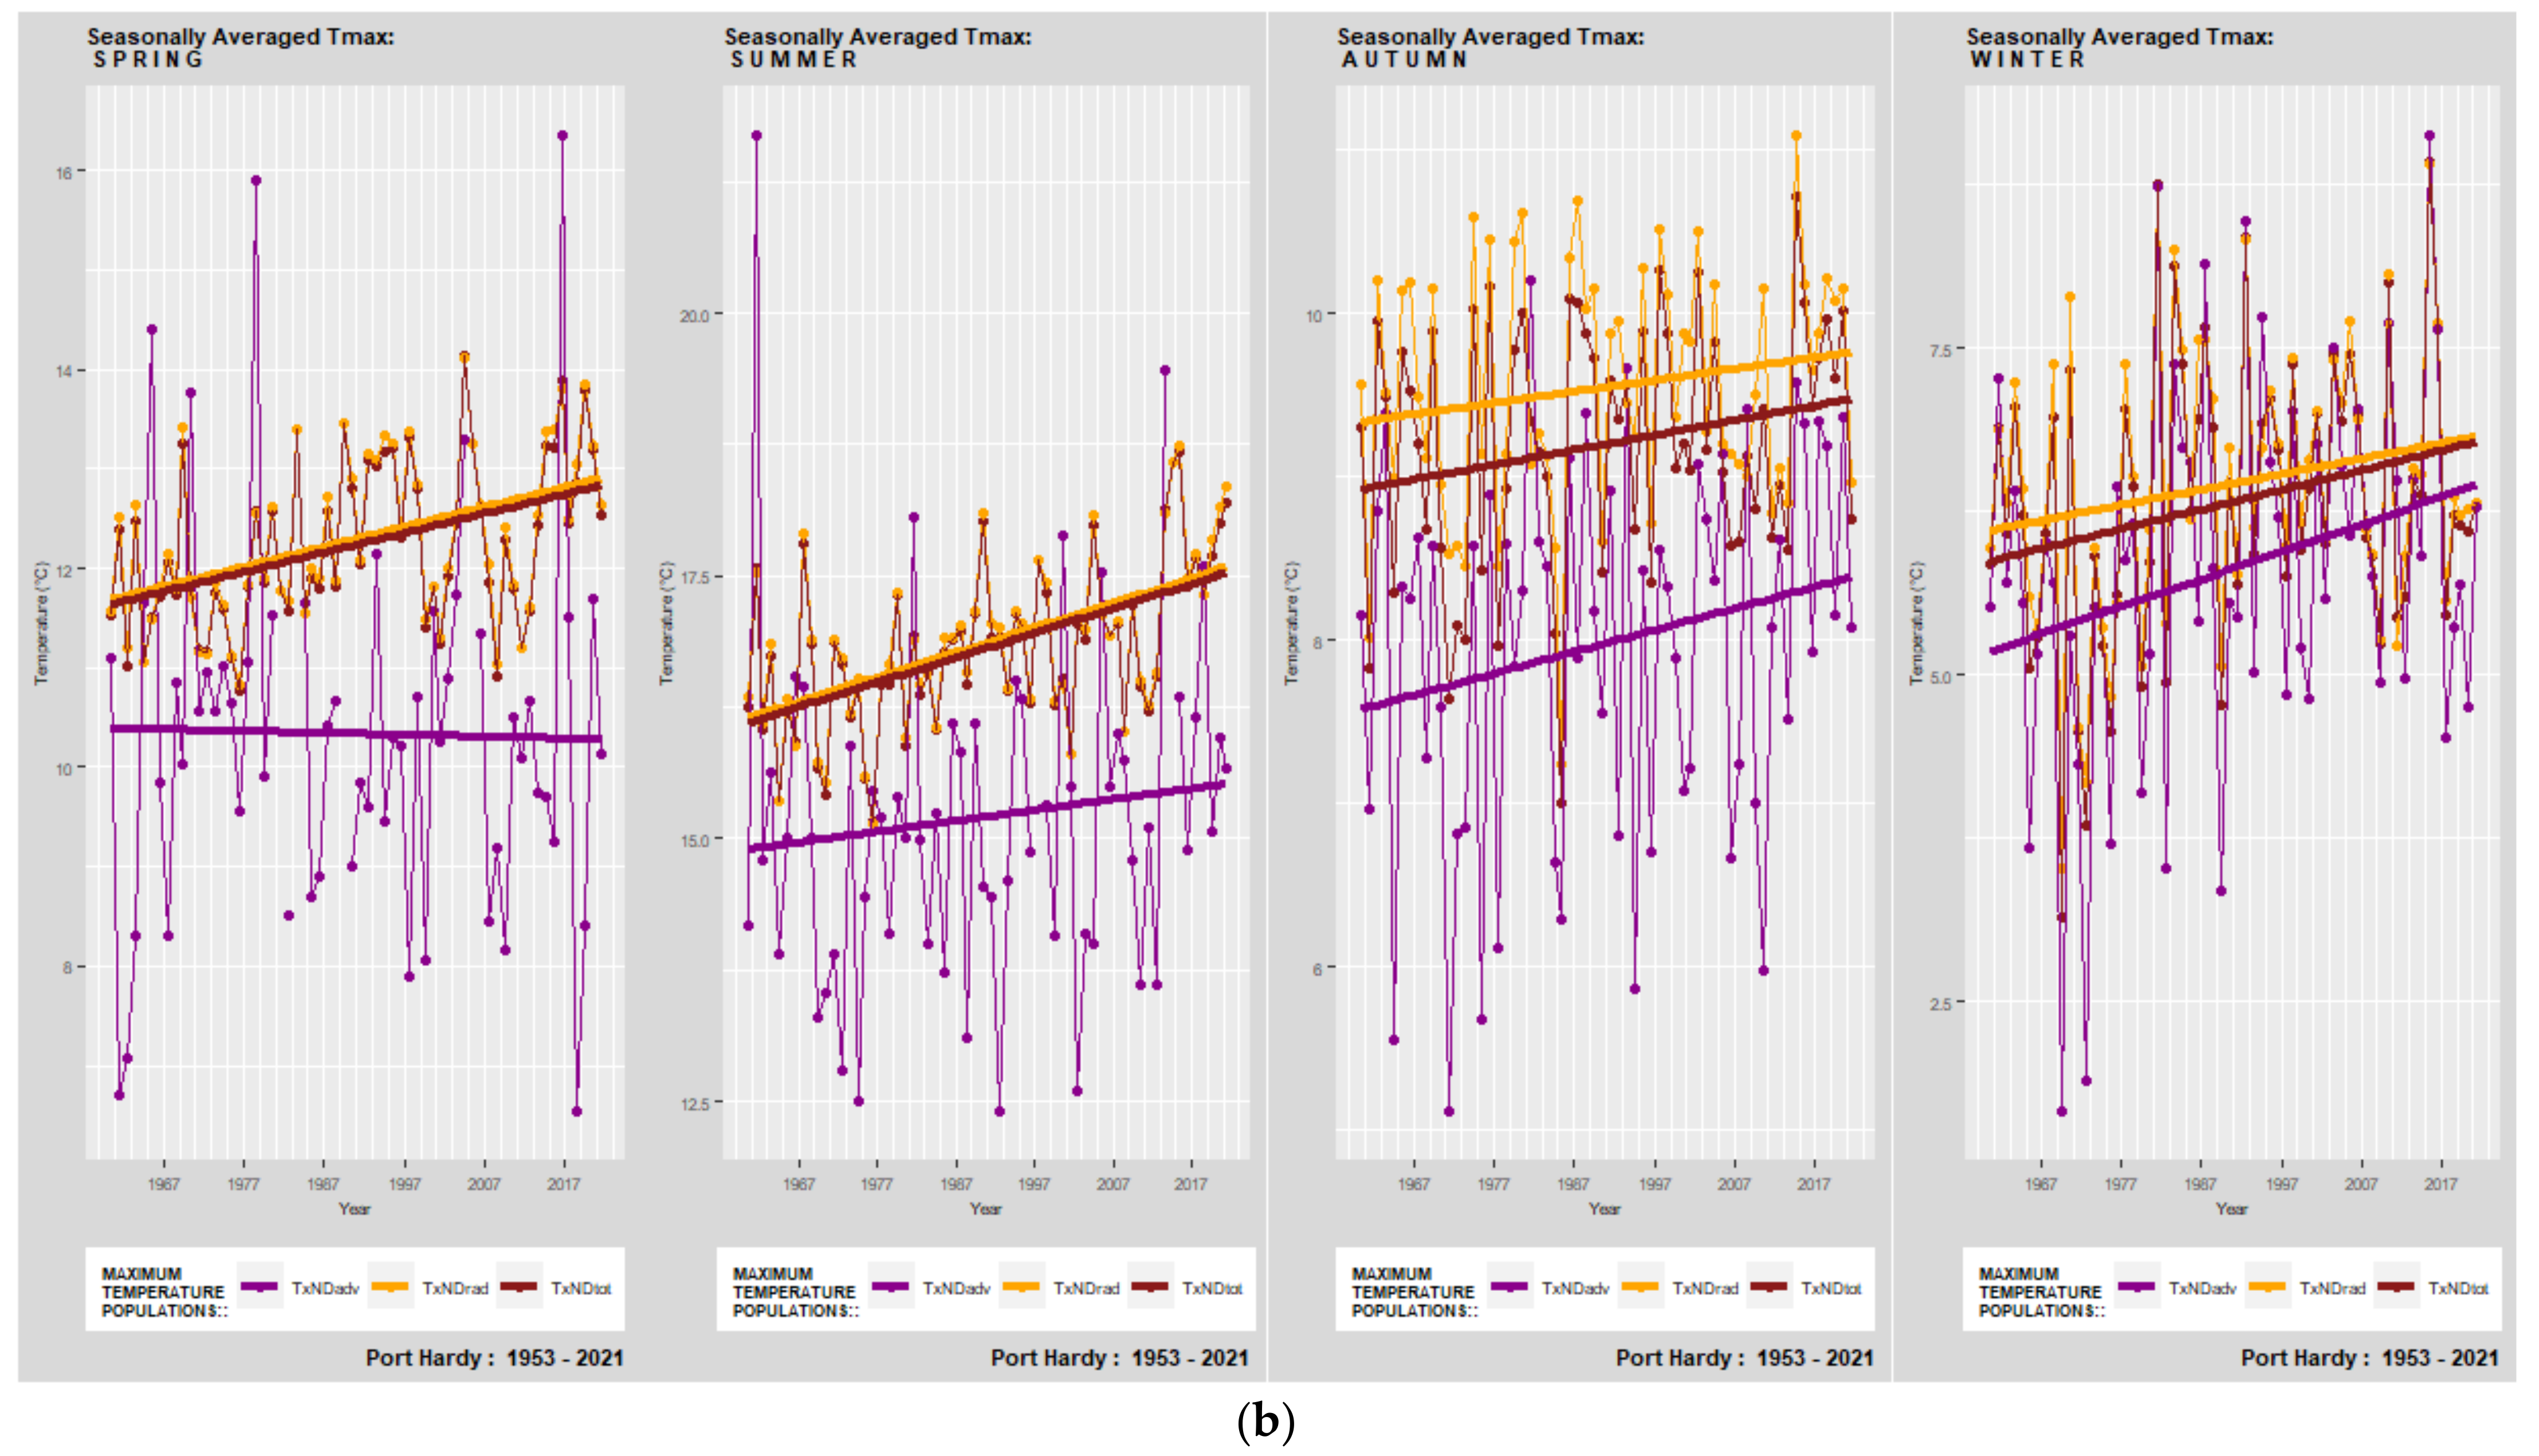
Figure 11.
Pacific Coast (PAC); Port Hardy (BC). Seasonally averaged daily temperature minima (a) and maxima (b), listed in order of Spring, Summer, Autumn, and Winter. (a)—Total Temperature Minimum (TTn) (green), Radiative Temperature Minimum (RTn) (blue), and Advective Temperature Minimum (TTn) (pink); (b)—Total Temperature Maximum (TTx) (brown), Radiative Temperature Maximum (RTx) (orange), and Advective Temperature Maximum (TTx) (purple).

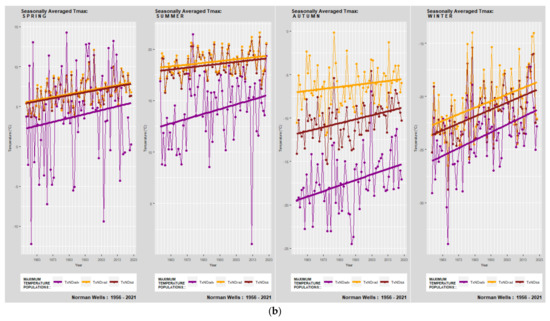
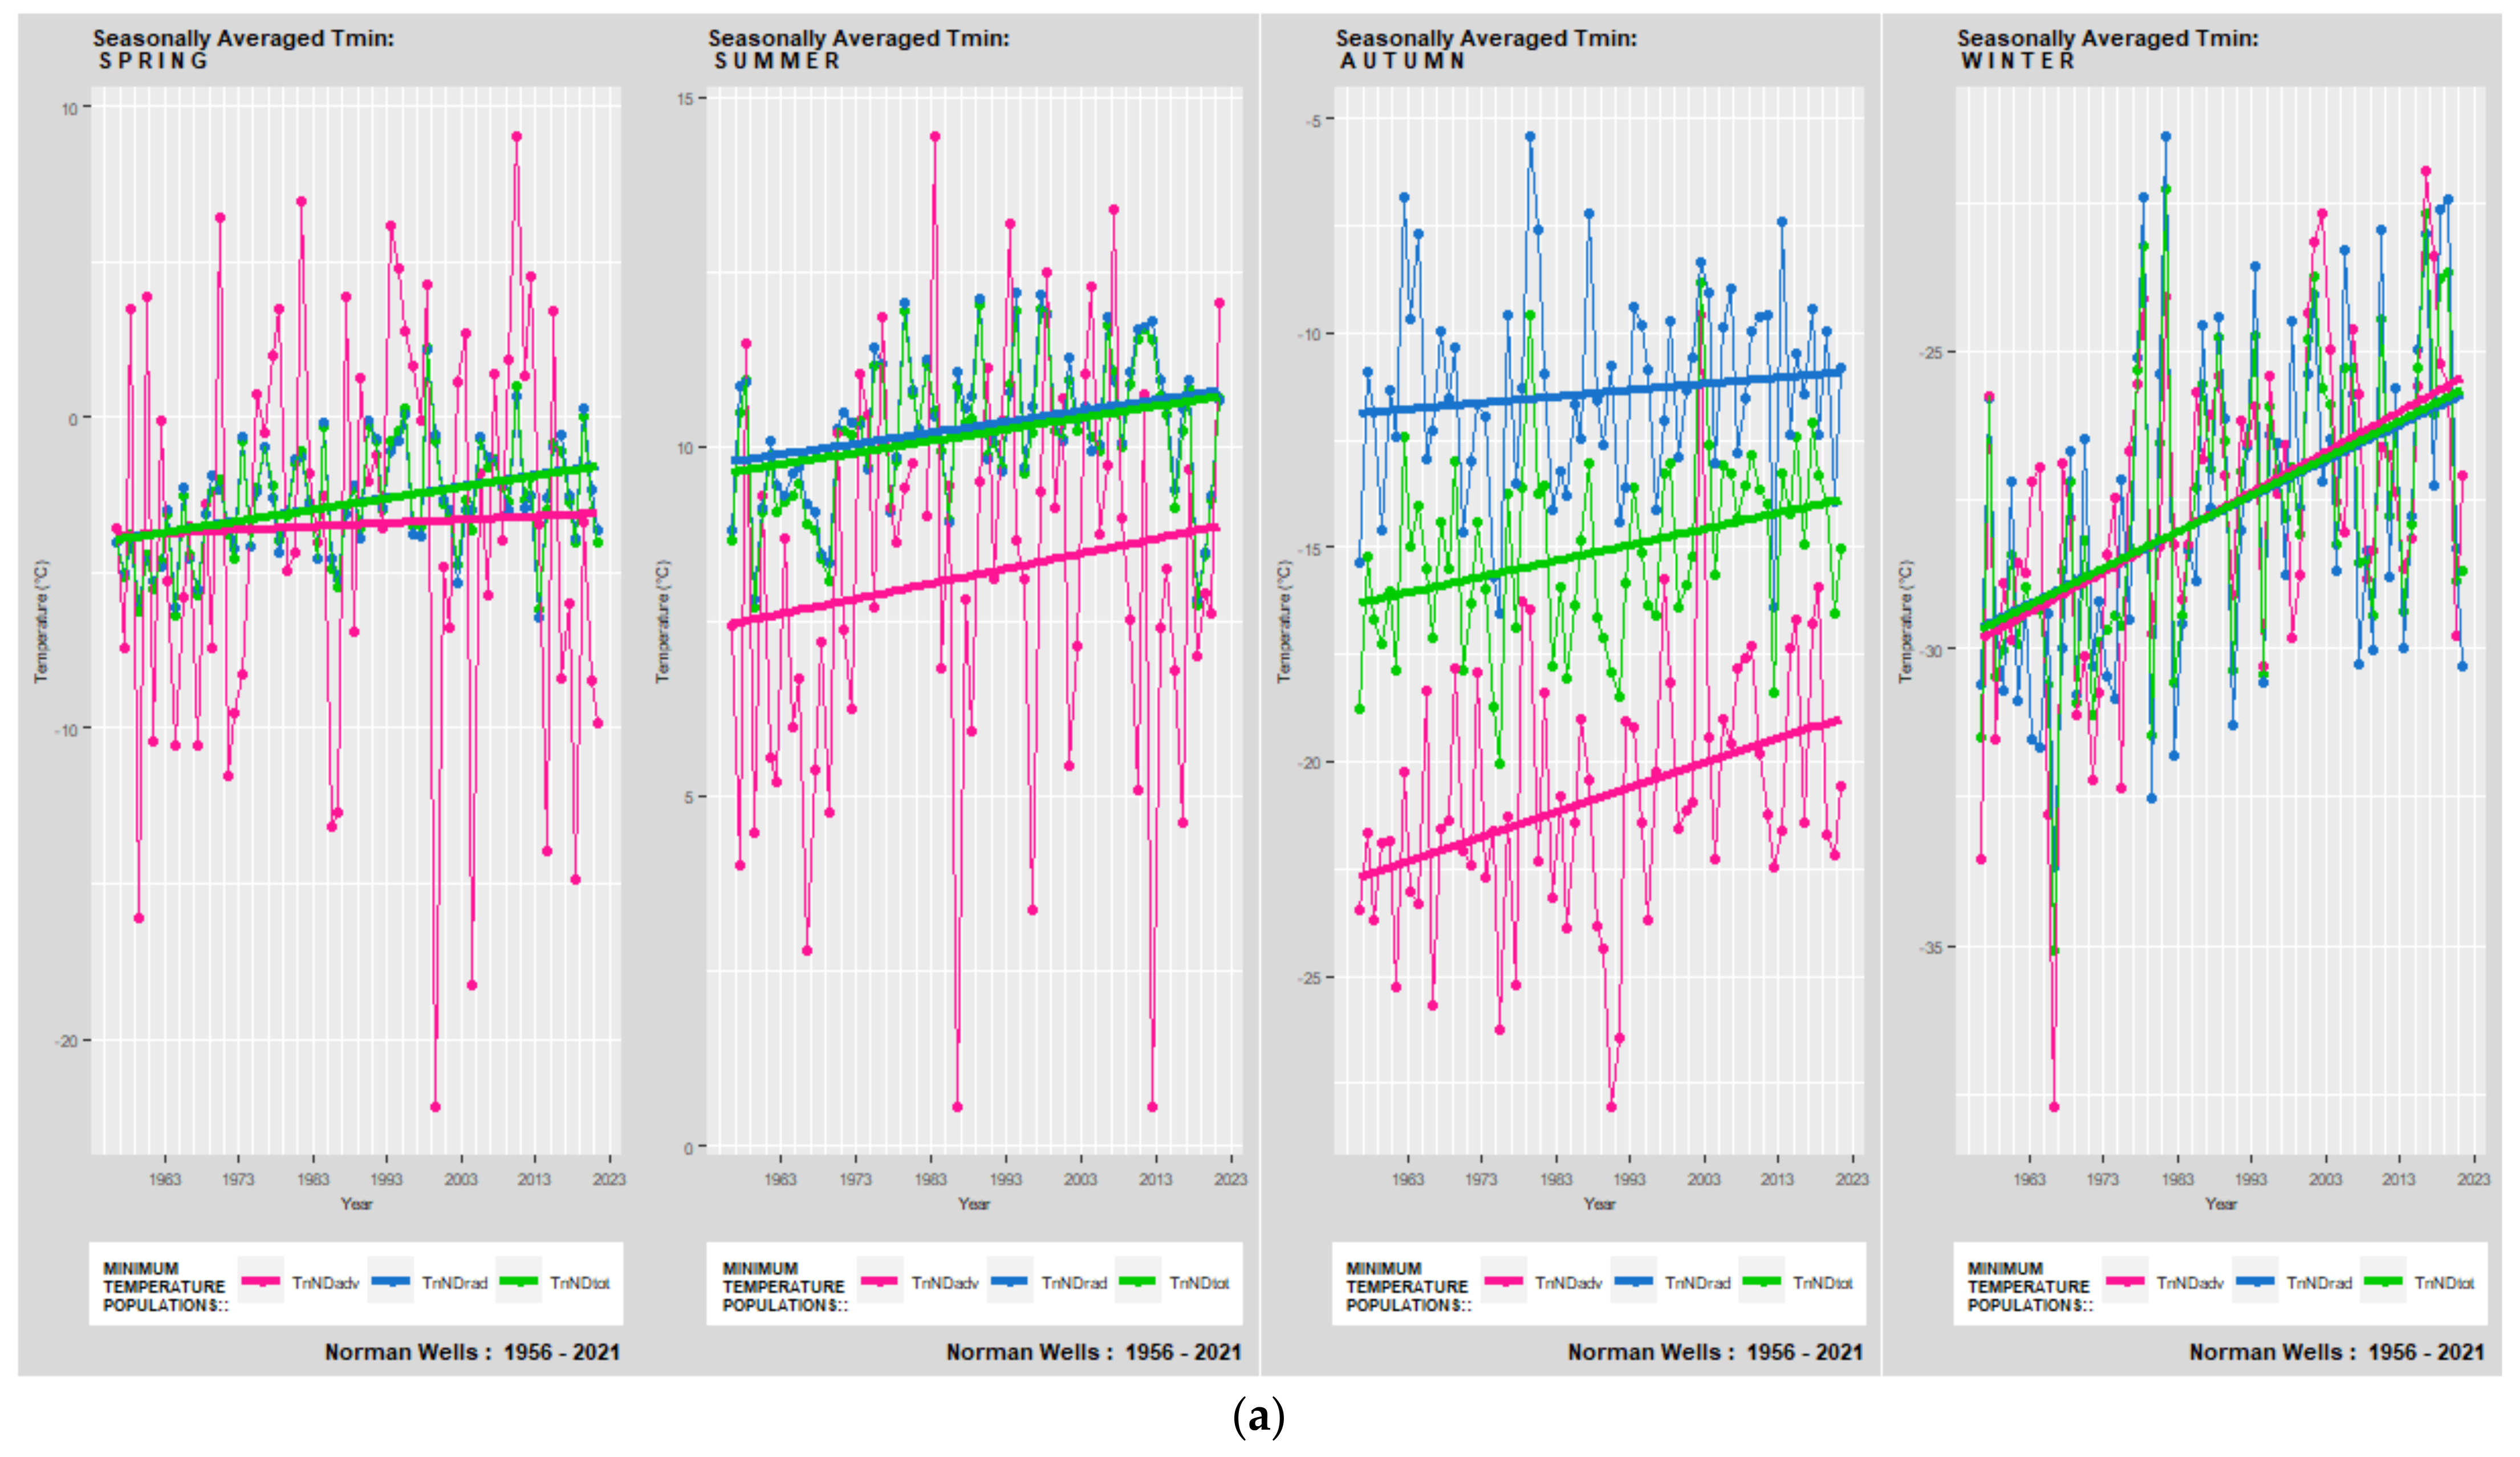
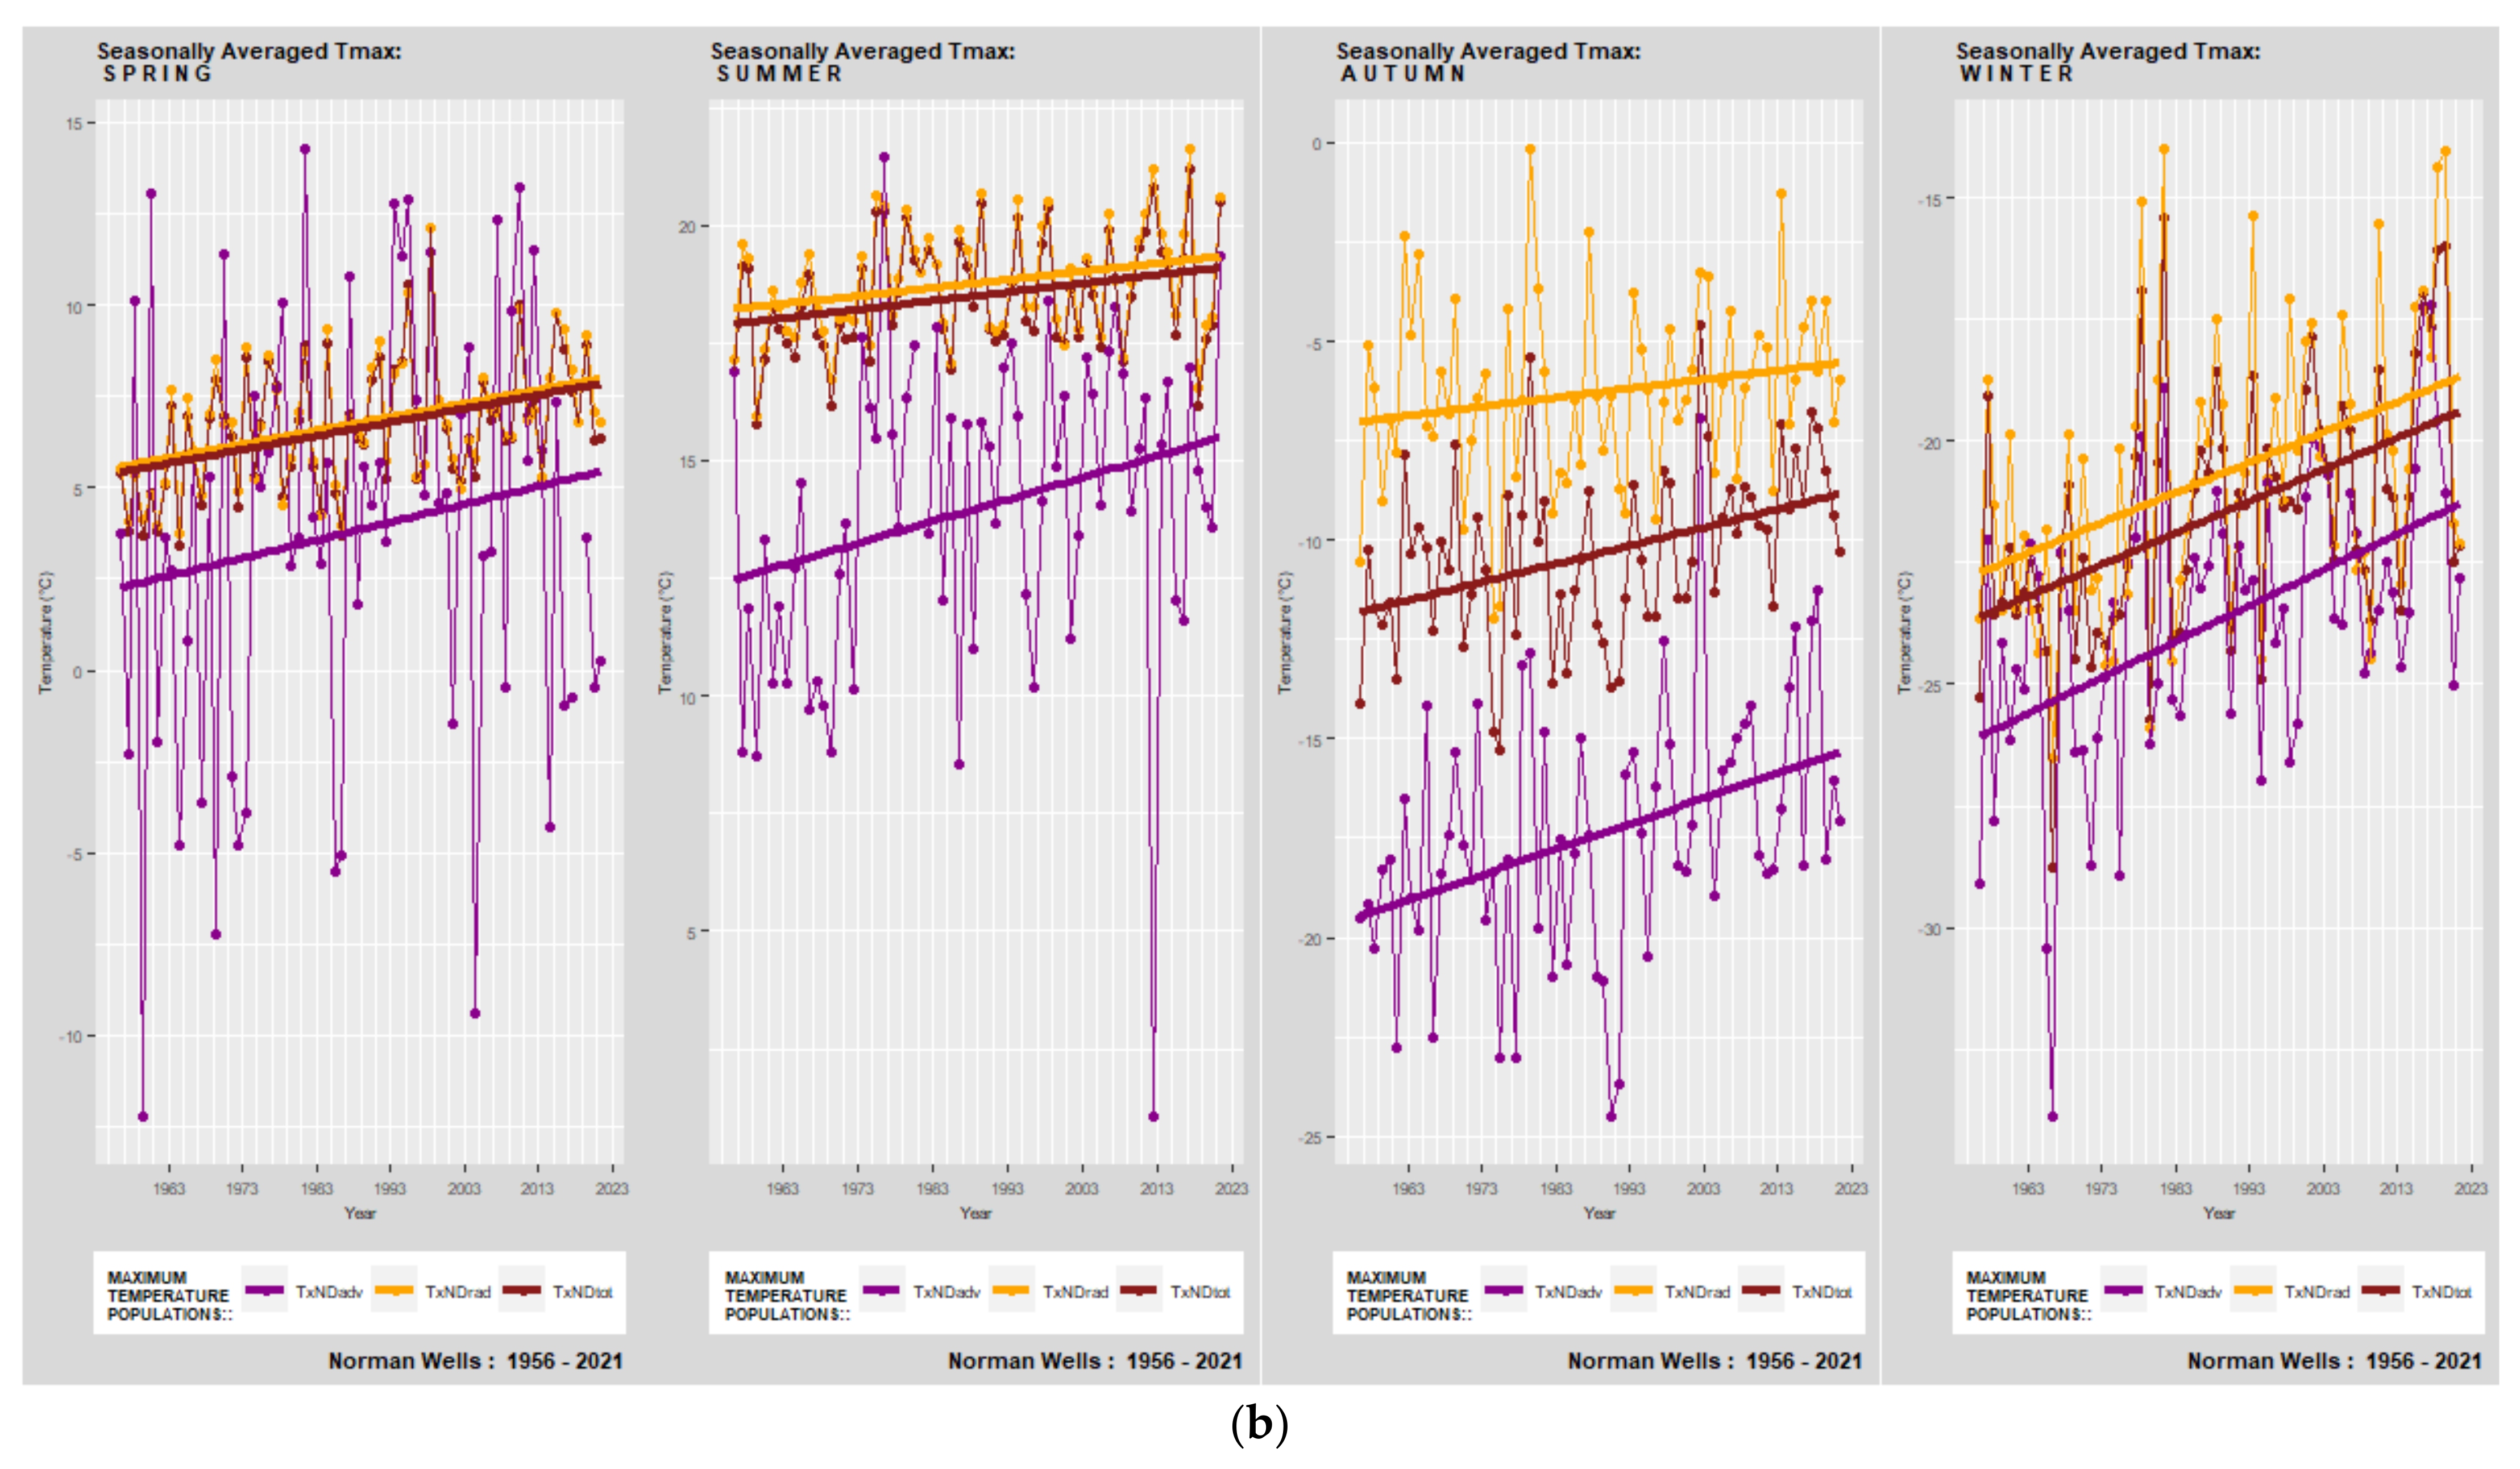
Figure 12.
Mackenzie District (MCD); Norman Wells (NT). Seasonally averaged daily temperature minima (a) and maxima (b), listed in order of Spring, Summer, Autumn, and Winter. (a)—Total Temperature Minimum (TTn) (green), Radiative Temperature Minimum (RTn) (blue), and Advective Temperature Minimum (TTn) (pink); (b)—Total Temperature Maximum (TTx) (brown), Radiative Temperature Maximum (RTx) (orange), and Advective Temperature Maximum (TTx) (purple).

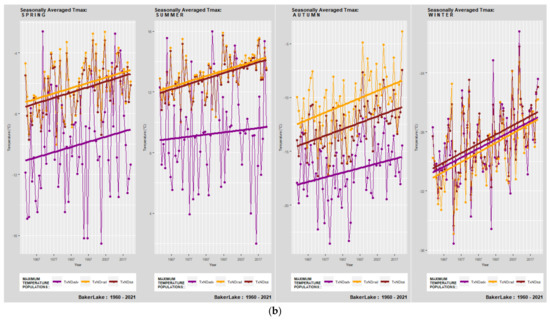
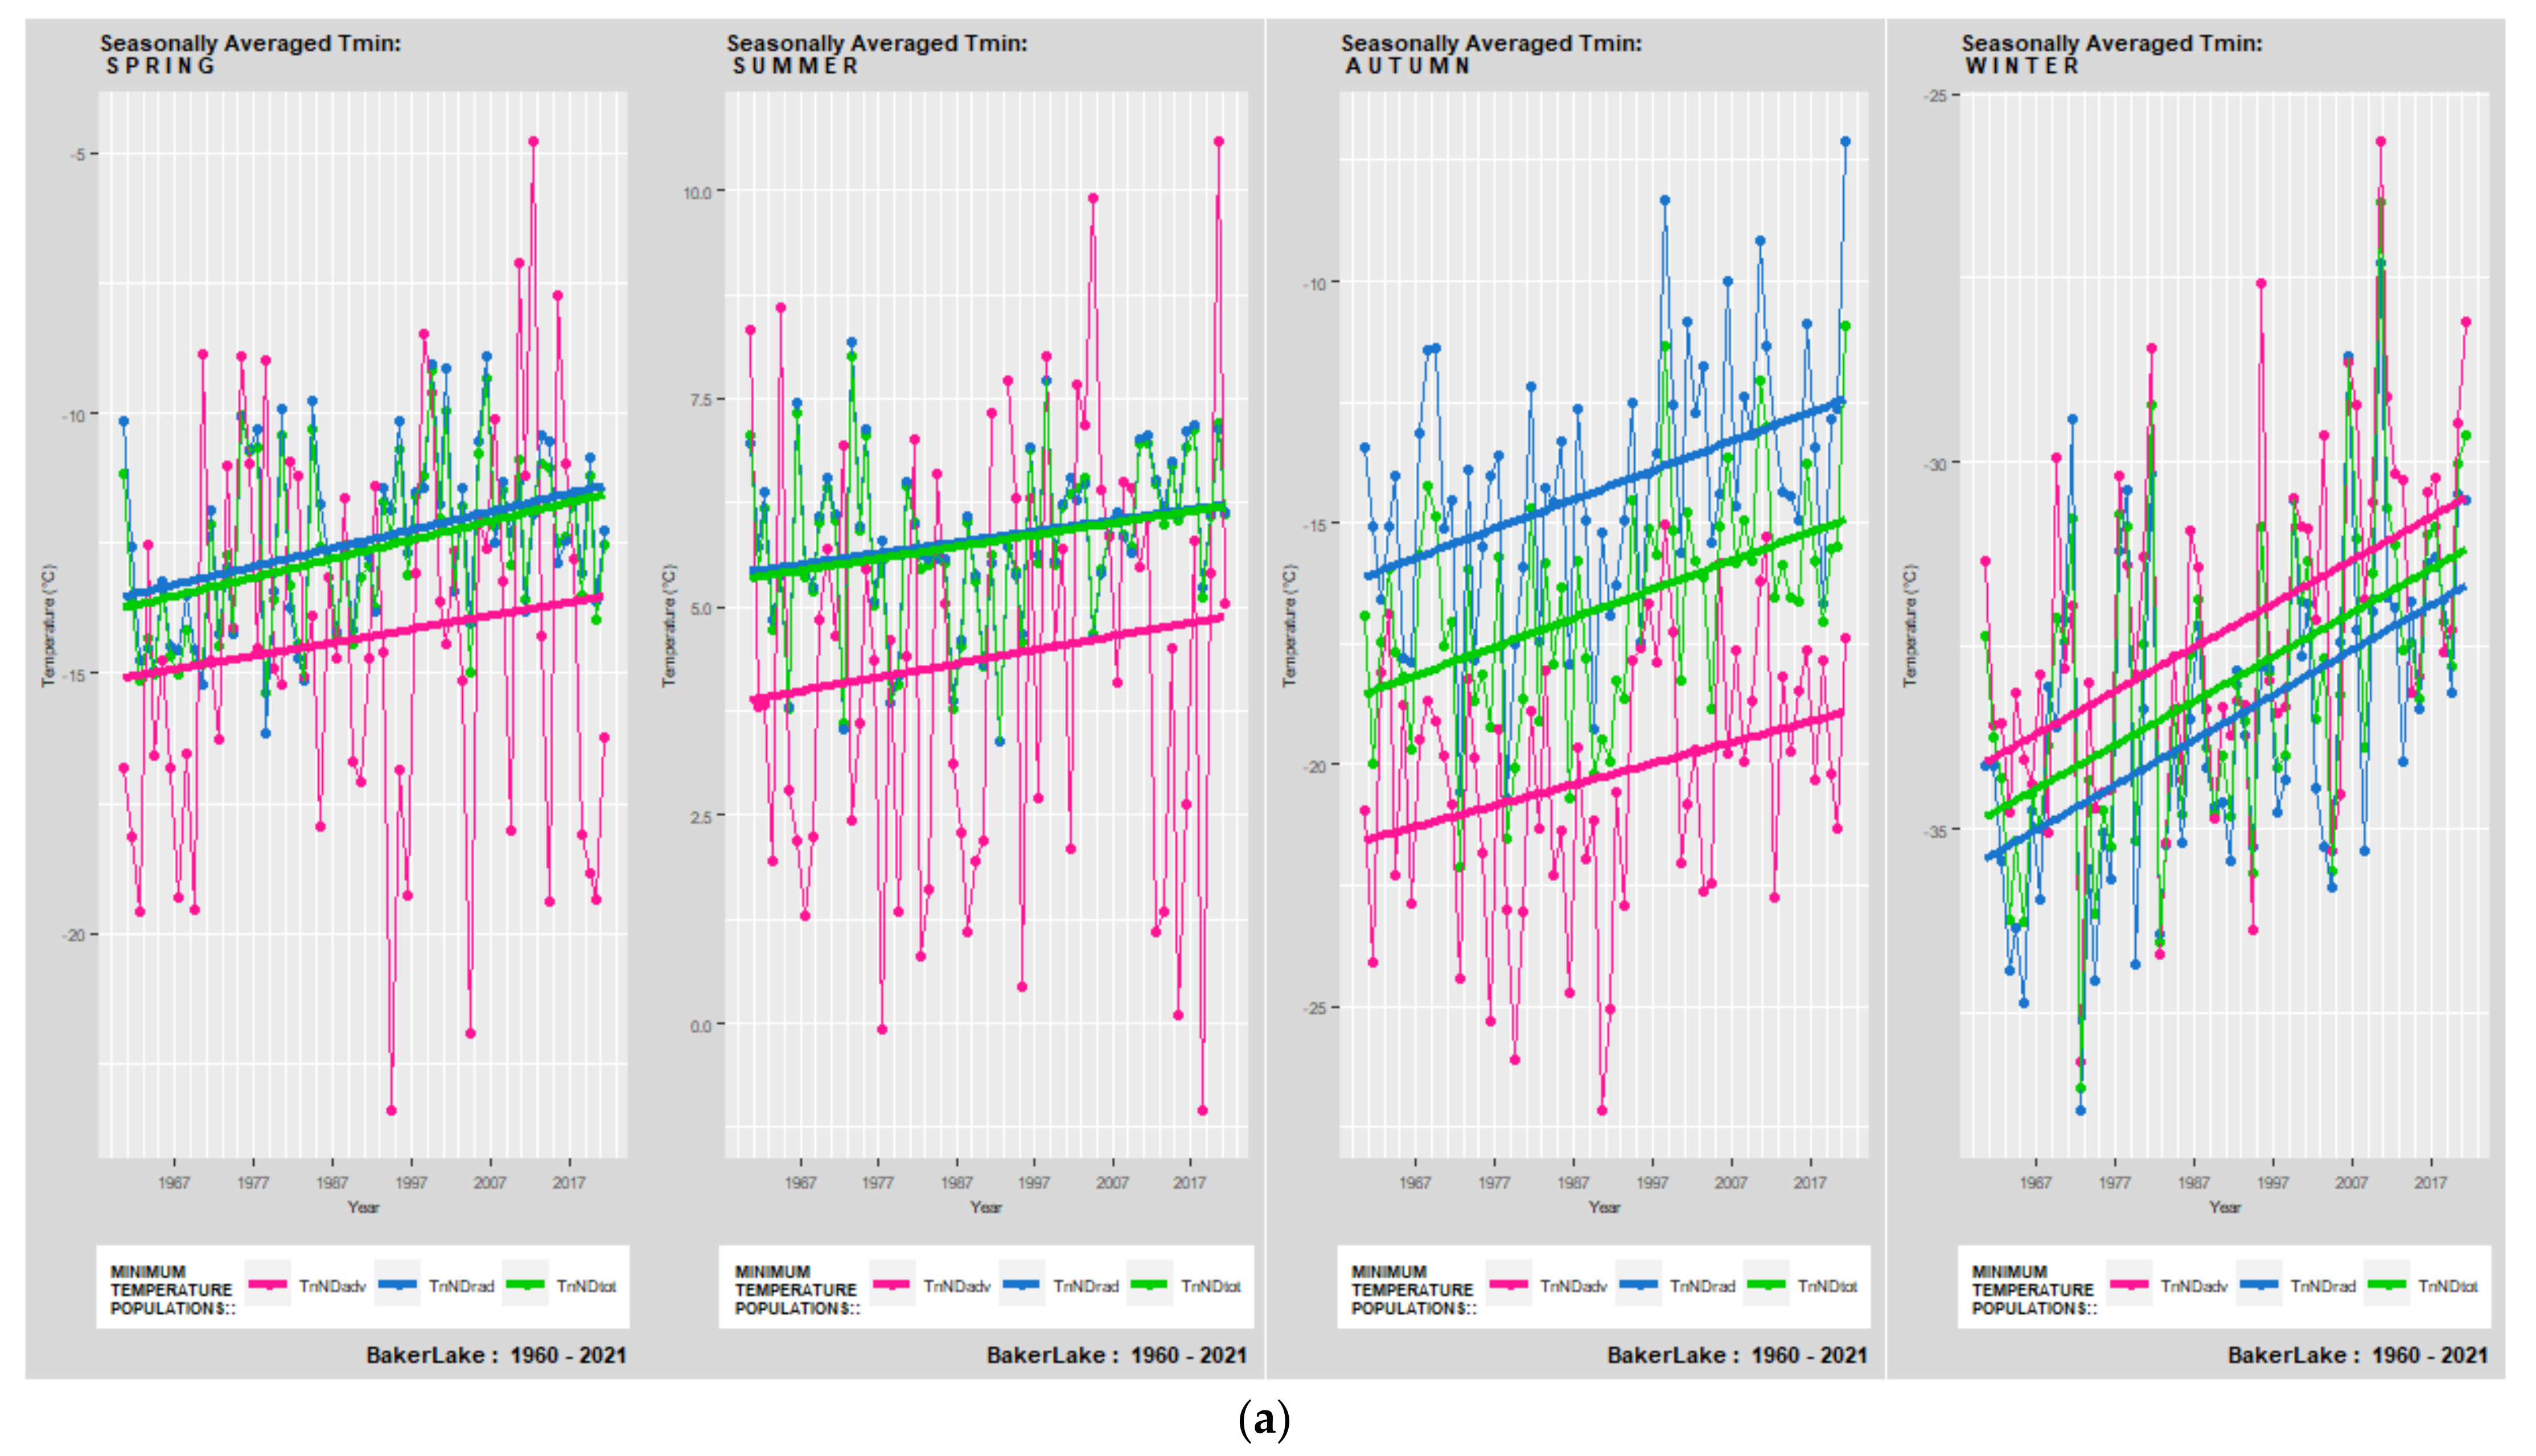
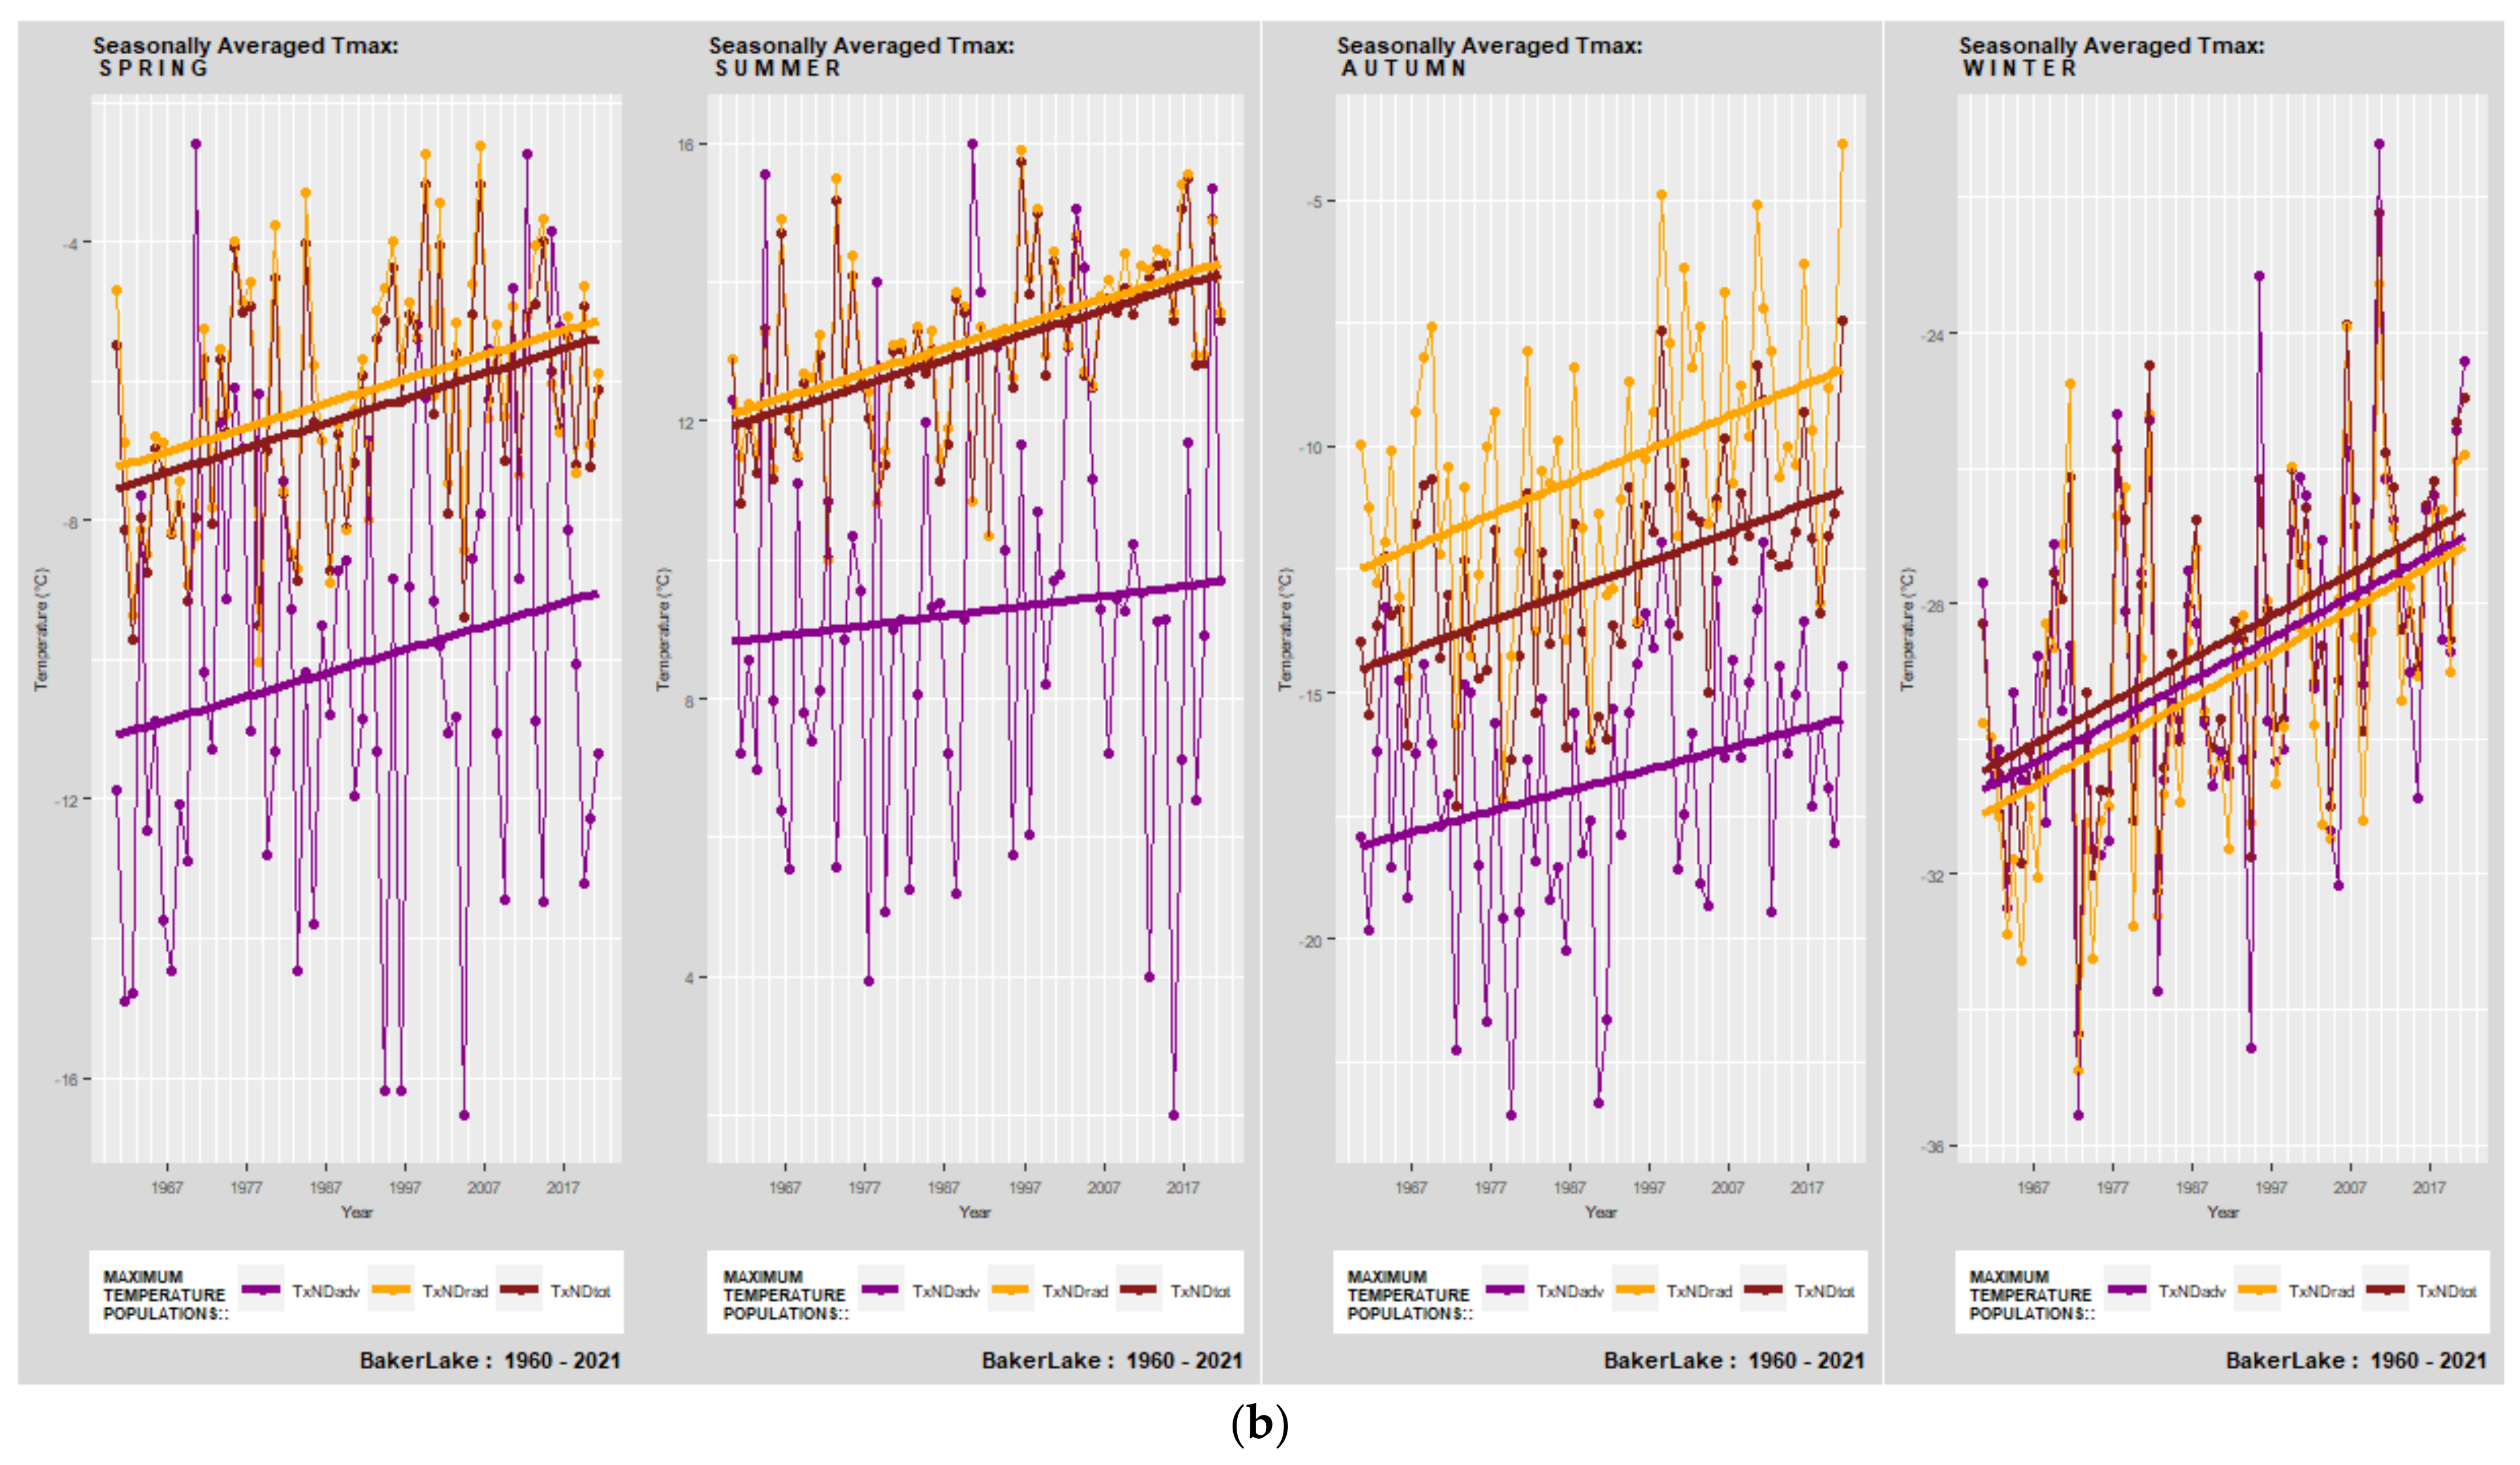
Figure 13.
Arctic Tundra (ART); Baker Lake (NU). Seasonally averaged daily temperature minima (a) and maxima (b), listed in order of Spring, Summer, Autumn, and Winter. (a)—Total Temperature Minimum (TTn) (green), Radiative Temperature Minimum (RTn) (blue), and Advective Temperature Minimum (TTn) (pink); (b)—Total Temperature Maximum (TTx) (brown), Radiative Temperature Maximum (RTx) (orange), and Advective Temperature Maximum (TTx) (purple).
The most apparent observation in Figure 8, Figure 9, Figure 10, Figure 11, Figure 12 and Figure 13 is the separation in the magnitude of radiative and advective maxima temperatures during the spring, summer, and fall. The total temperature maxima are, except for the fall season, mainly found in the proximity of radiative maxima. Radiative maxima consistently display a warm bias against maxima populations of the total and advective population except in certain cases during the winter season (Figure 8b and Figure 13b) when radiative and advective maxima, as well as minima, exhibit similar temperature magnitudes.
The variability of advective minima is visibly larger than that of other temperature populations during spring, summer, and fall. Advective minima bias is apparent in these three seasons in Figure 9, Figure 10, Figure 12 and Figure 13. The exceptions are summer minima at Saint John in Atlantic Canada where the advective warm bias is apparent in Figure 8a, and spring, summer, and fall minima at Port Hardy on the Pacific Coast exemplifying the range of advective minima peculiarities affected by the local climate (Figure 11a).
Maxima of the advective population display obvious cold bias during the spring, summer, and fall seasons. Advective maxima bias individually varies but overall seems more prominent and persistent than the advective minima bias. The winter advective bias however indicates a different thermal regime in the minima population at the majority of stations. While the maxima bias is consistently moderately negative when compared to the total population, the advective minima bias is either already positive or switches from negative to positive at the midpoint of the data set time scale corresponding to the 1990s.
Statistically significant upward trends can be observed in annually-averaged minima at all stations except for Saint John, Wiarton, Goose, Estevan, and Iqaluit (Table 4). The significance of temperature warming rates of the annual radiative and the majority of the advective population is generally consistent with the total sample, particularly during summer and winter. The exceptions are particular regions such as the Prairies (PRA) in summer and Atlantic Canada (ATL) region in winter. The statistical significance of spring maxima is more sporadic during the spring and in particular during the fall seasons.
Statistically significant upward trends can be observed in annually-averaged maxima at all stations except for Estevan and Regina (Table 5). The significance of temperature warming rates of the annual radiative and the majority of the advective population is the most consistent with summer and winter populations. The loss of statistical significance is most apparent during the fall season for all maxima populations while during spring it affects most of the advective temperature maxima.
The largest statistically significant warming trends in seasonal minima are observed in winter advective populations of the Mackenzie District (9.6 °C), North British Columbia Mountains/Yukon Territory (9.5 °C), and Northwestern Forest (8.8 °C).
3.4. Regional Summaries of Changes in Population Counts
The Canadian climate region with the highest radiative population participation (RPP) annually is the South British Columbia Mountains/Yukon Territory (90.4%) (Table 6). The radiative population count (RPC) of this region also exhibits the largest upward trend (22/c.) and inversely the lowest advective population count (APC) rate (Table 7). The regional spring and summer RPCs, as well as fall and winter RPCs, are similar and as such support the grouping into two, Spring–Summer (SS) and Fall–Winter (FW) seasons. The smallest regional annual RPP is observed in Arctic Tundra (77%) with a substantial RPC rate of 17/c., typical of northwest Canada. The highest seasonal RPC rates among the studied stations are observed in the South British Columbia Mountains/Yukon Territory during winter while the smallest seasonal RPC rates are a characteristic of spring and summer seasons across the stations.
3.5. Regional Summaries of Changes in Extrema Temperature Trends
Analysis of regional total, radiative, and advective daily temperature extrema trends reveal an overall average increase in minima of 2.7 °C in total air temperature, 2.2 °C in radiative, and 3.1 °C in advective temperature population, as well as an average increase in maxima of 2.4 °C in total, 1.9 °C in radiative, and 2.6 °C in the advective population (Table 8 and Table 9). The smallest magnitude of changes in minima trends per century was observed in spring radiative temperature populations of the Prairies and Atlantic Canada regions. On the contrary, the largest overall changes in daily minima trends are identified during the winter season averaging 3.8 °C in total, 3.6 °C in radiative, and 4.5 °C in the advective temperature population. The highest observed minima trends among climate regions are displayed by Mackenzie District, Northwestern Forest, and North British Columbia Mountains/Yukon Territory stations (Table 8).
Averages of daily maxima trends exhibit a slightly smaller seasonal increase than the minima. Winter averages of the total, radiative and advective maxima at the Mackenzie District, and North British Columbia Mountains/Yukon Territory present the largest seen seasonal warming rates (Table 9).
4. Discussion
In this work we analyzed forty-five Canadian temperature time series, spanning 69 years in length and encompassing a range of 23° in latitudes and 82° in longitudes. The previous study [3] established the main criterion for the characterization of radiative and advective days using the diurnal temperature pattern concept and introduced the method for the delineation of temperature populations.
This study examined changes in two aspects of seasonal temperature populations: the change in the number of radiative and advective days, and the change in individual temperature trends. Using the derived mathematical extrema [24] and following examples of similar studies [25,26,27,28], we explored radiative and advective thermal regimes.
Warming temperature trends were observed in all annually-averaged maxima of the total populations with only two stations in the Prairies region, Estevan, and Regina not displaying statistical significance. Upward trends of the radiative population generally displayed consistency with the total population in their statistical significance.
Seasonal maxima warming rates were observed at all stations with the exception of Estevan during the spring, summer, and fall seasons. Spring and fall warming rates showed similarities in the absence of statistical significance in their temperature trends. On the other hand, the majority of summer and winter maxima rates of total and radiative air temperature populations displayed statistical significance.
Advective maxima rates differ in statistical significance between the seasons. The majority of winter advective maxima exhibit statistical significance, including some anomalously high upward trends in northwestern Canada.
Increasing trends of annually-averaged minima are present at the majority of stations with forty out of forty-five being statistically significant. Similar to maxima, the radiative minima closely follow the magnitude and the statistical significance of trends in the total temperature population. Approximately two-thirds of advective winter minima display statistical significance with the apparent exception of Atlantic Canada, Arctic Mountains, and the Fiords regions.
Summer minima warming trends are moderate with the majority of extrema time series displaying statistical significance (86.7%) (Table 4). Winter minima trends exhibit statistical significance at 75% of stations. However, the statistical significance of spring and fall radiative and advective minima amount to 64% and 20%, respectively.
Analysis of seasonal radiative and advective counts supports the concept of Spring–Summer and Fall–Winter climatological seasons. The steady increase in radiative days at the expense of advective days reveals an already distorted balance between these two temperature populations.
Large observed radiative and advective warming trends provide strong evidence of pan-Canadian warming, particularly pronounced in the northwest region. Based on the results of this study and the analysis in [5] we speculate that the population of advective days acts as a climate moderator in the midlatitudes.
Radiative and advective thermal regimes seem to be influenced by large-scale low-frequency variability modes affecting the Canadian climate [29,30]. The weakening of the advective cooling effect of the total temperature population appears to be related to the declining frequency of dry polar air [31].
We suggest that the increase in the overall temperature magnitude and decrease in cooling advective counts translates into the loss of the moderating capacity in atmospheric thermal exchanges between major temperature populations.
The following future work recommendations present research challenges that would contribute to the understanding of the aspects of radiative and advective thermal regimes. Event-based analysis of advective heating and cooling episodes could potentially reveal additional hidden patterns of temperature variability. On the other hand, the analysis of sub-daily variations in the advective temperature regime could aid the identification of potential physical drivers operating on a smaller time scale. Urban heat island (UHI) study of radiative and advective extrema is also suggested for gaining insights into the specific UHI contributions to daily temperature variability. Finally, the correlation of changes in advective temperature extrema with changes in the population of air masses [31] is needed to examine the link between the recent Arctic amplification and rapid changes in the advective regime at sub-Arctic latitudes. In the light of significant warming trends of radiative temperature and loss of moderating ability of advective temperature, exploring the evolution of diurnal extrema timing presents the key aspect of future research that would provide the vital information necessary for the addition of the forecasting features to the LPD algorithm [32].
5. Conclusions
This study presents significant indicators of Canadian temperature changes derived from the features of two homogeneous air temperature populations: the change in the number of radiative and advective days, and the change in their temperature trends.
Seasonal radiative and advective count analysis demonstrates the existence of two predominant thermal regimes: a stable Spring–Summer period, dominated by a radiative day count, and the unstable Fall–Winter period characterized by a sizeable and a reducing advective temperature population.
Seasonal temperature analysis reveals the contrast between radiative and advective temperature regimes. The analysis of radiative and advective trends provides quantitative evidence of the magnitude of changes in these individual temperature populations. The high incidence of large and statistically significant summer minima and maxima trends in a predominantly radiative population suggests an increase in atmospheric ability to retain heat. Anomalously large, statistically significant winter warming trends observed in all temperature populations of the Canadian northwest provide evidence for the weakening of the advective temperature population’s “cooling effect” on the magnitude of the total temperature.
The significance of this work lies in the sufficiency of the presented method in the delineation of the total temperature sample for analysis of radiative and advective thermal regimes based on air temperature records alone.
Author Contributions
Conceptualization, methodology, formal analysis, writing—original draft preparation, visualization, A.Ž.-Ć., writing—review and editing, supervision, funding acquisition, W.A.G. All authors have read and agreed to the published version of the manuscript.
Funding
This research was supported by NSERC RGPIN-2018-06801.
Institutional Review Board Statement
Not applicable.
Informed Consent Statement
Not applicable.
Data Availability Statement
Publicly available data sets were analyzed in this study. These data can be found here [https://climate.weather.gc.ca/ (accessed on 10 April 2022)]. Figures of radiative and advective day counts and temperature trends of radiative and advective minima and maxima for all studied stations are available from the authors upon request.
Conflicts of Interest
The authors declare no conflict of interest.
References
- IPCC. Summary for Policymakers. In Climate Change 2021: The Physical Science Basis. Contribution of Working Group I to the Sixth Assessment Report of the Intergovernmental Panel on Climate Change. Masson-Delmotte, V., Zhai, P., Pirani, A., Connors, S.L., Péan, C., Berger, S., Caud, N., Chen, Y., Goldfarb, L., Gomis, M.I., et al., Eds.; Cambridge University Press: Cambridge, UK, 2021; pp. 3–32. [Google Scholar] [CrossRef]
- World Meteorological Organization (WMO). State of the Global Climate 2020; WMO-No. 1264; World Meteorological Organization: Geneva, Switzerland, 2021. [Google Scholar]
- Sadler, J.E.; Schroll, R.E. An Empirical Model of Diurnal Temperature Patterns. Agron. J. 1997, 89, 542–548. [Google Scholar] [CrossRef]
- Besson, F.; Bazile, E.; Soci, C.; Soubeyroux, J.-M.; Ouzeau, G.; Perrin, M. Diurnal temperature cycle deduced from extreme daily temperatures and impact over a surface reanalysis system. Adv. Sci. Res. 2015, 12, 137–140. [Google Scholar] [CrossRef] [Green Version]
- Žaknić-Ćatović, A.; Gough, W.A. Identification of radiative and advective populations in Canadian temperature time series using the Linear Pattern Discrimination algorithm. Int. J. Climatol. 2021, 41, 5100–5124. [Google Scholar] [CrossRef]
- Parton, W.J.; Logan, J.A. A model for diurnal variation in soil and air temperature. Agric. Meteorol. 1981, 23, 205–216. [Google Scholar] [CrossRef]
- Floyd, R.B.; Braddock, R.D. A simple method for fitting average diurnal temperature curves. Agric. For. Meteorol. 1984, 32, 107–119. [Google Scholar] [CrossRef]
- Wann, M.; Yen, D.; Gold, H.J. Evaluation and calibration of three models for daily cycle of air temperature. Agric. For. Meteorol. 1985, 34, 121–128. [Google Scholar] [CrossRef]
- Reicosky, D.C.; Winkelman, L.; Baker, J.; Baker, D.G. Accuracy of hourly air temperatures calculated from daily minima and maxima. Agric. For. Meteorol. 1989, 46, 193–209. [Google Scholar] [CrossRef] [Green Version]
- Linvill, D.E. Calculating Chilling Hours and Chill Units from Daily Maximum and Minimum Temperature Observations. Hortic. Sci. 1990, 25, 14–16. [Google Scholar] [CrossRef] [Green Version]
- Schaub, W.R., Jr. A Method for Estimating Missing Hourly Temperatures Using Daily Maximum and Minimum Temperatures; USAFETAC/PR-91/017; USAF Environmental Technical Applications Center: Scott Air Force Base, IL, USA, 1991. [Google Scholar]
- Chow, D.; Levermore, G.J. New algorithm for generating hourly temperature values using daily maximum, minimum and average values from climate models. Build. Serv. Eng. Res. Technol. 2007, 28, 237–248. [Google Scholar] [CrossRef]
- Žaknić-Ćatović, A.; Howard, K.W.F.; Ćatović, Z. Modification of the degree-day formula for diurnal meltwater generation and refreezing. Theor. Appl. Climatol. 2018, 131, 1157–1171. [Google Scholar] [CrossRef]
- Aguilar, E.; Auer, I.; Brunet, M.; Peterson, T.C.; Wieringa, J. Guidelines on Climate Metadata and Homogenization; WCDMP No. 53, WMO/TD No.1186; World Meteorological Organization: Geneva, Switzerland, 2003; 52p. [Google Scholar]
- Peterson, T.C.; Easterling, D.R.; Karl, T.R.; Groisman, P.; Nicholls, N.; Plummer, N.; Torok, S.; Auer, I.; Boehm, R.; Gullett, D.; et al. Homogeneity adjustments of in situ atmospheric climate data: A review. Int. J. Climatol. 1998, 18, 1493–1517. [Google Scholar] [CrossRef]
- Vincent, L.A.; Zhang, X.; Bonsal, B.R.; Hogg, W.D. Homogenization of Daily Temperatures over Canada. J. Clim. 2002, 15, 1322–1334. [Google Scholar] [CrossRef]
- Vincent, L.A.; Xiolan, L.W.; Milewska, E.J.; Hopkinson, R.; Malone, R. Bias in Minimum Temperature Introduced by a Redefinition of the Climatological Day at the Canadian Stations. J. Appl. Meteorol. Clim. 2009, 48, 2160–2168. [Google Scholar] [CrossRef]
- Vincent, L.A.; Wang, X.L.; Milewska, E.J.; Wan, H.; Yang, F.; Swail, V. A second generation of homogenized Canadian monthly surface air temperature for climate trend analysis. J. Geophys. Res. Space Phys. 2012, 117, D18110. [Google Scholar] [CrossRef]
- Vincent, L.A.; Milewska, E.J.; Wang, X.L.; Hartwell, M.M. Uncertainty in homogenized daily temperatures and derived indices of extremes illustrated using parallel observations in Canada. Int. J. Climatol. 2018, 38, 692–707. [Google Scholar] [CrossRef] [Green Version]
- Pandžić, K.; Likso, T. Homogeneity of average annual air temperature time series for Croatia. Int. J. Climatol. 2010, 30, 1215–1225. [Google Scholar] [CrossRef]
- Wang, K. Sampling Biases in Datasets of Historical Mean Air Temperature over Land. Sci. Rep. 2014, 4, 4637. [Google Scholar] [CrossRef] [Green Version]
- Government of Canada. Historical Climate Data. Available online: Climate.weather.gc.ca (accessed on 10 April 2022).
- Core Team R. A Language and Environment for Statistical Computing; R Foundation for Statistical Computing: Vienna, Austria, 2022. [Google Scholar]
- Žaknić-Ćatović, A.; Gough, W.A. A comparison of climatological observing windows and their impact on detecting daily temperature extrema. Theor. Appl. Climatol. 2018, 132, 41–54. [Google Scholar] [CrossRef]
- Gough, W.A.; Žaknić-Ćatović, A.; Zajch, A. Sampling frequency of climate data for the determination of daily temperature and daily temperature extrema. Int. J. Climatol. 2020, 40, 5451–5463. [Google Scholar] [CrossRef] [Green Version]
- Gough, W.A.; Leung, A.C.W. Do airports have their own climate? Meteorology 2022, 1, 171–182. [Google Scholar] [CrossRef]
- Gough, W.A. Thermal Metrics to Identify Canadian Coastal Environments. Coasts 2022, 2, 93–101. [Google Scholar] [CrossRef]
- Watanabe, N. An Improved Method for Computing Heat Accumulation from Daily Maximum and Minimum Temperatures. Appl. Èntomol. Zoö I. 1978, 13, 44–46. [Google Scholar] [CrossRef] [Green Version]
- Bonsal, B.; Shabbar, A. Large-Scale Climate Oscillations Influencing Canada, 1900–2008. Canadian Biodiversity: Ecosystem Status and Trends 2010; Technical Thematic Report No.4; Canadian Councils of Resource Ministers: Ottawa, ON, Canada, 2011. [Google Scholar]
- Vincent, L.A.; Zhang, X.; Brown, R.D.; Feng, Y.; Mekis, E.; Milewska, E.J.; Wan, H.; Wang, X.L. Observed Trends in Canada’s Climate and Influence of Low-Frequency Variability Modes. J. Clim. 2015, 28, 4545–4560. [Google Scholar] [CrossRef]
- Leung, A.; Gough, W. Air mass distribution and the heterogeneity of the climate change signal in the Hudson Bay/Foxe Basin region, Canada. Theor. Appl. Climatol. 2016, 125, 583–592. [Google Scholar] [CrossRef]
- Žaknić-Ćatović, A.; Gough, W.A. Diurnal extrema timing—A new climatological parameter? Climate 2022, 10, 5. [Google Scholar] [CrossRef]


Publisher’s Note: MDPI stays neutral with regard to jurisdictional claims in published maps and institutional affiliations. |
© 2022 by the authors. Licensee MDPI, Basel, Switzerland. This article is an open access article distributed under the terms and conditions of the Creative Commons Attribution (CC BY) license (https://creativecommons.org/licenses/by/4.0/).