Article

Study on Improving the Air Quality with Emission Enhanced Control Measures in Beijing during a National Parade Event

1
Jiangsu Key Laboratory of Atmospheric Environment Monitoring and Pollution Control, Collaborative Innovation Center of Atmospheric Environment and Equipment Technology, School of Environmental Science and Engineering, Nanjing University of Information Science & Technology, Nanjing 210044, China
2
Ningxia Meteorological Service Center, Yinchuan 750002, China
3
Chinese Research Academy of Environmental Sciences, Beijing 100012, China
*
Author to whom correspondence should be addressed.
Atmosphere 2022, 13(7), 1019; https://doi.org/10.3390/atmos13071019
Submission received: 11 May 2022 / Revised: 8 June 2022 / Accepted: 15 June 2022 / Published: 24 June 2022
(This article belongs to the Special Issue Air Pollution in China)

Abstract

:
Research on the enhanced control and emission-reduction measures to improve air quality during major events could provide data theory and scientific support for air-quality improvement during non-activities. Based on the air-quality data published by the China Environmental Monitoring Station and the meteorological elements and weather conditions released by the China Meteorological Administration, this paper explored the characteristics of air-quality evolution in Beijing from 5 August to 18 September 2015 and the weather situation during the Military Parade. The results showed that: (1) Emission-reduction measures implemented for air quality by Beijing and its surrounding area were induced, and we explored the contribution of these measures to pollutants or AQI in the locality. (2) During the 2015 Military Parade, Beijing was in the front or lower part of the high-pressure system. Due to the strong effect of North or Northeast winds, the weather situation was conducive to the diffusion of pollutants. When before or after the implementation, once the atmospheric diffusion was poor, the pollutants would accumulate gradually. Thus, it can be seen that the weather situation had a great impact on air quality. (3) During the implementation, PM2.5, PM10, NO2 and other pollutants decreased significantly, of which the concentration of PM10 decreased the most, from 109 μg·m−3 down to 34 μg·m−3, and the concentration of PM2.5 decreased by 72.73%. According to the changes between before and during the implementation or during and after the implementation, the concentration of PM10 and PM2.5 increased when the implementation of the emission-reduction measures had been finished, indicating that the enhanced control measures made a great contribution to the emission reduction in particles. (4) In addition, the annual average of AQI in the three years is 87.49, and the average value of a normal year was the average value of 2013 and 2014. The average value of the normal year during the military parade is 64.63, which was 70.40% lower than the average value of AQI during the military parade. The goal of reaching the secondary standard of GB-3095-2012 was achieved, and there was still a long way to go from the primary standard. In a few words, in order to achieve the goal of better air quality throughout the year, all parties still needed to coordinate control and make joint efforts.

1. Introduction

In recent years, a series of temporary emission-reduction measures have been adopted to ensure air quality during some large-scale events at home and abroad, such as the 2002 Busan Asian Games, the 2008 Beijing Olympic Games, the 2010 Guangzhou Asian Games, and the 2014 APEC Meeting in Beijing. Many scholars have studied air quality from the aspect of air quality protection measures. For example, Li L et al. [1] used the WRF-CMAQ model to simulate the concentration of PM2.5 under the condition of no control measures and temporary industrial control measures or carried out the evaluation of effect of control measures on air-quality improvement during the Nanjing Youth Olympic Games based on actual observation data. Wang et al. [2] found that during the APEC meeting in 2014, the overall air quality of Shijiazhuang city was better than that of the same period in 2013, and the mass concentration of all air pollutants except for O3 decreased significantly. Lee et al. [3] conducted a study on PM10, CO, NO2, and SO2 of 13 air sub-stations during the traffic restriction period of the 2002 Busan Asian Games in South Korea and found that the concentrations of these pollutants all decreased significantly. Beig et al. [4] used the WRF-Chem model to evaluate and found that if effective emission-reduction measures were not taken during the event, the air quality improvement effect would be limited. Liu et al. [5] found in their study that the contribution of early progressive emission reduction to SO2, NO2, VOC, and other pollutants was greater than that of temporary emission-reduction measures. Li et al. [6] analyzed the improvement in air quality in Beijing during APEC and found that compared with the same period in 2013, the concentration of PM2.5 significantly decreased during APEC in 2014, and the air quality was dominated by fine weather, indicating that enhanced emission-reduction measures had a significant effect on the improvement in air quality in Beijing.
Studies showed that different weather situations, different seasons, and different pollution sources have different impacts on pollutant concentrations [7,8,9,10,11,12]. Therefore, a lot of research has been conducted on weather conditions during major events. For example, Li et al. [13] analyzed the variable characteristics of air quality and pollution meteorological conditions in Guangzhou during the Guangzhou Asian Games and pointed out that the air quality during the Asian Games could be guaranteed under the influence of strong emission-reduction measures implemented by the government and good weather conditions. Yu et al. [14] analyzed the weather conditions during the Asian Youth Games and found that due to the influence of afternoon thundershowers and typhoons, the weather conditions during the Asian Youth Games were good for the diffusion of pollutants, and the air quality was significantly better than that of the same period in 2011 and 2012. Chen et al. [15] studied the impact of meteorological conditions on air quality during the Shanghai World Expo. Although the joint prevention and control measures of air quality during the Shanghai World Expo made pollution emissions lower than in normal years, the transport and diffusion of atmospheric circulation still led to three pollution events during the Shanghai World Expo when the meteorological conditions were unfavorable. The results indicated that meteorological conditions are one of the main factors affecting the air quality during the Shanghai World Expo. In addition, some scholars studied the formation mechanism of pollution under different control measures [16,17,18,19,20,21,22,23,24,25,26,27,28].
In honor of the 70th-anniversary victory of the Chinese People’s War of Resistance against Japanese Aggression and the World Anti-Fascist, a grand ceremony was held on 3 September 2015 in China. So as to protect Beijing’s air quality during the Military Parade, six provinces around Beijing jointly implemented a series of control measures and regional joint prevention, including odd–even license plate restrictions, industrial production and suspension. During this period, Beijing’s air quality reached grade one (excellent) weather for 15 consecutive days, and on September 3rd, there were blue skies and white clouds, widely known as “Military Parade blue”. At present, scholars have evaluated the effect of emission reduction during the Military Parade [29,30].
Different from previous studies, this study conducted a comparative study on the air quality of Beijing before, during, and after the implementation of the enhanced control measures for the 2015 military parade, as well as during the same period in 2013 and 2014. In addition, a comparative analysis of the improvement effect of air quality between the 2014 APEC and the 2015 Military Parade was also carried out. Meanwhile, emission enhanced control and reduction measures with regard to Beijing or its surrounding area during the 2015 Military Parade were induced. To explore and analyze the contribution of emission-reduction measures and weather conditions to the improvement of air quality in Beijing, this study can provide data theory for air-quality research before, during, and after the implementation of emission-reduction measures during major activities and scientific support for the implementation of air quality assurance measures during non-activities. The actual mechanism and single-factor research had not been applied in this study, so further study is needed.
Based on the air-quality data of the Beijing Olympic Sports Center released by the China Environmental Monitoring Station, this study compared the changes in Beijing’s air quality before, during, and after the implementation of the Military Parade, as well as the same three years in 2013, 2014, and 2015. The discussion of the effect of emission-reduction measures or the influence of weather conditions on Beijing’s air quality has important scientific significance and practical value, and at the same time, it could provide scientific and technical support for improving Beijing’s air quality.

2. Materials and Methods

2.1. Data

(1)
Air-quality data were collected from the data of various pollutants released by the China Environmental Monitoring Station of the Ministry of Environmental Protection (https://air.cnemc.cn:18007/, accessed on 10 May 2022), including the hourly concentration value, daily concentration value, and Air Quality Index (AQI) or various pollutants.
(2)
AQI standards and technical regulations in China: air quality standards in China come from the ambient air quality standards (GB 3095-2012) and the technical regulations for ambient air quality index (AQI) (Trial) (HJ 633-2012) (hereinafter referred to as the regulations) issued by the Ministry of Environmental Protection.
(3)
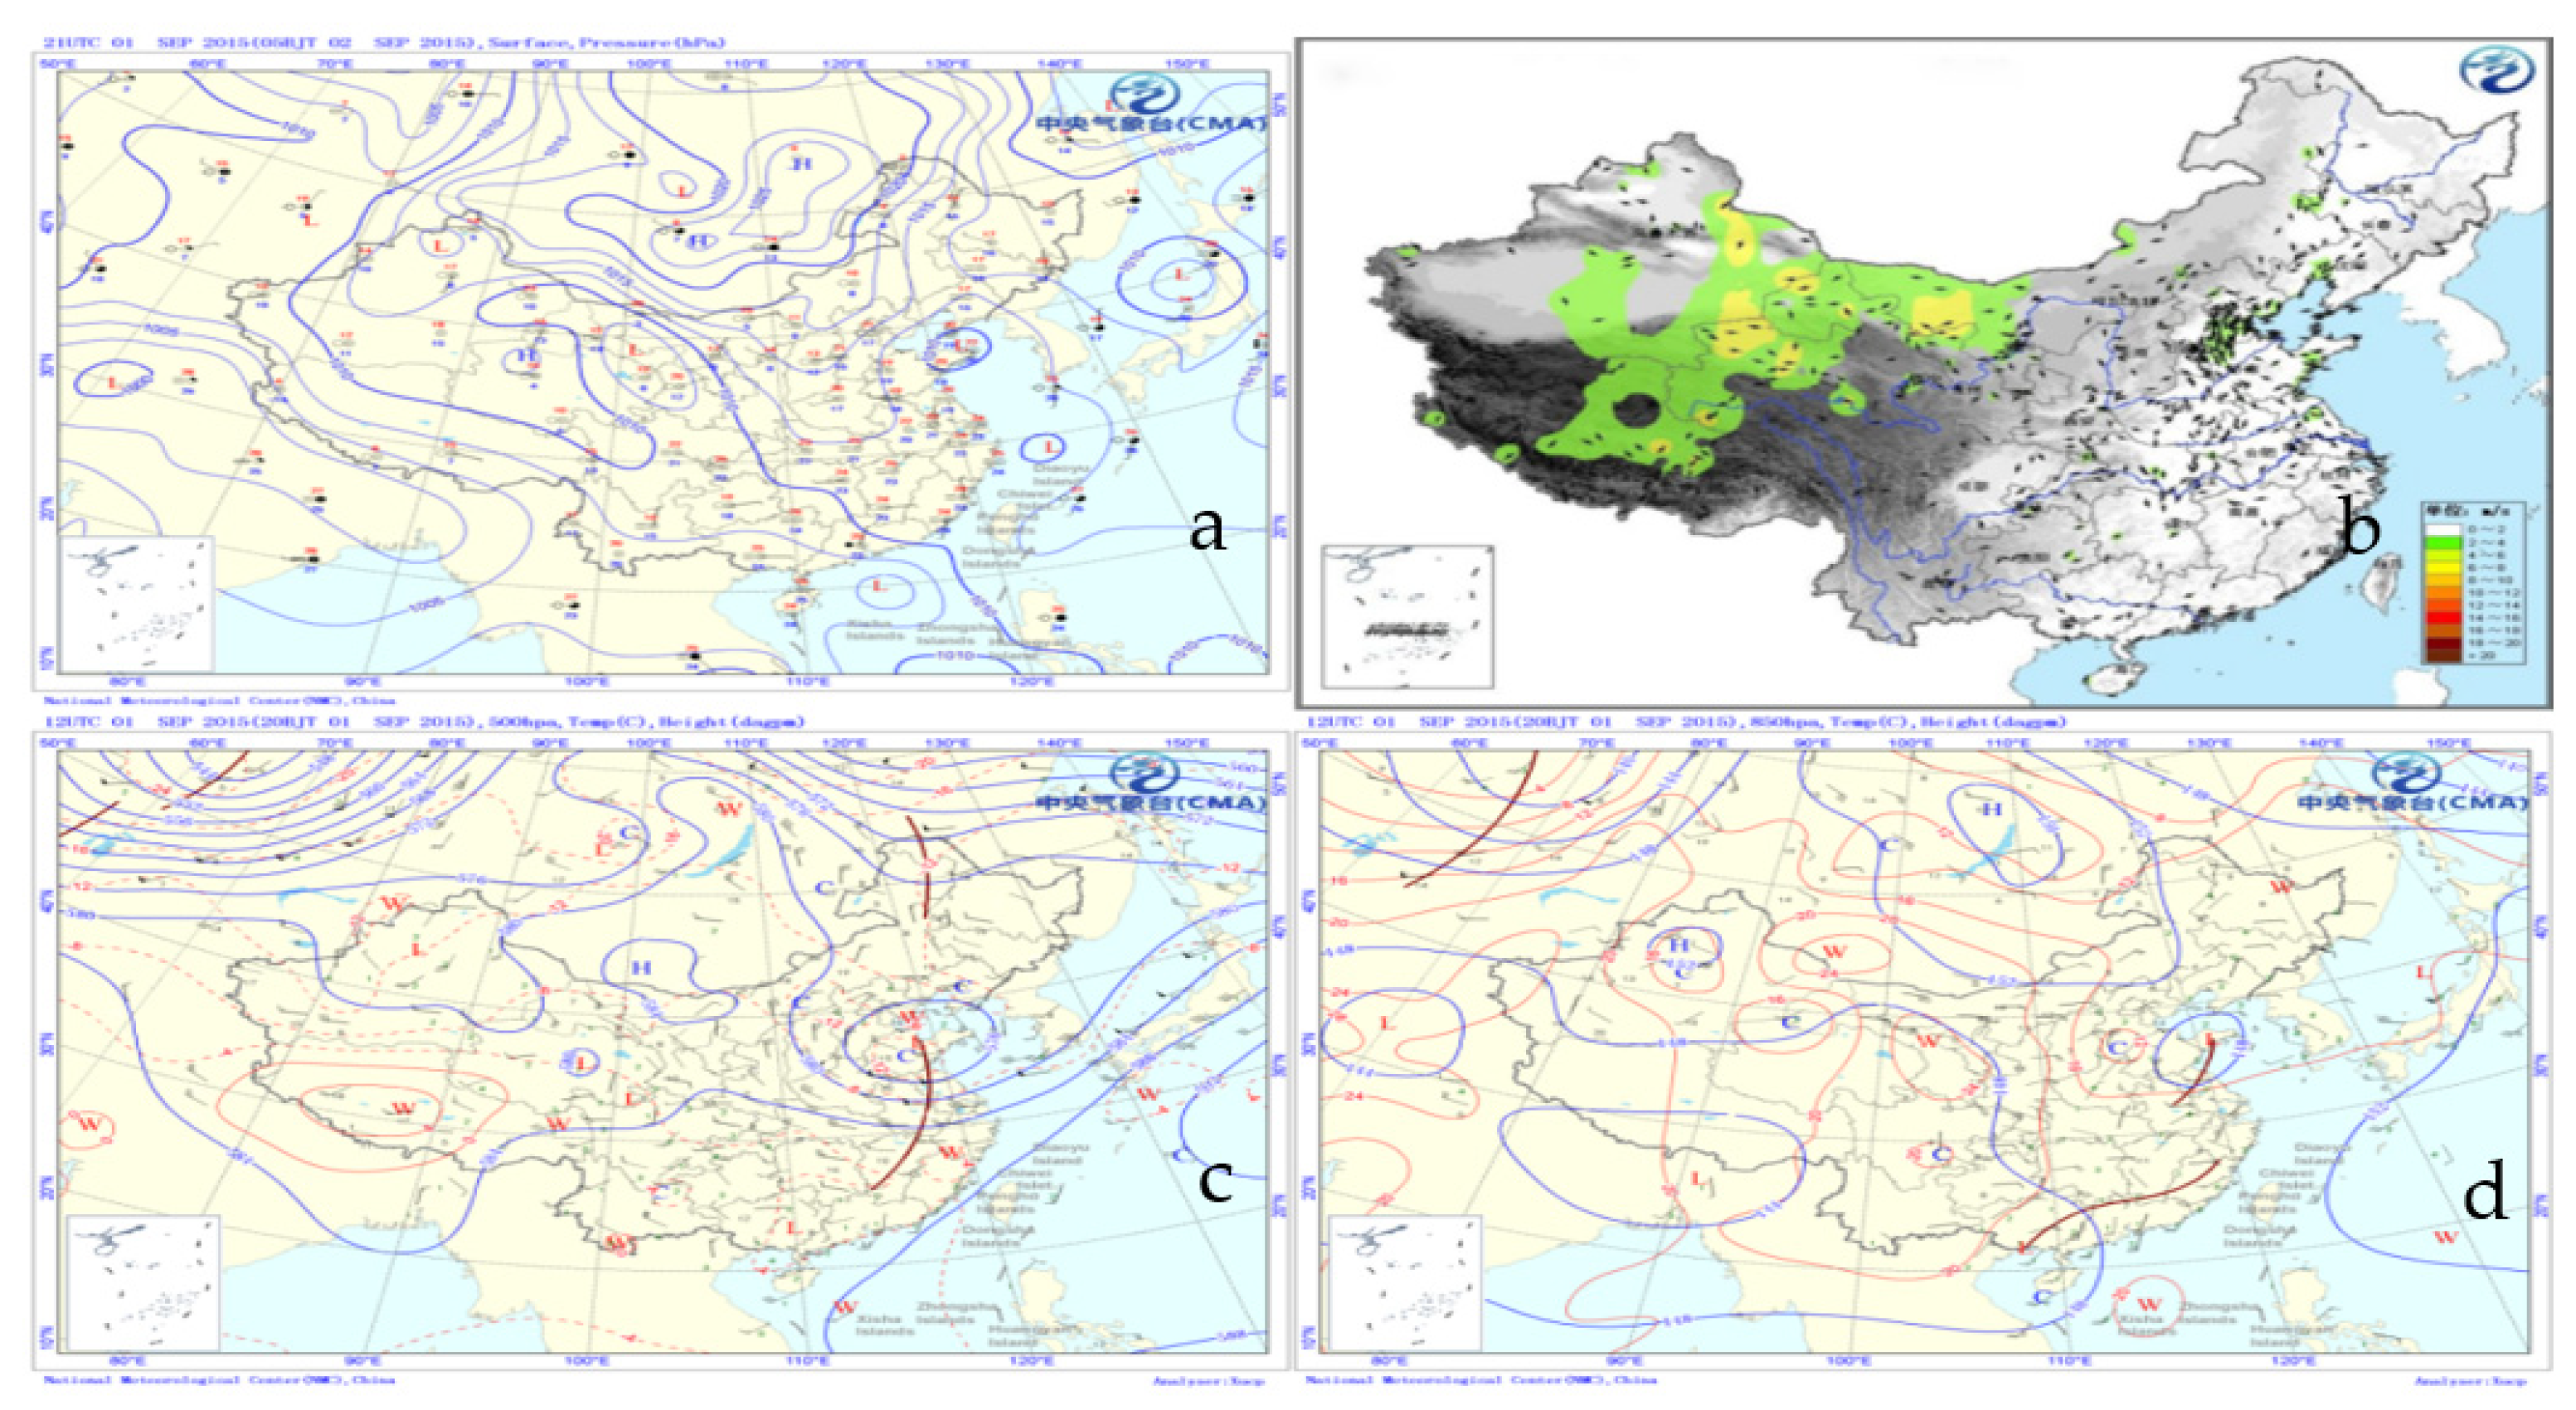
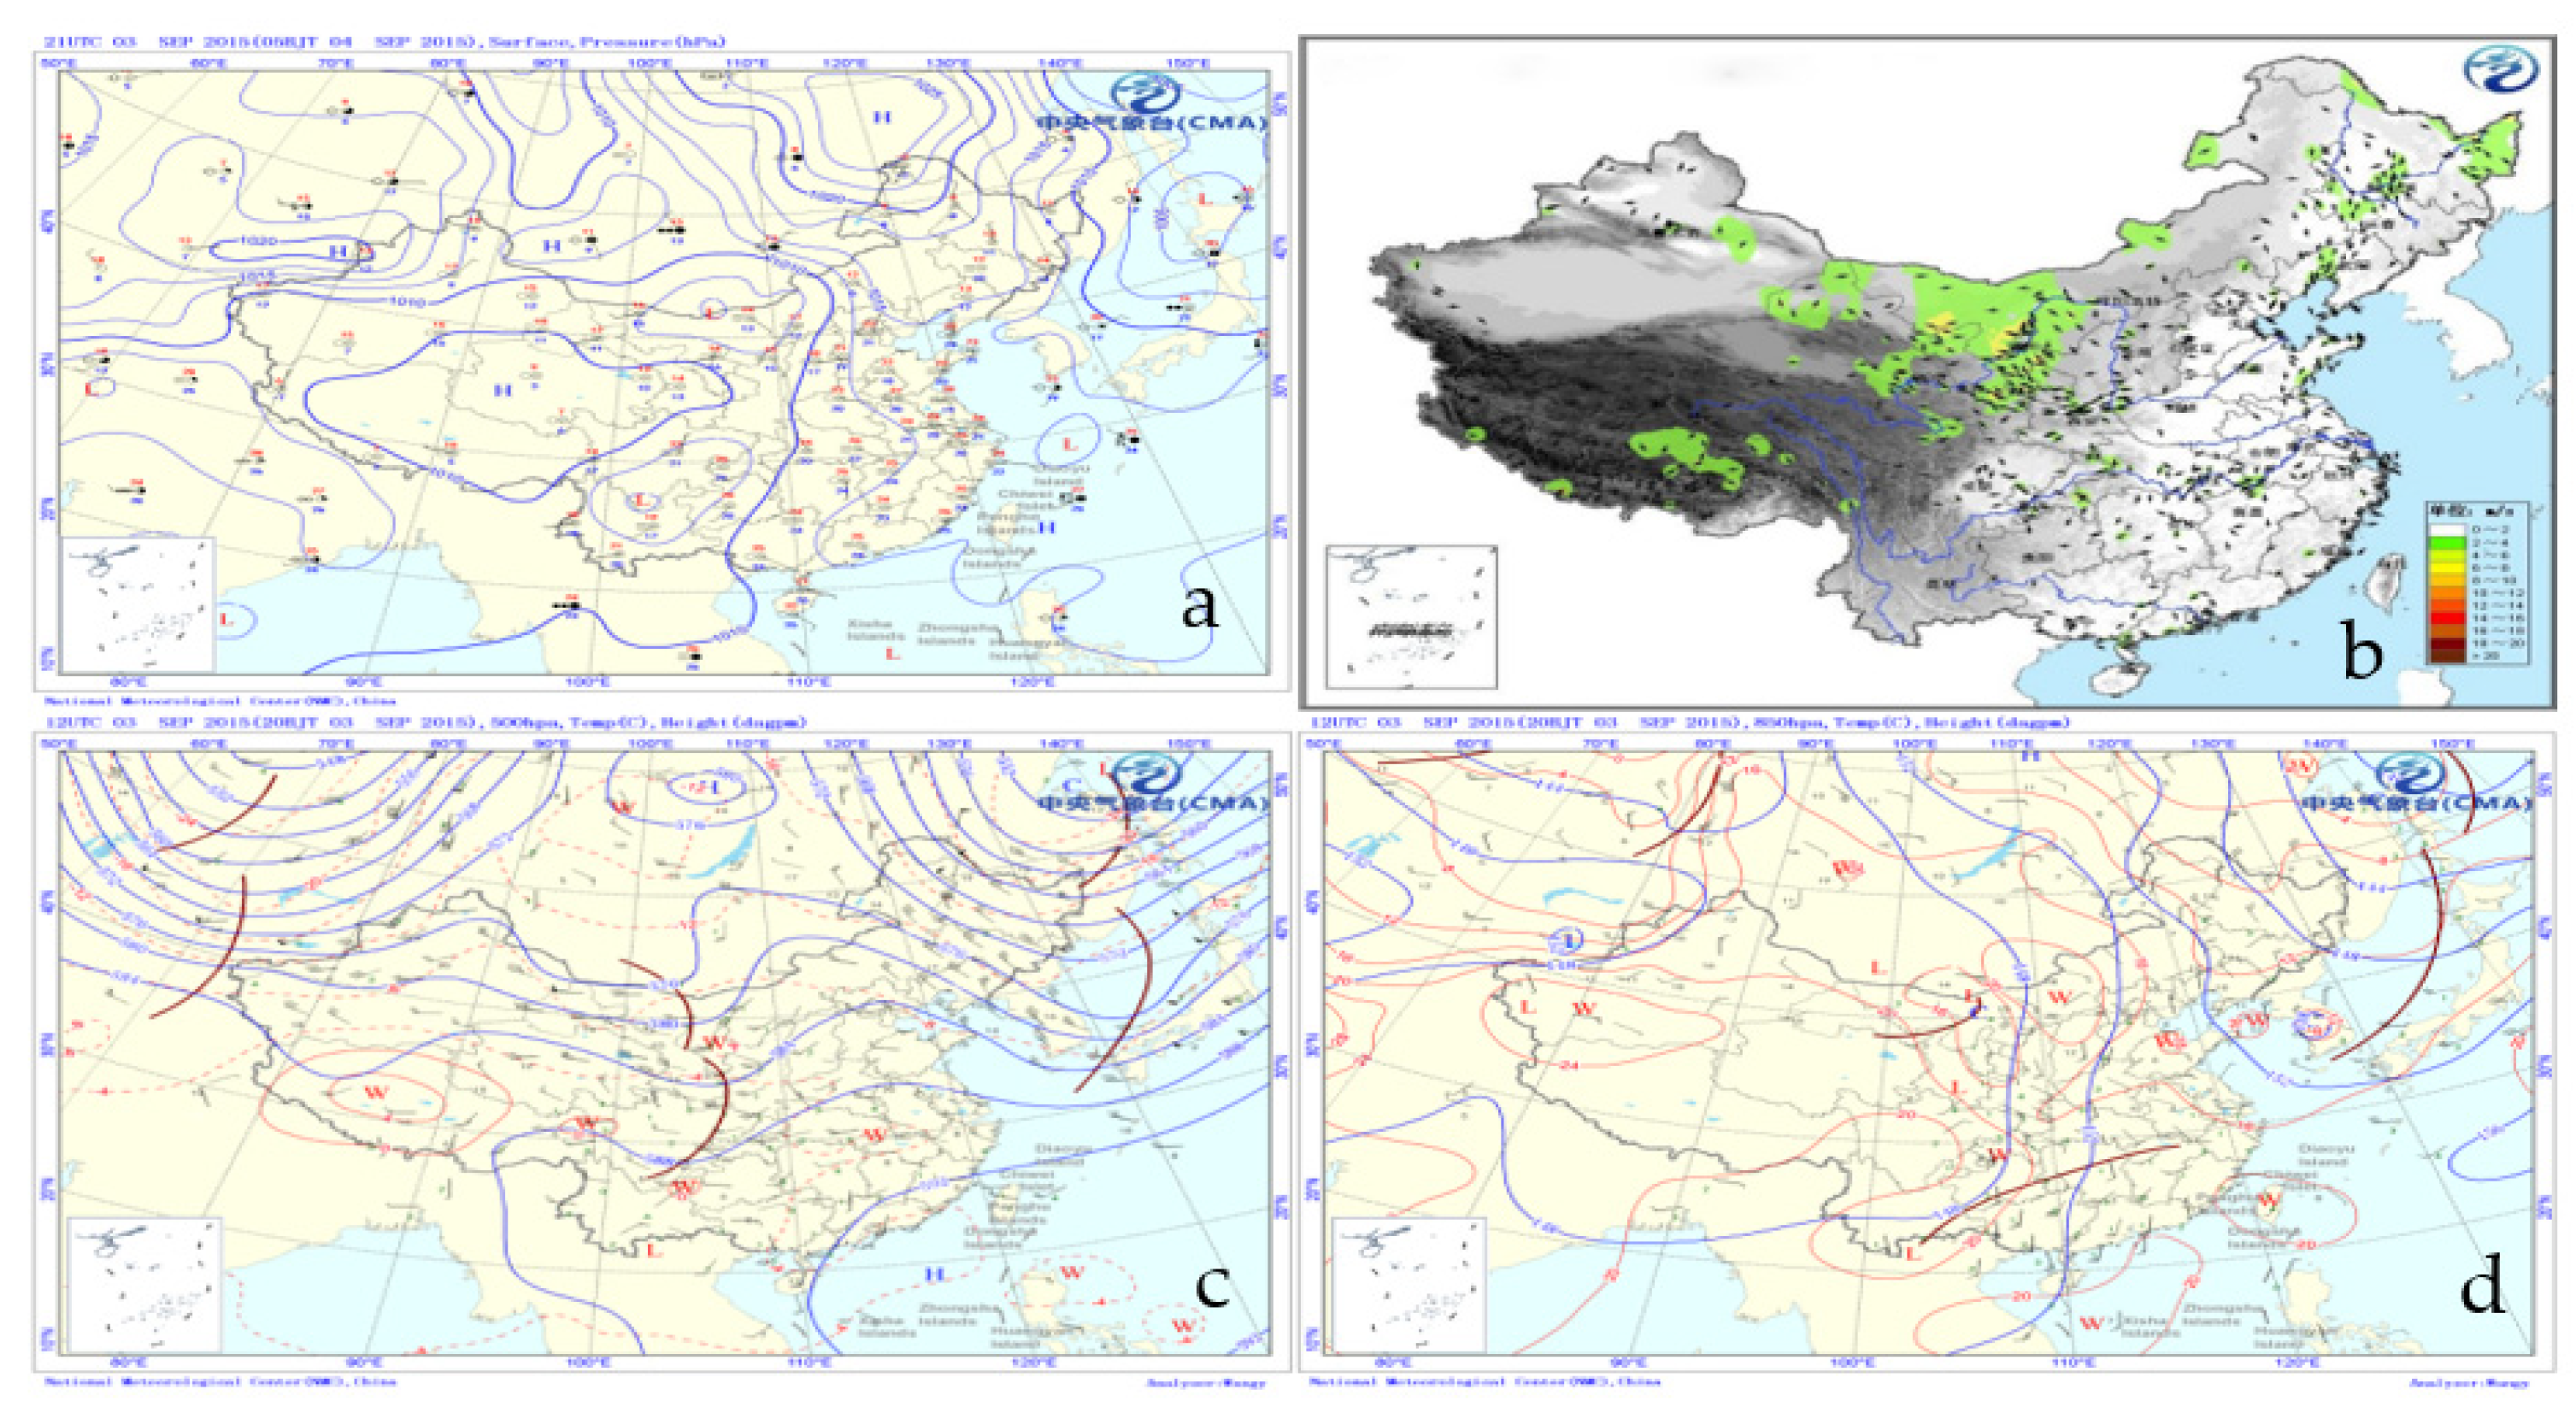
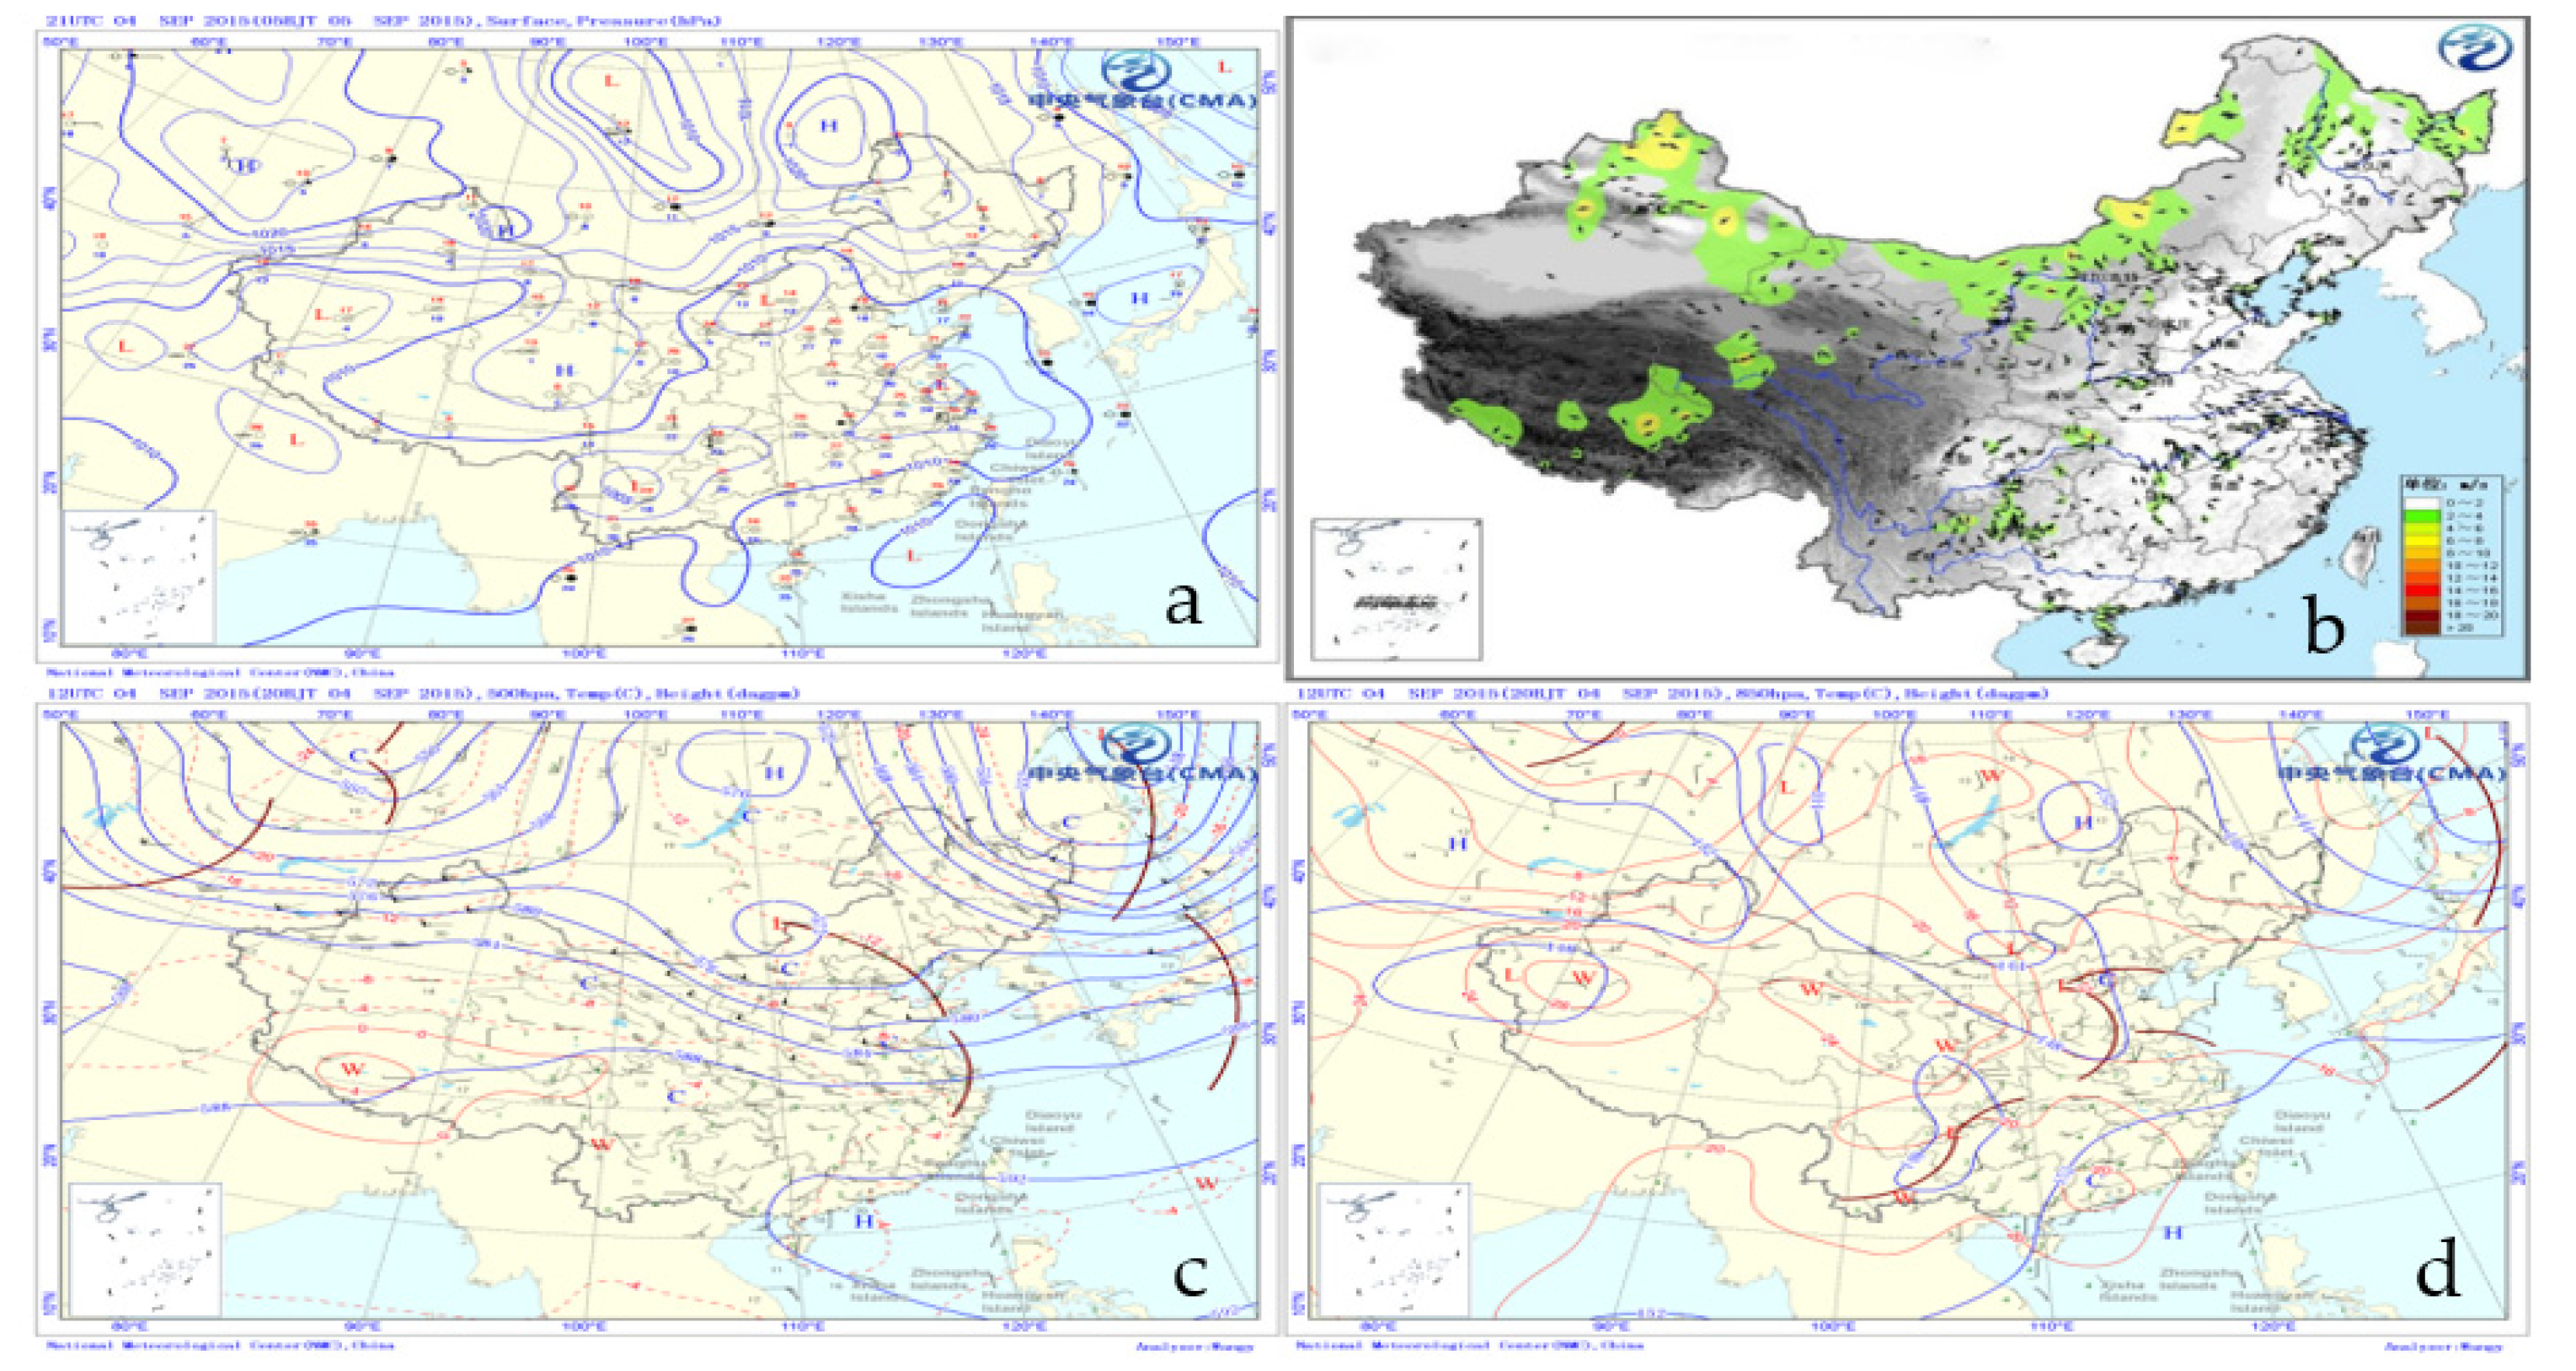
The weather situation field three times a day was taken from the weather situation of the Central Meteorological Observatory, including the analysis of the surface situation, the high altitude 850 hPa and 500 hPa situation maps, and the wind direction and speed data observed by the national hourly ground automatic stations.
(4)
For the sake of comparing the impact of the enhanced control and emission-reduction measures on air quality, the monitoring station of the Olympic Sports Center was selected as the research object, and the point of time that was picked was 15 days before, during, and after the implementation of the enhanced control and emission-reduction measures, respectively (from 5 August to 18 September, a total of 45 days). Figure 1 shows the location diagram of the research site. The Olympic Sports Center was the emptiest area near the North Fourth Ring Road. The monitoring site was laid in the willows on the south side of the vacant lot. It was about 150 m away from the Olympic Sports Center to the south, 380 m away from the Ding Road to the east, 540 m away from the main road of the North Fourth Ring Road, and 730 m away from Bei Chen Road to the west. There was a large area of open greenbelt in the south of the Olympic Sports Center.
(5)
Emission-reduction measures from the government sites of Beijing and its surrounding area during the 2015 Military Parade.

2.2. Methods

The research method adopted in this study was time series analysis in statistics. Firstly, the enhanced control measures such as traffic restriction and emission reduction adopted in Beijing and its surrounding areas during the Military Parade were summarized and sorted out. Secondly, the air quality before, during, and after the implementation of the enhanced control measures was analyzed. At the same time, the air quality in 2013 and the air quality in 2014 were compared.
Taking into account the calculation of ambient air quality in China, the 1-h concentration air quality sub-index (IAQI) classification concentration limit of particulate matter (PM2.5 and PM10) is based on the 24-h concentration AQI classification concentration limit. The study consulted AQI standards and technical regulations from Data (2), and an AQI greater than 150 (corresponding to the daily average concentration limit of PM2.5 greater than 115 μg·m−3) is defined as a pollution event, i.e., an event with continuous occurrence of moderate pollution or more is defined as a pollution event. At the same time, it is stipulated that a pollution event is composed of two parts: the pollution accumulation process and the pollution disappearance process. The pollution accumulation process refers to the process in which pollutants rise from the trough (minimum value) to the peak (maximum value). One pollution disappearance process refers to the process in which the pollution drops from the peak value to another valley value. Generally speaking, the accumulation time of the pollution accumulation process will be longer than that of the pollution disappearance process.
Supplemented by sky photos from 08:00 to 08:30 every morning as a reference, it could visually compare the evolution of air quality around the Beijing Olympic Sports Center. The photos were taken from the top floor of the Chinese Academy of Environmental Sciences to the Southwest (the tree of life sightseeing tower). Although the photos were static and instantaneous, they also reflected the actual situation of air quality in Beijing to some extent.
In short, in order to simplify the structure of the article, the implementation of enhanced control and emission-reduction measure was abbreviated as IECERM. The time of IECERM (during the Military Parade) was from 20 August to 3 September. Among them, 15 days from 5 August to 19 August were chosen as before IECERM (before the Military Parade), and 15 days from 4 September to 18 September were selected as after IECERM (after the Military Parade).

3. Results

For the purpose of ensuring air quality during the Military Parade on 3 September, six provinces and cities around Beijing with Beijing had jointly implemented temporary enhanced control and emission-reduction measures. Among them, motor vehicles, industrial enterprises, coal burning, and dust as the main control objects. The measures would be sustained from midnight on 20 August to 24:00 on 4 September.

3.1. Review of the Implementation of Enhance Control and Emission-Reduction Measures during the Military Parade

In Beijing, including industrial enterprises, coal-fired boilers or construction, and other aspects of enhanced emission-reduction measures were taken. With regard to the industrial source, measures should be taken to suspend or limit the production of workshops and processes that emitted air pollutants in petrochemical, building materials, industrial painting, printing, furniture, and other industries. For the aerial dust source, there were two ways to go. On the one hand, earthwork, road milling, structural demolition, construction waste and residue transportation, painting, and other construction operations were stopped. On the other hand, construction waste and heavy vehicles such as muck trucks and gravel trucks were banned from driving on the road. In terms of the moving source, in addition to public transport, ambulance, fire, sanitation, law enforcement, “green channel”, and other urban operation support vehicles or pure electric buses, odd–even motor vehicles in all regions were implemented; 30% of motor vehicles of the party and government organs at all levels, municipal social organizations, public institutions, and state-owned enterprises would be suspended from driving on account of odd–even license plates, and 80% of official vehicles would be suspended from driving. Moreover, construction waste and muck carriers, concrete tankers, sand and stone carriers, hazardous chemical carriers, and other vehicles were prohibited from driving on Beijing municipal roads all day long, and freight vehicles, low-speed trucks, and tractors were prohibited from driving on roads within the Sixth Ring Road from 06:00 to 24:00 h every day.
In terms of road transportation, measures such as odd–even license plate restrictions and suspension of official vehicles were taken. In the administrative area of Beijing, from 20 August to 4 September, motor vehicles with license plates issued by Beijing and motor vehicles from other provinces, regions, and cities entering Beijing were driven in single and double numbers for one day and two days from 03:00 to 24:00 day by day. In addition, 80% of the day’s motor vehicles affiliated with party and government organs at all levels, social organizations, public institutions, and state-owned enterprises of Beijing stopped driving. Motor vehicles in other provinces were prohibited from driving on roads within Beijing’s Fifth Ring Road (including the Fifth Ring Road) from 07:00 to 09:00 and 17:00 to 20:00 every day. Table 1 lists the specific restrictions.
In addition, from midnight on 28 August to 24:00 on 4 September, six provinces surrounding Beijing, including Tianjin, Hebei, Shanxi, Inner Mongolia Autonomous Region, Shandong, and Henan provinces, implemented temporary enhanced emission-reduction measures in the union to ensure air quality during the Military Parade. Specific measures were as follows.
In Tianjin, there were 285 steel, cooking, cement, glass, and other elevated pollution sources suspended, and 421 enterprises in chemical, printing, industrial painting, furniture, automobile manufacturing, automobile repair, and other industries that produced volatile organic compounds had taken measures to stop production, repairment, and limit production. In order to ensure a discharge standard, all pollutants should be reduced by at least 30 percent as a result of the discharge. To minimize elevated pollution sources and pollutants from key industrial enterprises, all construction work on buildings, roads, and demolition sites; open burning and barbecuing; and fireworks and firecrackers were prohibited in urban and rural areas in Shandong. In Henan, 13 electric power, 48 carbon, 25 cement, and 297 refractory enterprises in Zhengzhou were investigated and rectified; 14 of its 29 coal-fired units were shut down in Pingdingshan; Jiaozuo imposed total coal consumption controls on 28 key coal-consuming enterprises, while Xinxiang and Sanmenxia also adopted corresponding measures. In total, 8587 heavy polluters were investigated, of which 128 enterprises were ordered to stop construction, 304 enterprises to stop production, and 112 enterprises to shut down in Shanxi. According to the climate characteristics of the summer–autumn transition period, pollutant emissions, or pollutant diffusion of the air quality of Beijing, Hebei province could be divided into key control areas—Shijiazhuang, Tangshan, Langfang, Baoding, Hengshui, Xingtai, Handan city, Dingzhou, Xinji, Qianan, Zhuozhou or Ningjin, Jing County, and Wei County—while the others are general control areas. Measures such as reducing production load, burning high-quality coal with low-sulfur, and implementing emission performance management should be taken to reduce pollutant discharge by more than 30% from elevated pollution sources in the area. During the event, the Inner Mongolia Autonomous Region strengthened the monitoring of motor vehicle exhaust emissions, set up 12 security checkpoints in Beijing, strengthened the inspection of vehicles entering Beijing, and required that vehicles do not meet the emission level of national III or above of the driving restriction requirements in time, and the traffic control department of public security denied all vehicles that do not meet the formalities entrance to Beijing. Hohhot, Baotou, Chifeng, the Xilin Gol League, and Ulanqab, which were close to Beijing, were also listed as key control areas. In these areas, carrying earth or muck and vehicles carrying dangerous goods were prohibited, and vehicles with yellow labels, low-speed trucks, and agricultural vehicles were restricted at different times.
After the safeguard measures for air quality in seven provinces and cities were implemented in a union, emission-reduction measures such as vehicle restrictions, enterprise suspension, production restriction, and construction site suspension were put in place, which helped Beijing’s air quality remain excellent quickly. From 20 August to 3 September, compared to the air quality with no measures, the concentration of PM2.5 at 11 state-controlled air-quality-monitoring stations in Beijing dropped by an average of about 41 percent. If no safeguard measures were taken, the concentration of PM2.5 would increase by about 70 percent. The air quality of Tianjin, Hebei, Shanxi, Shandong, Henan, Inner Mongolia, and other neighboring provinces improved significantly, and the average concentration of PM2.5 in 70 cities at prefecture-level and above dropped by about 40 percent. In addition to the excellent performance of PM2.5, other pollutants also showed a significant decline under the enhanced emission-reduction measures of the city and surrounding provinces. The average concentration of SO2, NO2, and PM10 was 3.2 μg·m−3, 22.7 μg·m−3, and 25.3 μg·m−3, year-on-year declined by 46.7%, 52.1%, and 69.2%, respectively. They both reached the lowest levels in the history of monitoring; during the Military Parade on the morning of 3 September, the average concentration of PM2.5 in Beijing was only 8 μg·m−3.
The proportion of pollutant emission reduction and PM2.5 concentration improvement achieved by the air quality safeguard measures was slightly higher than that achieved by the 2014 APEC air quality safeguard measures. Compared with the same period in 2014, the total emission reduction ratio of SO2, NO2, PM10, PM2.5, and volatile organic compounds in Beijing reached 36.5%, 49.9%, 50.3%, 49.0%, and 32.4%, respectively.

3.2. Air Quality and Weather Background during the Military Military Parade

3.2.1. Hourly Concentration of PM2.5

For evaluating the improvement effect of enhanced control and emission-reduction measures on air quality in Beijing, Figure 2 showed the hourly concentration of PM2.5 at Beijing Olympic Sports Center monitoring sites combined with photos of the sky from 8:00 a.m. to 08:30 a.m from 5 August to 19 September in 2015. By comparing the sky photos before, during, and after the traffic restriction, it could be seen that a blue sky appeared for 7 days during the traffic restriction and only appeared for 5 days before and after the traffic restriction. Before the restrictions, there were three pollution processes, the longest of which was four days. During the three pollution accumulation processes, the hourly concentration of PM2.5 exceeded 100 μg·m−3, and the maximum concentration of PM2.5 reached 153 μg·m−3 during the pollution accumulation process. There were no pollution processes during the traffic restriction. The maximum concentration of PM2.5 reached 58 μg·m−3 in the pollution accumulation process, and the concentration of PM2.5 remained below 100 μg·m−3, indicating that fine weather was dominant during the period of traffic restriction, but there were only 7 days with blue skies, which may be related to the weather situation at that time. After the traffic restriction, there was a pollution process. Compared with the traffic restriction, the pollution accumulation time and pollution degree increased, especially from 14 September to 18 September. The pollution accumulation time was most serious for 5 days, and the concentration of PM2.5 reached a maximum of 252 μg·m−3 during the pollution process. As can be seen from the maximum concentration of PM2.5 in the pollution accumulation process, the air quality during the traffic restriction was better than that before or after the traffic restriction. In addition, the average concentration of PM2.5 for 15 days before, during, and after the traffic restriction was 66, 18, and 52, respectively. The concentration of PM2.5 during the traffic restriction period was significantly lower than the concentration at other times, which showed that the enhanced control and emission-reduction measures significantly improved Beijing’s air quality.

3.2.2. Weather Background during the Military Parade

In view of the fine weather during the military parade, the weather background during the military parade period from 1 September to 4 September was analyzed by combining the weather chart three times a day and the one-hour wind field once a day. On this account, the influence of the weather situation on air quality in Beijing was investigated, for details, refered to Figure 3, Figure 4, Figure 5 and Figure 6.
At 07:00 on 1 September in 2015, the ground situation chart which can be seen from Figure 3a showed that Beijing was in the lower part of the cold high pressure, which was influenced by the northeast airflow. At altitude, (d) resembled to (c), and Beijing was located on the north side of the North China vortex, which was influenced by the northwest airflow. After that, the vortex continued to move eastward, and the wind speed reached force 3–4 m·s−1 (b), which was beneficial to the spread of pollutants. The main pollutant on that day was O3, with a concentration of 53 μg·m−3, while the concentrations of other pollutants, such as PM2.5, PM10, NO2, and SO2, were 10, 15, 23, and 2 μg·m−3, respectively, and the AQI was 21, which indicated the air quality was excellent.
At 07:00 on 2 September in 2015, Figure 4 provided the ground situation map (a), 500 hPa height map (b), 850 hPa height map (c) and automatic ground observation of 1 h wind field, respectively. Among of them, (a) showed that the North China Vortex continues to move eastward, the west was controlled by Hetao high pressure, the east was controlled by low pressure, and all were influenced by northwest airflow. (c) showed that the eastern part of mainland China was mainly influenced by the northwest airflow behind the cold trough, Beijing was located behind the trough, and the wind speed was 2–4 m·s−1 according to (b). (d) showed that Beijing was in the front of the high-pressure trough and the rear of the low-pressure trough. Under the influence of the northwest airflow, the particulate matter that accumulated in the air could be removed, and the air quality in the whole of North China was improved. The main pollutant was O3, and other pollutants were lower. Finally, the AQI was 25. These all indicated the air quality was excellent, which also laid the foundation for the subsequent “Military Parade blue”.
Figure 5 gived the ground situation map (a), 500 hPa height map (b), 850 hPa height map (c) and automatic ground observation of 1 h wind field at 07:00 on 3 September in 2015, respectively. (a) showed that the western part of Mainland China was controlled by Hetao high pressure, while the eastern part was controlled by low pressure. Beijing was in the front of the high center, affected by the northerly airflow, and the wind speed was maintained at force 1–2 m·s−1 based on (b). The (d) showed that Beijing was in the front of the high-pressure trough and the back of the low-pressure trough, affected by the northerly airflow. (c) showed that North China was behind the cold trough, and “Military Parade blue” appeared in Beijing. Similar to the previous two days, O3 was still the main pollutant, and the concentration increased to 81 μg·m−3. Additionally, the concentration of PM10 increased slightly. The AQI was 36, and the air quality was still excellent, which may be related to the season at that time in Beijing.
Figure 6a showed that the western part of Northern China was controlled by Mongolian low pressure and the eastern part was by high pressure. As could be seen from (c), the entirety of mainland China lied behind the cold trough, mainly by the west airflow and a weak warm advection eastward. Due to the influence of southwest airflow, the water vapor in Beijing was increasing. In addition, on account of the existence of an inversion layer, the pollution diffusion condition became worse, and the pollutants’ concentration increased slightly. Among them, the concentration of PM10 increased from 31 μg·m−3 to 33 μg·m−3, which was the main pollutant on that day. NO2 and PM2.5 increased to 33 μg·m−3 and 53 μg·m−3, respectively. AQI also increased from 36 to 73, while only O3 decreased slightly compared with yesterday. These all indicated that the weather situation had a great impact on air quality [16].
It could be seen from the above analysis that due to the influence of the strong cold high-pressure system during the Military Parade, Beijing was in the front or lower part of the high-pressure system. Additionally, the weather situation was conducive to the diffusion of pollutants under the influence of north or northeast winds.

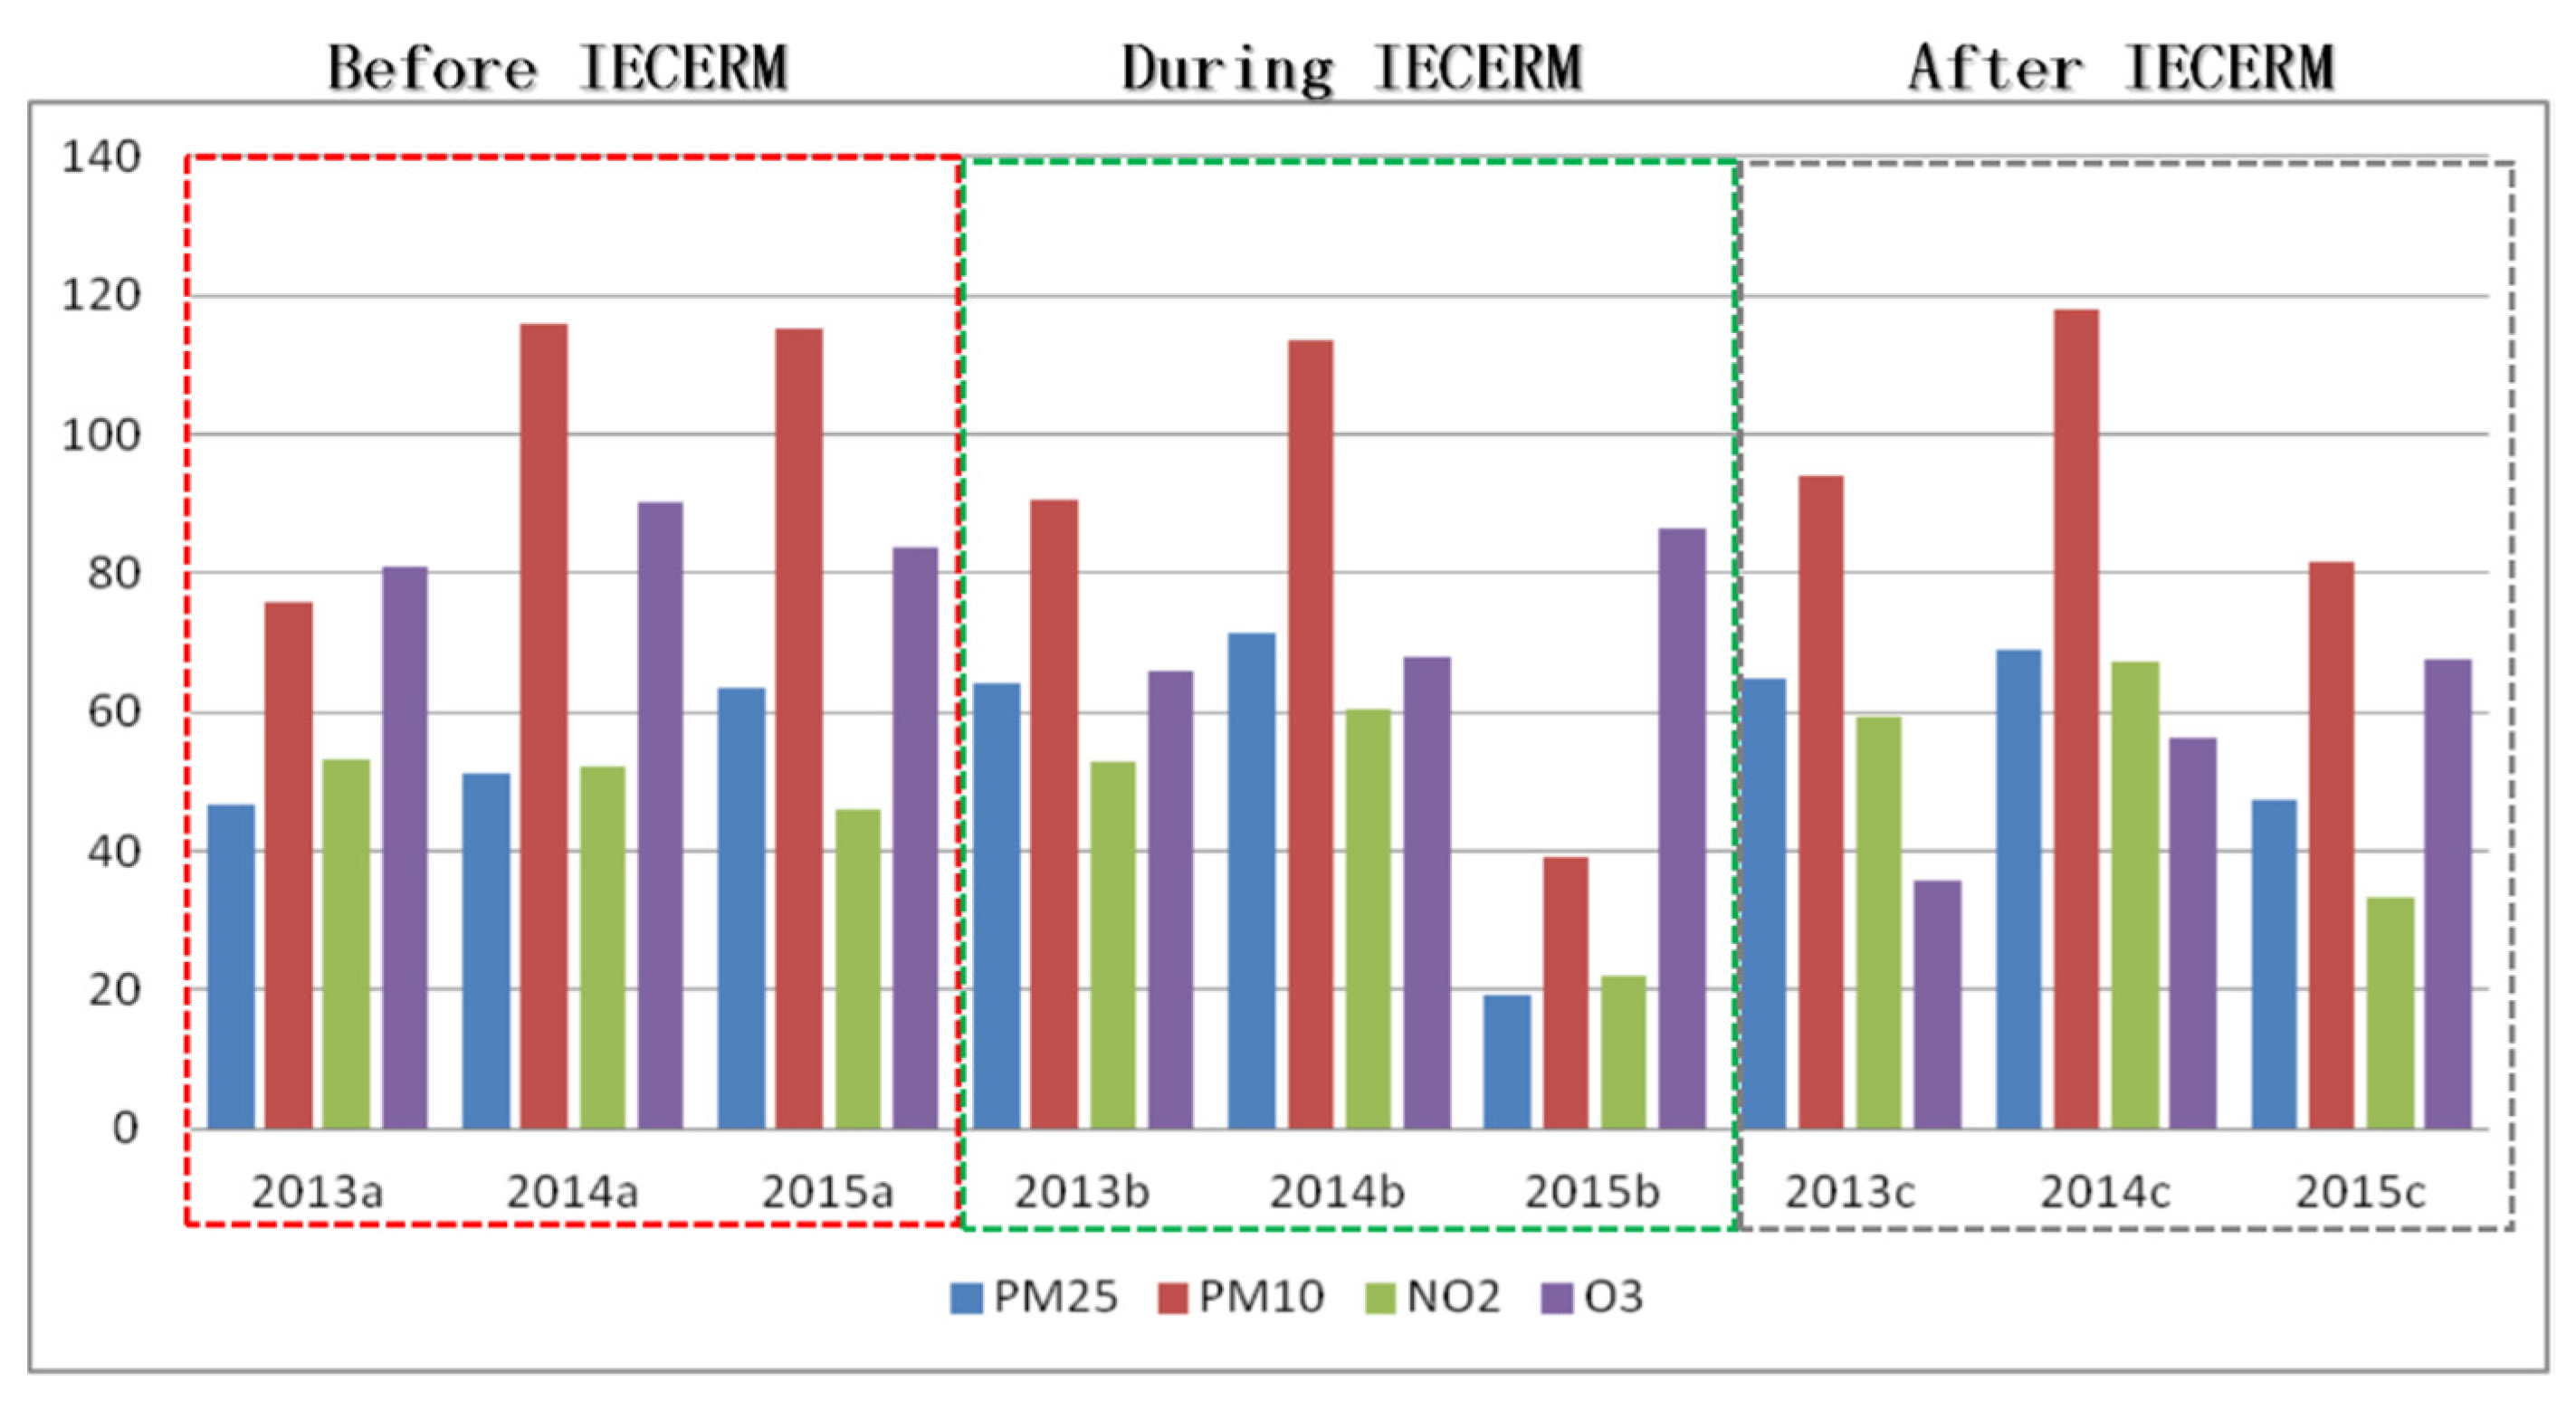
3.3. Comparative Analysis of Beijing’s Air Quality before, during, and after the IECERM for the Military Parade

Table 2 and Figure 7 show the changes in various pollutants in the monitoring station of the Olympic Sports Center and the comparison of various pollutants before, during, and after the traffic restriction in 2013, 2014, and 2015, respectively. It can be seen that during the IECERM of the 2015 Military Parade, the concentration of PM2.5, PM10, and NO2, significantly decreased, among which the concentration of PM10 decreased the most, from 109 μg·m−3 to 34 μg·m−3, and the concentration of PM2.5 decreased by 72.73%. Combined with the changes before and after the implementation, it could be seen that the concentration of PM10 and PM2.5 increased after the implementation of the emission-reduction measures, indicating that enhanced control and emission-reduction measures greatly contribute to the emission reduction in particulate matter. The concentration of NO2 decreased by 40.82% according to the comparison of during and before the implementation; however, the concentration increased by 51.67% compared to after implementation. For PM2.5 and PM10, after the implementation changed to greater than before the implementation, which may be related to a large amount pollutants’ exhaust after the implementation. The concentration of O3 had been decreasing at any implementation moment, which may be related to the current season in Beijing. In addition, the concentration of SO2 changed little before, during, and after the implementation of the measures and remained at a low concentration level. Compared with the concentration of various pollutants in the same period of 2013 and 2014, it was found that the concentration of various pollutants in the early period of 2015 had not changed a lot, among which PM2.5 and PM10 increased, while NO2 decreased slightly. During and after the implementation of measures, except for O3, PM2.5, PM10, and NO2 concentrations were lower than those in 2013 and 2014, indicating that IECREM had improved Beijing’s air quality to some extent.

3.4. Evolution Analysis of Air Quality during the Same Period of Military Parade from 2013 to 2015

Figure 8 shows the evolution chart of the daily mean PM2.5 concentration in the monitoring station of the Beijing Olympic Sports Center from 2013 to 2015. It could be seen that the number of days with an average daily concentration below 150 μg·m−3 in 2015 was less than that in 2014 and 2013. Although the average daily concentration had exceeded the standard in 2015 and even exceeded 500 μg·m−3 in several days, most of the days were decreasing, indicating that the air quality in Beijing was improving year by year. The average daily concentration during the implementation of enhanced control and emission-reduction measures during APEC in 2014 and the 2015 Military Parade was compared with the same period in 2013, and it was found that although the average daily concentration during the 2014 APEC and 2015 Military Parade was below 100 μg·m−3, most of the average daily concentrations during the military parade were below 50 μg·m−3, which is significantly lower than the average daily concentration during the APEC military parade, indicating that the emission reduction effect during the military parade was better, which may be related to the weather situation at that time. In the same period as the parade in 2014 and 2013 or the same period as APEC in 2013 and 2015, the average daily concentration of the parade was more than 100 μg·m−3, especially in the same period as APEC in 2013 and 2015. The average daily concentration on some days was more than 300 μg·m−3. It showed that enhanced control and emission-reduction measures greatly contributed to the reduction in PM2.5. In addition, after entering autumn and winter in 2015, the PM2.5 concentration reached its peak, and the average daily concentration even reached 500 μg·m−3 on some days, indicating that Beijing’s air pollution sources were complex [6], and air quality assurance measures still need to be enhanced.
As can be seen from Table 3, the effective samples from 2013 to 2015 were 344, 362, and 360 days, respectively, and the three-year mean valid sample was 355 days, accounting for 97.3% in the whole year. The annual average of AQI in 2013, 2014, and the three-year period was 88.2, 90.53, and 87.49, respectively, which were all higher than 83.75 in 2015. The average AQI in 2015 during the Military Parade with the IECERM was only 19.27, far less than the average of the other two years and the three-year period. In addition, the enhanced control and emission-reduction measures were implemented during APEC in 2014; however, the annual average AQI in 2014 was higher than the annual average in 2013 and the three-year period, which may be related to the worse weather situation in 2014. The annual average AQI in the three-year period was 87.49. For the purpose of achieving the goal of GB-3095-2012 s-level standard and first-level standard, the annual average of AQI should be reduced by 60.00% and 82.46%, respectively. The average of the normal year is the average of 2013 and 2014. The average of the normal year during the Military Parade was 64.63, which was reduced by 70.40% compared with the average AQI during the Military Parade. It had achieved the goal of GB-3095-2012 level-2 standard, which was still some distance from the level-1 standard. All these indicated that the enhanced control and emission-reduction measures had made a certain contribution to the improvement of Beijing’s air quality, but to achieve the goal of better annual air quality, all parties still needed to coordinate control and joint efforts.
To compare the changes in the Air Quality Index for the same period of three years during the Military Parade in Beijing, Table 4 and Table 5 provide the days with their pollution level and the average value of AQI for the three years before, during, and after the IECERM, respectively, i.e., before the IECERM (5 August to 19 August), during the IECERM (20 August to 3 September), and after the IECERM (4 September to 18 September). It could be seen that the number of good days during the Military Parade in 2015 was 35 days (Table 4), accounting for 77.78% of the effective days, higher than 66.67% and 68.89% in 2013 and 2014, respectively. The number of days with mild and moderate pollution was nine days, less than fourteen and thirteen days in 2013 and 2014, respectively. There was one day of heavy pollution in 2013 and 2014 and none in 2015. According to the average value of AQI, except for mild pollution (AQI between 76 and 115), the average value of AQI in other intervals in 2015 was lower than the average value of AQI in 2013 and 2014. In addition, Table 5 showed the days’ pollution levels and the average AQI for the same period in three years during the IECERM. It was found the days in 2015 were all fine which have implemented the measures, with twelve days of excellent and three days of good. In 2013 and 2014, the number of fine days without measures was 11 and 8, accounting for 73.33% and 53.33%, respectively. The results suggested that the IECERM contributes significantly to the improvement of air quality in Beijing [30].

4. Conclusions

(1) Seven provinces and cities implemented the emission-reduction measures for air quality in a union. Emission-reduction measures, such as vehicle restrictions, enterprise suspension, production restriction, and construction site suspension, were put in place. As a result, the concentration of PM2.5 at 11 state-controlled air quality monitoring stations in Beijing dropped by an average of about 41 percent. Besides the average concentration of SO2, NO2 and PM10 reached the lowest levels in the history of monitoring, which made Beijing’s air quality excellent in a short time. It suggested that the enhanced emission-reduction measures had made a significant contribution to the improvement of local air quality in Beijing.
(2) During the 2015 Military Parade, Beijing was in the front or lower part of the high-pressure system. Due to the strong effect of north or northeast winds, the weather situation was conducive to the diffusion of pollutants. Before the implementation, Beijing was affected by the southwest airflow, and the adverse atmospheric diffusion conditions had caused the accumulation of pollutants in Beijing. After the implementation, owing to the adverse temperature layer, the pollution diffusion conditions were poor, and the pollutant concentration rose slightly, in which PM10 was increased from 31 μg·m−3 increased to 33 μg·m−3 compared with yesterday, NO2 and PM2.5 increased to 33 μg·m−3 and 53 μg·m−3, respectively. O3 decreased, and AQI increased from 36 to 73. The air quality changed from excellent to good. Thus, it can be seen that the weather situation had a great impact on air quality.
(3) During the implementation, PM2.5, PM10, NO2, and other pollutants decreased significantly, of which the concentration of PM10 decreased the most, from 109 μg·m−3 down to 34 μg·m−3, and the concentration of PM2.5 decreased by 72.73%. According to the changes before and during the implementation and after the implementation, the concentration of PM10 and PM2.5 increased after the implementation of the emission-reduction measures, indicating that the enhanced control measures have made a great contribution to the emission reduction in particles.
(4) The number of good days before, during, and after the Military Parade in 2015 was 35, accounting for 77.78% of the effective days, higher than 66.67% and 68.89% in 2013 and 2014. The number of days with mild pollution was 9, less than 14 and 13 days in 2013 and 2014, respectively. There was one day of heavy pollution in 2013 and 2014, respectively. In 2015, there were no pollution days. In addition, the annual average of AQI in the three years is 87.49. In order to achieve the objectives of class II standard and class I standard in the GB-3095-2012 ambient air quality standard, the annual average AQI needed to be reduced by 60.00% and 82.46%, respectively. The average value of the normal year was the average value of 2013 and 2014. The average value of the normal year during the military parade is 64.63, which was 70.40% lower than the average value of AQI during the military parade. The goal of reaching the secondary standard of GB-3095-2012 was achieved, and there is still a long way to go from the primary standard. In a few words, the enhanced control and emission-reduction measures had made a certain contribution to the improvement of air quality in Beijing. However, in order to achieve the goal of better air quality throughout the year, all parties still need to coordinate control and make joint efforts.

Author Contributions

Conceptualization, M.C. and B.H.; formal analysis, M.D.; investigation, B.H.; resources, Q.G.; data curation, B.H. and Z.M.; writing—original draft preparation, B.H.; writing—review and editing, B.H.; funding acquisition, M.C. All authors have read and agreed to the published version of the manuscript.

Funding

This research was funded by the National Natural Science Foundation of China (grant number 21976094, 22176100) and the National Key Research and Development Project 9 (grant number 2018YFC0213802).

Institutional Review Board Statement

Not applicable.

Informed Consent Statement

Not applicable.

Data Availability Statement

Not applicable.

Acknowledgments

This study was finally accomplished with the assistance of co-authors. All diagrams in the manuscript, whether drawn by yourself or another author, are permitted. In a word, thanks to the cooperation units for their help in data collection and processing, at the same time, also express sincere thanks to the co-authors for their careful guidance in the chart description and article written.

Conflicts of Interest

The authors declare no conflict of interest.

References

  1. Li, L.; Liu, Q.; Li, B. Assessment of air quality benefits from control measures during Nanjing Youth Olympic Games. Res. Environ. Sci. 2016, 29, 175–182. [Google Scholar]
  2. Wang, H.; Li, Y.; Gao, J.; Wang, S.L.; Chai, F.H.; Wei, J.L. Characteristics of air pollution and evaluation of the effects of air quality assurance measures in Shijiazhuang City during the 2014 APEC Meeting. Res. Environ. Sci. 2016, 29, 164–174. [Google Scholar] [CrossRef] [PubMed] [Green Version]
  3. Lee, B.K.; Jun, N.Y.; Lee, H.K. Analysis of impacts on urban air quality by restricting the operation of passenger vehicles during Asian Game events in BUSAN, Korea. Atmos. Environ. 2005, 39, 2323–2338. [Google Scholar] [CrossRef]
  4. Beig, G.; Chate, D.M.; Ghude, S.D.; Mahajan, A.S.; Srinivas, R.; Ali, K.; Sahu, S.K.; Parkhi, N.; Surendran, D.; Trimbake, H.R. Quantifying the effect of air quality control measures during the 2010 commonwealth games at Delhi, India. Atmos. Environ. 2013, 80, 455–463. [Google Scholar] [CrossRef]
  5. Liu, H.; Wang, X.; Zhang, J.; He, K.; Wu, Y.; Xu, J. Emission controls and changes in air quality in Guangzhou during the Asian Games. Atmos. Environ. 2013, 76, 81–93. [Google Scholar] [CrossRef]
  6. Li, W.T.; Gao, Q.X.; Liu, J.R.; Li, L.; Gao, W.K.; Su, B.D. Comparative analysis of air quality improvement in Beijing during APEC. Res. Environ. Sci. 2015, 12, 0250–3301. [Google Scholar]
  7. Zheng, J.; Zhong, L.; Wang, T.; Louie, P.K.; Li, Z. Ground-level ozone in the Pearl River Delta region: Analysis of data from a recently established regional air quality monitoring network. Atmos. Environ. 2010, 44, 814–823. [Google Scholar] [CrossRef]
  8. Xu, X.D.; Zhou, X.J.; Shi, X.H. Spatial structure and scale characteristics of air pollution impacts in urban communities. Chin. Sci. Bull. Ser. D 2006, 35, 1–19. [Google Scholar]
  9. Li, L.J.; Wang, Y.; Zhang, Q. Effect of wheat straw incineration on air quality in Beijing. Chin. Sci. Bull. Ser. D 2008, 38, 232–242. [Google Scholar]
  10. Meng, X.Y.; Yu, Y.; Zhang, Z.F.; Li, G.; Wang, S.; Du, L. Preliminary study on the causes of frequent strong haze in January 2013 in Beijing-Tianjin-Hebei region. Environ. Sci. Technol. 2014, 37, 190–194. [Google Scholar]
  11. Zheng, M.; Salmon, L.G.; Schauer, J.J.; Zeng, L.; Kiang, C.S.; Zhang, Y.; Cass, G.R. Seasonal trends in PM2.5 source contributions in Beijing, China. Atmos. Environ. 2005, 39, 3967–3976. [Google Scholar] [CrossRef]
  12. Zhang, J.; Lu, Y.; Gui, H.; Liu, J.; Du, P.; Li, D.; Wang, J. Variations of PM2.5 pollution and related meteorological factors before and after the 2014 APEC conference in Beijing. Res. Environ. Sci. 2016, 29, 646–653. [Google Scholar]
  13. Li, T.Y.; Deng, X.J.; Fan, S.J.; Wu, D.; Li, F.; Deng, T.; Tan, H.B.; Jiang, D.H. Analysis of air quality and pollution meteorological conditions during Guangzhou Asian Games in 2010. Environ. Sci. 2012, 33, 2932–2938. [Google Scholar]
  14. Yu, Y.Y.; Xie, F.J.; Lu, X.B.; Zhu, Z.F.; Shu, Y. Analysis on the air quality and its cause of Nanjing Asian Youth Conference. Environ. Monit. 2014, 6, 5–9. [Google Scholar]
  15. Chen, M.; Ma, L.M.; Wei, H.P.; Shi, H.; Ma, J.H.; Zhou, G.Q.; Gu, S.Q.; Zhang, G.L. Effects of meteorological conditions on air quality during World Expo in Shanghai. J. Appl. Meteorol. Sci. 2013, 24, 140–150. [Google Scholar] [CrossRef] [Green Version]
  16. Zhang, X.Y.; Sun, J.Y.; Wang, Y.Q.; Li, W.J.; Zhang, Q.; Wang, W.G.; Quan, J.N.; Cao, G.L.; Wang, J.Z.; Yang, Y.Q.; et al. Reflections on the causes and control of haze in China. Chin. Sci. Bull. 2013, 58, 1178–1187. [Google Scholar]
  17. Guo, X.R.; Cheng, S.Y.; Chen, D.S.; Zhou, Y.; Wang, H.Y. Estimation of economic costs of particulate air pollution from road transport in China. Atmos. Environ. 2010, 44, 3369–3377. [Google Scholar] [CrossRef]
  18. Cao, W.H.; Liang, X.D.; Li, Q.C. Analysis of stage characteristics and influencing factors of a persistent haze process in Beijing. Acta Meteorol. Sin. 2013, 71, 940–951. [Google Scholar]
  19. Wang, H.L.; Chen, C.H.; Huang, H.Y.; Wang, Q.; Chen, Y.R.; Huang, C.; Li, L.; Zhang, G.F.; Chen, M.H.; Lou, X.R.; et al. Study on emission intensity and pollution sources of volatile organic compounds in Shanghai during World Expo. Environ. Sci. 2012, 33, 4151–4158. [Google Scholar]
  20. Wu, D.; Liao, B.T.; Wu, X.; Chen, H.Z.; Li, F.; Li, H.Y.; Ai, H. Analysis of haze Weather during Guangzhou Asian Games in 2010. Acta Sci. Circumstantiae 2012, 32, 521–527. [Google Scholar]
  21. Wang, X.; Westerdahl, D.; Chen, L.C.; Wu, Y.; Hao, J.; Pan, X.; Guo, X.; Zhang, K.M. Evaluating the air quality impacts of the 2008 Beijing Olympic Games: On-road emission factors and black carbon profiles. Atmos. Environ. 2009, 43, 4535–4543. [Google Scholar] [CrossRef]
  22. Wang, Y.; Hao, J.; McElroy, M.B.; Munger, J.W.; Ma, H.; Chen, D.; Nielsen, C.P. Air quality during the 2008 Beijing Olympics: Effectiveness of emission restrictions. Atmos. Chem. Phys. 2009, 9, 5237–5251. [Google Scholar] [CrossRef] [Green Version]
  23. Wang, W.; Wang, Y.; Wang, L.; Zhu, B.; Wang, Y. Observation and Study on the air quality at the Olympic Village Station during the Beijing Olympic Games. Res. Environ. Sci. 2010, 23, 48–54. [Google Scholar]
  24. Hu, J.; Cheng, S.Y.; Su, F.Q. Evolution Characteristics and Causes of PM10 Mass Concentration in Beijing During the Olympic Games and Paralympic Games Period. Res. Environ. Sci. 2009, 22, 1395–1402. [Google Scholar]
  25. Querol, X.; Alastuey, A.; Ruiz, C.R.; Artiñano, B.; Hansson, H.C.; Harrison, R.M.; Buringh, E.T.; Ten Brink, H.M.; Lutz, M.; Bruckmann, P.; et al. Speciation and origin of PM10 and PM2.5 in selected European cities. Atmos. Environ. 2004, 38, 6547–6555. [Google Scholar] [CrossRef]
  26. Wu, Q.M.; Zhang, S.J. Analysis of pollution influence factors in a haze weather process. J. Meteorol. Environ. 2010, 33, 12–16. [Google Scholar]
  27. Li, J.; Wang, Z.; Zhuang, G.; Luo, G.; Sun, Y.; Wang, Q. Mixing of Asian mineral dust with anthropogenic pollutants over East Asia: A model case study of a super-dust storm in March 2010. Atmos. Chem. Phys. 2012, 12, 7591–7607. [Google Scholar] [CrossRef] [Green Version]
  28. Yu, H.; Wang, P.C.; Zong, X.M.; Li, X.; Lv, D.R. Satellite monitoring of NO2 column concentration in Beijing during the Olympic Games. Chin. Sci. Bull. 2009, 54, 299–304. [Google Scholar]
  29. Cheng, N.L.; Zhang, D.W.; Li, Y.T.; Chen, T.; Sun, F.; Li, L.; Cheng, B. Characteristics of NOx concentration in Beijing during Athletics Championships and Military Parade in 2015. J. Univ. Chin. Acad. Sci. 2016, 6, 2095–6134. [Google Scholar]
  30. Wang, W.; Li, J.; Zhu, L.L. Simulation Analysis of Pollutant Emission Reduction Contribution in Beijing-Tianjin-Hebei Region and Surrounding Areas during the Military Parade on Sep 3th; Springer Science & Business Media: Berlin/Heidelberg, Germany, 2008. [Google Scholar]
Figure 1. Location of monitoring sites of the Beijing Olympic Sports Center. Notes: The Chinese characters in the left picture is the meaning of Chinese Geographic Names, which also represents its geographical location. The green circle (a), yellow circle (b), blue circle (c), orange circle(d) in the left picture is the meaning of Urban environmental assessment point, Urban cleanliness control point, Area background transfer point, Traffic pollution monitoring point, respectively. And which the number of this points are 23, 1, 6, 5, respectively.
Atmosphere 13 01019 g001
Figure 2. Hourly concentration of PM2.5 in Monitoring sites of Beijing Olympic Sports Center. Notes: The yellow line represents the trends of hourly concentration of PM2.5 when before, during, and after the restriction (from 5 August to 19 September). The y-axis is the concentration of PM2.5, among the unit is μg·m−3. The x-axis is the date when from 5 August to 19 September. The picture shows the daily weather conditions at 07:00 of the monitoring site from 5 August to 19 September.
Atmosphere 13 01019 g002
Figure 3. Maps of the weather and AQI situation at 07:00 on 1 September in 2015. Notes: (a,c,d) shows the map of the surface, 500 hPa height, 850 hPa height, respectively. (b) shows the automatic ground observation of 1 h wind field at 07:00 on 1 September in 2015.
Atmosphere 13 01019 g003
Figure 4. Maps of the weather and AQI situation at 07:00 on 2 September in 2015. Notes: (a,c,d) shows the map of the surface, 500 hPa height, 850 hPa height, respectively. (b) shows the automatic ground observation of 1 h wind field at 07:00 on 2 September in 2015.
Atmosphere 13 01019 g004
Figure 5. Maps of the weather and AQI situation at 07:00 on 3 September in 2015. Notes: (a,c,d) shows the map of the surface, 500 hPa height, 850 hPa height, respectively. (b) shows the automatic ground observation of 1 h wind field at 07:00 on 3 September in 2015.
Atmosphere 13 01019 g005
Figure 6. Maps of the weather and AQI situation at 08:00 on 4 September in 2015. Notes: (a,c,d) shows the map of the surface, 500 hPa height, 850 hPa height, respectively. (b) shows the automatic ground observation of 1 h wind field at 08:00 on 4 September in 2015.
Atmosphere 13 01019 g006
Figure 7. The change trend of pollutants over the same period when before, during, and after the IECERM from 2013 to 2015. Notes: The unit on the y-axis is μg·m−3.
Atmosphere 13 01019 g007
Figure 8. Daily mean value of PM2.5 in monitoring sites of the Olympic Center from 2013 to 2015. Notes: The unit on the y-axis is μg·m−3. The vertical green line and red line show the comparison over the same period when the 2015 Military Parade and 2014 APEC for three years from 2013 to 2015, respectively. The transverse red line shows the concentration of PM2.5 is 115 μg·m−3.
Atmosphere 13 01019 g008
Table 1. Arrangement of single and double limit line time for Beijing motor vehicles.
SundayMondayTuesdayWednesdayThursdayFridaySaturday
None traffic
restriction
1 August
None traffic restriction
2nd
5 and 0 traffic restriction
3rd
1 and 8 traffic restriction
4th
2 and 7 traffic restriction
5th
3 and 6 traffic restriction
6th
4 and 0 traffic restriction
7th
None traffic
restriction
8th
None traffic restriction
9th
5 and 0 traffic restriction
10th
1 and 8 traffic restriction
11th
2 and 7 traffic restriction
12th
3 and 6 traffic restriction
13th
4 and 0 traffic restriction
14th
None traffic
restriction
15th
None traffic restriction
16th
5 and 0 traffic restriction
17th
1 and 8 traffic restriction
18th
2 and 7 traffic restriction
19th
Double number trave
20th
Single number travel
21st
Double number travel
22nd
Single number travel
23rd
Double number travel
24th
Single number travel
25th
Double number travel
26th
Single number travel
27th
Double number travel
28th
Single number travel
29th
Double number travel
30th
Single number travel
31st
Single number travel
Sep.1st
Double number travel
2nd
Single number travel
3rd
Holiday
4 and 0 traffic restriction
4th
Holiday
None traffic
restriction
5th
Holiday
None traffic restriction
6th
Working
5 and 0 traffic restriction
7th
1 and 8 traffic restriction
8th
2 and 7 traffic restriction
9th
3 and 6 traffic restriction
10th
4 and 0 traffic restriction
11th
None traffic
restriction
12th
Table 2. Changes in pollutants in the Olympic Sports Center monitoring station.
Various Pollutants
Concentration
(μg·m−3)
Before the
Implementation
During the
Implementation
After the
Implementation
Changes of before and during Implementation
(%)
Changes in during and after Implementation
(%)
PM2.566185272.7365.38
PM10109348068.8157.5
NO249296040.8251.67
SO262566.6760
O3113797230.09−9.72
Table 3. Changes in AQI over the same period from 2013 to 2015 during the Military Parade.
DataEffective SampleAQI Annual AverageAQI Average
during the Military Parade
201334488.2058.20
201436290.5371.06
201536083.7519.27
Three-year average35587.4949.51
Table 4. Changes in AQI over the same period from 2013 to 2015 before, during, and after the IECERM.
Before, during, and
after IECERM
AQI
201320142015
Effective
Sample
AverageEffective
Sample
AverageEffective
Sample
Average
<351121.191223.502316.20
36–751956.431955.791248.65
76–115991.88991.65695.78
116–1505128.604134.863124.74
151–2501163.731157.38
Table 5. Changes in AQI over the same period from 2013 to 2015 during the IECERM.
During IECERM
AQI
201320142015
Effective
Sample
AverageEffective
Sample
AverageEffective
Sample
Average
<35421.54521.521214.78
36–75753.56360.60337.20
76–115396.64494.42
116–1501121.923132.96
151–250
Publisher’s Note: MDPI stays neutral with regard to jurisdictional claims in published maps and institutional affiliations.

