Article

Atmospheric Conditions for Uplift and Dust Transport in the Latitudinal 10° North–20° North Band in Africa

by
Abdoulaye Bouya Diop
1,†,
Malick Wade
1,†,
Abdoulaye Sy
1,2,†,
Abdoul Karim Mbodji
1,†,
Abdou Karim Farota
1,†,
El hadji Deme
1,3,†,
Babacar Niang
1,†,
Bouya Diop
1,*,†,
Amadou Thierno Gaye
4,† and
Aboubakary Diakhaby
1,†
1
LSAOMED, Applied Science and Technology Training and Research Unit, Gaston University, BP 234, Saint-Louis 32000, Senegal
2
CERDI, Research Unit Associated with the Research Institute for Development, University of Clermont Auvergne, 63000 Clermont-Ferrand, France
3
LERSTAD, Applied Science and Technology Training and Research Unit, Gaston University, BP 234, Saint-Louis 32000, Senegal
4
LPAOSF, Polytechnic School, Cheikh Anta Diop University, BP 5085, Dakar 10700, Senegal
*
Author to whom correspondence should be addressed.
These authors contributed equally to this work.
Atmosphere 2022, 13(7), 1083; https://doi.org/10.3390/atmos13071083
Submission received: 23 May 2022 / Revised: 28 June 2022 / Accepted: 1 July 2022 / Published: 8 July 2022
(This article belongs to the Special Issue Statistical Methods in Atmospheric Research)

Abstract

:
Desert aerosols suspended in the atmosphere are a very marked fact in West Africa with estimates of 400 to 1000 million tons produced annually and concentrations exceeding 50 µg·m³ in Burkina. In Bamako, the daily dust concentration can go up to reach 504 µg/m³. The Sahara and the Sahel are recognized as the primary desert aerosol producing regions. Source areas continue to be discovered as the desert advances. Previous studies have mainly focused on the spatial and temporal variability of aerosols. The current question is: What makes an area a source of dust emission? Our study brings together all the climatic parameters of the 10–20 band, as well as the soil types and their characteristics; it reveals 4 soils characteristic of fine sandy semi-arid soils in Chad. The Ouadaï plateau in Chad was identified as a source area for dust emissions. We noted for JFM (January, February, March) that the strongest wind intensities were located mainly towards Chad for average rmaximum temperatures around 34.7 °C. The statistical study reveals a correlation of 66.8% between direct and indirect links between the climatic factors of the 10–20 band and the source area. The presence of vortexes throughout the year and a vertical wind profile that is among the strongest in the 10–20 band, this gradient is strongly localized in the grid “10° North, 20° North and 20° East, 30° East” next to the Kapka massif. The study shows that the AEJ (African Easterly Jet) profile, which is a strong wind, associated with the harmattan circulation, allows the transport of aerosols from Ouadaï to the West African coast. In Senegal, a significant deposition was observed.

1. Introduction

The presence of desert aerosols suspended in the atmosphere is a very prominent fact in West Africa. The emission processes of these aerosols result from complex interactions between wind speed and soil roughness [1]. The Sahara and the Sahel are recognized as the first regions producing desert aerosols [2,3,4,5]. Several types of instruments have been used over time to quantify and identify the source areas [6,7,8,9]. Correlations between wind, temperature and precipitation during the African monsoon season have been established [10]. However, there are other parameters that can have a significant direct or indirect influence on the lifting, transport and deposition of fine particles in the Sahelian zone. In the literature, the focus has been mainly on the spatial and temporal variability of aerosols. Authors such as [11], have summarized the source areas of dust emissions. A large majority of them are located in the 10°–20° North African band (hereafter 10–20 band). Source zones continue to be discovered with the advance of the desert and the climatic changes which result in a warming of the planet. We have studied all the climate parameters available in the 10–20 band in relation with this issue. These parameters include the volumetric water level of the soil which plays a role on evaporation as well as the type of soil, the evapotranspiration, which is a factor associated with the transpiration of the vegetation cover, and the geopotential at 1000 hPa, which is the gravitational potential at a point of the earth. These parameters associated with the vertical velocity, the vorticity at 1000 hPa and the winds at 10 m will be the catalysts of the wind erosion of the soils at the base of the uplift of the particles. The study also includes total precipitation and temperature at 2 m, which in turn will play an essential role on the soil volumetric water level and soil type.
The objective of this work is to make a climatic and statistical study of all the parameters having a direct or indirect link with the Mechanism of Uprising, Transport, and Deposition of Aerosols (MSTDA). The relevance of this study lies in the fact that beyond establishing a source zone of dust emission, we show what the factors are at the origin of this emission beyond the simple wind erosion of the soil.

2. Materials and Methods

Our study area is the scene of climatic instability, caused by the superposition of four types of climate. These are the Saharan, Sahelian, Sahelo-Sudanese, Sudano-Sahelian climates, as well as forest areas. This is the band of 10° North and 20° North latitudes (10–20 band) bounded by the African continent. The Sahelian zone is one of the largest and most important dust emission regions [11]. Emissions that can be related to parameters are evaporation, evapotranspiration, geopotential at 1000 hpa, total precipitation, soil type, temperature at 2 m, wind at 10 m, vertical velocity, soil volumetric water, vorticity at 1000 hpa and specific humidity. Parameters are directly extracted from the ERA5 platform, which is the fifth generation of ECMWF reanalysis (European Centre for Medium-Range Weather Forecasts) for global climate and weather for the last 4–7 decades, headquarters: Reading, UK. Currently, data are available from 1979 onwards. ERA5 (European Environment Agency) Copenhague, Danemark replaces the ERA-Interim reanalysis [12,13]. The data were regridded to a regular lat–lon grid of 0.25 degrees for the reanalysis and 0.5 degrees for the uncertainty estimation. There are four main subsets: hourly and monthly products, both on pressure levels (upper air fields) and single levels (atmospheric, ocean wave and land surface quantities).

3. Results

In order to understand the MTSDA in the Sahelian 10–20 band, the parameters directly and indirectly related to AUVI (ultraviolet index aerosol) and dust deposition have been studied in this section. The study of these parameters was conducted over a period from 1978 to 2008. Figure 1 shows the spatial distribution of wind intensity and direction. For JFM (January, February, March), the strongest wind intensities are located mainly towards Sudan, Ethiopia and Chad. The FIT (intertropical front) [14] is very easily recognizable in this figure. It is represented by the light band. This is consistent with the work of [15,16,17]. The equations explaining the atmospheric dynamics with the geostrophic wind allow a quantitative approach. In the case where the Rossby number (which is a dimensionless number used in fluid dynamics. It represents the relationship between the forces of inertia and the forces due to rotation which characterize the movement of a fluid in a rotating frame) is very small, much less than 1, we are close to a geostrophic equilibrium between the Coriolis and pressure forces (Equation (1)):
v g = 1 ρ f k ^ g r a d z ( p ) = g f k ^ g r a d p ( z )  
where v g is the geostrophic wind, ρ is the air density, f is the Coriolis parameter, p is the pressure at given altitude z, k ^ is the orientation of z taken positive upward.
The Coriolis force is orthogonal to the velocity vector, and opposite to the pressure force, the geostrophic wind is itself orthogonal to the pressure gradient and therefore parallel to the isobars. In the northern hemisphere, the low pressures are to the left of the wind (Buys Ballot’s Law), to the right in the southern hemisphere. The geostrophic wind speed is proportional to the pressure (or z) gradient. When the Rossby number is large (i.e., small scale), the wind is accelerated from high to low pressure. The speed will be limited at the surface by friction.
Figure 2 shows the temperature distribution at two meters from the ground in the 10–20 band. It can be seen that the temperatures range from 17 °C to 34.7 °C. From January to March, the average monthly temperature from 1979 to 2008 is around 17 °C. From April onwards, we note average maximum temperatures around 34.7 °C. These observations are close to those of the studies of [18,19].
Air temperature is an input to most surface temperature models. Often air temperature measurements are available. Nevertheless, to make predictions, it is useful, even necessary, to have simple and reliable models, as these make it possible to limit the input data for the models [20,21,22].
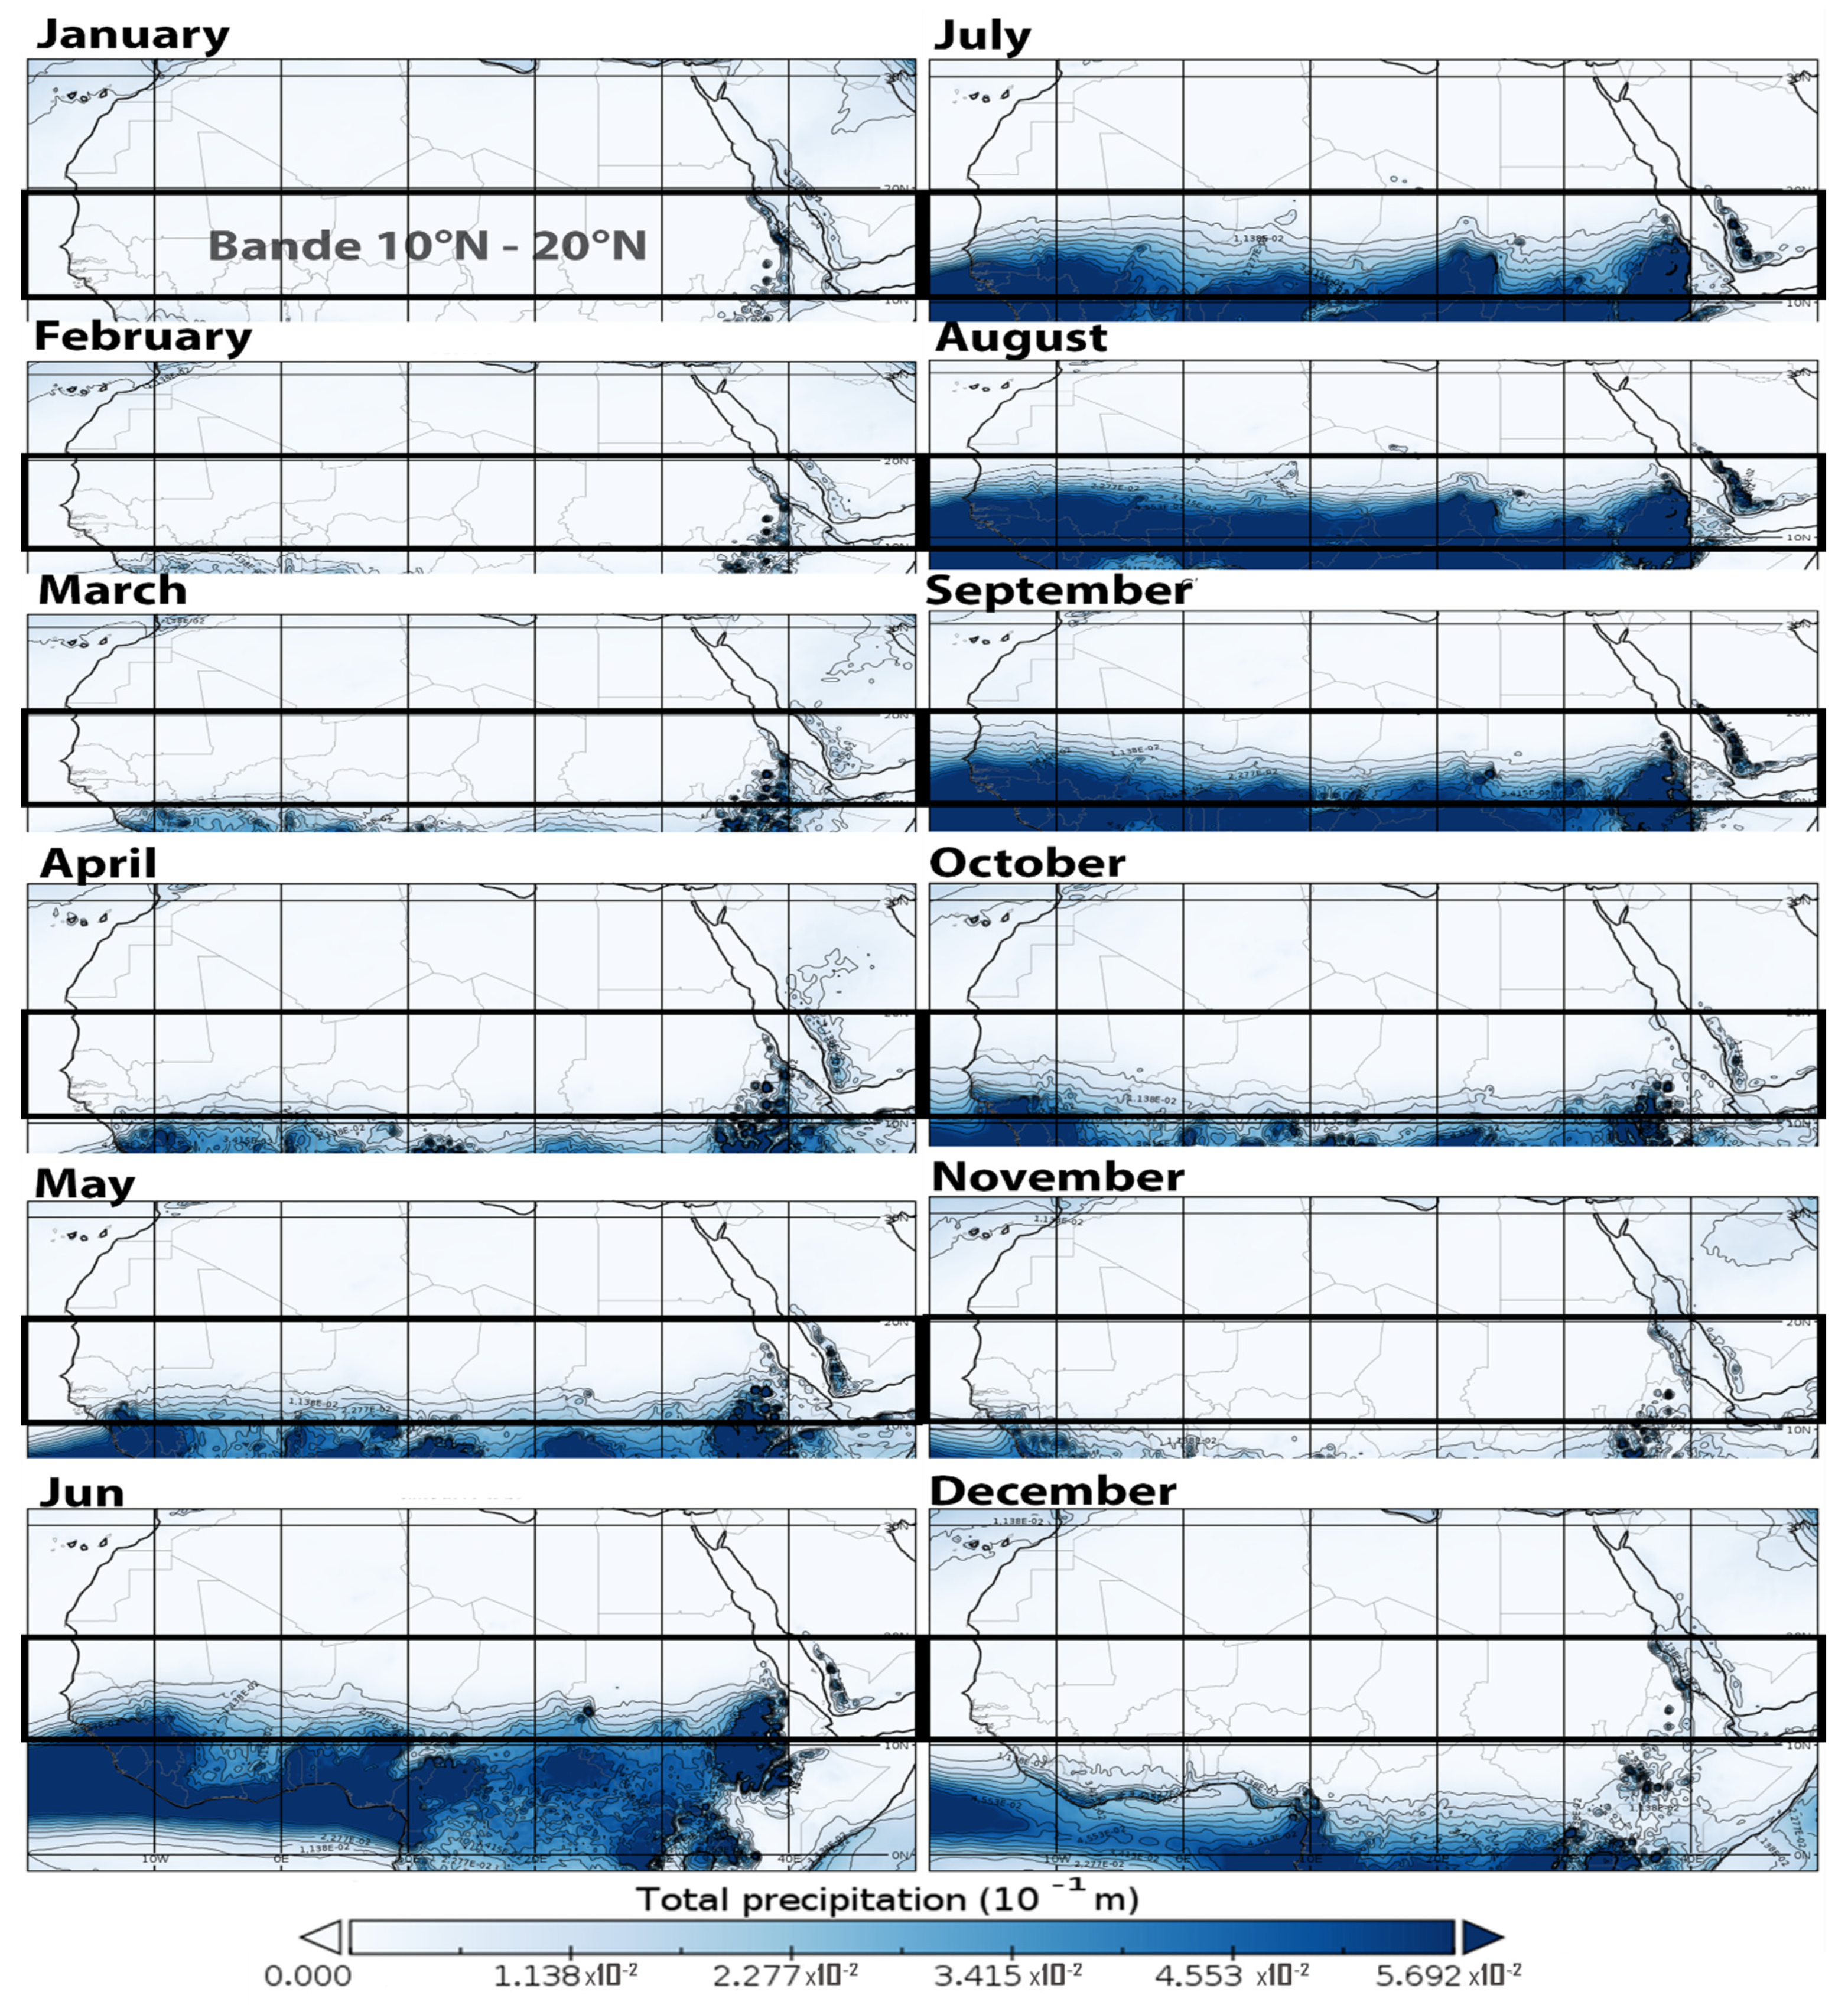
Figure 3 shows that there is almost no rainfall from January to April in the Sahelian zone. A timid start to the rains can be observed from March onwards [23]. The region gradually shifts from the continental trade wind regime to the monsoon regime, thus characterizing the real start of the rains over the Sahel Onset, as also shown in the work of [24,25,26].
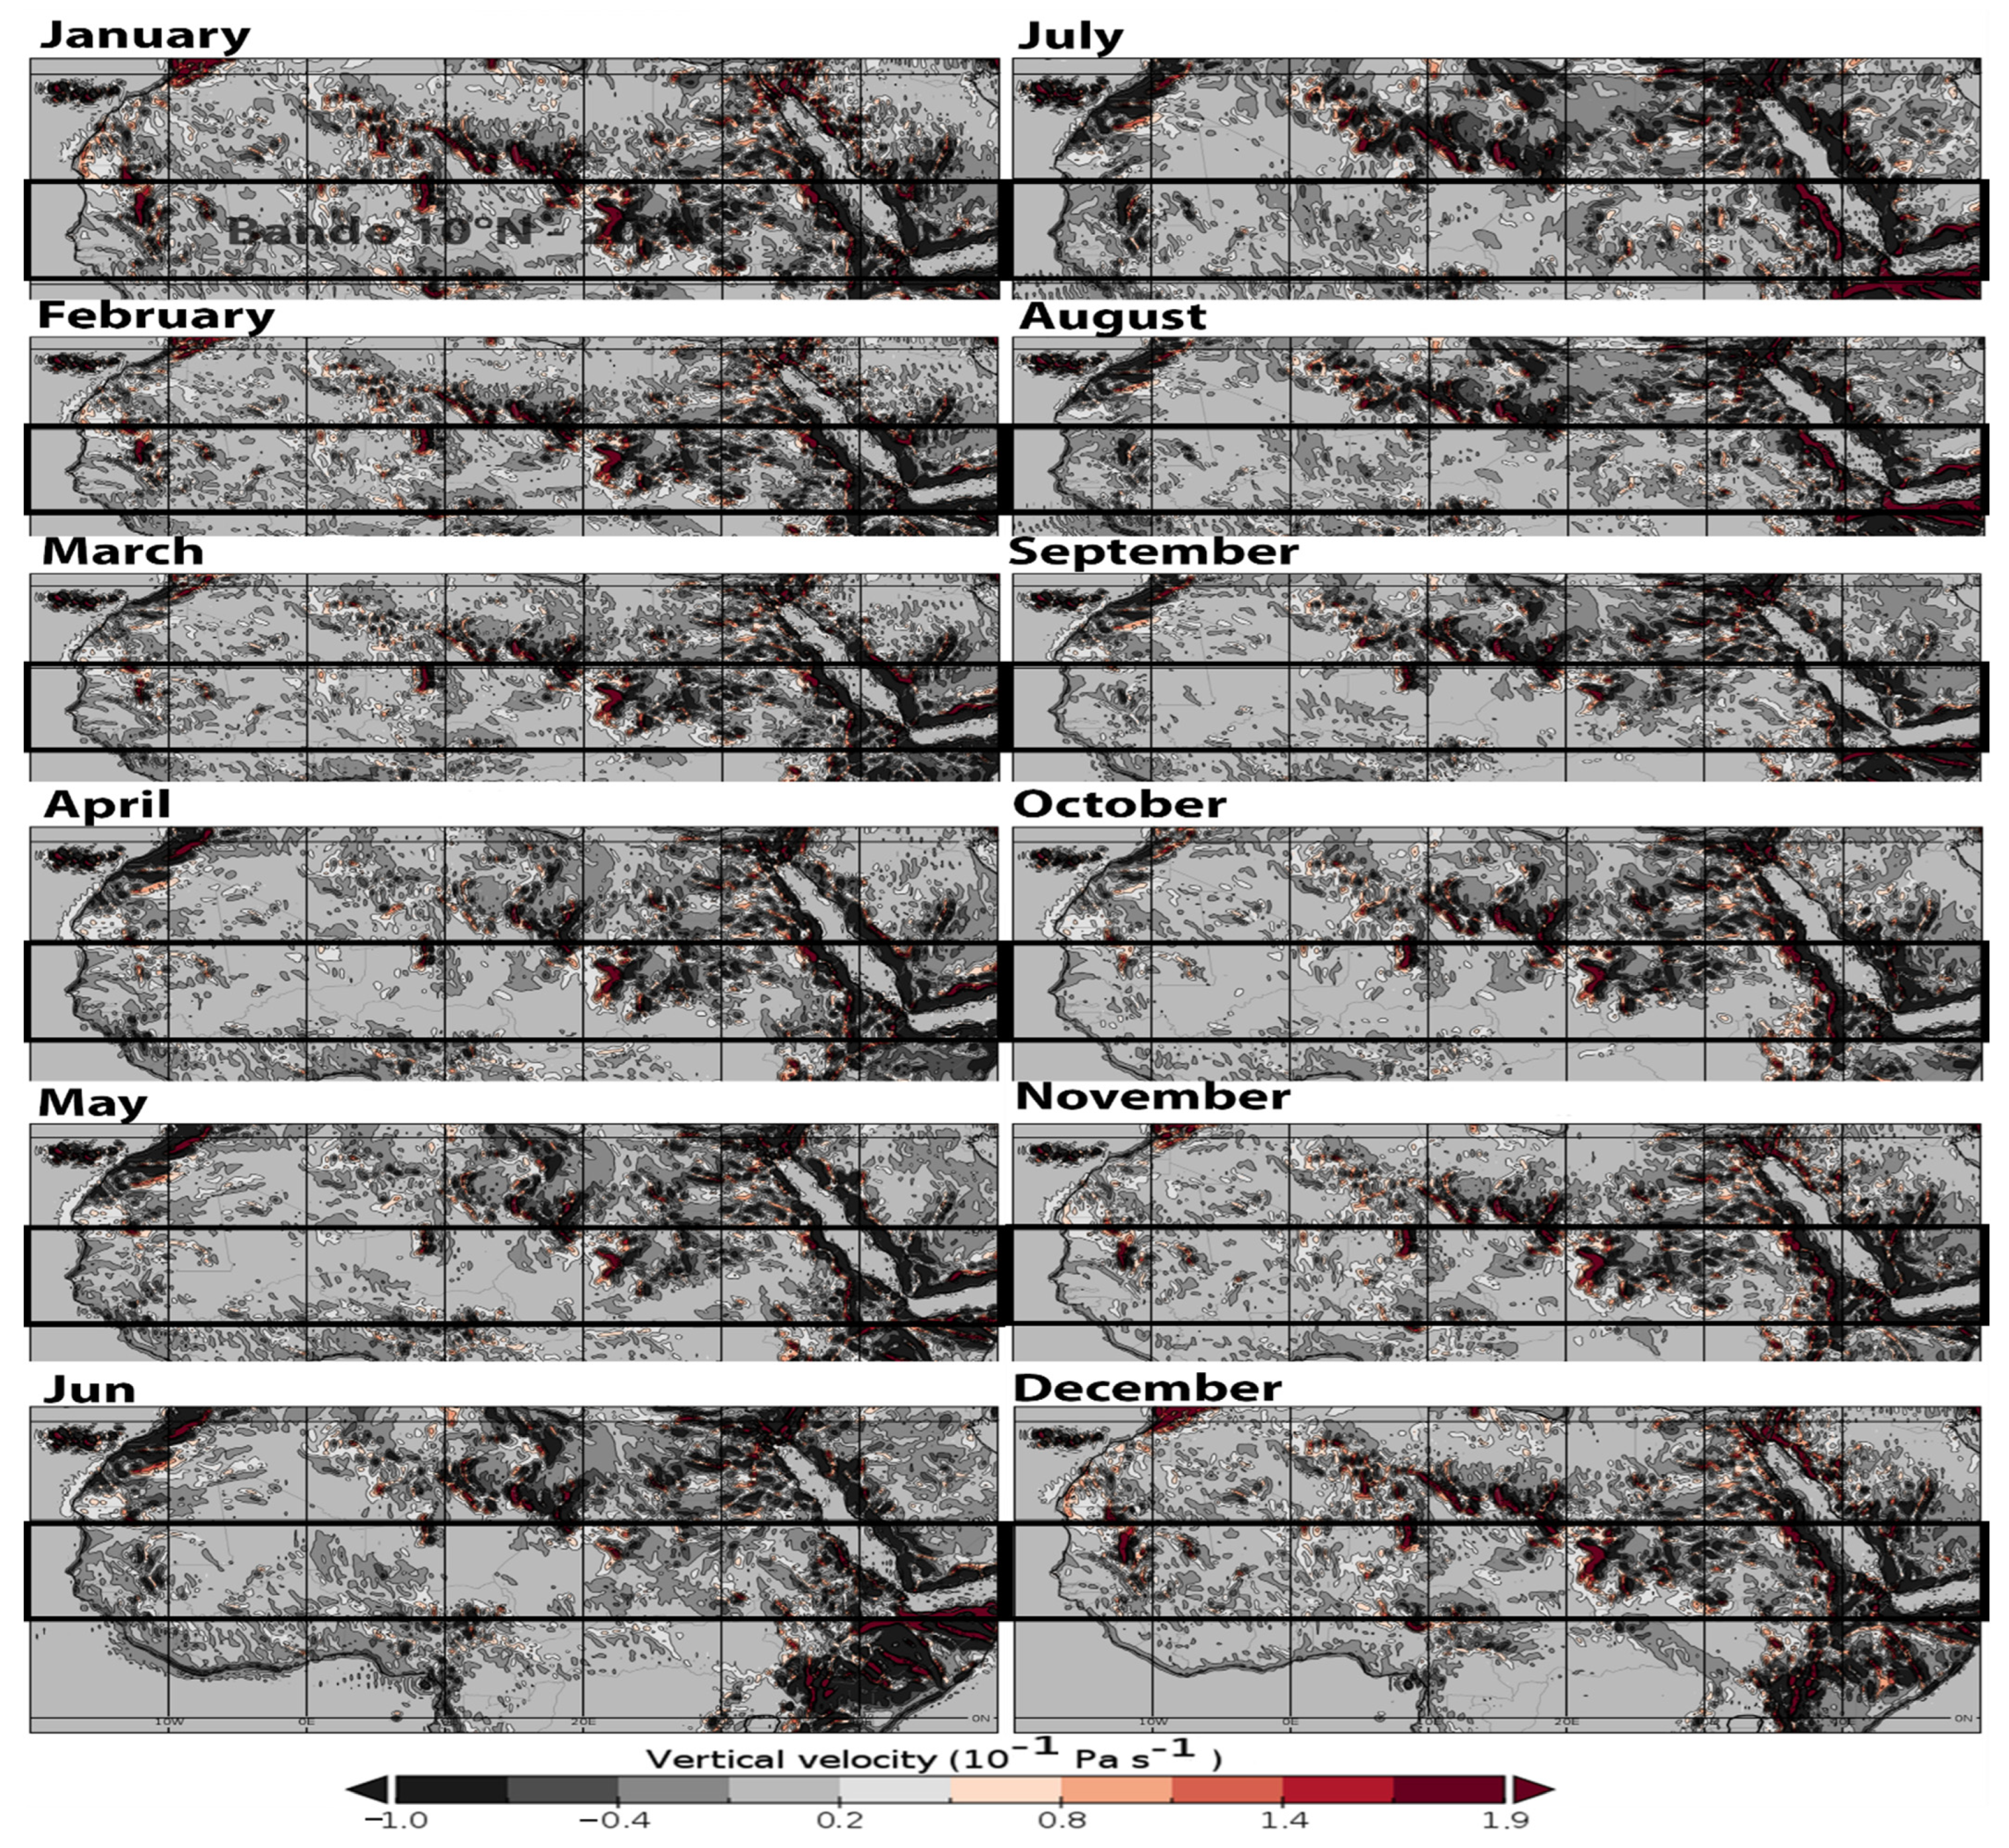
Figure 4 shows the vertical wind speed, also called vertical velocity. From January to March, there is a strong fluctuation of vertical wind gradient. This gradient is strongly localized in the 10–20° North; 20–30° East grid, which in our case covers part of the Bodélé and Banizoumbou depression. Towards the month of June, we note a strong attenuation of this gradient with a tendency of the unidirectional downward profile [27,28].
The difference between the geostrophic thermal wind at pressure p1 and p2 can be written as:
v g 2 v g 1 = R f l n p 1 p 2 k ^ g r a d T 1 2  
Here, pressure p2 is conventionally located at a higher altitude p1. In the Northern Hemisphere, the thermal wind is directed parallel to the isotherms, with the high temperatures to the right.
Figure 5 shows the vortex distribution at 1000 hPa. In the 10–20 band, there is a significant presence of vortices, a clear decrease from March onwards. From January to March, a very visible pattern formed by a succession of vortices in the Sahelian band is observed.
The vorticity equation is given by the following equation:
d ω d t = ( ω ) v ω v + 1 ρ 2 ρ × p  
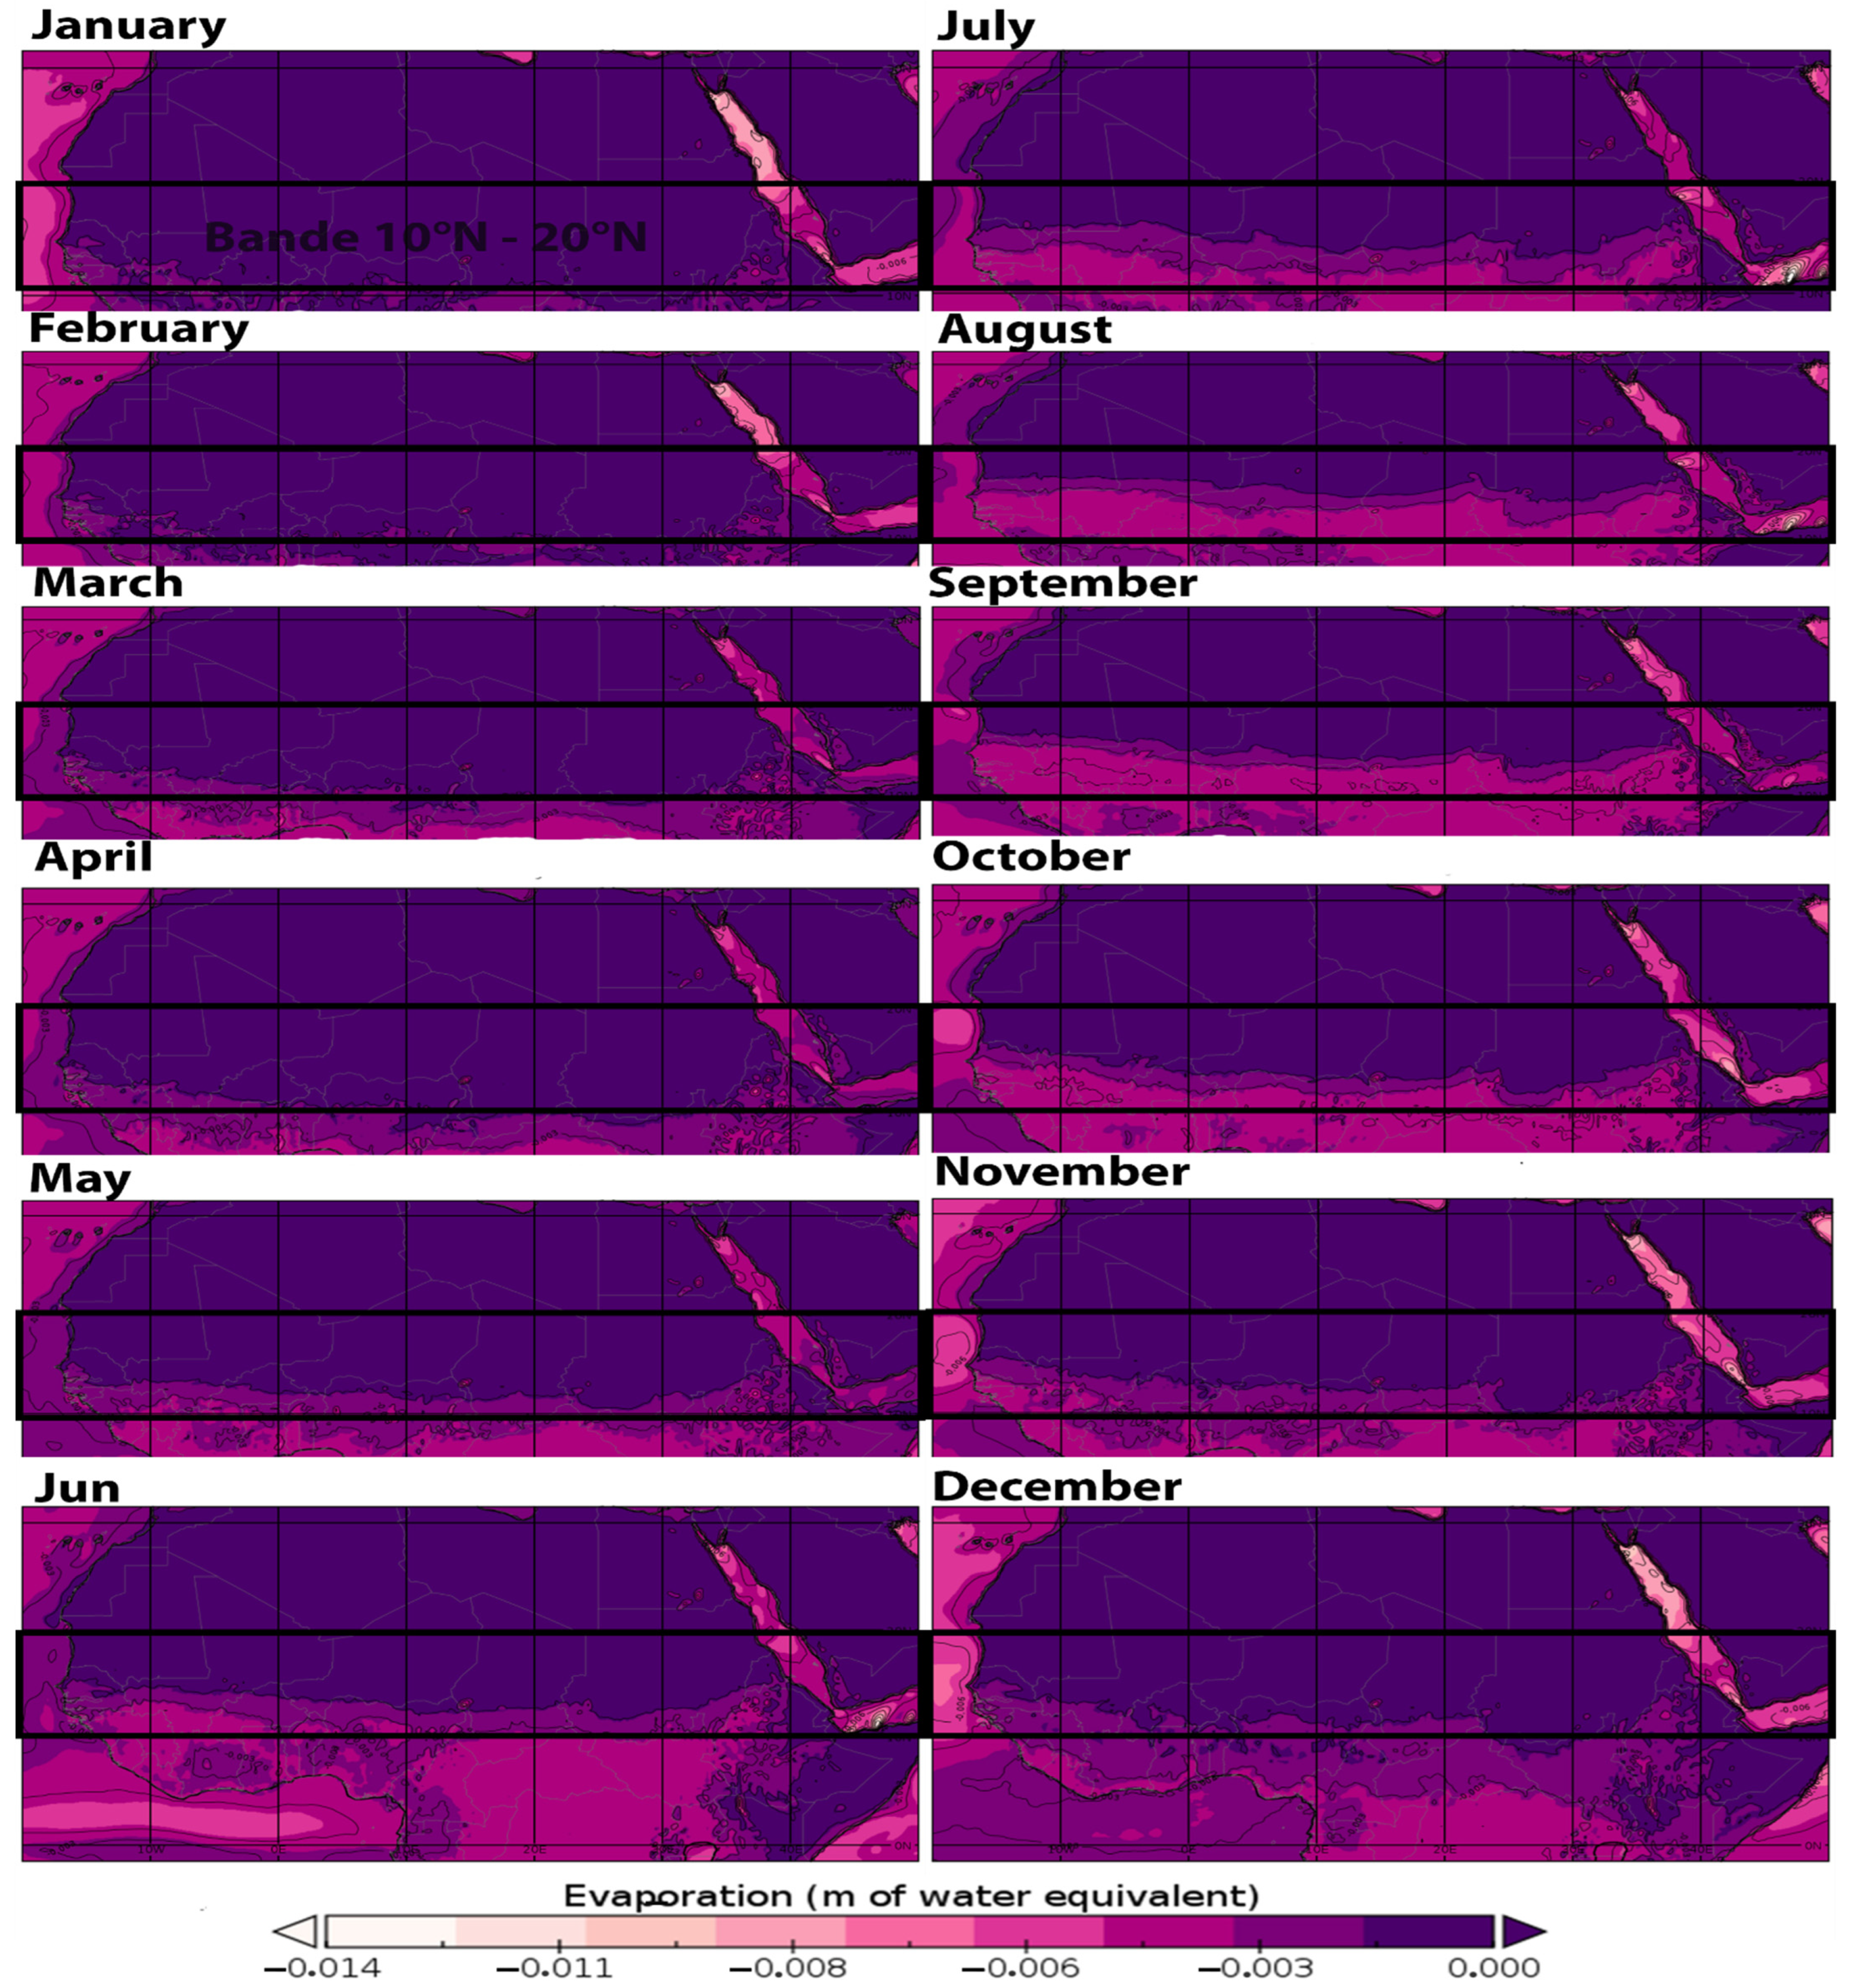
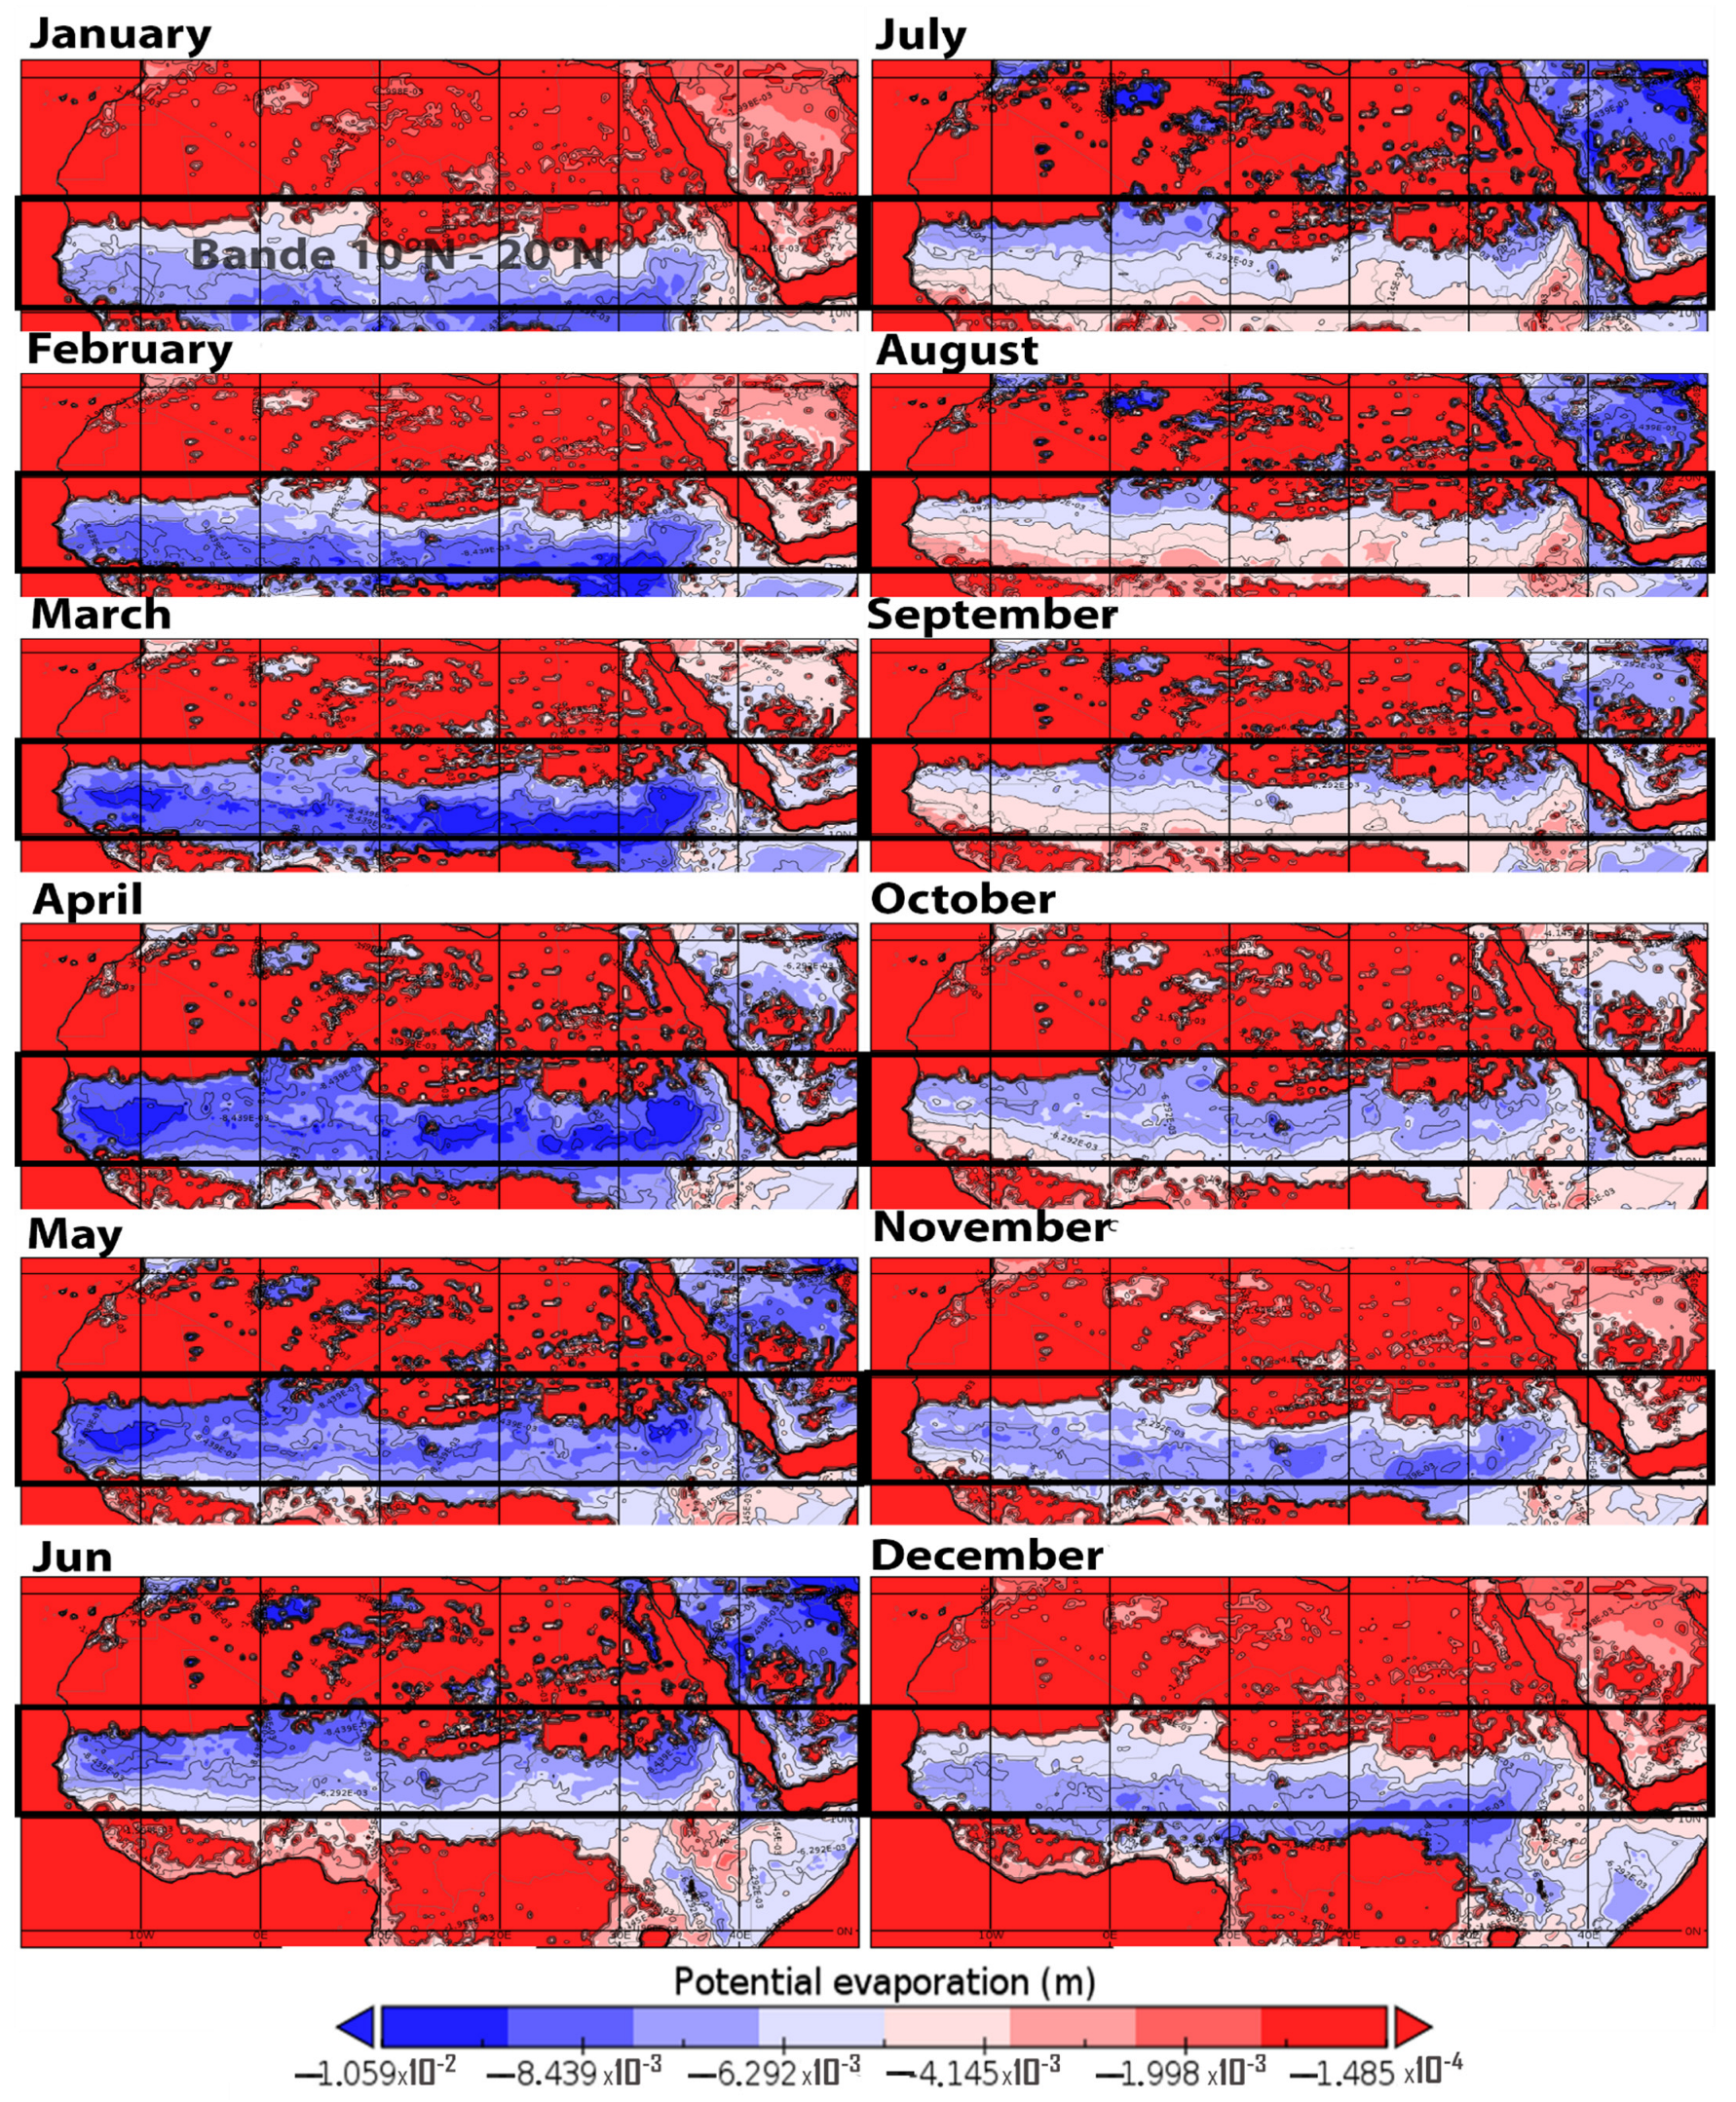
Figure 6 and Figure 7 show evaporation and evapotranspiration, respectively. According to these two figures, the Sahelian zone is subject to high evaporation from January to June, and at the same time, to very low potential evapotranspiration. Similar observations have been made in [29,30].
Mathematical approach to geopotential:
Hydrostatic equilibrium causes the pressure to always decrease with altitude. A locally high pressure must therefore correspond to a high altitude of the isobaric surfaces. The geopotential is a concept mainly used in meteorology. It represents a potential energy of gravity.
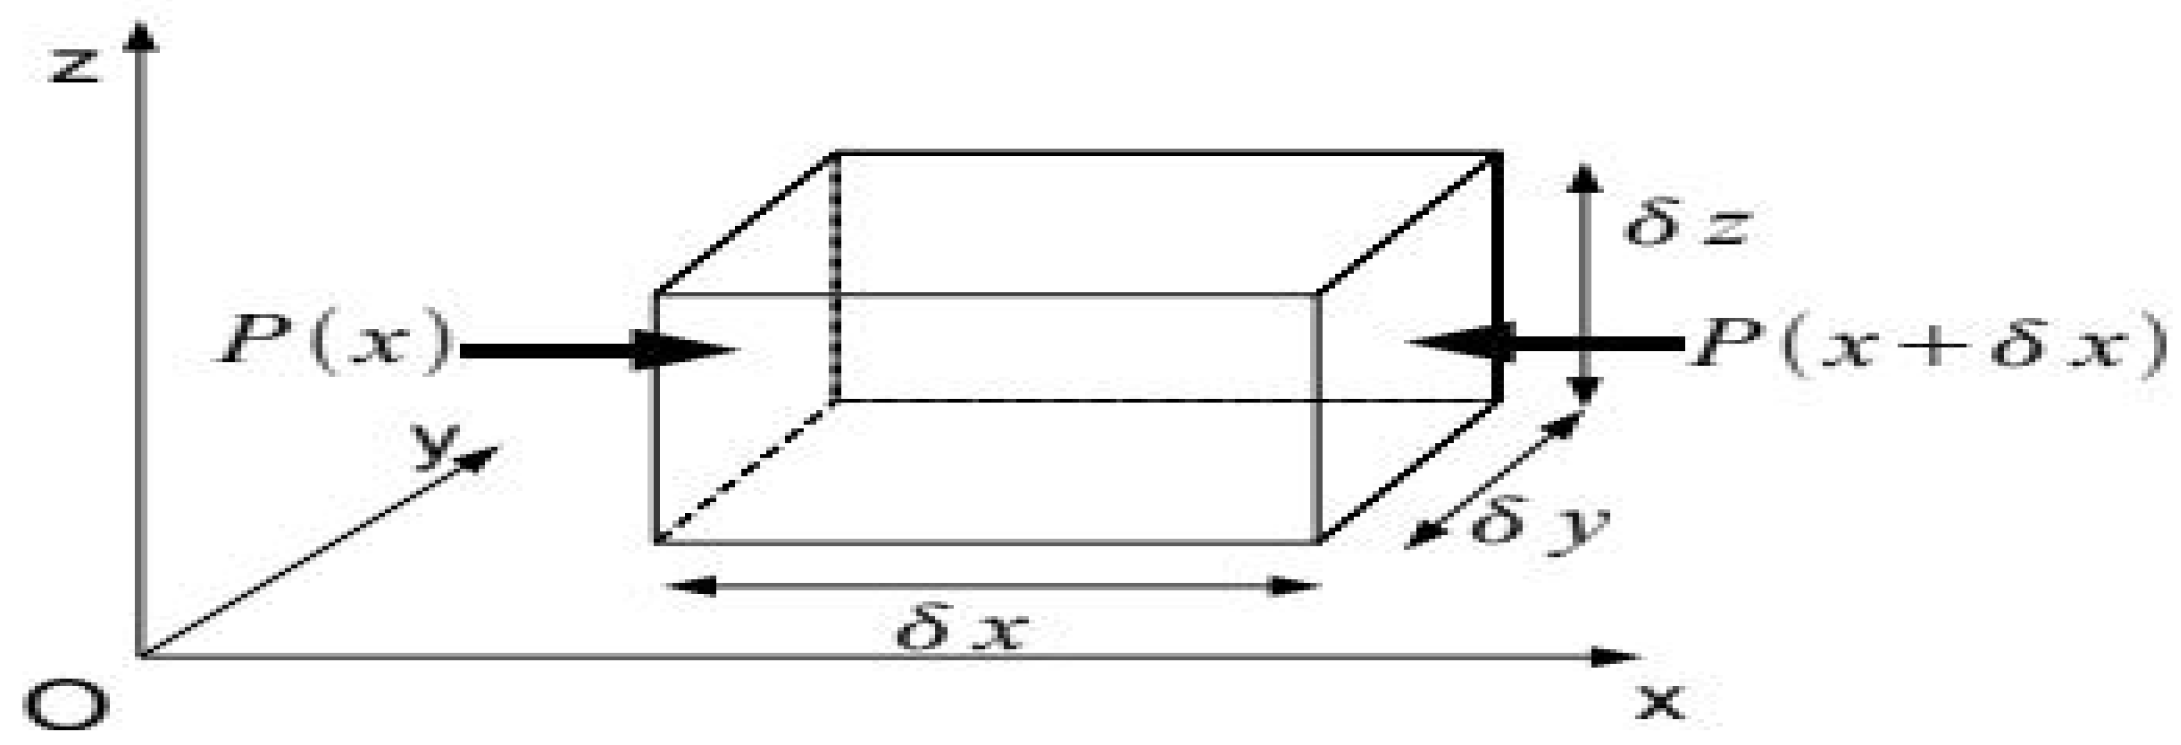
The pressure force acting on a surface 𝑆 is normal to that surface and its norm is 𝑝𝑆. For a parcel of air of volume 𝛿𝑉 = 𝛿𝑥𝛿𝑦𝛿𝑧 (Figure 8).
The total pressure force in given by Equation (4):
F p = 1 ρ ( p x p y p z ) = 1 ρ g r a d p
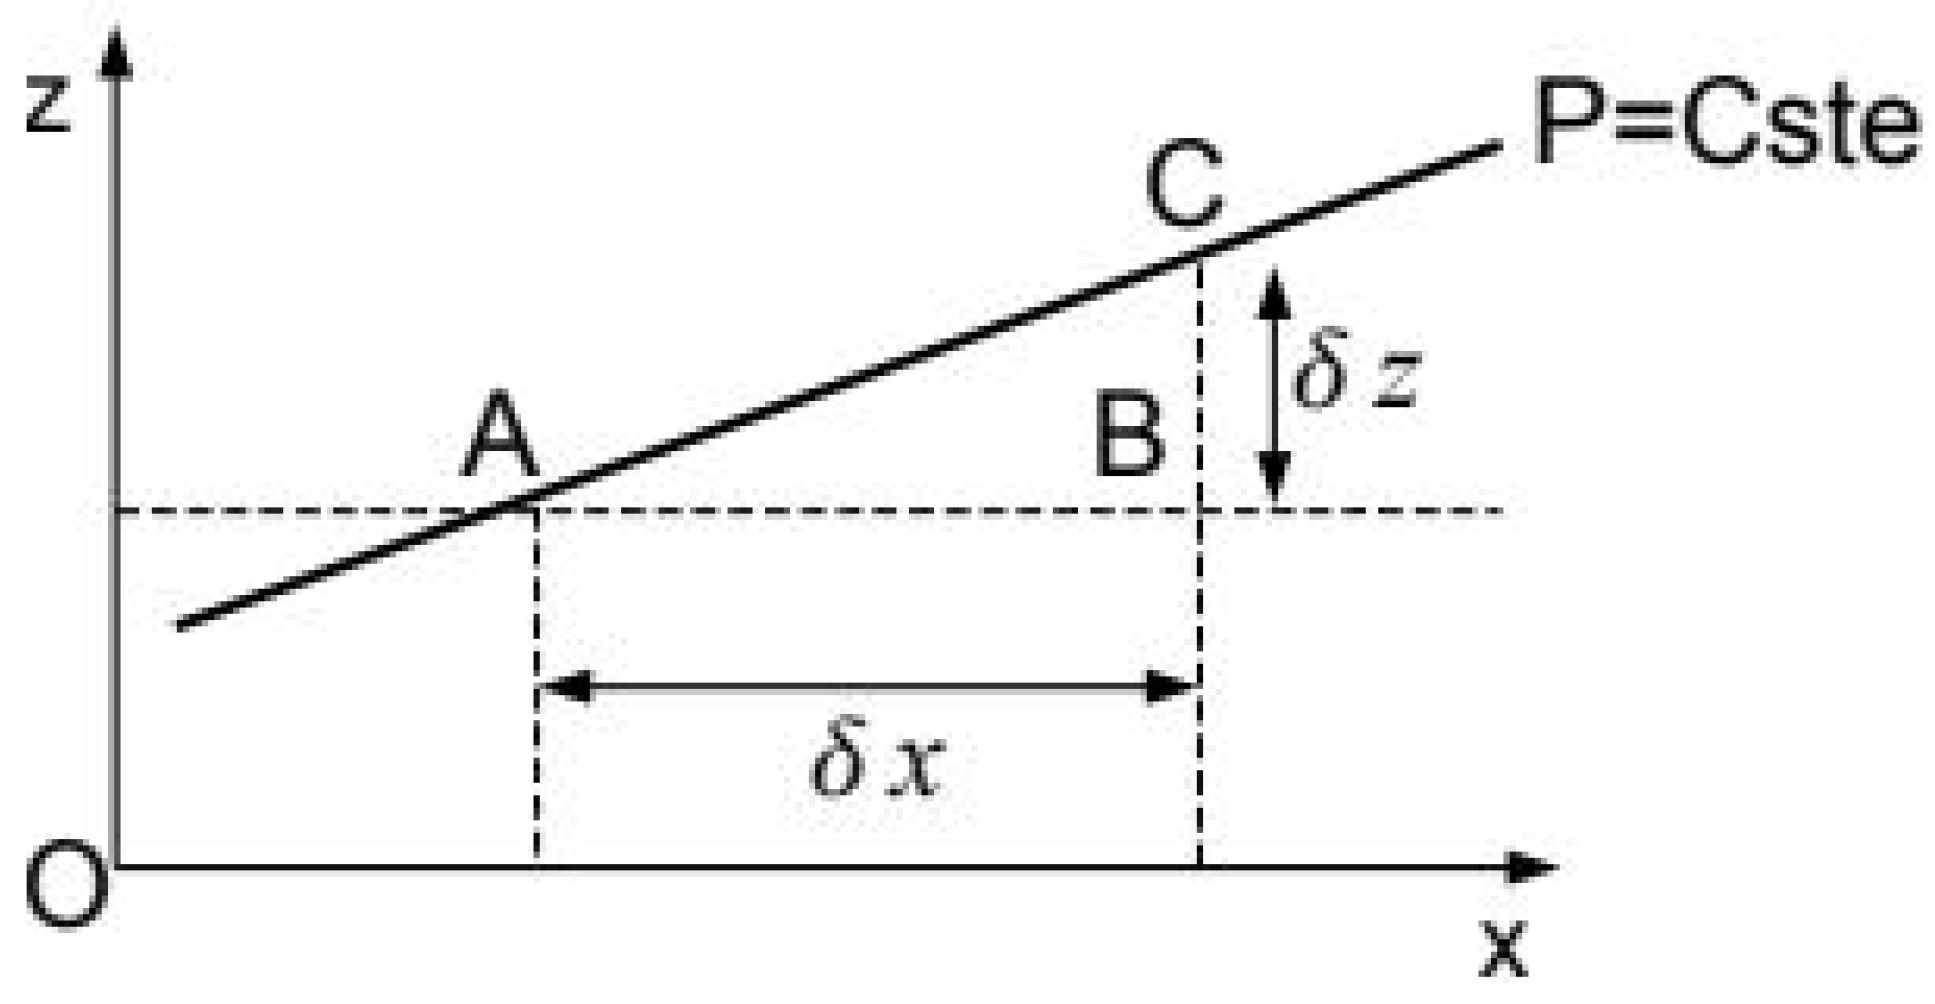
In Figure 9, the horizontal pressure force is given by Equation (5):
F p = 1 ρ g r a d z ( p ) = g r a d p ( z )
Figure 10 shows that in January, the geopotential at 1000 hPa remains relatively low with values around 11,173.7 m2 s−2 compared to the North African part, beyond 20° North. From April to June, the lowest geopotential values of the continent are found in the 10–20 band, similar observations were made by [31].
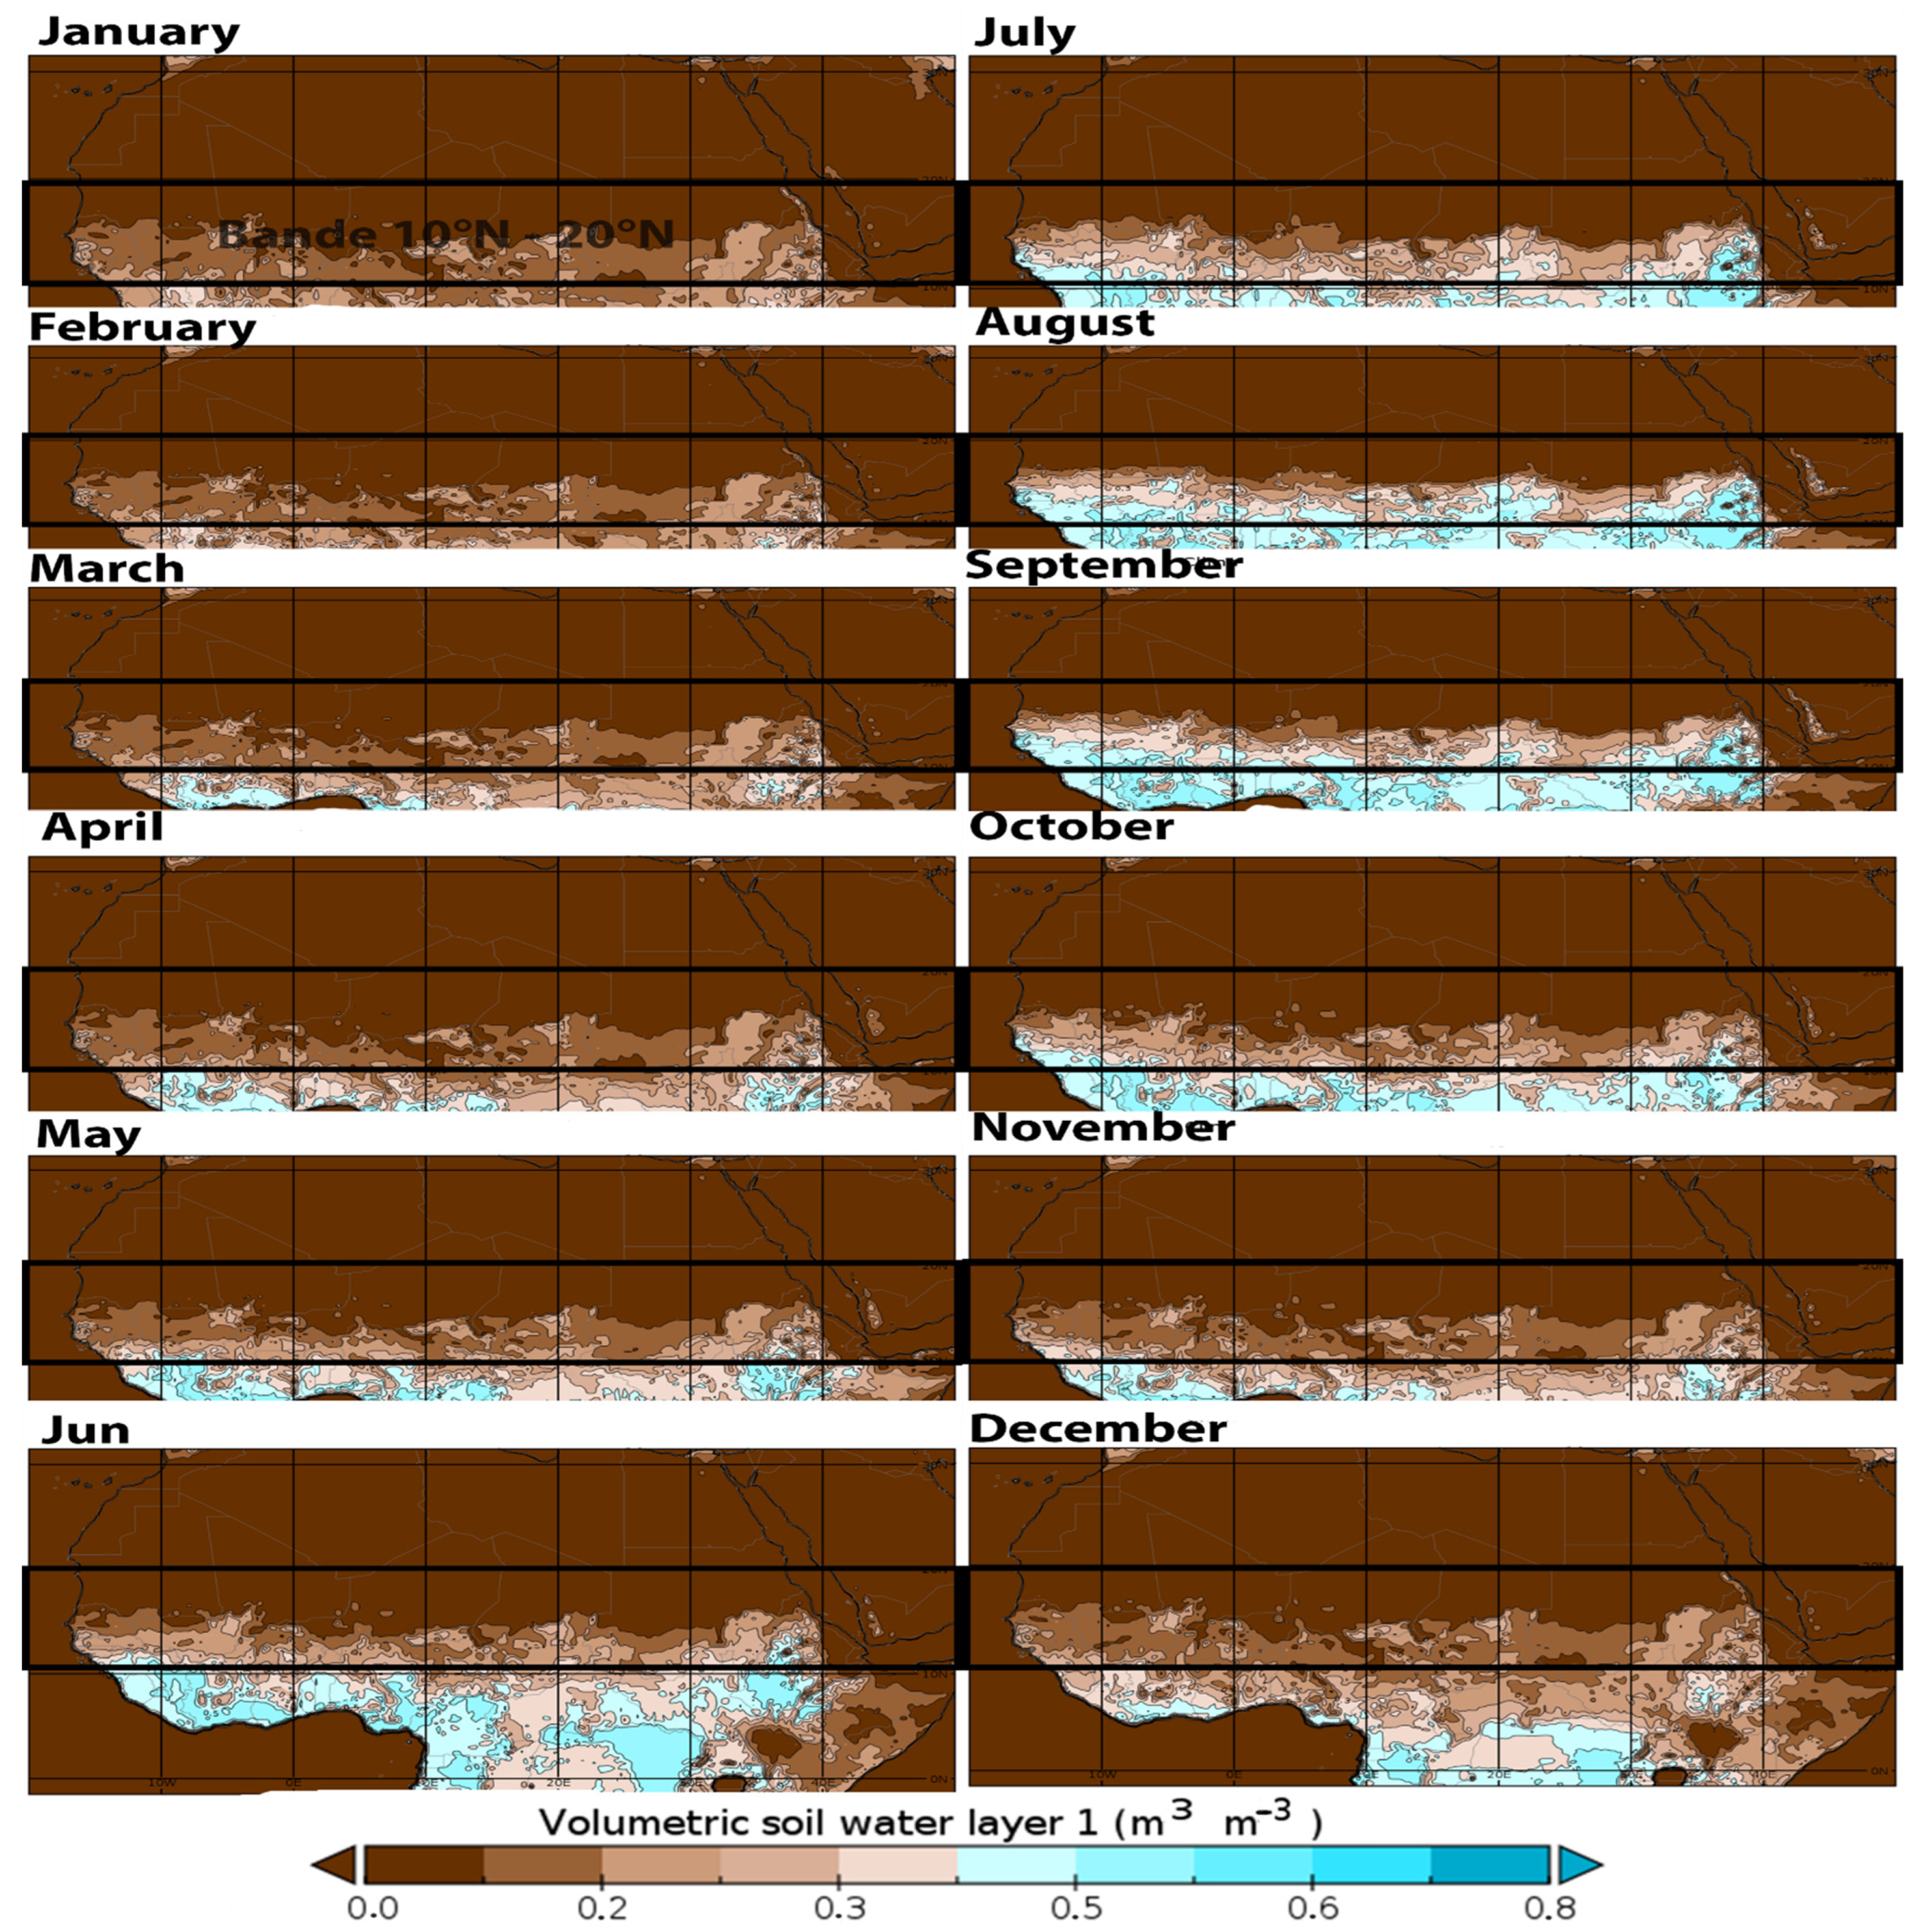
Figure 11 shows the amount of water contained in the soil and Table 1 gives the types of soils associated with each volumetric properties. From latitude 10 degrees North from January to June, it can be seen that the volumetric amount of water in the soil rotates around values below 0.3 m3m−3. These observations are close to those of [32].
Mathematical approach to soil volumetric water level:
The volumetric soil water level is associated with the soil water holding. In the case of our study, we consider level 1.
Equation (6) gives the mass water content W :
W = M w M S
M w : water mass in the soil
M S : dry soil mass
Volumetric water content ϴ of the soil is given by Equation (7):
ϴ = V w V t  
V w : volume of soil water
V t : total soil volume
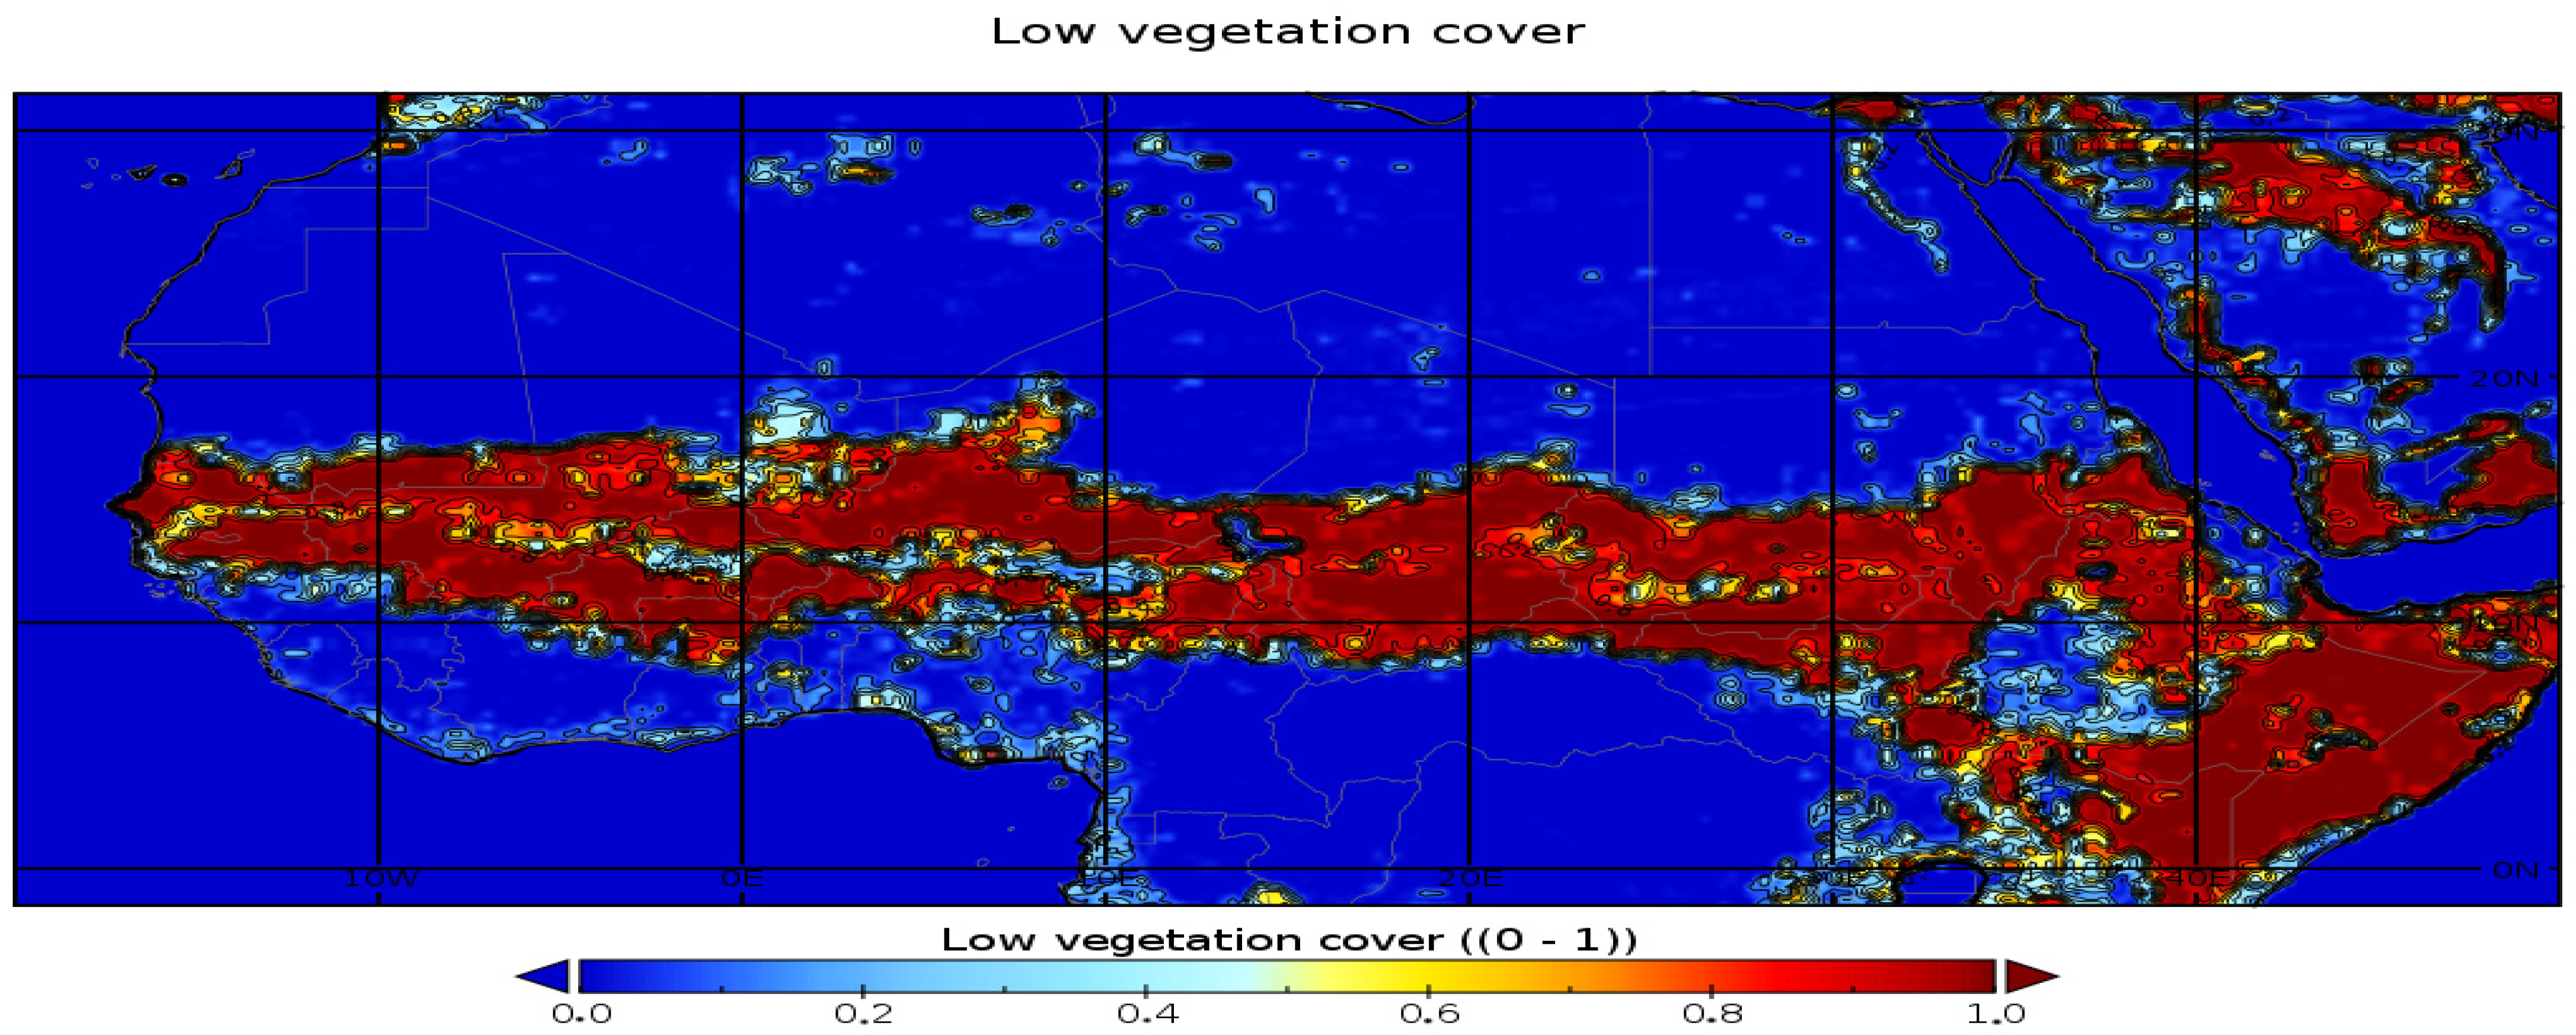
Table 2 summarizes soil types, Figure 12 and Figure 13 show the spatial distribution of low vegetation cover and soil type, respectively. It is noted that the 10–20 band contains the highest low vegetation cover and a sandy, semi-arid to arid soil type by location. These observations were also made by [33,34]. In Figure 13, this parameter is the soil texture (or classification) used by the ECMWF Integrated Forecasting System (IFS) land surface scheme to predict soil water holding capacity in soil moisture and runoff calculations. It is derived from the root zone data (30–100 cm below the surface) of the FAO/UNESCO Digital Soil Map of the World, DSMW (FAO, 2003). The seven soil types are shown in Table 2.
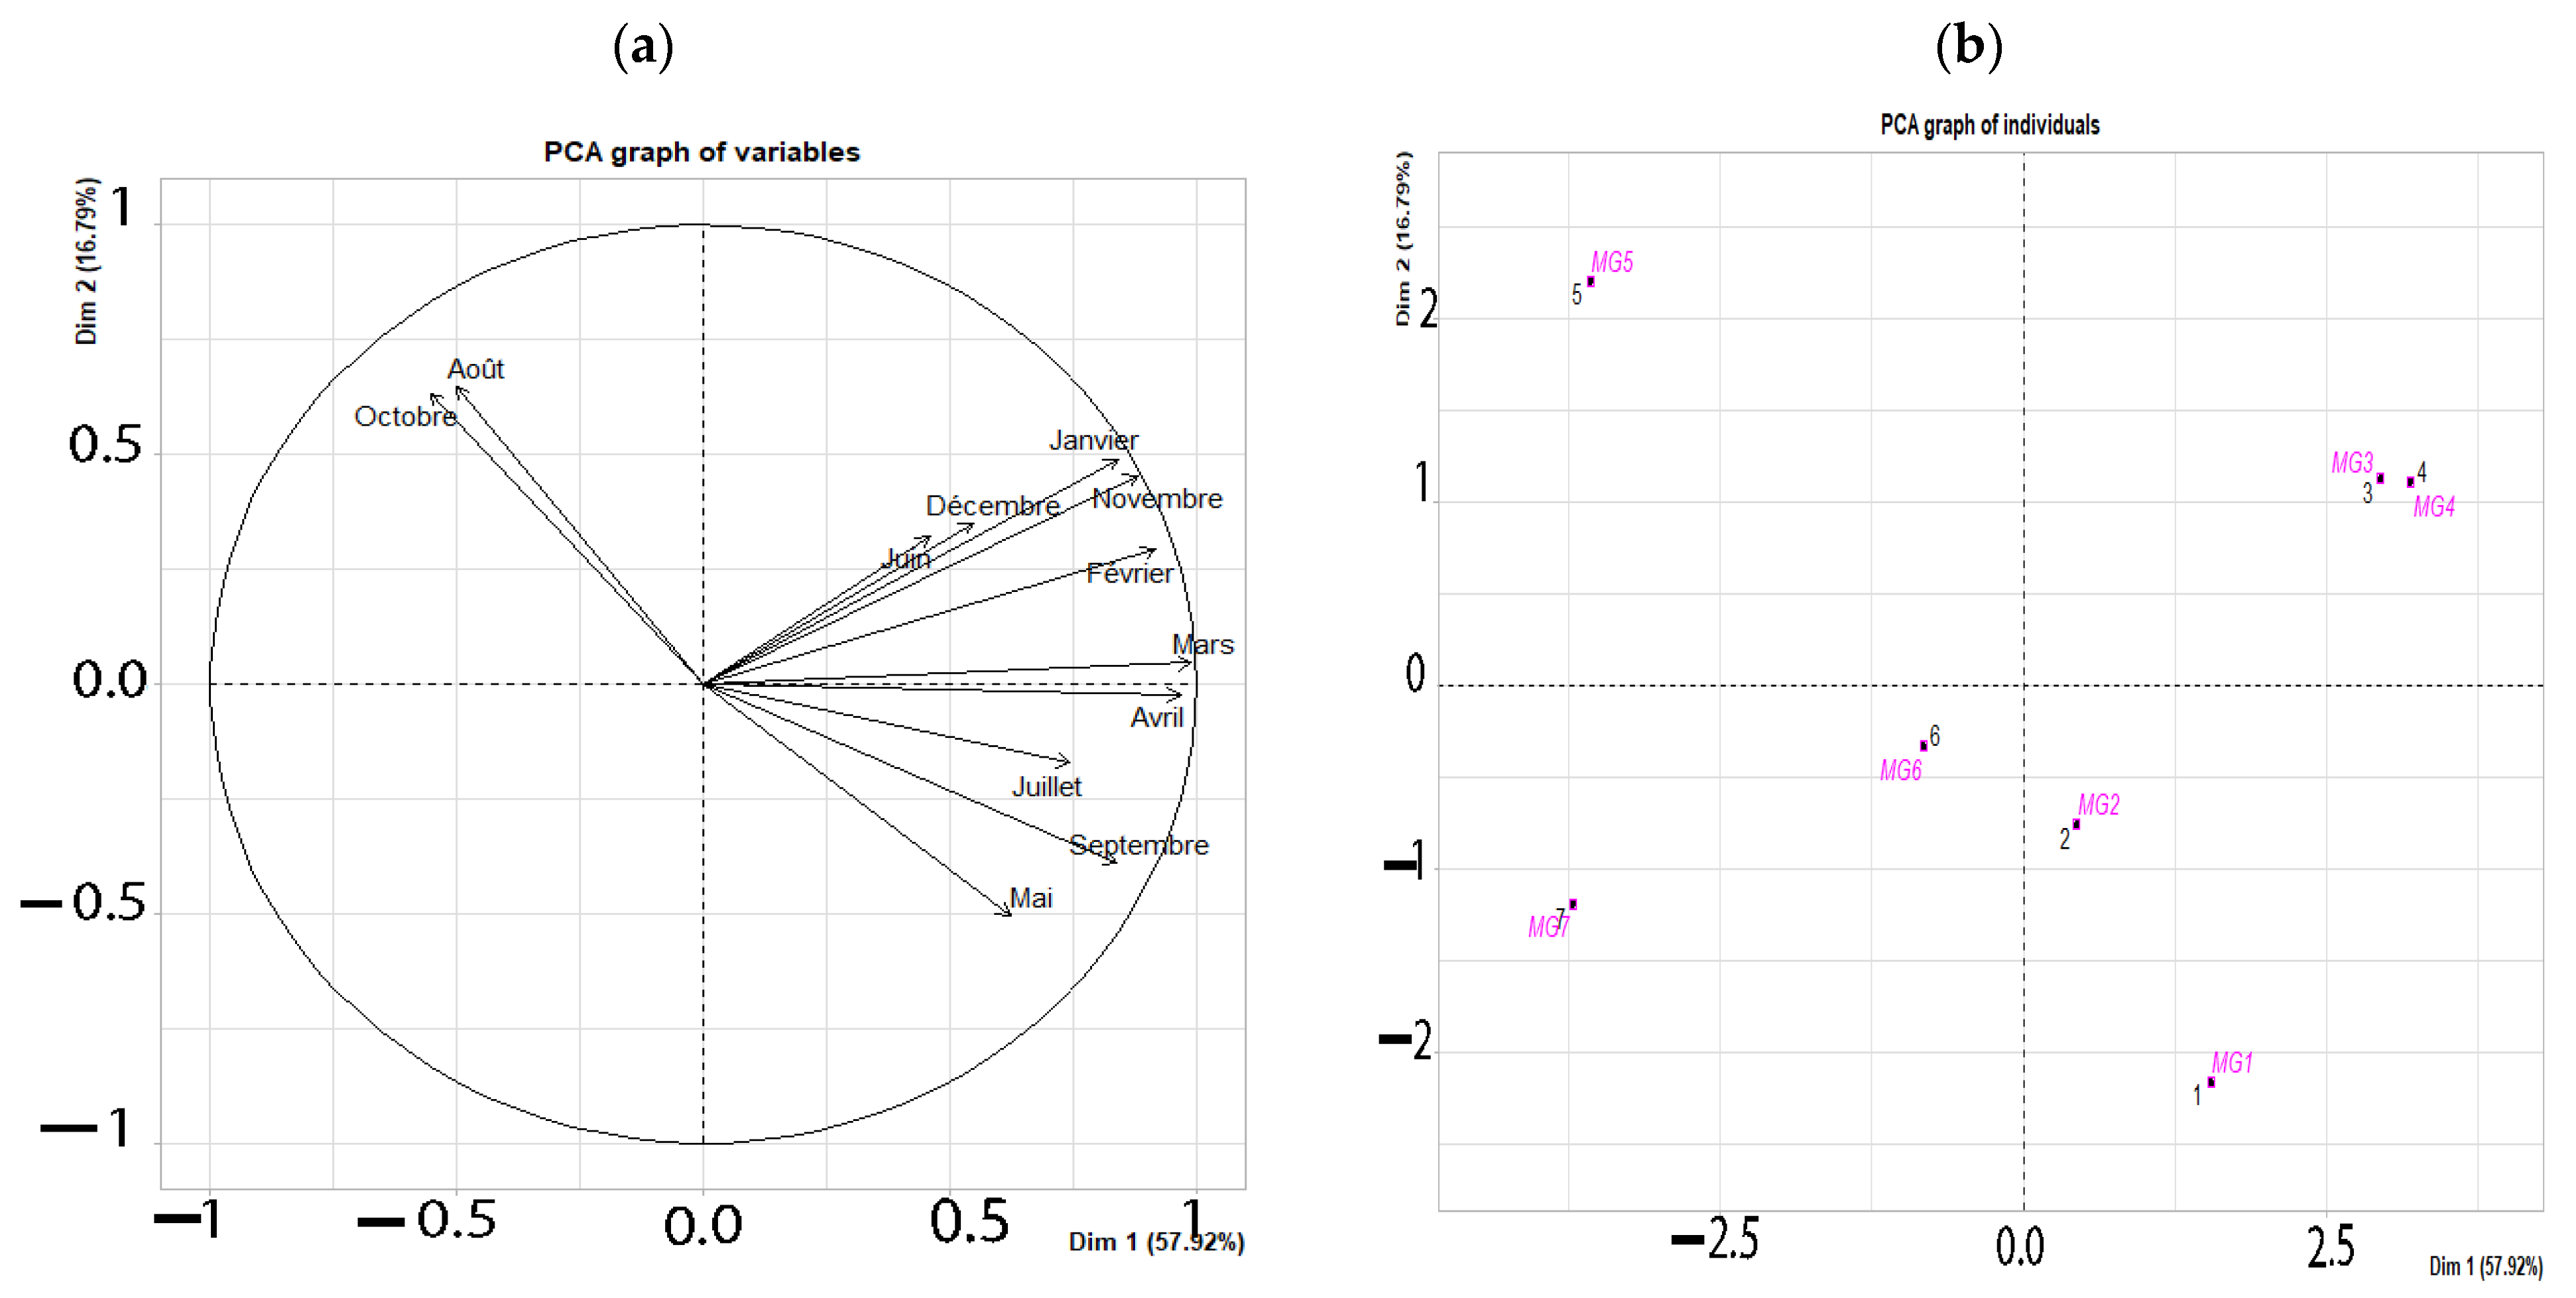
Figure 14a,b consists of a graph of individuals and a graph of variables. It gives the correlations between AUVI, aerosol deposition, total precipitation, temperature at 2 m, wind at 10 m, evapotranspiration, relative vorticity, geo-potential, evaporation, vertical velocity, soil type and soil volumetric water quantity.
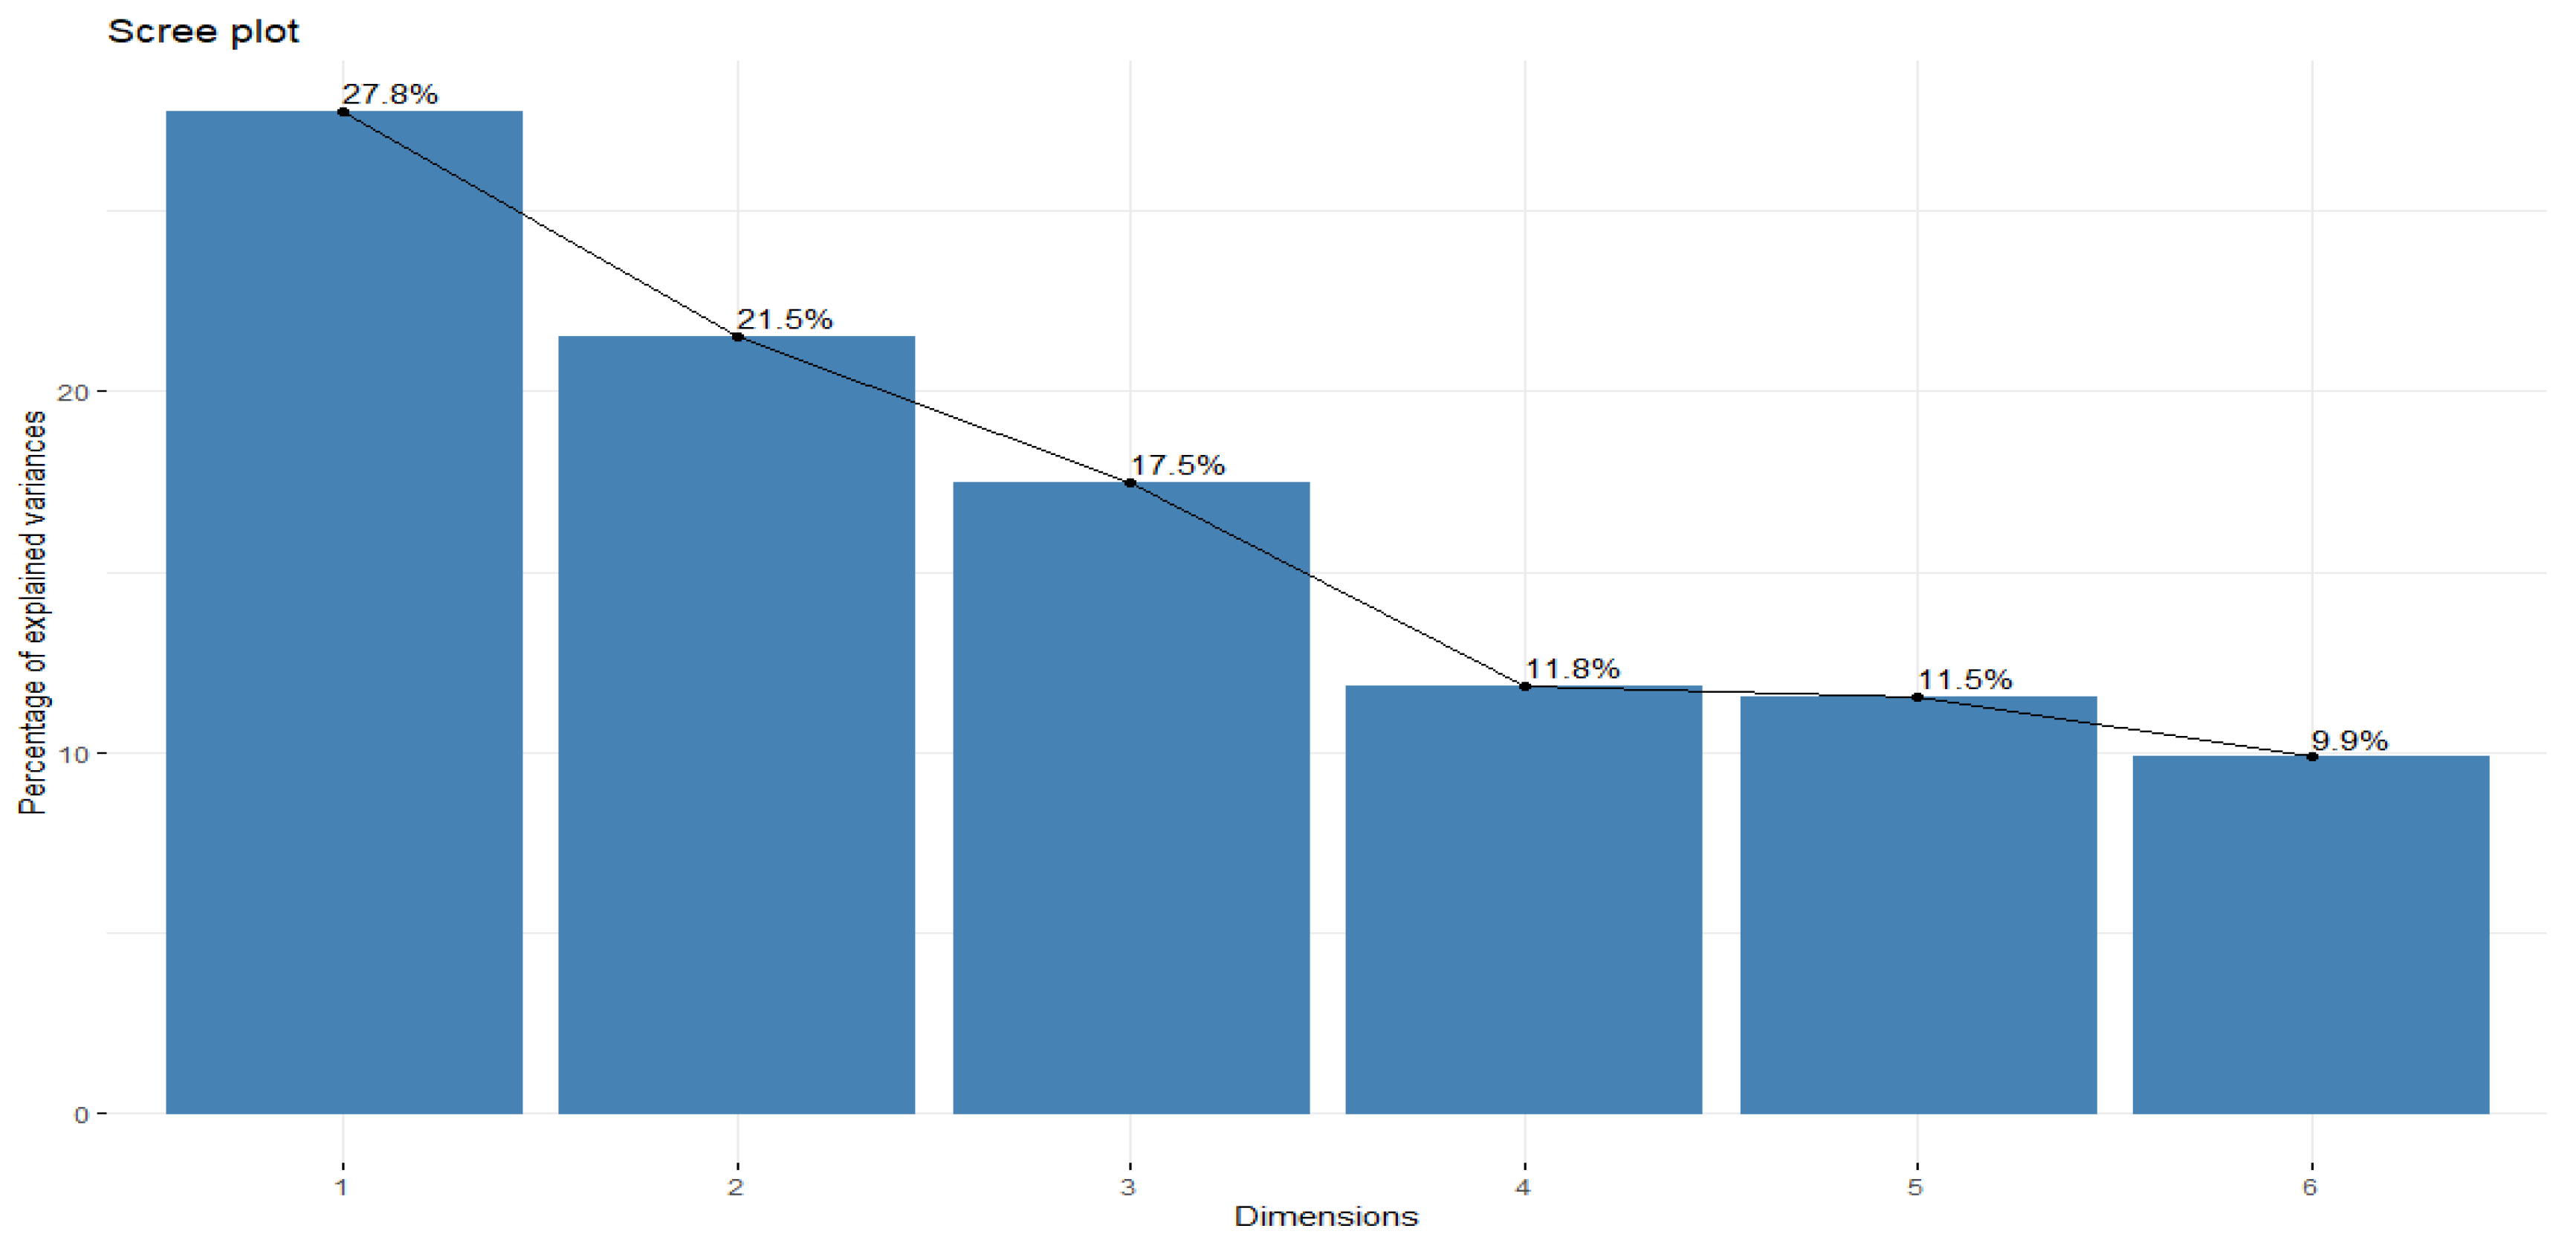
In Figure 15, 66.8% of the information is held by the first three dimensions of our principal component analysis. Knowing that eigenvalues can make it possible to determine the number of principal axes, the difference between the other remaining eigenvalues being relatively small, the first two axes explain the relationships between the variables well. So with Figure 15, we have a confirmation of the good representativeness of our variables.
Figure 16 shows the contribution of relative vorticity, evapotranspiration, vertical velocity, specific humidity and dust deposition to the first dimension. This figure shows the average expected contribution. If the contribution of the variables is uniform, the expected threshold value would be 10%. For a given component, a variable with a contribution greater than this threshold is considered to have a significant contribution to the factorial axis. It can be seen that the deposit on each month, with the exception of December, contributes well to the formation of the analysis in principal component. This confirms the significance of the results given by the correlation circle.
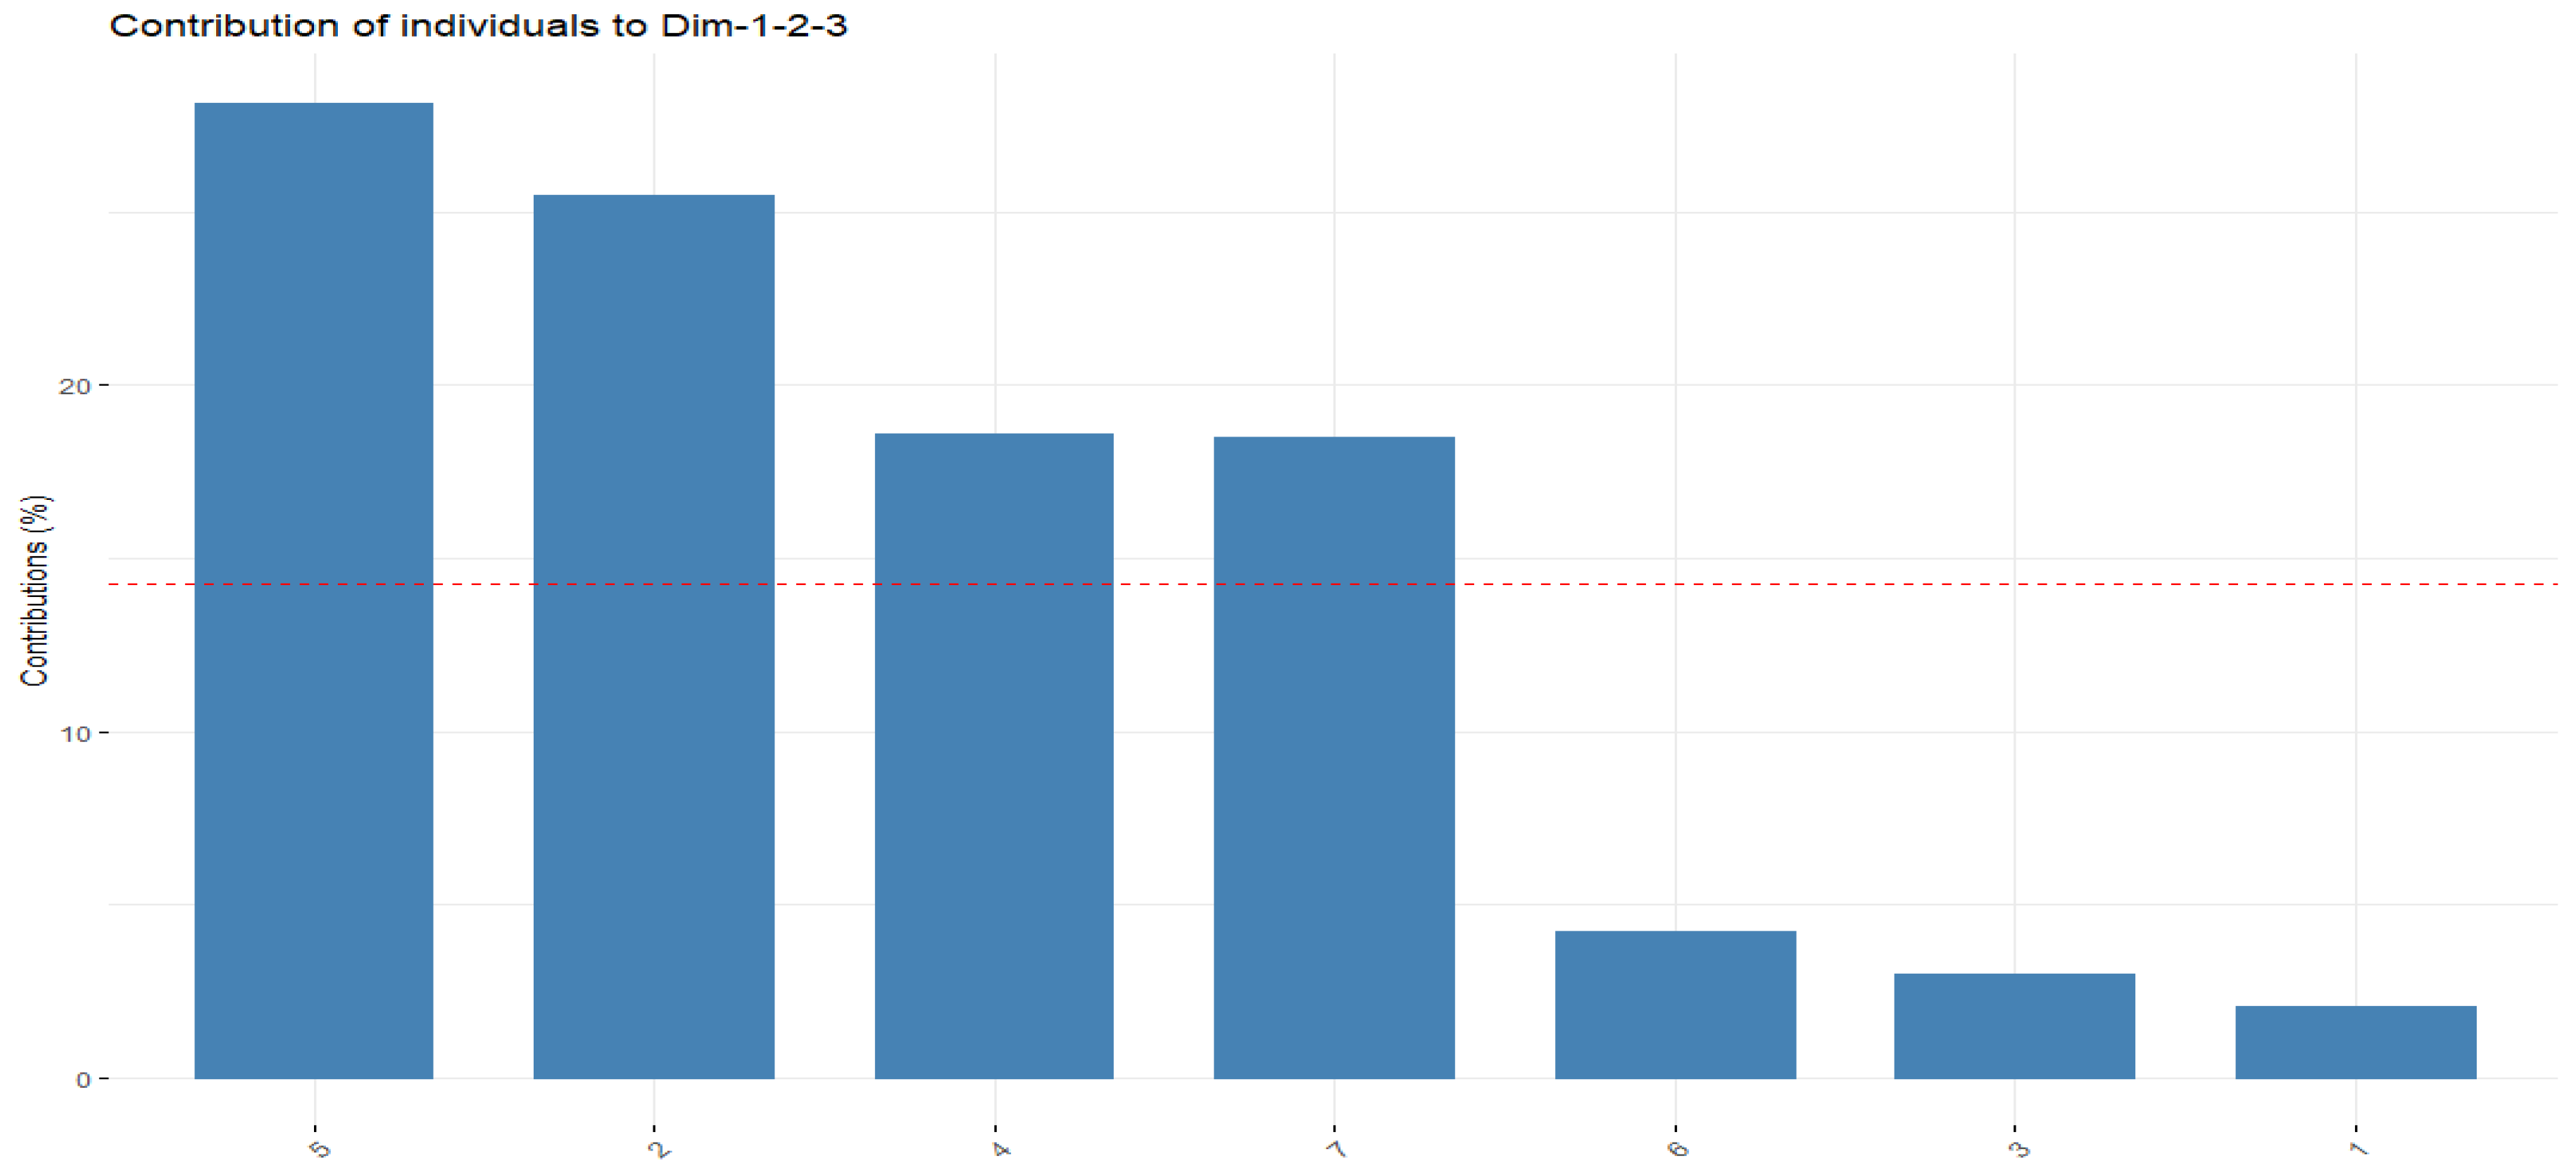
With regard to the contribution of individuals, Figure 17 shows that grids 5, 2, 4 and 7 contribute to dimensions 1, 2 and 3, while grids 1, 3 and 6 contribute less significantly in these three dimensions.
As for Figure 17 showing the variables that contribute to the second dimension and are not involved in the first dimension, there is the wind at 10 meters and the volumetric soil water level.
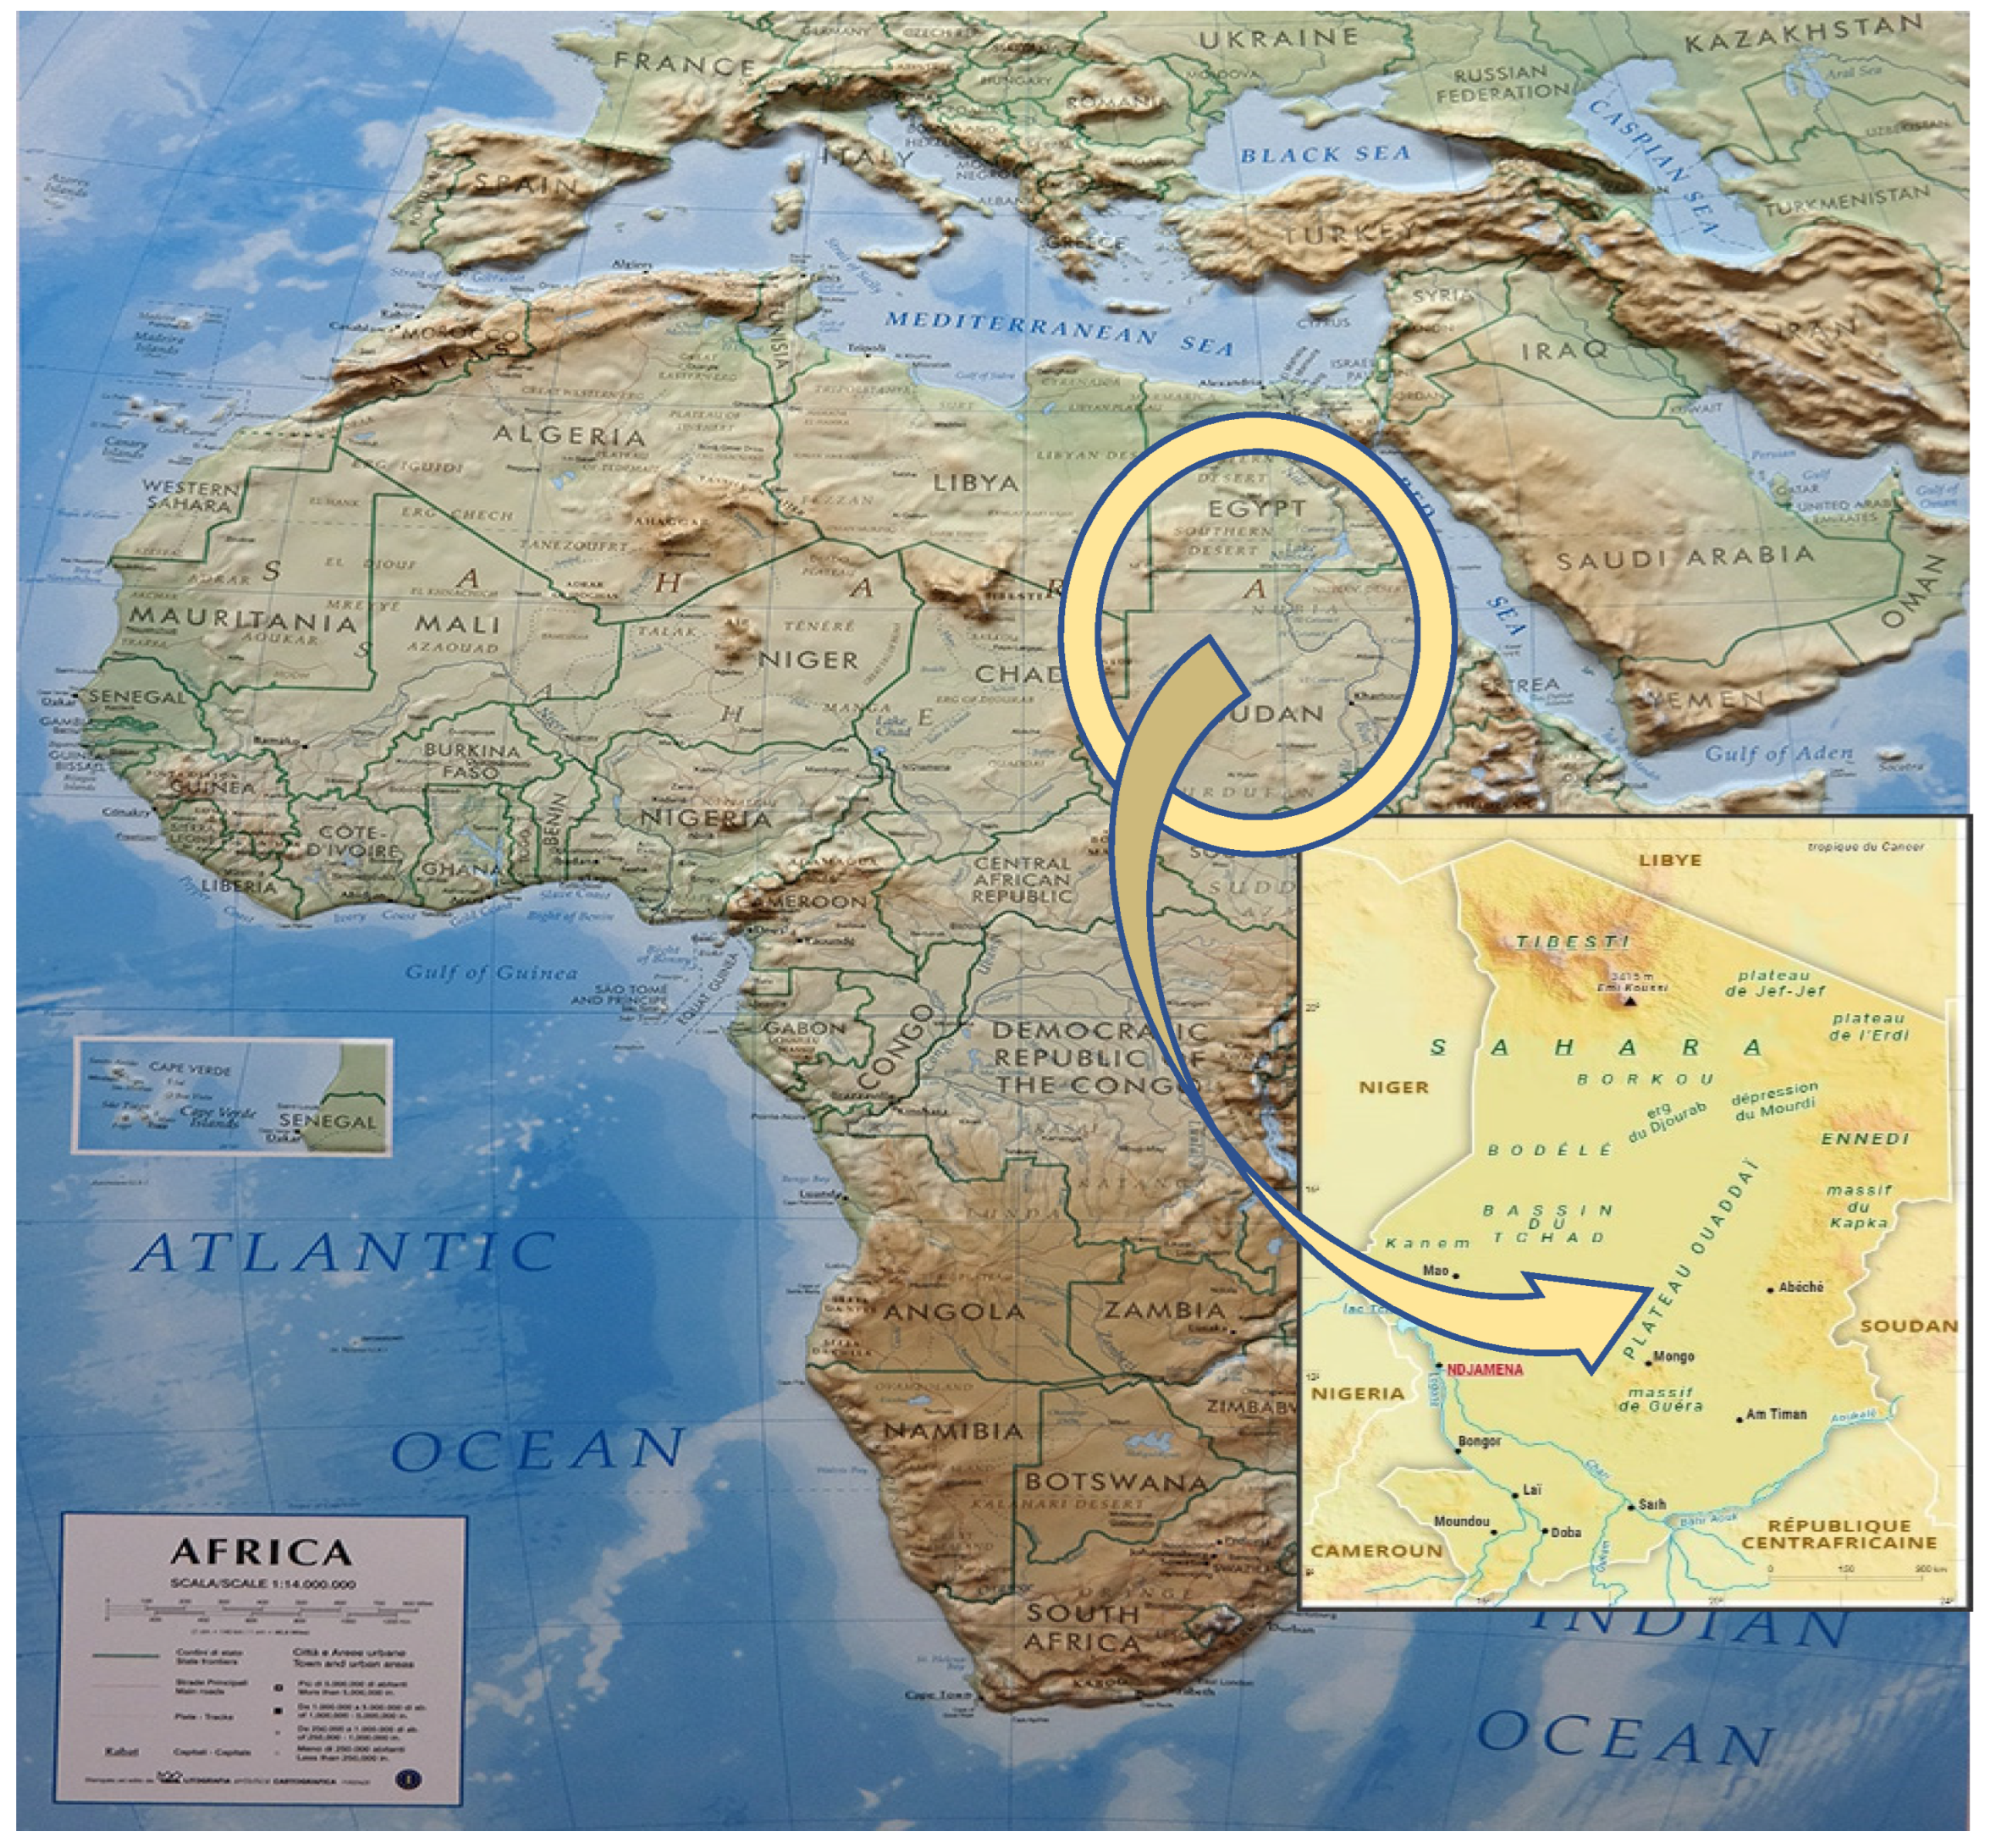
The climatic observation shows that the uplift took place mainly on and around the 20° East–15° North coordinate point in Chad, more precisely on the Ouaddaï Plateau, which is surrounded by Bodélé, the Djourab Erg, the Mourdi Depression, the Kapka Massif, the Guéra Massif and the Chad Basin, as shown in Figure 18. the principal component analysis on the different parameters reveals why the uplift takes place in this zone through the correlation established between the different climatic parameters.

4. Discussion

According to Figure 13 showing soil types in the 10–20 band, specifically in the Ouaddaï plateau, soil type indices range from 4 to 4.2. This characterizes the fine, semi-arid to arid soil types, which are caused by low rainfall; rainfall is only observed in July, August and September, and does not exceed 5692 millimeters. This is associated with low evapotranspiration and a high index of low vegetation cover as shown in Figure 7 and Figure 12.
A semi-arid to arid soil is also caused by a high evaporation of the volumetric water level of the soil which is observed in Figure 6 and Figure 11. Similar results are found in the work of [35]. High evaporation values are associated with a rather high temperature index at 2 m throughout the year as can be seen in Figure 2. This remark is very close to those of [36] especially with the strong evaporation in the Sahel.
Ground-level winds at the Ouaddaï plateau are strongest in the 10–20 band from January to April and from September to December. This favors the saltation and sandblasting process. Since the geopotential is the gravitational potential of a locality at a given altitude, according to Figure 10, the Ouaddaï Plateau is subject to a relatively low geopotential throughout most of the year. This is associated with the presence of vortexes throughout the year and a vertical wind profile that is among the strongest in the 10–20 band just off the Kapka massif as shown in Figure 4 and Figure 5. Thus, it can be said that particle uplift in this area is a very favorable phenomenon.
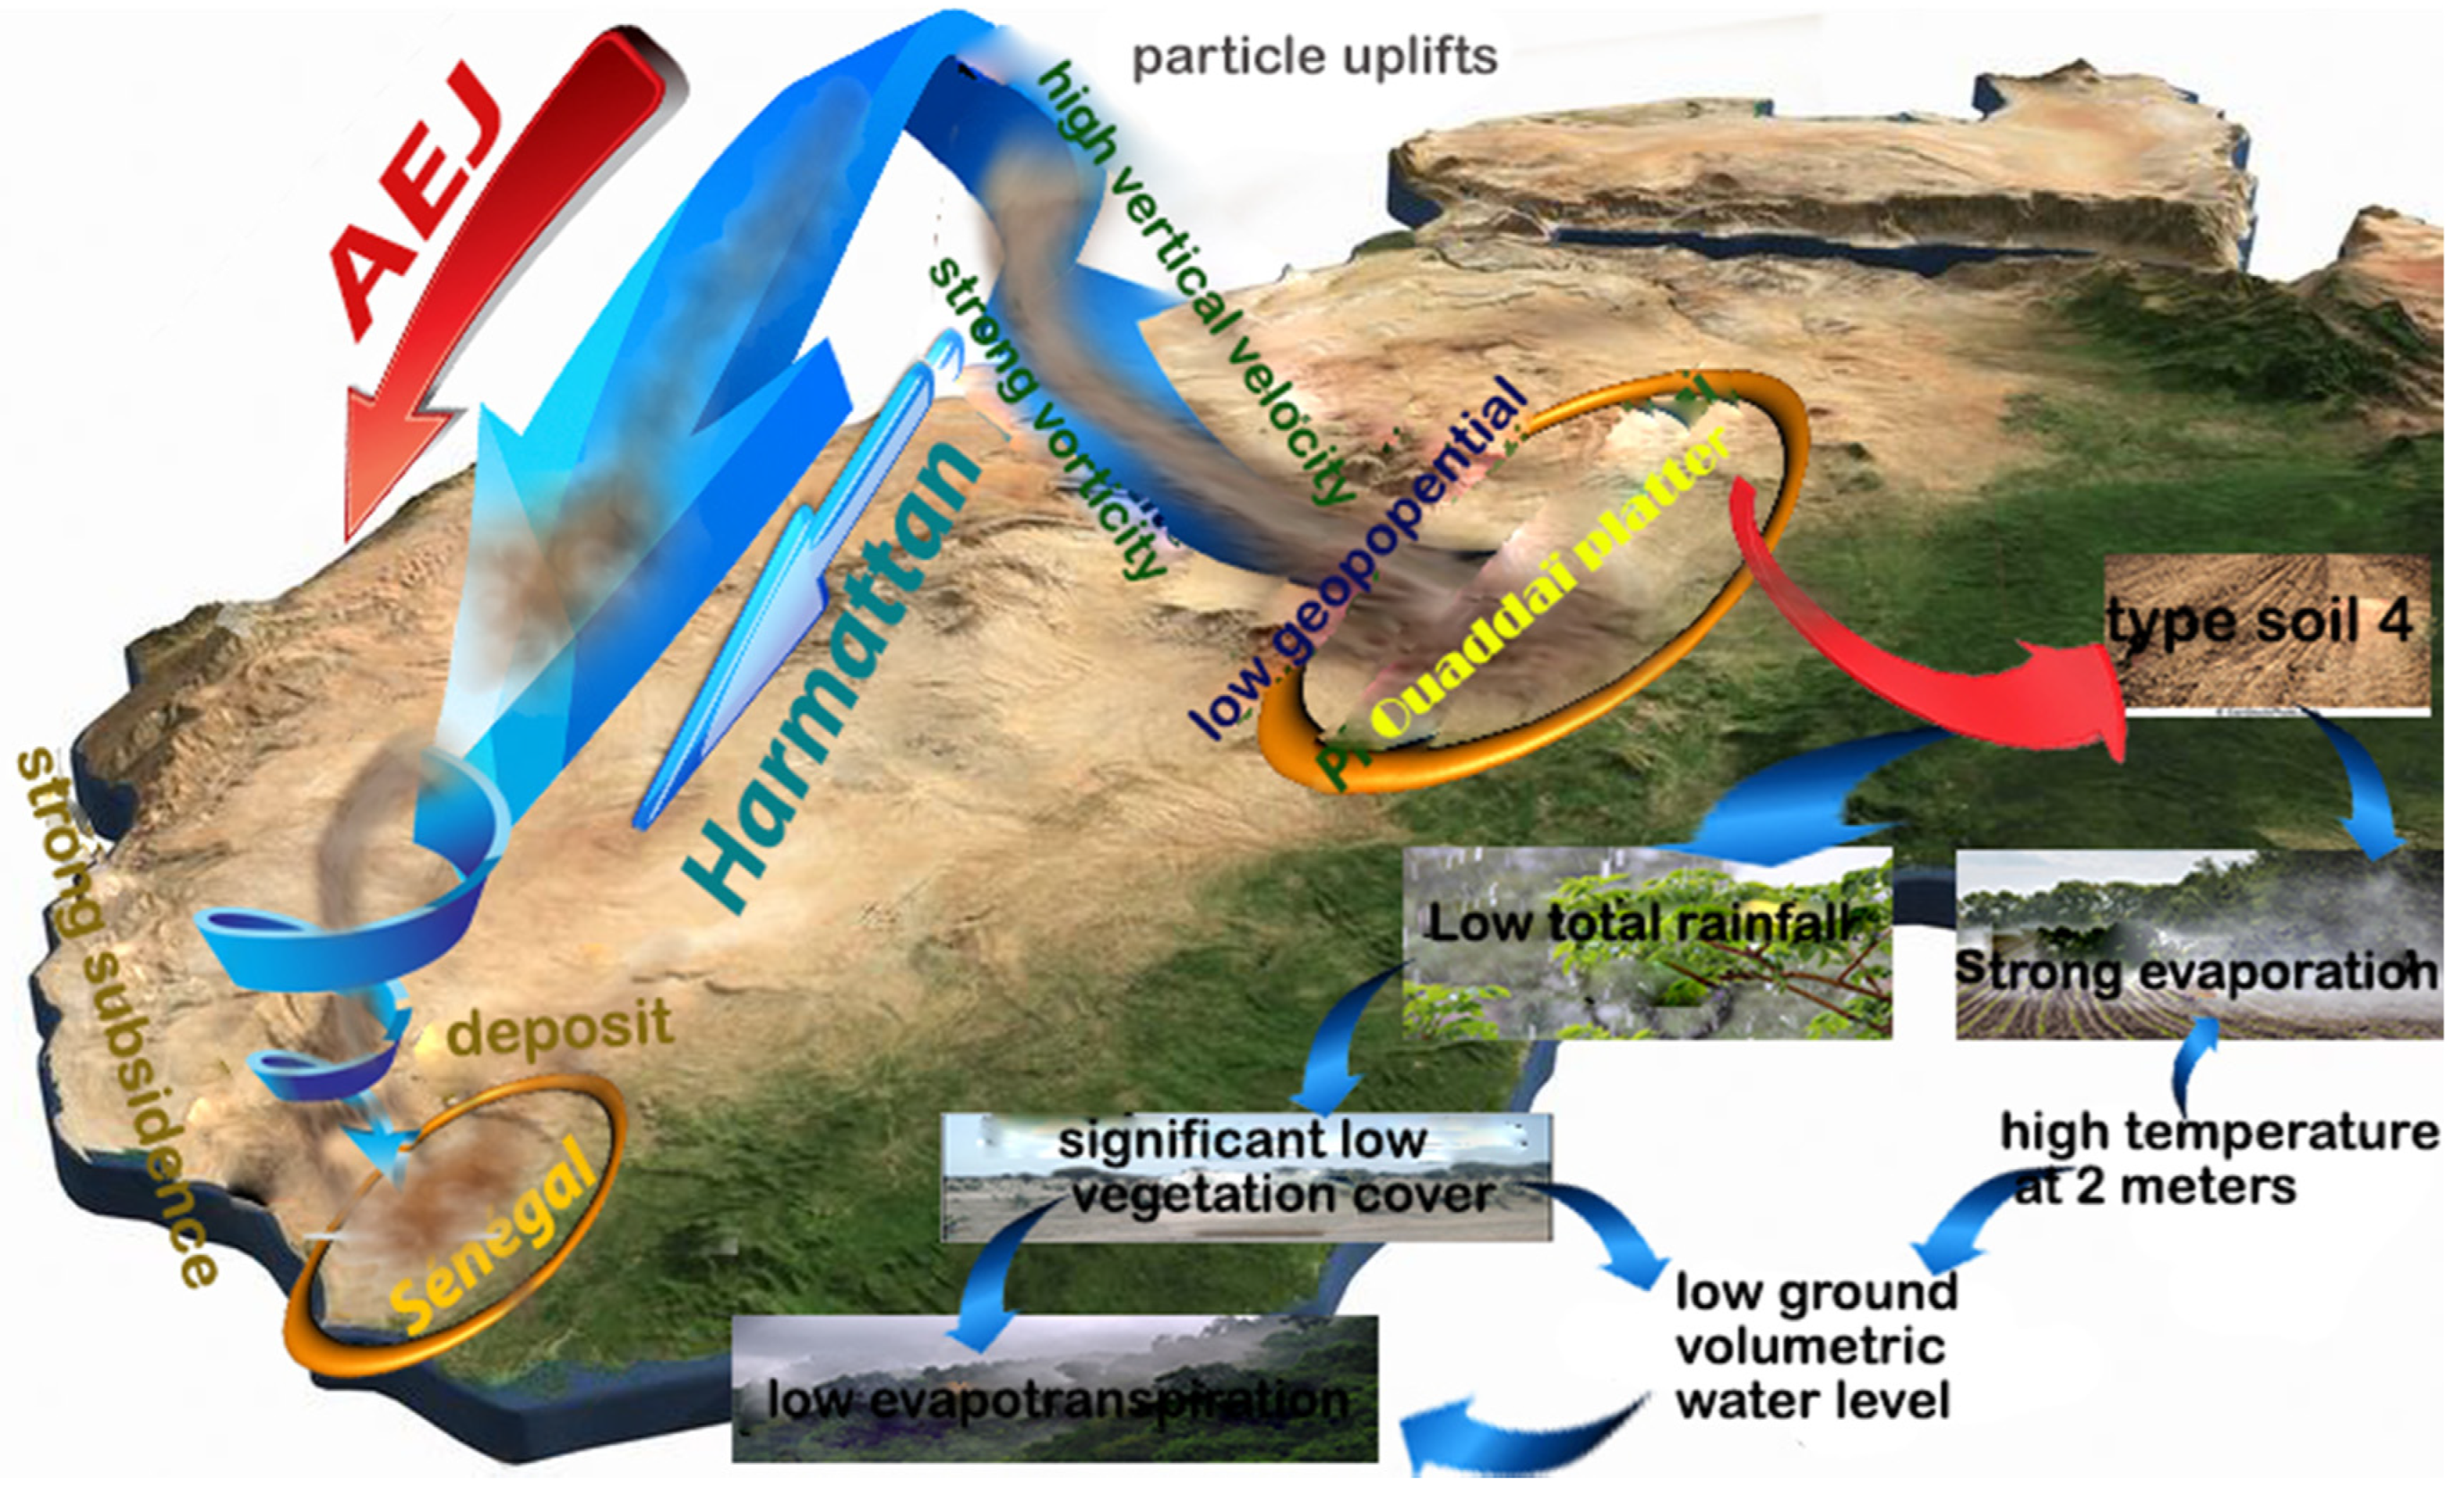
When uplift occurs on the Ouaddaï plateau, the heaviest particles with a weight of more than 20 µm fall back to the area. However, particles with a diameter of less than 20 µm manage to reach 850 hPa, at which point they enter the Harmatan circulation, which is a low-level north-northeast wind. Particles with a diameter less than or equal to 10 μm (PM10) reach the lower part of the Atmospheric Mid-Layer Jet AEJ (African Easterly Jet), which is a very strong wind, and the PM10 that reaches it is transported to the coastal country Senegal. The results obtained on the role of the wind in the uplift of particles concurred with those of [37].
The AEJ mid-layer winds weaken as they approach the coast. Aerosols are transported in the AEJ. As they approach the coast, they become heavier combined with the specific moisture brought by the westerly winds from the Atlantic Ocean and the winds from the Gulf of Guinea which are also loaded with moisture and reinforced by the Saint Helena High. As these aerosols become heavier, they lose altitude and fall back down to around 900 hPa. This is the atmospheric pressure level at which winds in Senegal become weak according to studies by [38]. Consequently, aerosols found there tend to settle.
Figure 19 summarizes all the mechanisms studied.

5. Conclusions

The results obtained allowed the definition of the aerosol cycle from the Ouaddaï plateau to Senegal. The study showed that ground-level winds on the Ouaddaï Plateau favor the saltation and sandblasting process. The Ouaddaï Plateau is subject to a relatively low geopotential throughout most of the year. There is a presence of vortexes throughout the year and a vertical wind profile that is among the strongest in the 10–20 band just off the Kapka massif. Particle uplift in this area is a phenomenon that is very conducive. Particles with a diameter of 10 micrometers or less (PM10) reach the lower part of the Atmospheric Mid-Layer Jet (AEJ), which is a very strong wind, and the PM10 that reaches it is transported to the coastal country Senegal.

Author Contributions

Conceptualization, A.B.D. and A.S.; methodology, A.K.M. and A.K.F.; software, M.W.; validation, B.D., A.T.G. and A.D.; formal analysis, E.h.D.; investigation, A.B.D.; data curation, A.B.D.; writing—original draft preparation, A.B.D.; writing—review and editing, A.B.D.; visualization, all authors; supervision, B.N. All authors have read and agreed to the published version of the manuscript.

Funding

This research received no external funding.

Institutional Review Board Statement

Ethical review and approval was waived for this study because it did not involve humans and animals.

Informed Consent Statement

This study does not involve humans and animals.

Data Availability Statement

The following parameters, evaporation, evapotranspiration, geopotential at 1000 hPa, total precipitation, soil type, temperature at 2 m, wind at 10 m, vertical velocity, volumetric soil water, vorticity at 1000 hpa and specific humidity are directly extracted from the ERA5 platform.

Conflicts of Interest

The authors declare no conflict of interest.

References

  1. Marticorena, B.; Bergametti, G. Modeling the atmospheric dust cycle. J. Geophys. Res. Atmos. 1995, 100, 16415–16430. [Google Scholar] [CrossRef] [Green Version]
  2. Schütz, L.; Jaenicke, R.; Pietrek, H. Saharan dust transport over the north atlantic ocean. Geol. Soc. Am. Spec. Pap. 1981, 186, 87–100. [Google Scholar]
  3. d’Almeida, G.A. On the variability of desert aerosol radiative characteristics. J. Geophys. Res. Atmos. (1984–2012) 1987, 92, 3017–3026. [Google Scholar] [CrossRef]
  4. Laurent, B.; Marticorena, B.; Bergametti, G.; Léon, J.; Mahowald, N. Modeling mineral dust emissions from the sahara desert using new surface properties and soil database. J. Geophys. Res. Atmos. 2008, 113, D14218. [Google Scholar] [CrossRef] [Green Version]
  5. Huneeus, N.; Schulz, M.; Balkanski, Y.; Griesfeller, J.; Prospero, J.; Kinne, S.; Bauer, S.; Boucher, O.; Chin, M.; Dentener, F.; et al. Global dust model intercomparison in AeroCom phase I. Atmos. Chem. Phys. 2011, 11, 7781–7816. [Google Scholar] [CrossRef] [Green Version]
  6. Hassane, B.; Durand, A.; Garba, Z.; Dieppois, B.; Sebag, D.; Rajot, J.-L.; Diedhiou, A.; Ngatcha, B.N.; Traore, A. Can daily meteorological measurement of near-surface wind detect climate changes in the Sahel (SE Niger, 1950e1992)? J. Arid. Environ. 2016, 124, 91–101. [Google Scholar] [CrossRef]
  7. Touréa, A.; Tidjani, A.; Rajot, J.; Marticorena, B.; Bergametti, G.; Bouet, C.; Ambouta, K.; Garba, Z. Dynamics of wind erosion and impact of vegetation cover and land use in the Sahel: A case study on sandy dunes in southeastern Niger. Catena 2019, 177, 272–285. [Google Scholar]
  8. Adenira, F.O.; Musa, S.Y.; Johnson, A.O. Statistical Modelling of Atmospheric Mean Temperature in sub-Sahel West Africa. Sci. Afr. 2019, 7, e00254. [Google Scholar]
  9. Huber, S.; Fensholt, R. Analysis of teleconnections between AVHRR-based sea surface temperature and vegetation productivity in the semi-arid Sahel. Remote Sens. Environ. 2011, 115, 3276–3285. [Google Scholar] [CrossRef]
  10. Janicot, S. A comparison of Indian and African monsoon variability at different time scales. Comptes Rendus Geosci. 2009, 341, 575–590. [Google Scholar] [CrossRef]
  11. Dirk, S.; Schütz, L.; Kandler, K.; Ebert, M.; Weinbruch, S. Bulk composition of northern African dust and its source sediments. Earth-Sci. Rev. 2013, 116, 170–194. [Google Scholar]
  12. Olauson, J. ERA5: The new champion of wind power modelling? Renew. Energy 2018, 126, 322–331. [Google Scholar] [CrossRef] [Green Version]
  13. Wang, C.; Graham, R.M.; Wang, K.; Gerland, S.; Granskog, M.A. Comparison of ERA5 and ERA-Interim near-surface air temperature, snowfall and precipitation over Arctic sea ice: Effects on sea ice thermodynamics and evolution. Cryosphere 2019, 13, 1661–1679. [Google Scholar] [CrossRef] [Green Version]
  14. Nouaceur, Z. Sand winds in saharan and sub-saharan africa. Ann. Valahia Univ. Târgovişte Geogr. Ser. 2005, Tome 4-5, 108–118. [Google Scholar]
  15. Suraud, P. Hydrological Yearbook of France; The Intertropical Front in West Africa: Abuja, Nigeria, 1954. [Google Scholar]
  16. Fontaine, B.; Roucou, P.; Camara, M.; Vigaud, N.; Konaré, A.; Diedhiou, A.; Janicot, S. Rainfall variability, climate change and regionalization in the African monsoon region. Meteorology 2002, 41–48. [Google Scholar]
  17. Capot-Rey, R. Recent studies on the climate of North Africa and the Sahara. Ann. Geogr. 1946, 39–48. [Google Scholar] [CrossRef]
  18. Deme, A.; Gaye, A.T.; Hourdin, F. Climate projections for West Africa. IRD Ed. 2015, 61–87. [Google Scholar]
  19. Rome, S.; Oueslati, B. Heat waves in the sahel: Definition and main spatio-temporal characteristics (1973–2014). Colloq. Int. Climatol. Assoc. 2016, 345–350. [Google Scholar]
  20. Tadé, V. Modelling the Spatial and Temporal Variability of Surface Temperature for a Homogeneous Soil with Relief. Ph.D. Thesis, Institut Universitaire des Systèmes Thermiques Industriels, Marseille, France, 2004. [Google Scholar]
  21. Mahrer, Y. A theoretical study of the effect of soil surface shape upon the soil. Soil Sci. 1982, 6, 381–387. [Google Scholar] [CrossRef]
  22. Jansson, P.E. Simulation Model for Soil Water and Heat Conduction—Description of Soil Model. Ph.D. Thesis, Department of Soil Science, Uppsala, Sweden, 1998. [Google Scholar]
  23. Vischel, T.; Thierry, L.; Panthou, G.; Quantin, G.; Rossi, A.; Martinet, M. The return of a wet period in the Sahel: Observations and perspectives. Obs. Prospect. 2015, 43–60. [Google Scholar]
  24. Sultan, B.; Janicot, S. The west african monsoon dynamics. part ii: The ’preonset’ and ’onset’ of the summer monsoon. J. Clim. 2003, 16, 3407–3427. [Google Scholar] [CrossRef]
  25. Benjamin, S.; Serge, J.; Philippe, D. Characterization of the diurnal cycle of the west african monsoon around the monsoon onset. J. Clim. 2007, 20, 4014–4032. [Google Scholar]
  26. Sultan, B.; Labadi, K.; Guégan, J.-F.; Janicot, S. Climate drives the meningitis epidemics onset in west africa. PLoS Med. 2005, 2, e6. [Google Scholar] [CrossRef] [Green Version]
  27. Caccia, J.-L.; Guenard, V.; Benech, B.; Campistron, B.; Drobinski, P. Vertical velocity and turbulence aspects during Mistral events as observed by UHF wind profilers. Ann. Geophys. 2004, 22, 3927–3936. [Google Scholar] [CrossRef] [Green Version]
  28. Kasbadji, M.N.; Mustapha, M.; Boumeddiene, B. Vertical Wind Speed Profile in the Lower Atmospheric Boundary Layer. In Proceedings of the 13th International Thermal Days, Albi, France, 28–30 August 2007. [Google Scholar]
  29. Rosema, A. Comparison of Meteosat-based rainfall and evapotranspiration mapping in the Sahel region. Int. J. Remote Sens. 1990, 11, 2299–2309. [Google Scholar] [CrossRef]
  30. Miloud, S.B.; Xavier, C.; Belkacem, Z. Numerical modelling of evaporation in laminar forced convection of a liquid film trickling over an inclined plate. In Proceedings of the 13th International Thermal Days, Albi, France, 28–30 August 2007; pp. 1–5. [Google Scholar]
  31. Zhang, G.; Cook, K.H. West African monsoon demise: Climatology, interannual variations, and relationship to seasonal rainfall. J. Geophys. Res. Atmos. 2014, 119, 10175–10193. [Google Scholar] [CrossRef]
  32. NASA. NASA Jet Propulsio Laboratory. 4 October 2015. [En Ligne]. Available online: https://smap.jpl.nasa.gov/news/1250/smap-soil-moisture-data-available-at-nasa-national-snow-and-ice-data-center/ (accessed on 20 June 2020).
  33. Anyamba, A.; Tucker, C.J. Analysis of Sahelian vegetation dynamics using NOAA-AVHRR NDVI data from 1981–2003. J. Arid. Environ. 2005, 63, 596–614. [Google Scholar] [CrossRef]
  34. Deckers, J.; Spaargaren, O.; Dondeyne, S. Soil survey as a basis for land evaluation. Land Use Land Cover. Soil Sci. 2002, 2, 29–58. [Google Scholar]
  35. Kumar, L.; Rietkerk, M.; van Langevelde, F.; van de Koppel, J.; van Andel, J.; Hearne, J.; de Ridder, N.; van de Koppel, J.; van Andel, J.; Hearne, J.; et al. Relationship between vegetation growth rates at the onset of the wet season and soil type in the Sahel of Burkina Faso: Implications for resource utilisation at large scale. Ecol. Model. 2002, 149, 143–152. [Google Scholar] [CrossRef] [Green Version]
  36. Ndehedehe, C.E.; Agutu, N.O.; Ferreira, V.G.; Getirana, A. Evolutionary drought patterns over the Sahel and their teleconnections with low frequency climate oscillations. Atmos. Res. 2020, 233, 104700. [Google Scholar] [CrossRef] [Green Version]
  37. Kim, D.; Chin, M.; Remer, L.A.; Diehl, T.; Bian, H.; Yu, H.; Brown, M.E.; Stockwell, W.R. Role of surface wind and vegetation cover in multi-decadal variations of dust emission in the Sahara and Sahel. Atmos. Environ. 2017, 148, 282–296. [Google Scholar] [CrossRef]
  38. Monerie, G.M. Climate Change in the African Monsoon Region: Evolution of Rainfall and Atmospheric Fields CMIP3 and CMIP5 Simulations under Scenario A1B and rcp45 (1960–1999, 2031–2070). Ph.D. Thesis, University of Bourgogne, Dijon, France, 2014. [Google Scholar]
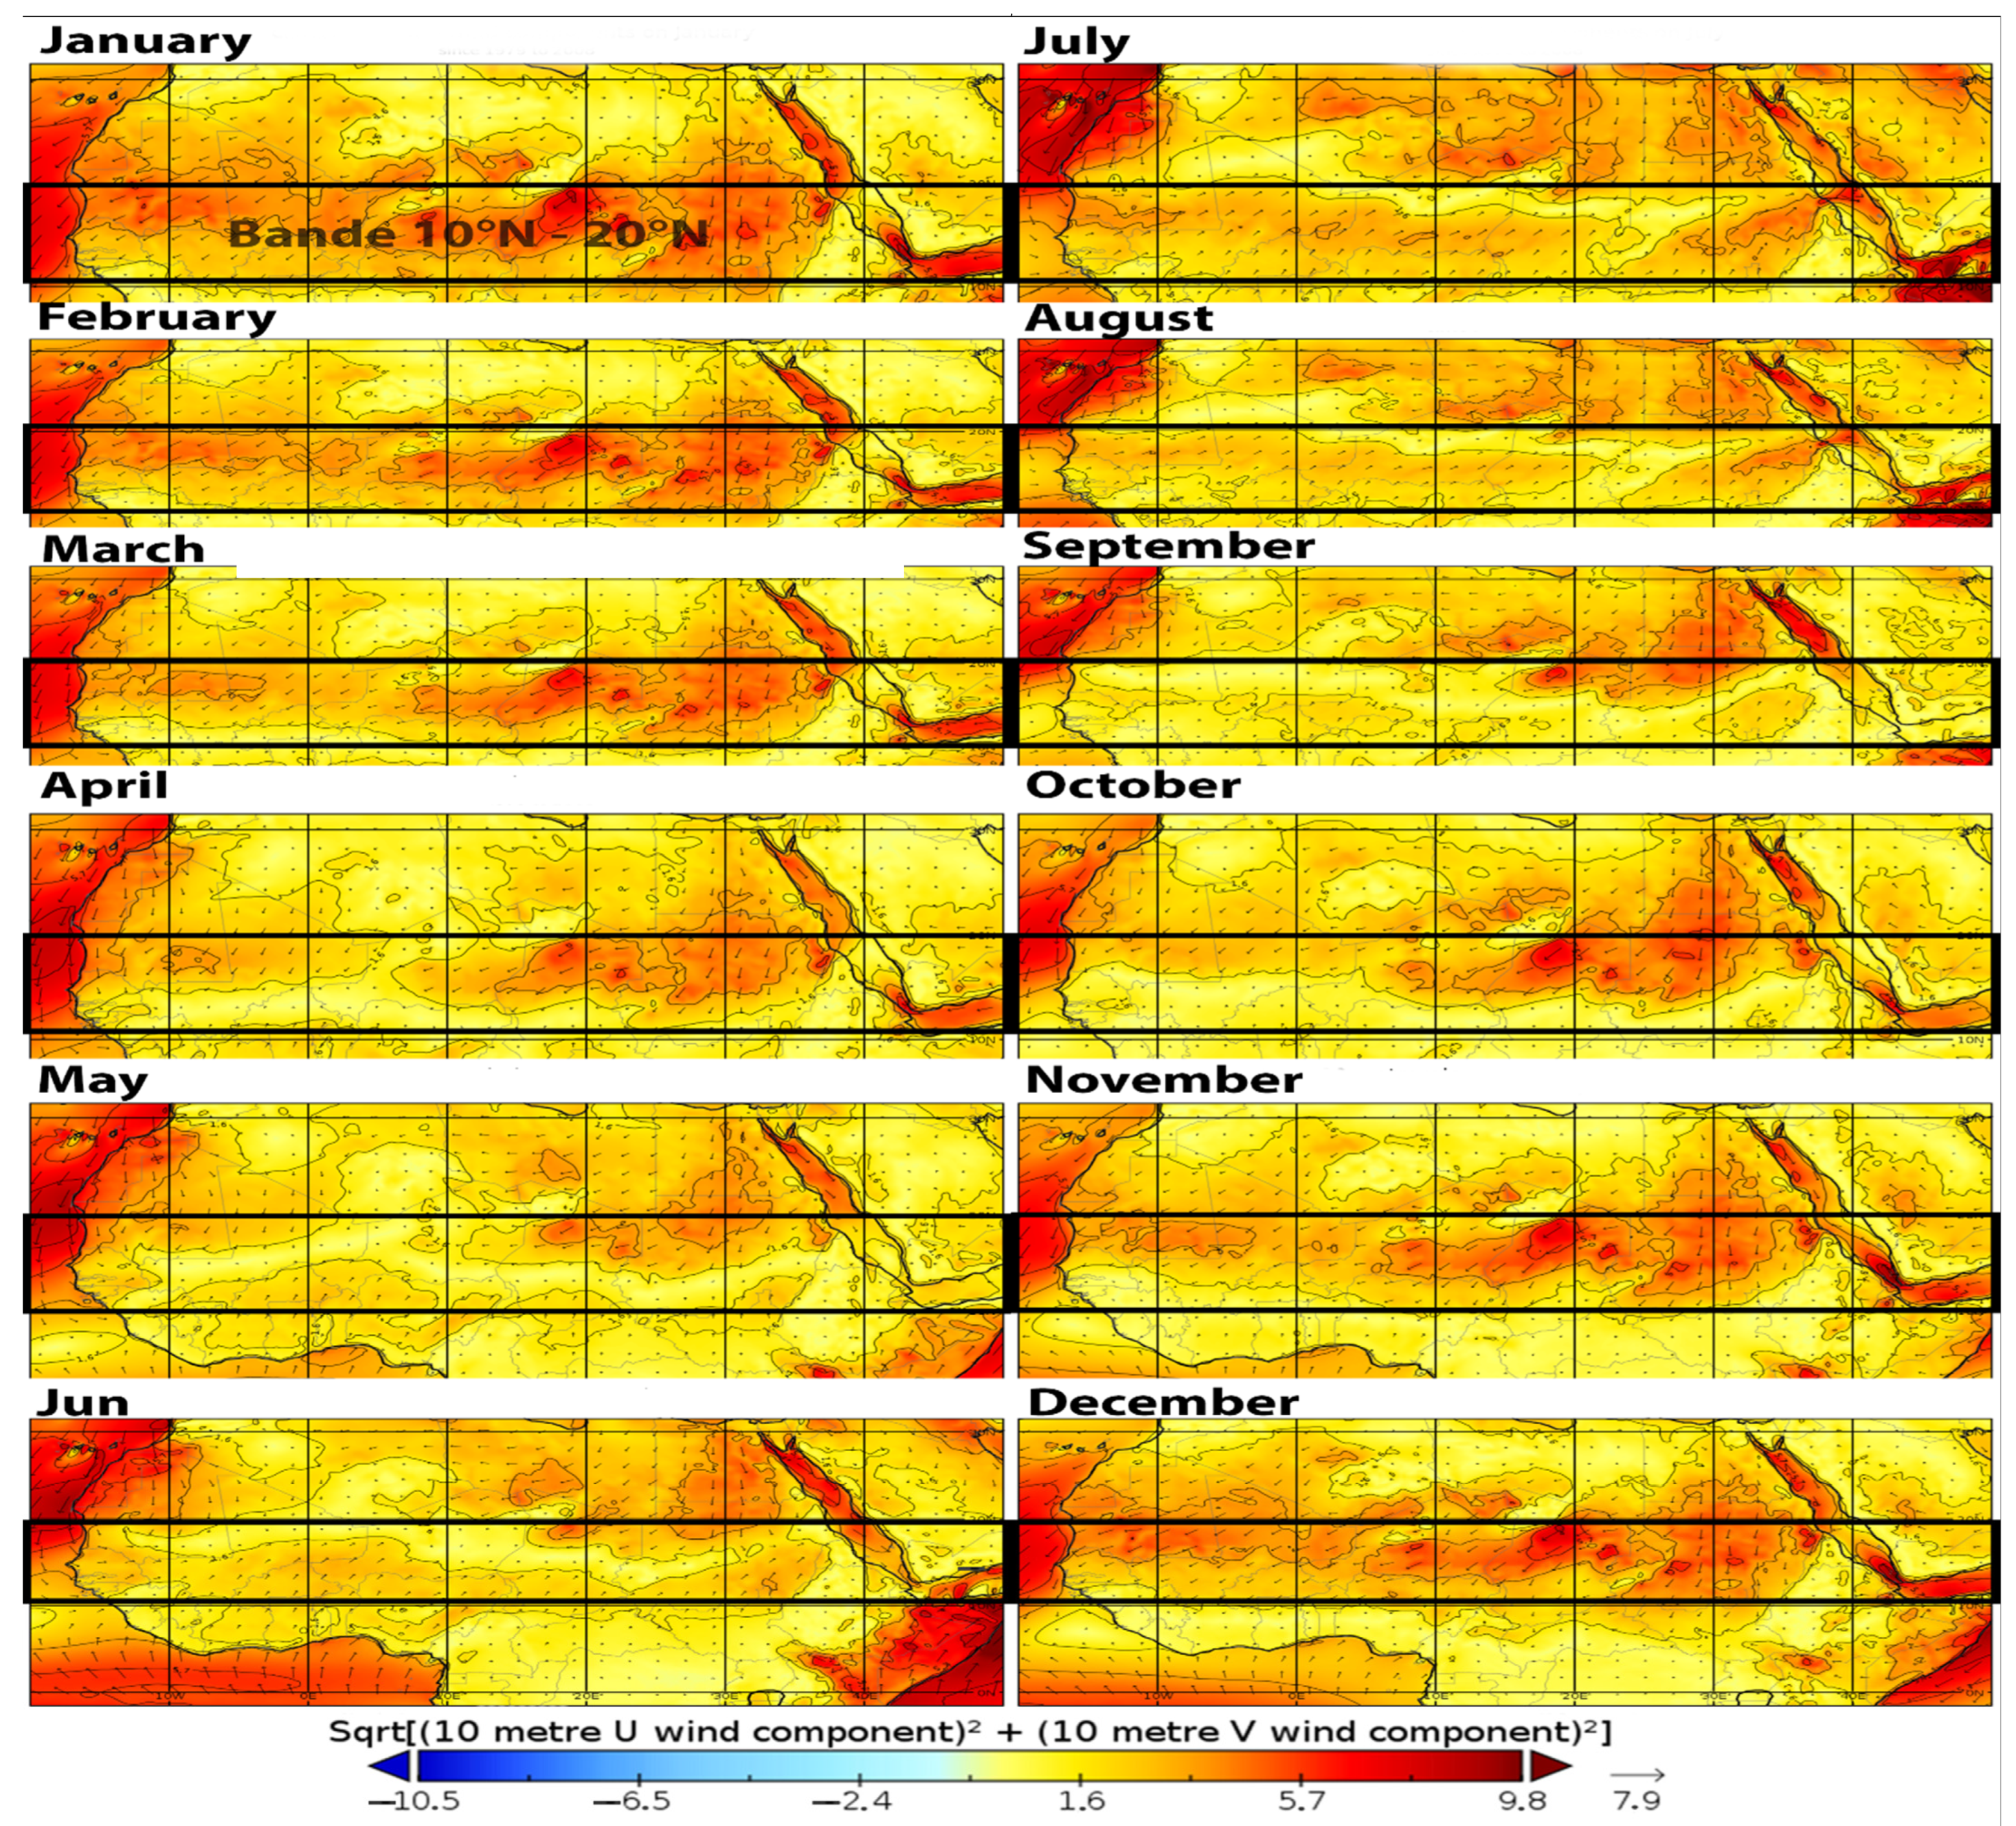
Figure 1. Monthly average wind climatology at 10 from 1979 to 2008 (4D-Var ERA5) m s−1 with a resolution of 0.5 × 0.5 degrees data from the ERA5 platform.
Atmosphere 13 01083 g001
Figure 2. Climatology in monthly mean 2 meter temperature (4D-Var ERA5) °Kelvin from 1979 to 2008 with a resolution of 0.5 × 0.5 degrees. Data from the ERA5 platform.
Atmosphere 13 01083 g002
Figure 3. Climatology in monthly average of total precipitation from 1979 to 2008 (4D-Var ERA5) with a resolution of 0.5 × 0.5 degrees. Data from the ERA5 platform.
Atmosphere 13 01083 g003
Figure 4. Climatology in monthly average vertical velocity (4D-Var ERA5) in Pa s−1 from 1979 to 2008 with a resolution of 0.5 × 0.5 degrees. Data from the ERA5 platform.
Atmosphere 13 01083 g004
Figure 5. Climatology in monthly mean (4D-Var ERA5) vorticity in s−1 from 1979 to 2008 with a resolution of 0.5 × 0.5 degrees. Data from the ERA5 platform.
Atmosphere 13 01083 g005
Figure 6. Monthly average evaporation climatology (4D-Var ERA5) in m water equivalent from 1979 to 2008 with a resolution of 0.5 × 0.5 degrees. Data from the ERA5 platform.
Atmosphere 13 01083 g006
Figure 7. Climatology of monthly mean evapotranspiration (4D-Var ERA5) in m water equivalent 1979 to 2008, with a resolution of 0.5 × 0.5 degrees. Data from the ERA5 platform.
Atmosphere 13 01083 g007
Figure 8. Pressure forces (following (𝑂𝑥)) on a plot.
Atmosphere 13 01083 g008
Figure 9. Equivalence between pressure and altitude differences: points A and B are at the same altitude, A and C at the same pressure. The pressure at B is therefore higher than at C.
Atmosphere 13 01083 g009
Figure 10. Monthly average climatology of the Geopotential (4D-Var ERA5) in m2 s−2 from 1979 to 2008 with a resolution of 0.5 × 0.5 degrees. Data from the ERA5 platform.
Atmosphere 13 01083 g010
Figure 11. Climatology of the volumetric soil water level (4D-Var ERA5) in m3 s−3, from 1979 to 2008 with a resolution of 0.5 × 0.5 degrees. Data from the ERA5 platform.
Atmosphere 13 01083 g011
Figure 12. Climatology of lowland land cover evolution (4D-Var ERA5), 1979 to 2008 with a resolution of 0.5 × 0.5 degrees. Data from the ERA5 platform.
Atmosphere 13 01083 g012
Figure 13. Climatology of soil types (4D-Var ERA5) from 1979 to 2008 with a resolution of 0.5 × 0.5 degrees. Data taken from the ERA5 platform.
Atmosphere 13 01083 g013
Figure 14. Principal component analysis of the climatology of the studied parameters according to the normalized grid maximums. Top figure (a) represents the graph of the variables. Bottom figure (b) represents the graph of the individuals.
Atmosphere 13 01083 g014
Figure 15. Eigenvalue diagram of the PCA associated with the climatology of the studied parameters.
Atmosphere 13 01083 g015
Figure 16. Diagram of the contribution of the variables in the PCA of the climatology of the studied parameters in relation to the second dimension.
Atmosphere 13 01083 g016
Figure 17. Diagram of the contribution of individuals in the PCA associated with the climatology of the parameters studied in relation to dimensions 1, 2 and 3.
Atmosphere 13 01083 g017
Figure 18. Map of African landforms from: https://sanfordbernice.blogspot.com/2020/07/afrique-carte-relief.html accessed on 1 January 2022.
Atmosphere 13 01083 g018
Figure 19. Schematic map summarizing the uplift process from the Ouaddaï plateau in Chad to Senegal.
Atmosphere 13 01083 g019
Table 1. Volumetric properties of soil types.
Soil TypesVolumetric Properties
Sandy soil0.4 < ϴs < 0.5 m3m−3
Silty-sandy soil0.3 < ϴs < 0.4 m3m−3
Clay soil0.6 m3m−3
Table 2. Summary of soil types in the 10–20 African band.
Soil IndicesSize of the Sand Grains
1Rough
2Medium
3Medium fine
4Fine
5Very fine
6Organic
7Tropical organic
0Indicates a non-terrestrial point. This parameter does not vary over time.
Publisher’s Note: MDPI stays neutral with regard to jurisdictional claims in published maps and institutional affiliations.