Article

Functional Kriging for Spatiotemporal Modeling of Nitrogen Dioxide in a Middle Eastern Megacity

by
Elham Ahmadi Basiri
1,2,
Seyed Mahmood Taghavi-Shahri
3,
Behzad Mahaki
1,4,* and
Heresh Amini
3
1
Department of Epidemiology and Biostatistics, School of Health, Isfahan University of Medical Sciences, Isfahan 8174673461, Iran
2
Student Research Committee, School of Health, Isfahan University of Medical Sciences, Isfahan 8174673461, Iran
3
Section of Environmental Health, Department of Public Health, University of Copenhagen, 1014 Copenhagen, Denmark
4
Department of Biostatistics, School of Health, Kermanshah University of Medical Sciences, Kermanshah 6715847141, Iran
*
Author to whom correspondence should be addressed.
Atmosphere 2022, 13(7), 1095; https://doi.org/10.3390/atmos13071095
Submission received: 1 June 2022 / Revised: 29 June 2022 / Accepted: 1 July 2022 / Published: 12 July 2022
(This article belongs to the Special Issue Spatio-Temporal Analysis of Air Pollution)

Abstract

:
Long-term hour-specific air pollution exposure estimates have rarely been of interest in epidemiological research. However, this can be relevant for studies that aim to estimate the residential exposure for the hours that subjects mostly spend time there, or for those hours that they may work in another location. Here, we developed a model by spatially predicting the long-term diurnal curves of nitrogen dioxide ( NO 2 ) in Tehran, Iran, one of the most polluted and populated megacities in the Middle East. We used the statistical framework of functional data analysis (FDA) including ordinary kriging for functional data (OKFD) and functional analysis of variance (fANOVA) for modeling. The long-term NO 2 diurnal curves had two distinct maxima and minima. The absolute minimum value of the city average was 40.6 ppb (around 4:00 p.m.) and the absolute maximum value was 52.0 ppb (around 10:00 p.m.). The OKFD showed the concentrations, the diurnal maximum/minimum values, and their corresponding occurring times varied across the city. The fANOVA highlighted that the effect of population density on the NO 2 concentrations is not constant and depends on time within the diurnal period. The provided estimation of long-term hour-specific maps can inform future epidemiological studies to use the long-term mean for specific hour(s) of the day. Moreover, the demonstrated FDA framework can be used as a set of flexible statistical methods.

1. Introduction

Air pollution is one of the main health and environmental problems of the new civilized world at the global level [1,2]. It is revealed that air pollution has a serious toxicological effect on human health [3,4]. Transportation, power plants, and natural processes have led to humans and ecosystems faced with serious air quality issues [4,5]. Many acute and chronic impacts on human health and even death may be caused by exposure to high levels of air pollutants [6,7]. The World Health Organization (WHO) reported around 4.2 million yearly deaths due to exposure to air pollution worldwide [8].
Nitrogen oxides are a group of highly reactive gases and important air pollutants that affect acids, the formation of photochemical oxidants, and the concentration of hydroxyl radicals [9]. Nitrogen dioxide is one of the nitrogen oxides that are primarily released into the air from combustion [3]. Its main emission sources are power plants, cars, trucks, and buses [10,11]. The exposure to its high concentration can cause cardiovascular diseases and irritation in the human respiratory system, particularly asthma and respiratory symptoms such as difficulty breathing, coughing, and wheezing [12,13].
In different studies, the concentration of air pollution has been assessed by measuring or predicting at monitoring stations using various modeling methods [5,6,7,8,9,10,11,12]. The accurate prediction of air pollution improves the protection strategy of the affected population and helps manage the air quality control system effectively. Spatial interpolation tools such as kriging methods have been widely used to estimate the spatial distribution of pollutants and predict airborne pollutant concentrations using geo-statistical analysis in previous studies [1,8,10,14]. These methods estimate the air pollutant concentrations at unmonitored locations by considering the information on the geographic positions of the recorded data points and the correlation between the measurement points [14]. Various geo-statistical methods have been applied in the literature such as regression kriging for ozone and NO 2 in Japan [15]; mapping occurring of high concentrations of air pollution with indicator kriging for PM 10 and CO in Tehran [1]; modeling the spatial distribution of two-year averages of several air pollutants using ordinary kriging, universal kriging, and co-kriging with Gaussian semi-variogram in Tehran [16]; and the spatio-temporal modeling of daily fine particulate matter in the megacity of Tehran [17]. However, all of the aforementioned geo-statistical studies are for modeling scalar observations and not curves or functions that result from successive measurements of data [18,19]. Functional data analysis (FDA), which was introduced to model the so-called functional data, generally made of curves indexed over the time domain, has been used to model and predict this type of data by smoothing methods since the beginning of the 1990s. This technique has been applied in different fields of spatial statistics such as air quality studies. Goulard and Voltz proposed a functional kriging approach for predicting curves at unmeasured locations. Ignaccolo carried out kriging with external drift to predict the curves of particulate matter concentration in the Piemonte region (Italy) where they employed a multivariate functional principal component analysis for air quality zoning [20,21]. Furthermore, Wang et al. used a functional spatio-temporal model to study the intra-day variation of the diurnal ozone pollutant in Beijing, China [22].
The Middle Eastern megacity of Tehran is the capital of Iran and has serious air pollution due to urbanization, high traffic, and emissions from industrial production activities [17,23,24]. The average monthly, seasonal, and annual concentrations of NO 2 in Tehran have been spatially modeled and reported in previous studies [23,25]. However, a spatiotemporal model for the long-term NO 2 concentrations that capture the intra-day fluctuation has not been developed yet.
To date, the majority of epidemiological studies on the long-term health effects of air pollution, has overlooked the intra-day variation of long-term air pollution. More commonly, studies have used exposure estimates for the annual averages of pollutants or daily averages over one or several years [2,26,27,28,29,30,31,32,33,34]. However, people spend time in different locations, mostly at home and work. Thus, it might be better to limit the long-term exposure estimates for each geographical location to the corresponding time that people mostly spent there. Furthermore, the intra-day changes in pollutant concentrations may vary between different geo-locations in the study area, which means that the spatial distribution of exposure can change during the day [22]. Hence, models that overlook the intra-day variation of long-term air pollutants in epidemiological studies could potentially result in exposure misclassification.
Here, we developed a flexible statistical model that considers the intra-day changes of long-term nitrogen dioxide in the megacity of Tehran. The developed model could benefit future epidemiological studies in this highly populated and polluted Middle Eastern megacity. We benefited from the statistical framework of functional data analysis that enables flexibility in modeling the intra-day variation. Furthermore, due to the possible effect of population density on the NO 2 concentrations [35], we also studied its effect on the intra-day variation of long-term NO 2 concentrations.

2. Materials and Methods

2.1. Study Area

Tehran is the capital of Iran with a populated area of about 613 km 2 and a residential population of about 8.2 million and a daytime population of more than 10 million due to diurnal migration. There are towering mountains in its north and in the central desert of the country in its south. Tehran’s weather is typically sunny with an annual daily temperature of 18.5 °C that increases to around 40 °C in July and decreases to around −10 °C in January [23,24,36,37].

2.2. Data

We obtained hourly NO 2 concentrations (in ppb) for one calendar year from March 2014 to March 2015 from 33 air quality monitoring stations administered by the Tehran Air Quality Control Company (AQCC) and the Iranian Department of Environment (DOE). At the monitoring stations, chemiluminescent analyzers (model AC 32 M of Environment SA, France) were used to measure the NO 2 concentrations. The long-term hourly means of NO 2 concentrations were calculated by averaging the data over the calendar year for each hour. The data of 26 monitoring stations were used for model development and the extra seven stations were used for model validations that are indicated by star signs and square signs in Figure 1, respectively. Moreover, the geographical coordinates of the monitoring stations (longitude and latitude) in decimal degrees were obtained from the same two governmental agencies.
The population density variable was categorized into three groups: less than 10,000 persons per square kilometers (low population density), between 10,000 and 20,000 persons per square kilometers (moderate population density), and more than 20,000 persons per square kilometers (high population density). In Figure 1, the green monitoring stations are located in areas with low population densities (seven monitoring stations), yellows are in medium population densities (13 monitoring stations), and reds are located in high population densities (13 monitoring stations). Tehran regions with low population densities are those in -predicted maps inserted in results section with labels of 1, 9, 21, 22; regions with moderate population densities are those with labels of 2 to 6, 12, 16, 18, 19; and regions with high population densities are those with labels of 7, 8, 10, 11, 13 to 15, 17, and 20.

2.3. Kriging for Functional Data

Let χ s t be a curve or a functional random variable that is observed at location s defined over the interval of T as its time domain (e.g., the NO 2 diurnal curve).
χ s t ;   t T , s D R d
Assume that we observe a sample of curves χ s i t defined for t T ,   s i D   ,   i = 1 , , n . In order to predict a curve at an unmonitored site, s 0 , initially, the curves are pre-processed by fitting a set of spline basis functions. After that, the spatial dependence among curves was estimated using the trace-variogram function. Finally, the parameters for performing prediction by ordinary kriging at unmonitored locations were estimated by solving a linear system based on the estimated trace-variogram. This approach defines the best linear unbiased predictor (BLUP) for χ s 0 t given by
χ ^ s 0 t = i = 1 n λ i χ s i t   ,   s . t .   i = 1 n λ i = 1
where the λ i coefficients satify E χ ^ s 0 t   χ s 0 t = 0 and minimize the below equation
E χ ^ s 0 t   χ s 0 t 2 dt = Var χ ^ s 0 t   χ s 0 t dt
Hence, the optimization problem of the OKFD method was as follows
min λ 1 , , λ n Var i = 1 n λ i χ s i t   χ s 0 t dt ,   s . t .   i = 1 n λ i = 1

2.3.1. Expressing Functional Data Using Basis Functions Set

We assumed that each observed functional data can be expressed in terms of a set of basis functions, β 1 t ,   β 2 t , , β K t , by
  χ s i t = l = 1 K a il β l t = a i T β t ,   i = 1 , , n
where a i = a i 1 , , a iK  and  β t = β 1 t ,   β 2 t , , β K t . We used the splines as the underlying set of basis functions to estimate functional data (i.e., diurnal curves of NO 2 concentrations) from the discrete annual means of hourly NO 2 concentrations in each station [21,38].

2.3.2. Estimating the Trace-Variogram

In order to account for auto-correlations in geo-spatial modeling, the trace-variogram was used. The definition of the trace-variogram function for the modeling of spatial functional data is
γ h = 1 2 E χ s i t χ s j t 2 dt ,   h = s i s j  for all  s i ,   s j D  
An adaptation of the classical moment method (MoM) gives the following estimator for this quantity:
  γ h ^ = 1 2 N h i , j N h   χ s i t   χ s j t 2 dt
N h = s i , s j : s i s j = h
where N h is the number of distinct elements in N(h). Once the trace-variogram was estimated for a sequence of distance values of h by the moment method, we fitted parametric models including spherical, Gaussian, exponential, and Matérn by using the ordinary least squares (OLS) method [20].

2.3.3. Choosing the Optimum Number of Basis Functions

The number of basis functions to express the functional data was chosen by cross-validation. Consider the case that the functional data   χ s i t ,   i = 1 , , n , observed at time points of t 1 , , t M , and we wish to approximate them through explanation using a basis functions set. A simple way of establishing an appropriate K, the number of basis functions, can be by calculating the cross-validation SSE in a classical nonparametric sense. Let χ ˜ s i j t j be the estimated functional data at t j   by using some basis functions set when the datum   χ s i t j has been temporarily suppressed from the sample. Then for each K, the cross-validation SSE is calculated by
N P C V K = i = 1 n j = 1 M χ ˜ s i j t j χ s i t j 2  
The strategy was to minimize the NPCV(K) statistic with respect to the K to find the optimum number of basis functions [38,39].

2.3.4. Goodness-of-Fit Criteria

To assess the spatial prediction capability of the developed model, we considered four assessment metrics that were the root mean square error (RMSE), the correlation coefficient between the measured values and the corresponding predicted values, the normalized mean bias factor (NMBF), and the weighted normalized mean square error of the normalized ratios (WNNR) [39].

2.4. Functional Analysis of Variance

We assigned monitoring stations into three groups based on their region’s population density (high, moderate, and low) and compared the mean diurnal curves of NO 2 between these three areas using a functional analysis of variance (FANOVA) [40].

2.5. Software and Packages

The R statistical environment version 4.1.2 [41] that was created by R core team at Vienna, Austria at 2021 was used for data analysis. The “geofd” R package was used for geo-spatial functional modeling and prediction [42]. The “fda” R package was used for general functional data analysis methods including smoothing by expansion using a set of basis functions, and the functional analysis of variance [43].

3. Results

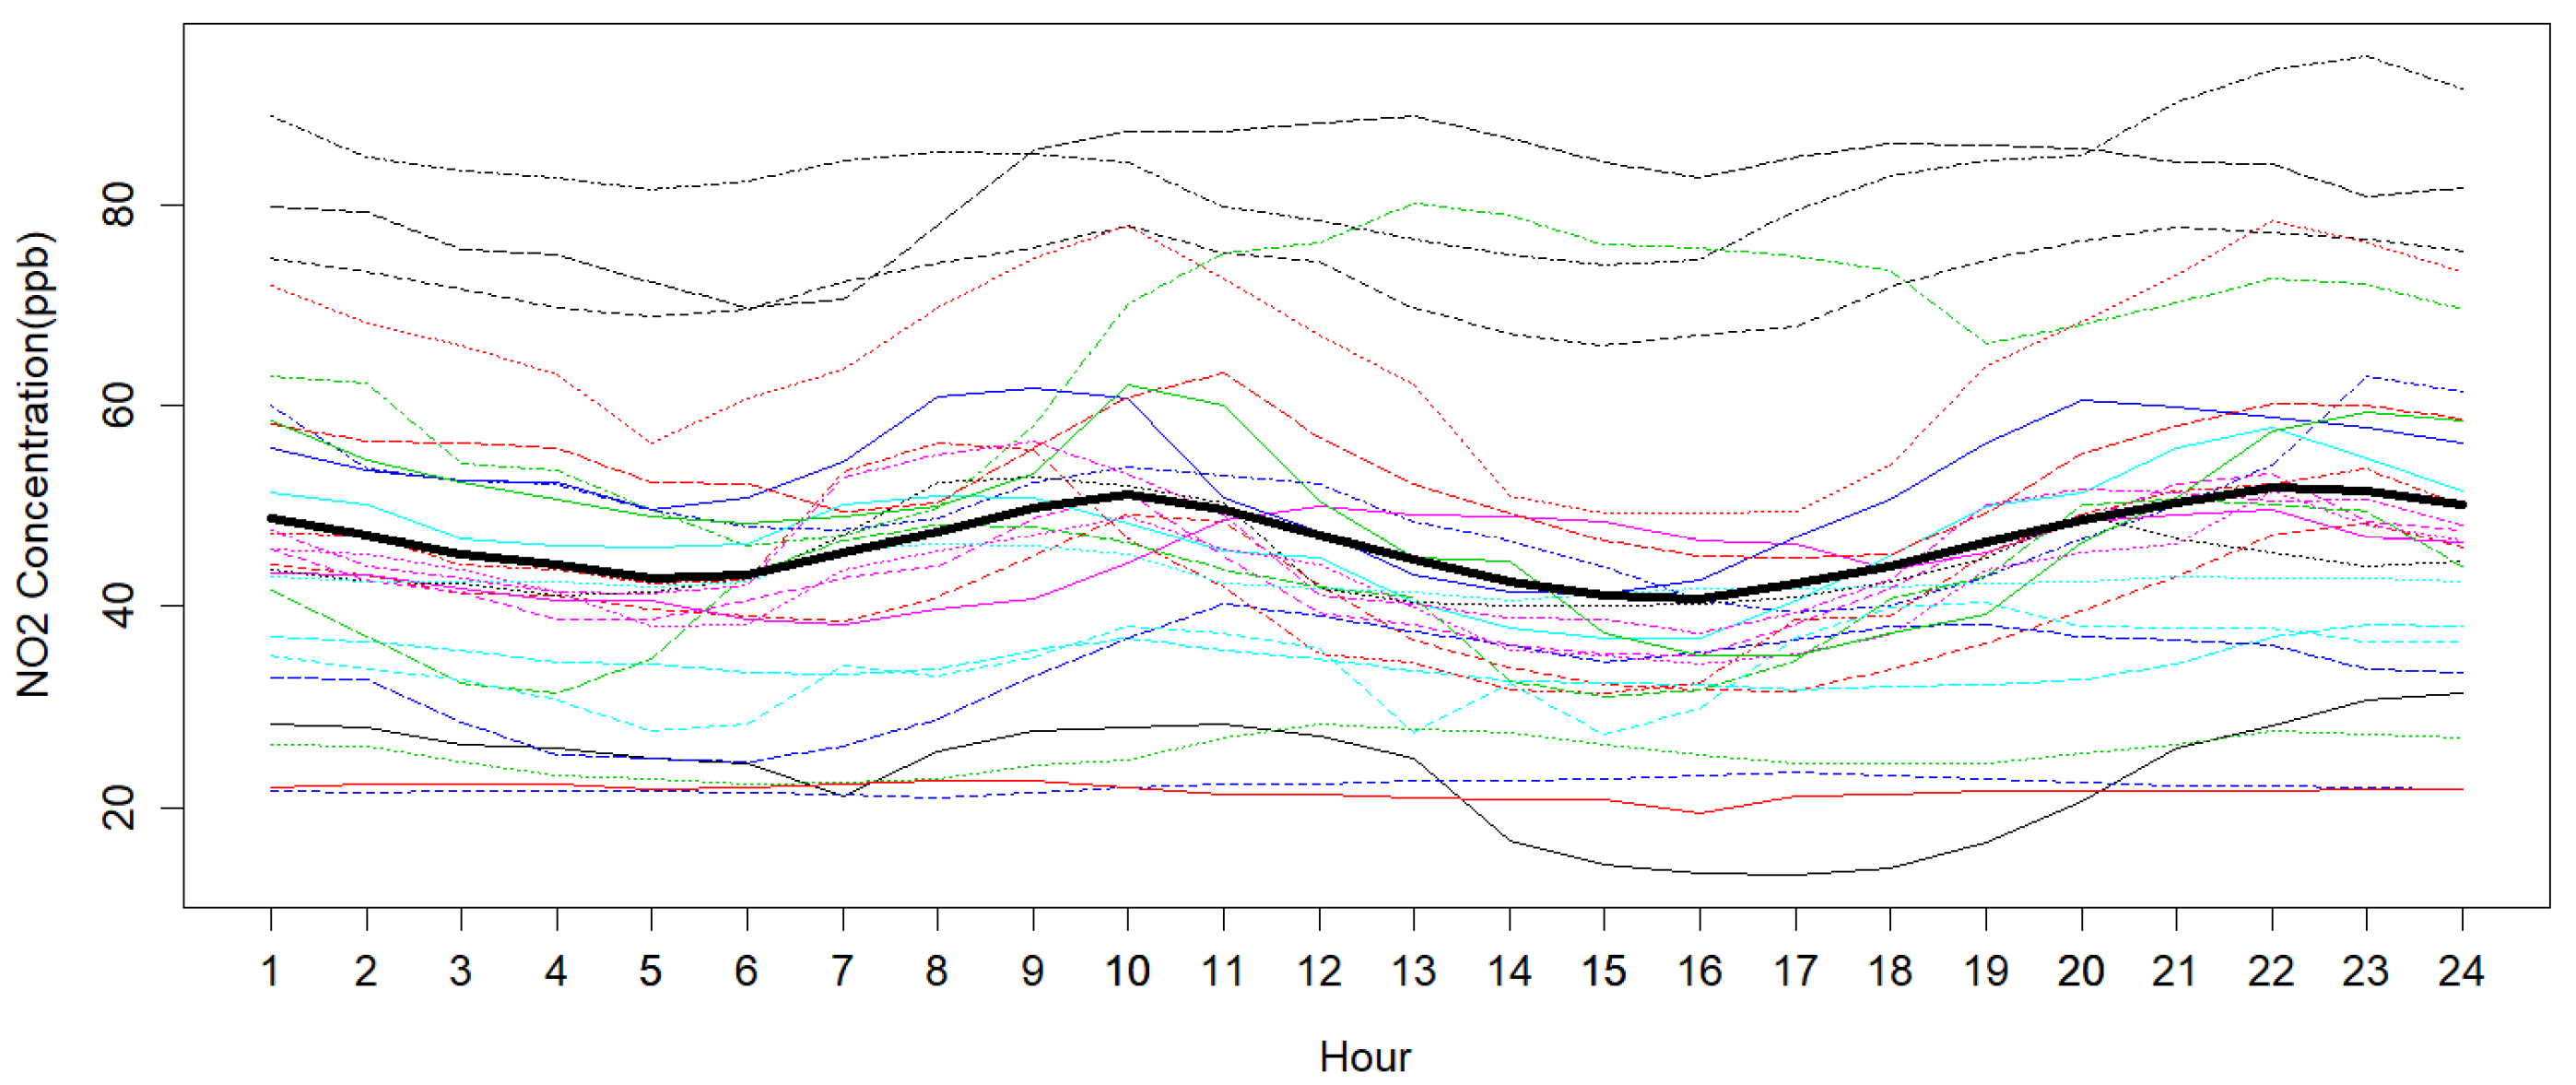
The smoothed diurnal curves of NO 2 in 26 model-training stations are presented in Figure 2. They show that the long-term yearly average of NO 2 concentrations varied between 13.28 to 91.46 ppb during a diurnal time period. Moreover, it highlights the heterogeneity in the values and shapes of the NO 2 diurnal curves.
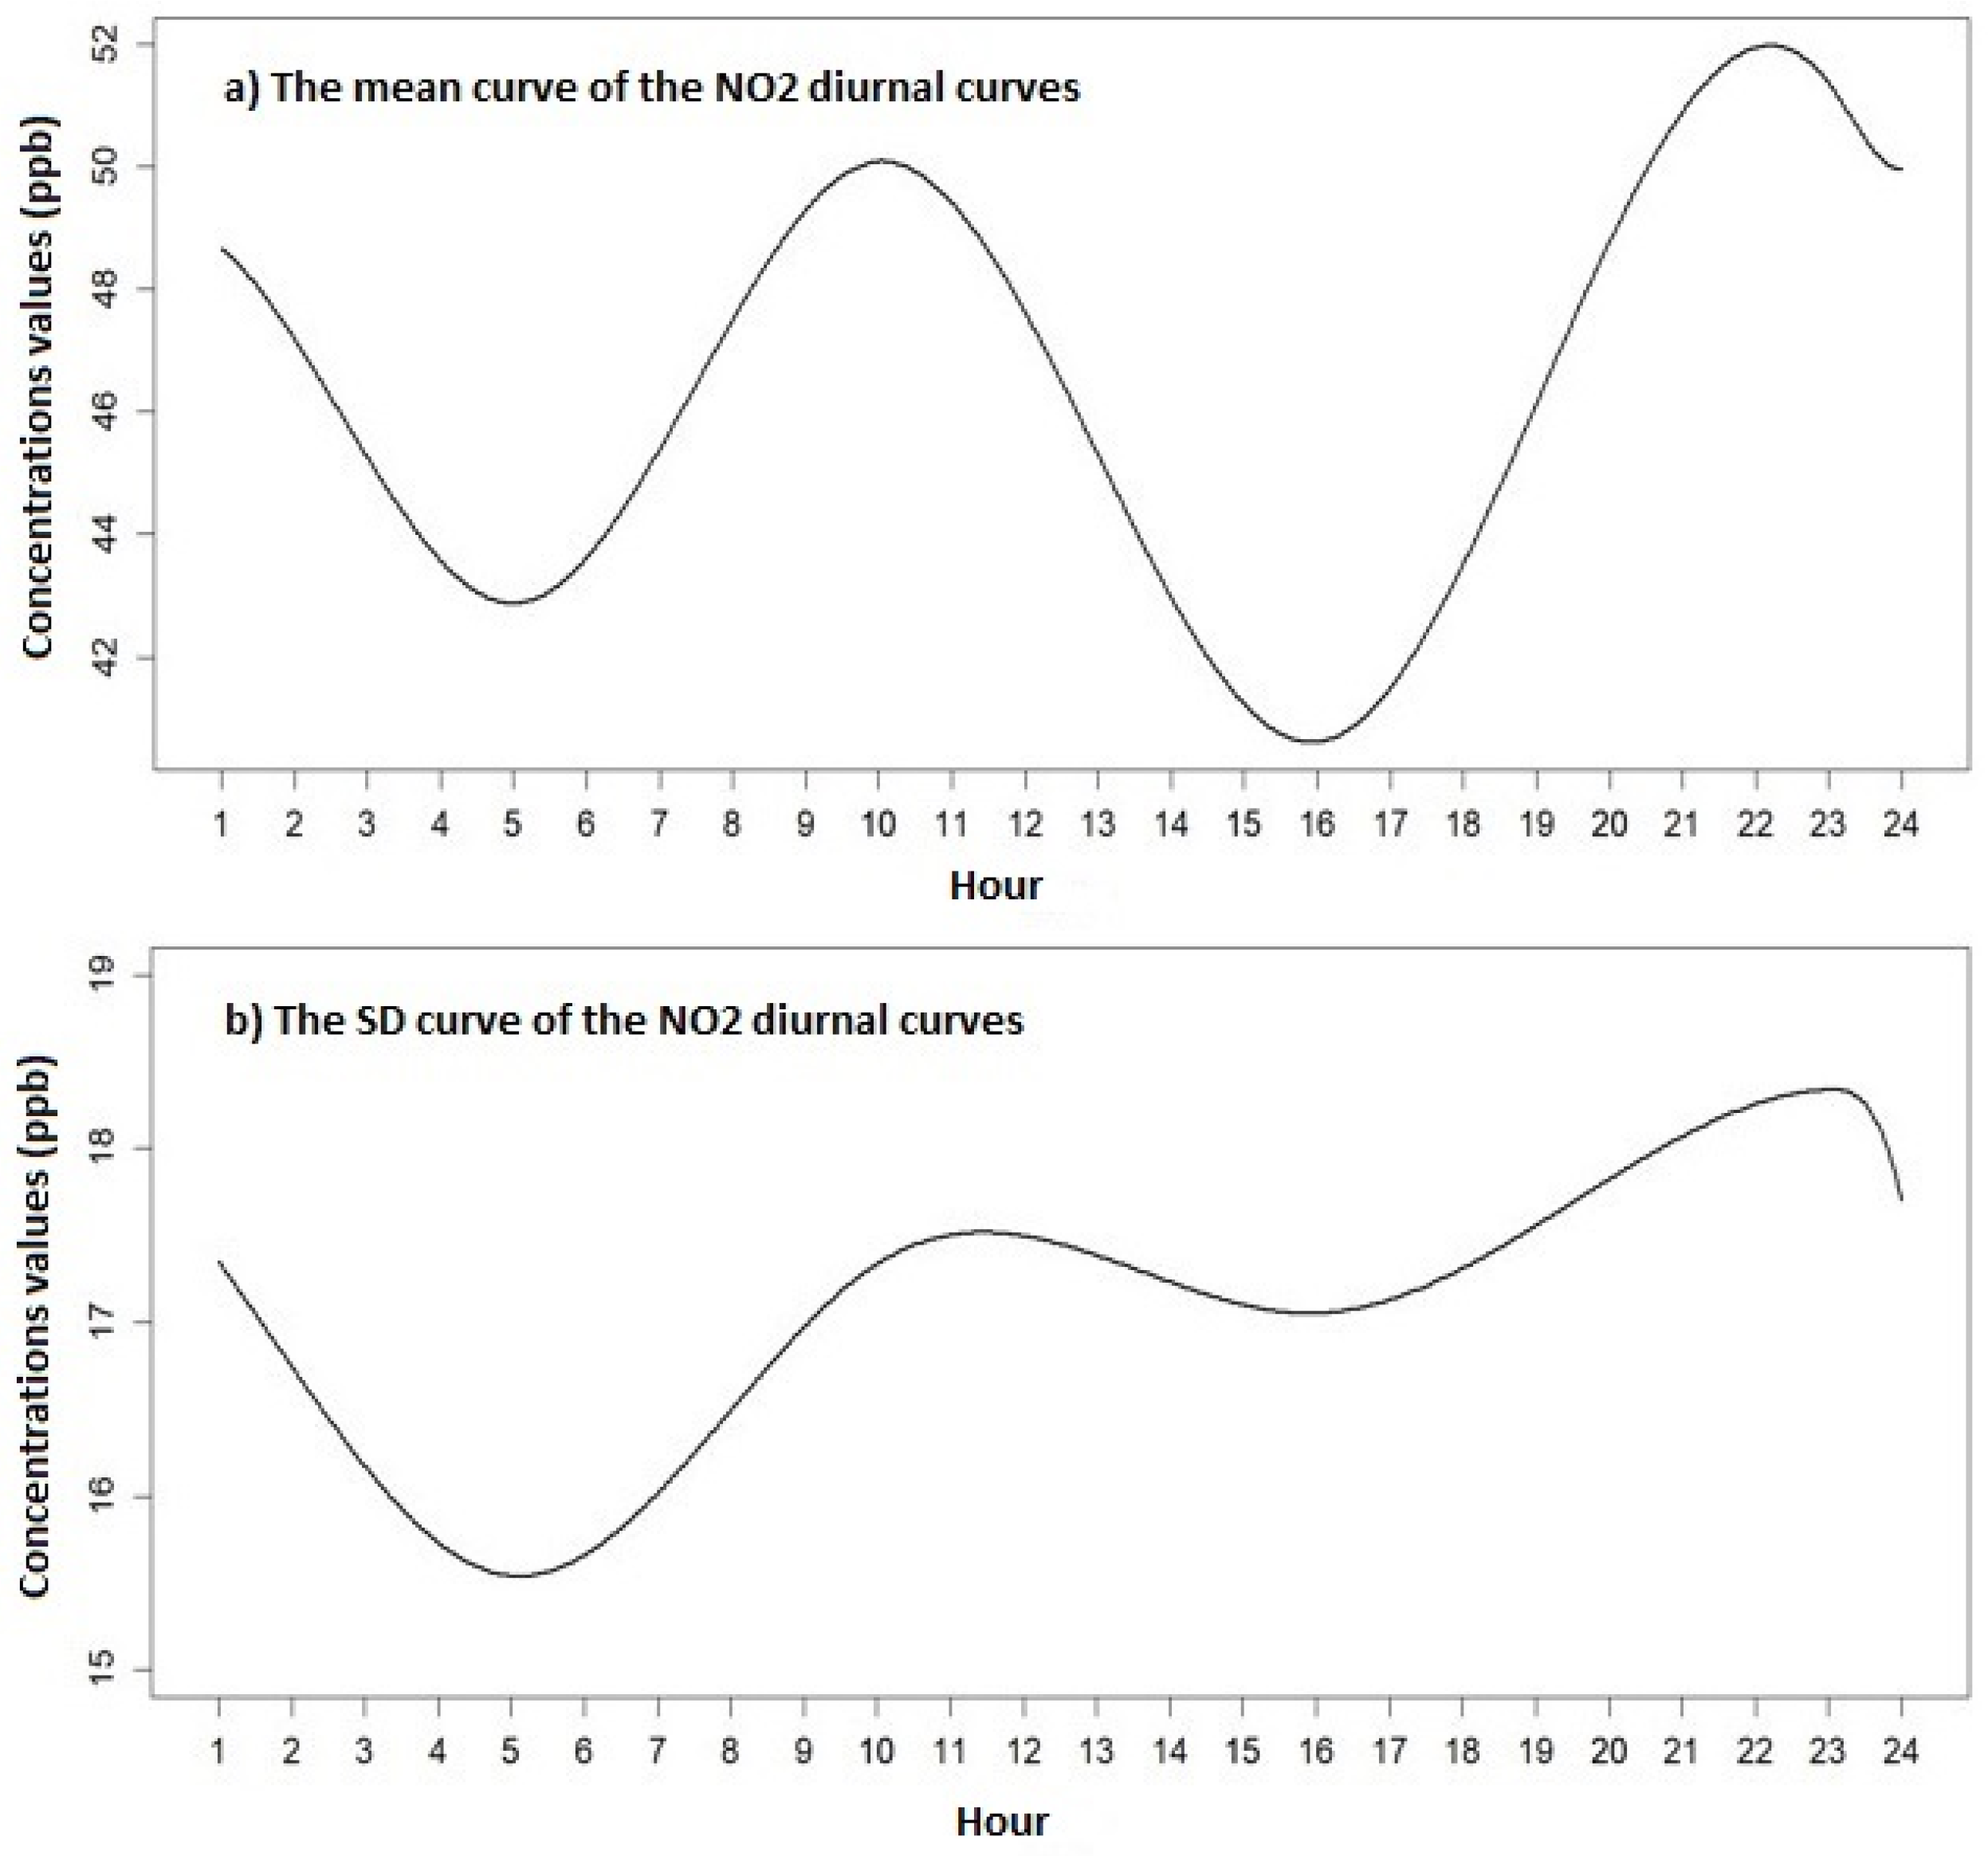
According to Figure 2, the curves changed abruptly at hours of about 5, 10, 16, 22, thus, we placed four knots at these time points in the smoothing stage. On the other hand, we chose an order of four splines (a cubic spline basis system), so that the number of basis functions was 8. Descriptive statistics (mean and standard deviation curves) of the smoothed NO 2 diurnal curves are presented in Figure 3.
Based on the results presented in Figure 3a, one can see that there were two minima and two maxima in the NO 2 mean diurnal curve, which was calculated across all monitoring stations, during. These maxima occurred in the morning between 9:43 a.m. and 10:22 a.m. (local maximum was 50.09 ppb at 10.02 a.m.) and in the late night between 9:54 p.m. and 10:28 p.m. (absolute maximum was 51.97 ppb at 10:12 p.m.). The local minimum concentration of NO 2 across all monitoring stations occurred in the morning between 4:47 a.m. and 5:24 a.m. (42.87 ppb at 4:59 a.m.) and the absolute minimum concentration occurred in the evening between 3:35 p.m. and 4:14 p.m. (40.61 ppb at 3:55 p.m.). The standard deviation curve (Figure 3b) mostly followed the trend of the mean curve (Figure 3a). However, the absolute minimum value occurred in the early morning (around 5 a.m., which coincided with the local minimum of the mean curve) and its local minimum occurred in the afternoon (around 4 p.m., which coincided with the absolute minimum of the mean curve). Hence, one could expect a more homogenous situation between NO 2 diurnal curves in different areas of Tehran in the early mornings.
The results of the trace-variogram fitted models are shown in Table 1. Based on the RMSE metric, we can observe that the best model for spatial auto-correlations (the model with the lowest RMSE value) was the spherical model. Hence, the equation of the trace-variogram is:
γ h = 5083.0897 + 8314.3153   1.5 h 0.0864 , 0 < h 0.0864 8314.3153 , h > 0.0864
Based on Table 1, the value of spatial structure criteria was Sill Sill + Nug = 12 , 943.076 12 , 943.076 + 8184.138 = 0.612 , so there was a notable spatial auto-correlation between the data (the criteria were more than 0.5).
Table 2 shows the goodness-of-fit metrics in seven validation-monitoring stations. Predictions were generally good with a slight overestimation in three out of seven monitoring stations (see NMBF). The correlation coefficient between the predicted and the observed data in the validation stations were in the range of 0.614 to 0.903 with an average of 0.781.
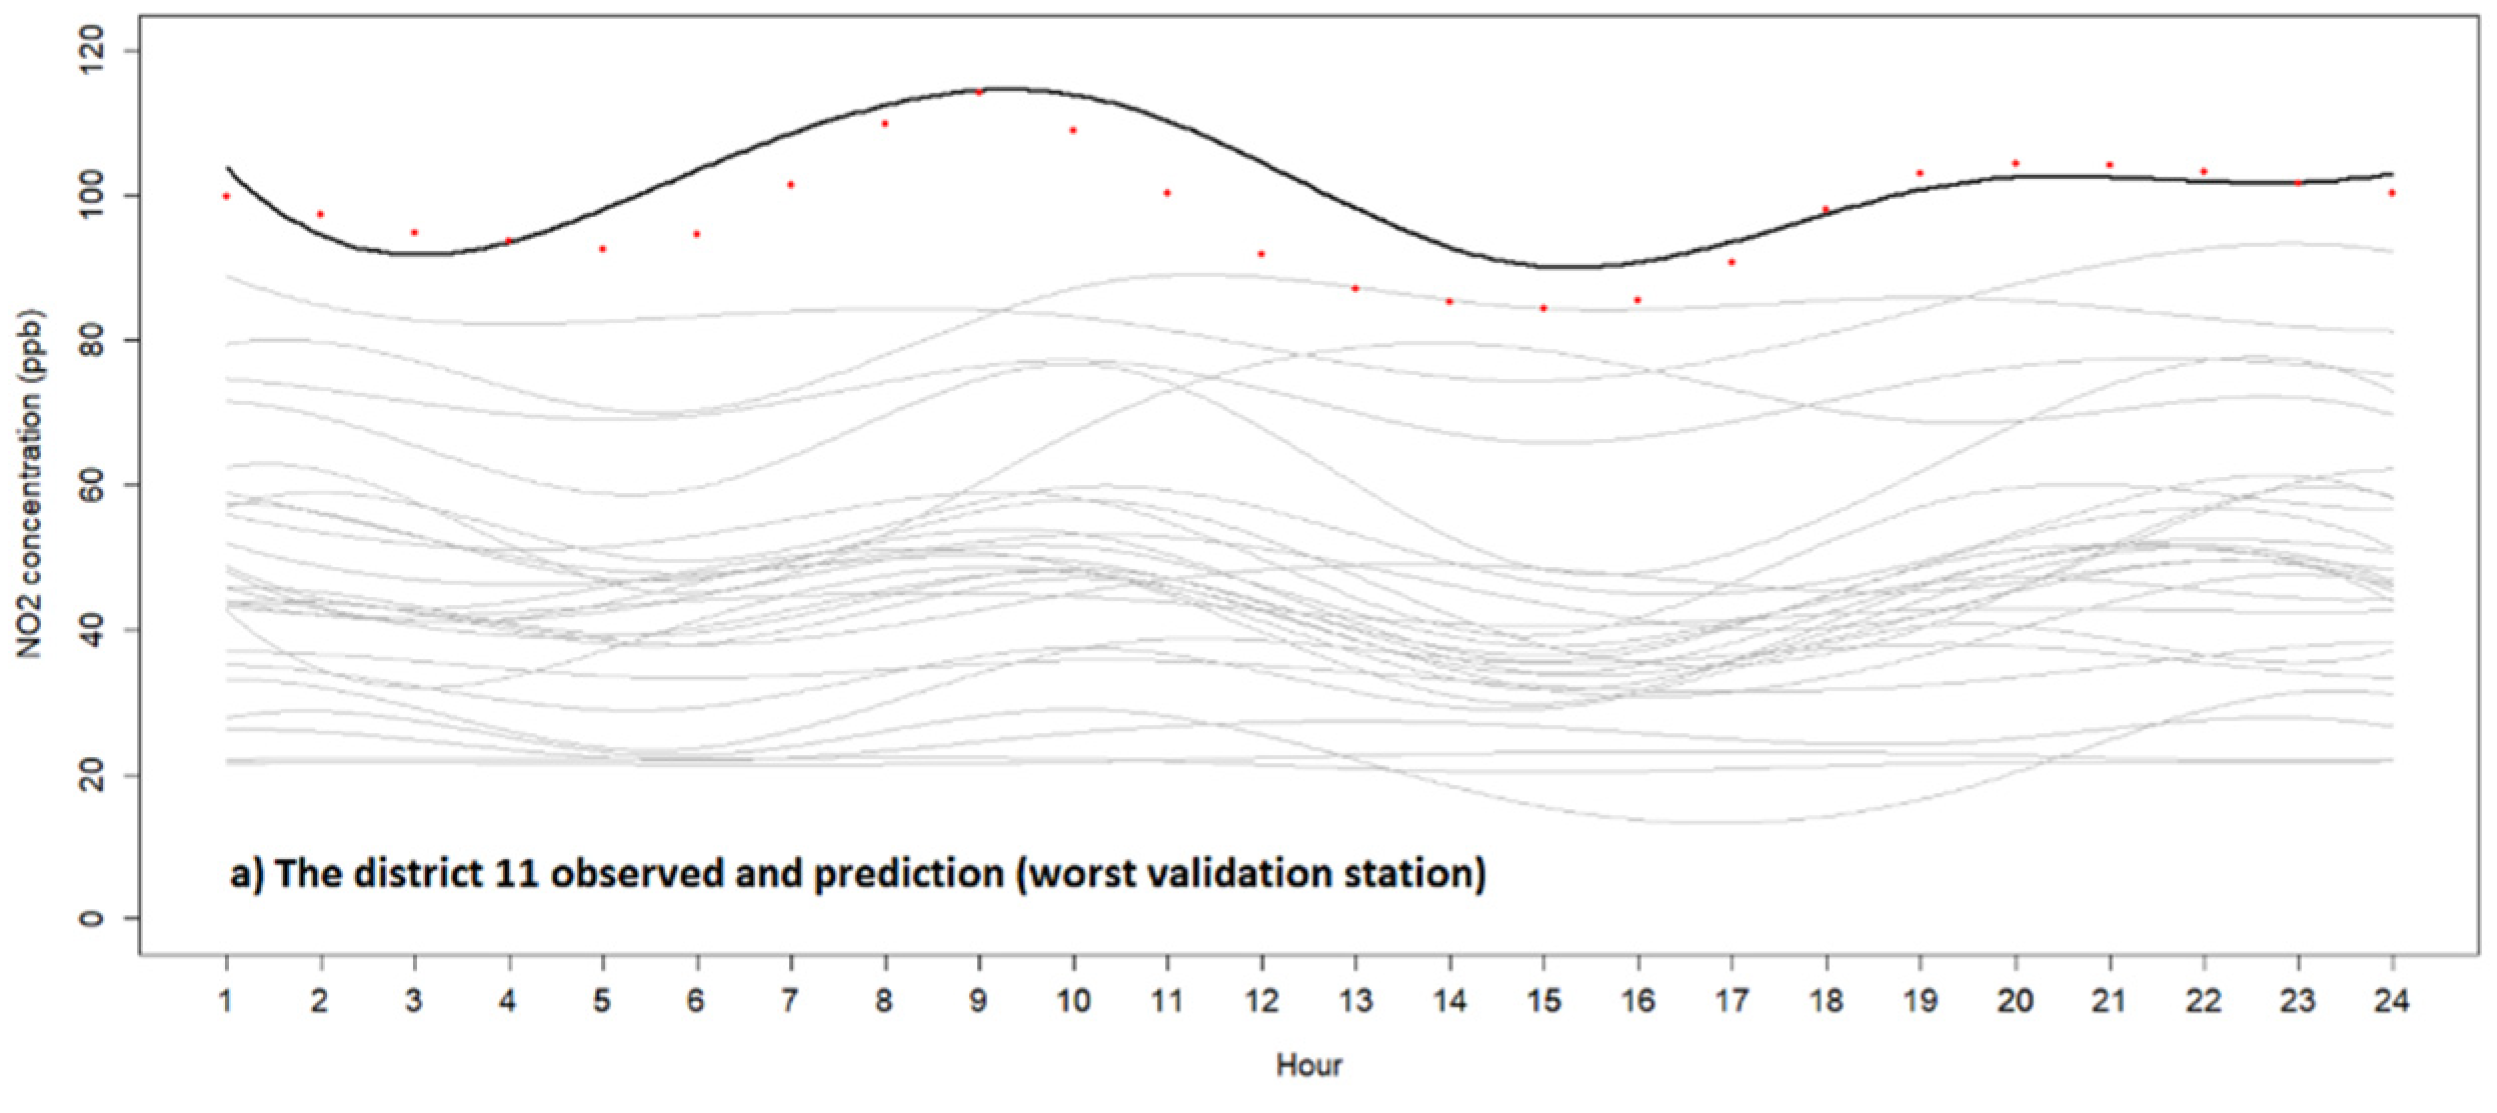
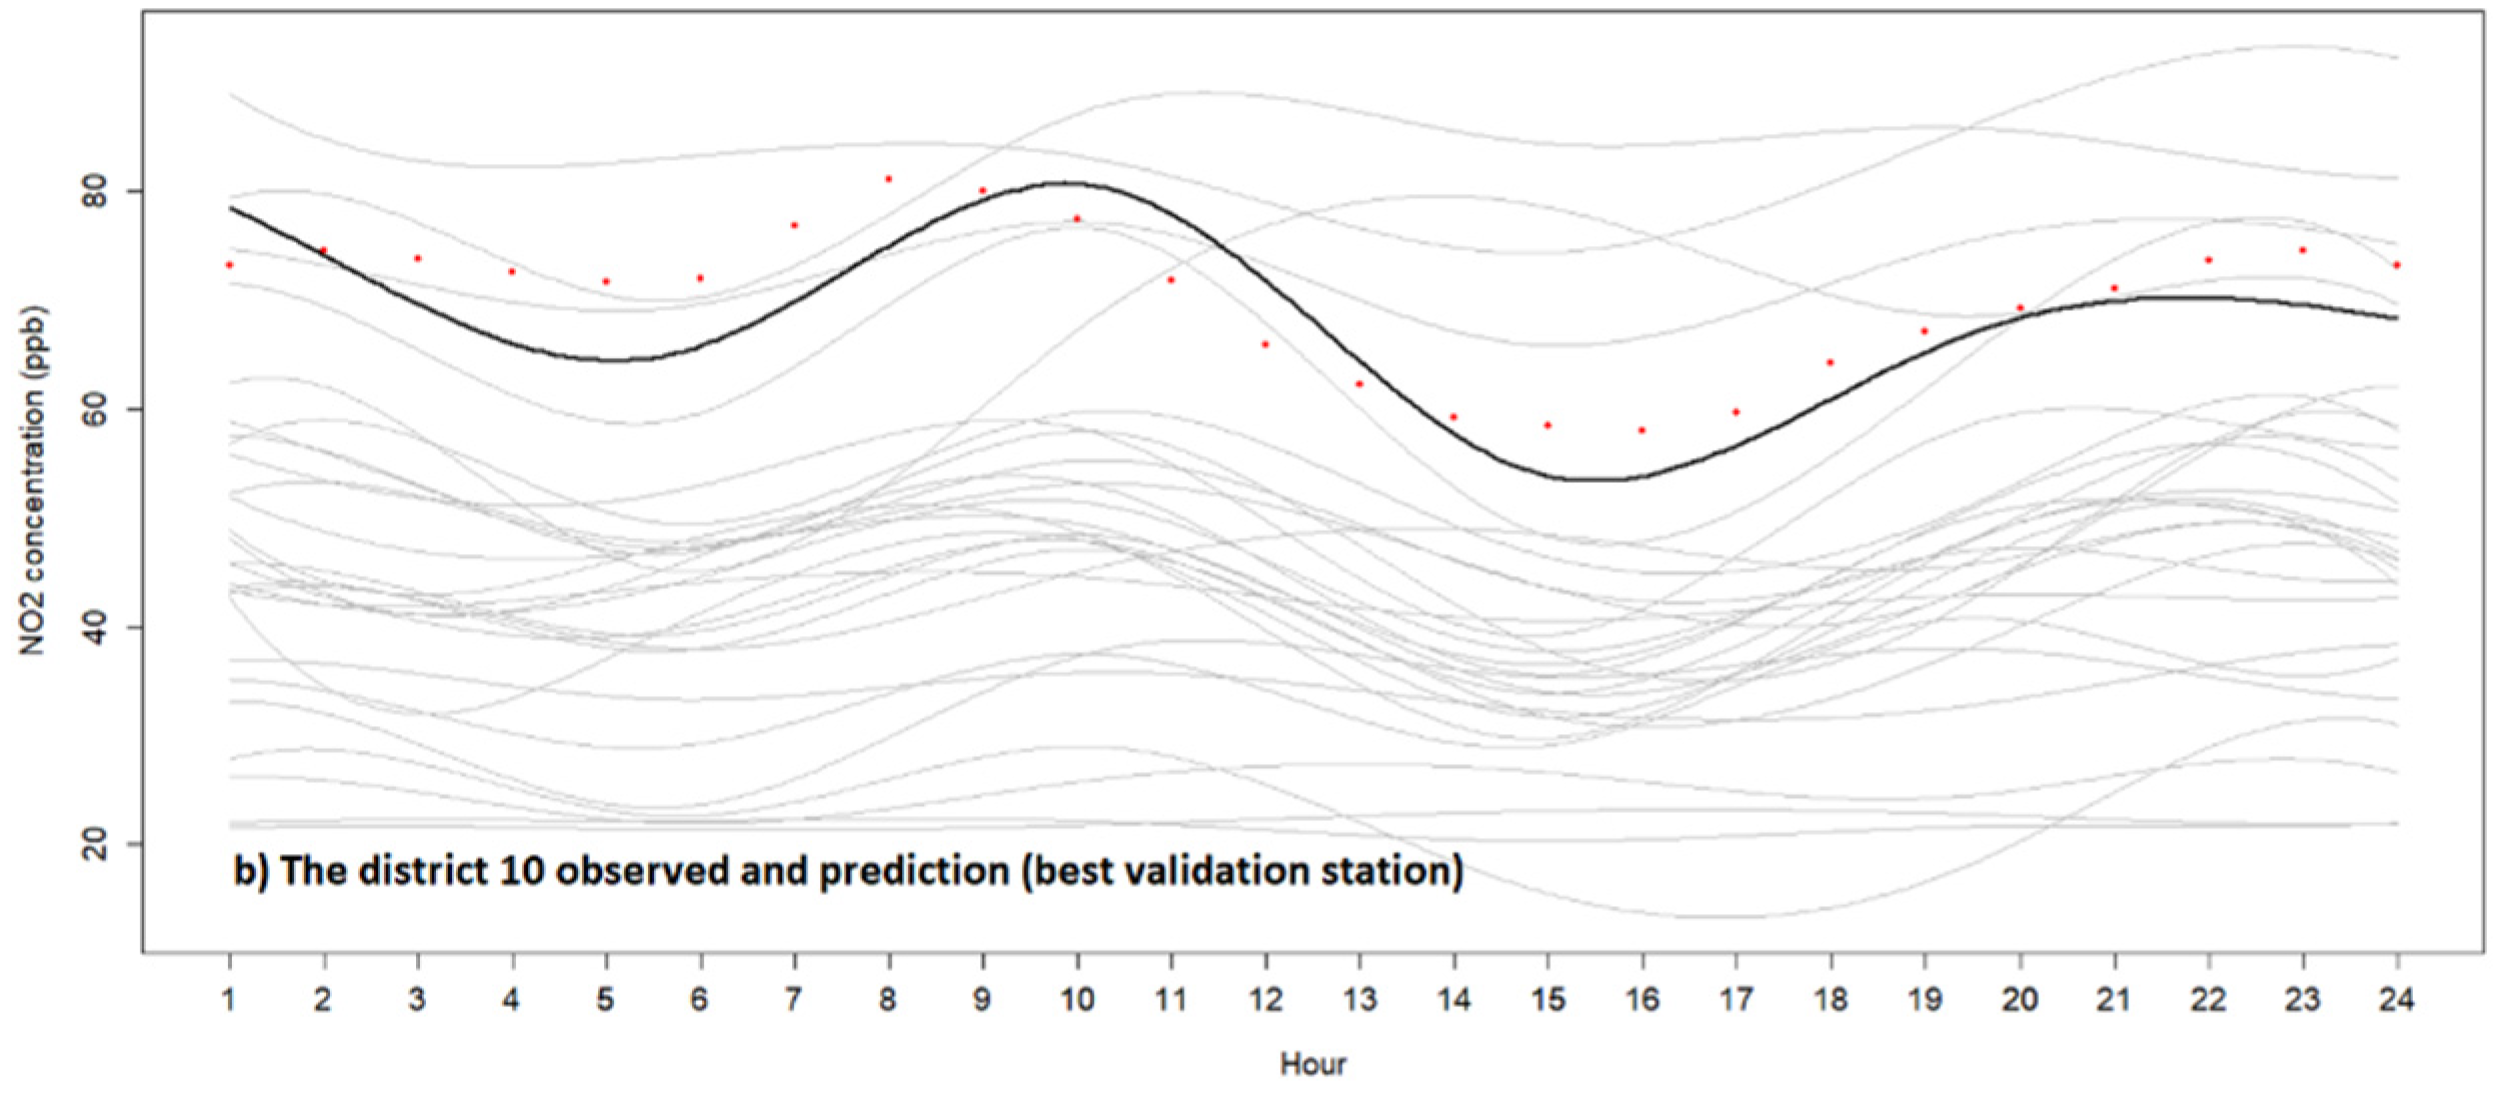
Figure 4 presents the prediction of the NO 2 diurnal curve at two validation-monitoring stations with the worse and best prediction based on the correlation coefficient between the observed and predicted values. It shows that the predicted values were consistent with the observed data, and the behavior of the predicted curves was similar to the corresponding smoothed curves.
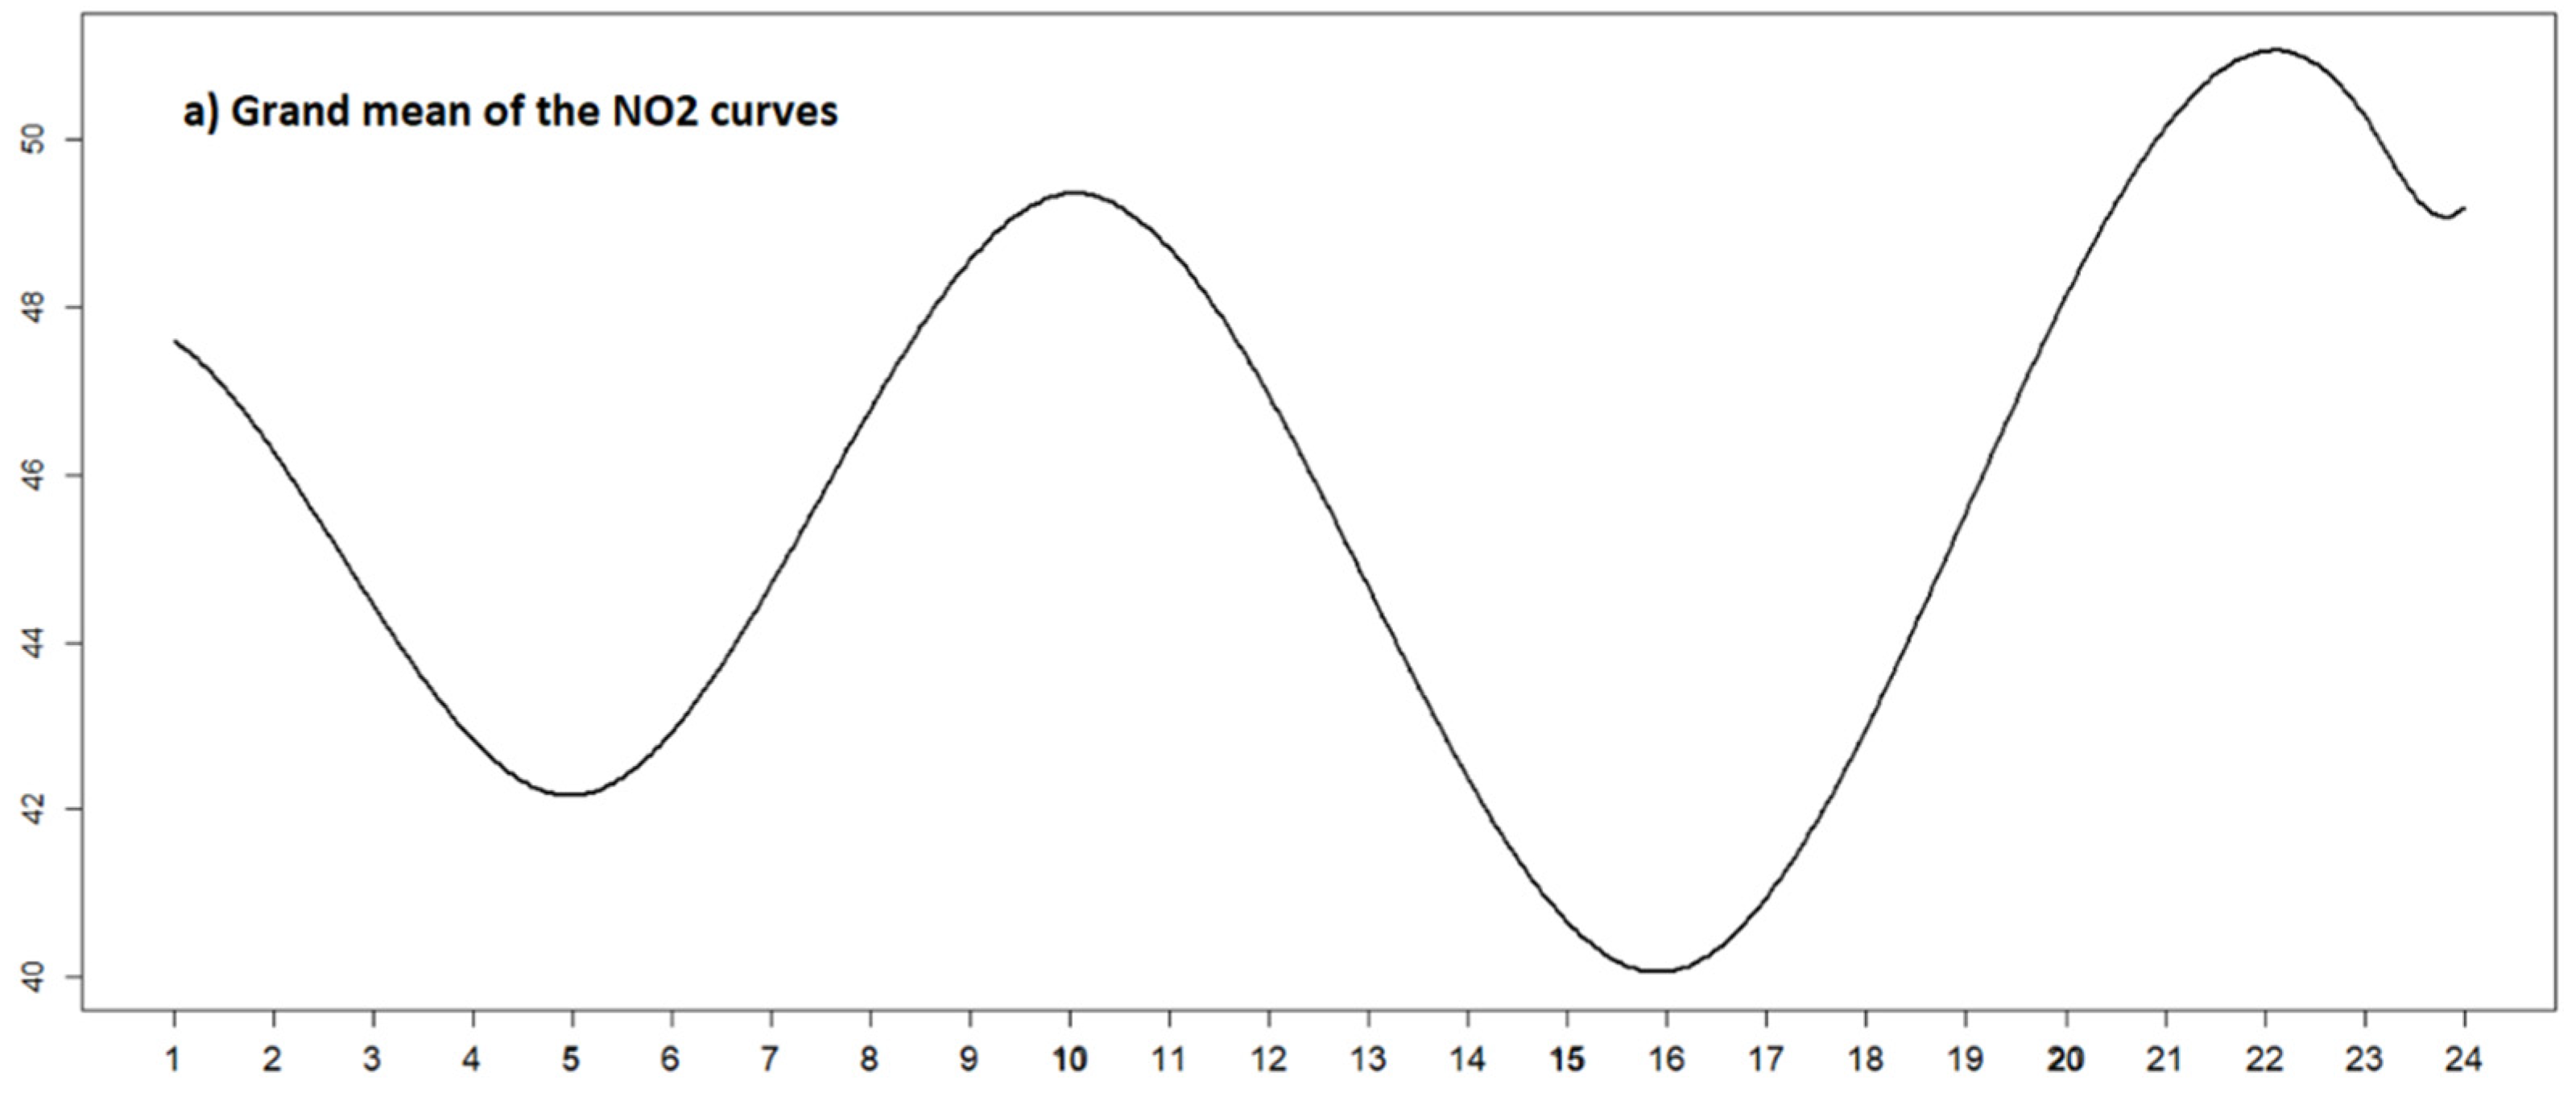
Figure 5 displays the results of FANOVA for comparing the mean of diurnal NO 2 concentration in areas with low, medium, and high population densities. We can see that the population density effect was more complicated than a constant increase or decrease in the mean value during the time. Only areas with low population density had a negative mean difference with respect to the grand mean NO 2 diurnal curve. Actually, the low populated areas were less polluted about 8 ppb in the early morning (between 6 a.m. and 7 a.m.), 2 ppb in the afternoon around 4 p.m., and 6 ppb from 9 p.m. to 4 a.m. The areas with a moderate population density generally were more polluted (about 1 to 1.5 ppb) with respect to the Tehran averages and had approximately the same value from 9 a.m. to 9 p.m., but was about 3.5 ppb more polluted in the early morning (between 5 a.m. and 6 a.m.). The areas with high population density were at most times more polluted with respect to the Tehran averages but had higher NO 2 mean values, especially in the morning between 6 a.m. and 10 a.m. and had lower values in the afternoon around 4 p.m.
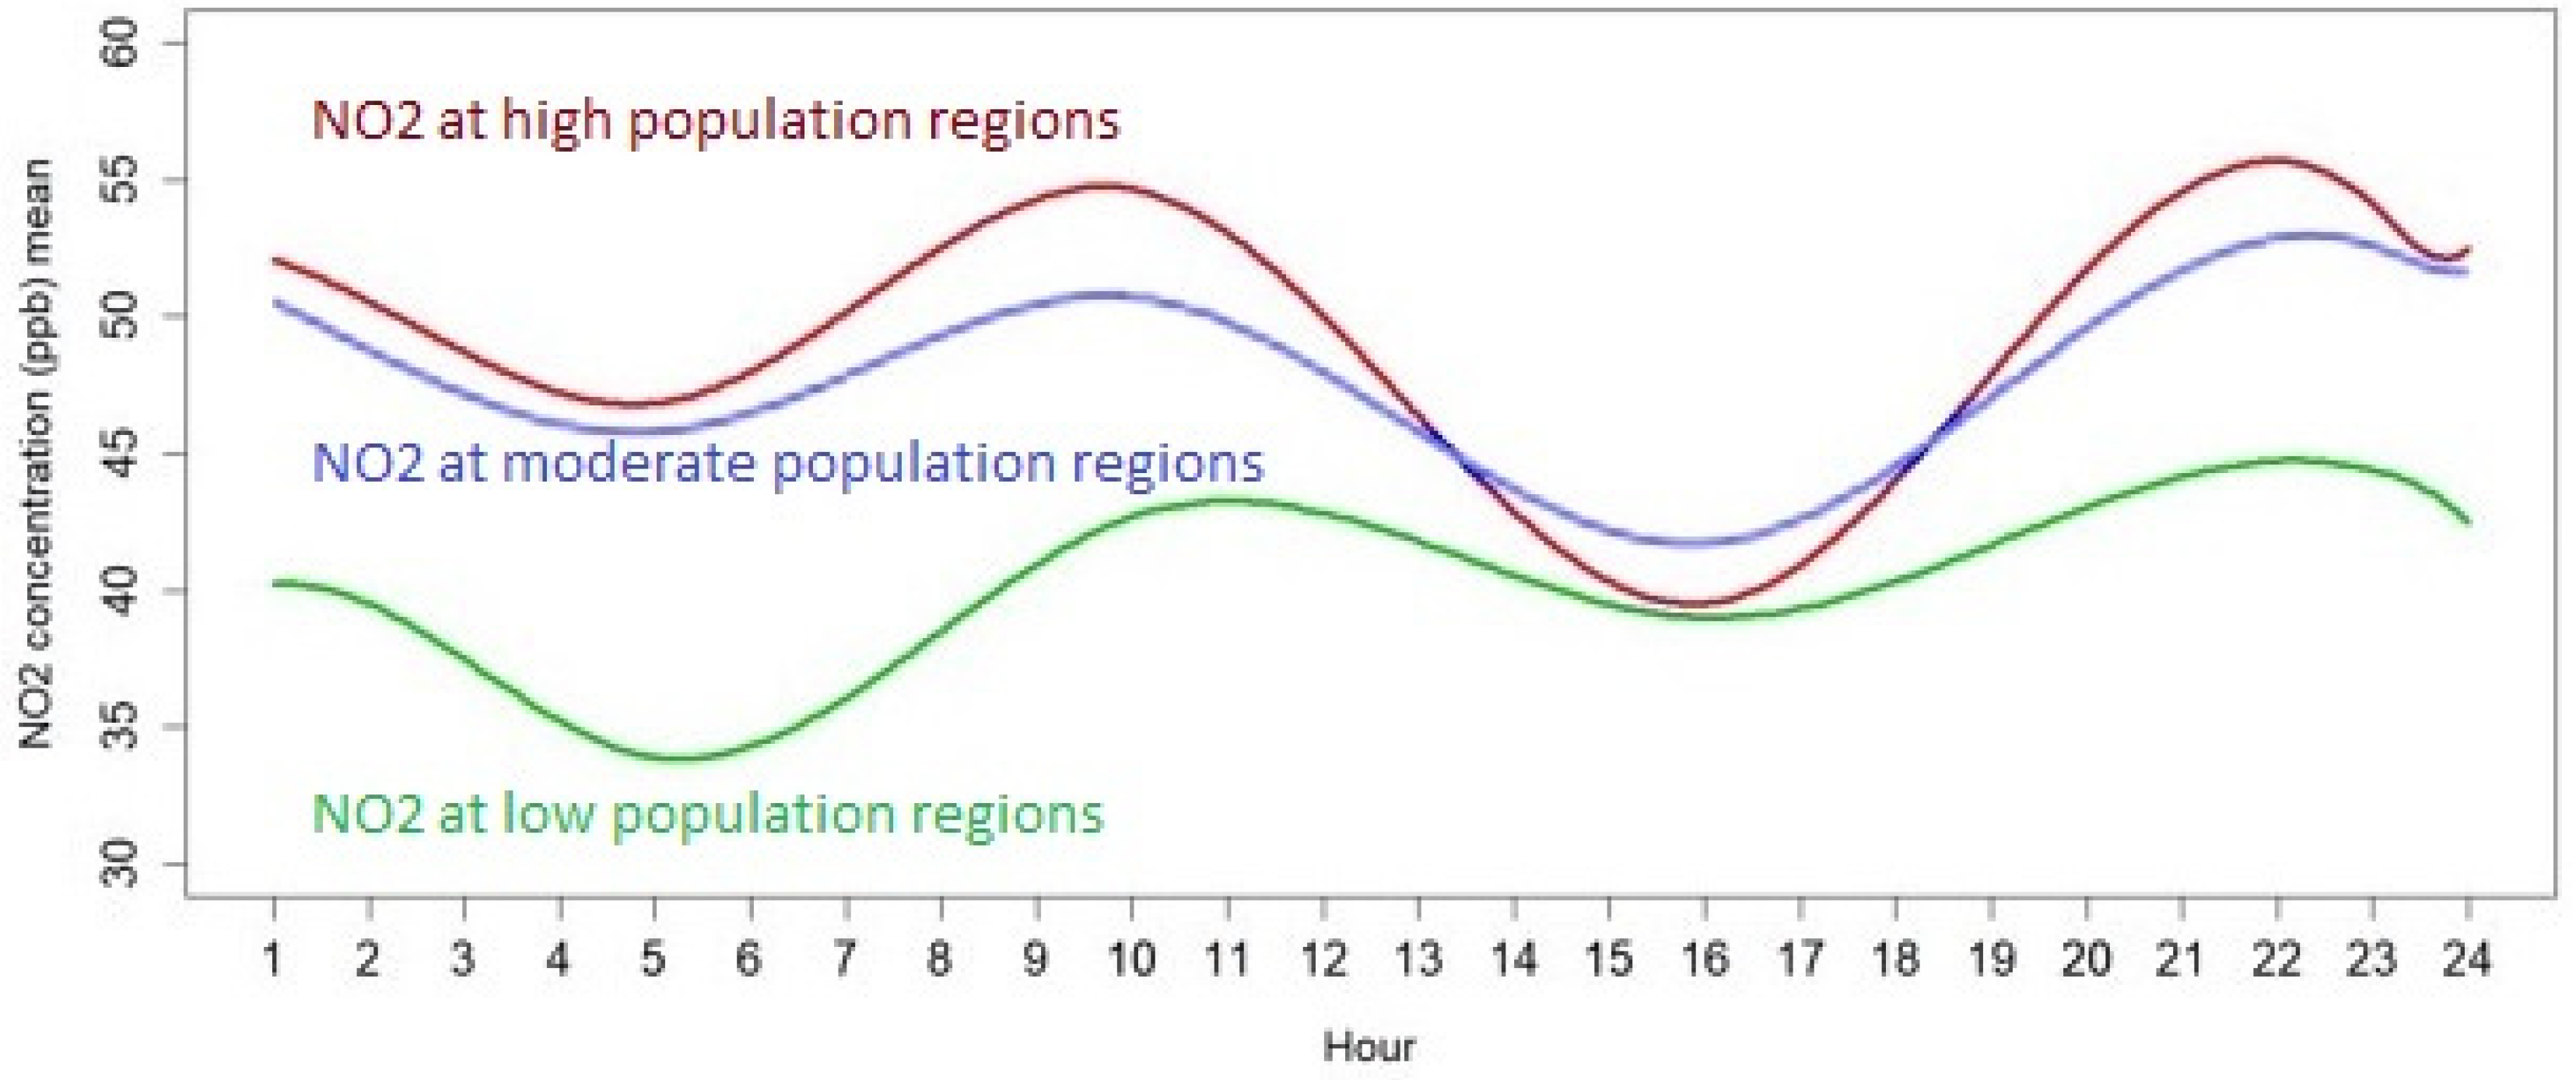
To achieve better interpretability, the predictions of mean NO 2 diurnal curves in areas with low, moderate, and high population densities are depicted in Figure 6. According to this figure, the shapes of the NO 2 diurnal curves were different at most times in areas with different population densities. The values of the NO 2 concentrations in areas with low population densities were notably lower than areas with moderate and high population densities with the exception of times around 4 p.m. The NO 2 concentrations were slightly lower in areas with moderate population density with respect to areas with high population density, but with the exception of times between 1:25 p.m. and 6:24 p.m. The absolute minimum of the mean NO 2 diurnal curve in areas with a low population density was around 5 a.m., which was a bit later than the time of the local minimums of the mean NO 2 diurnal curves in the moderate and high population densities.
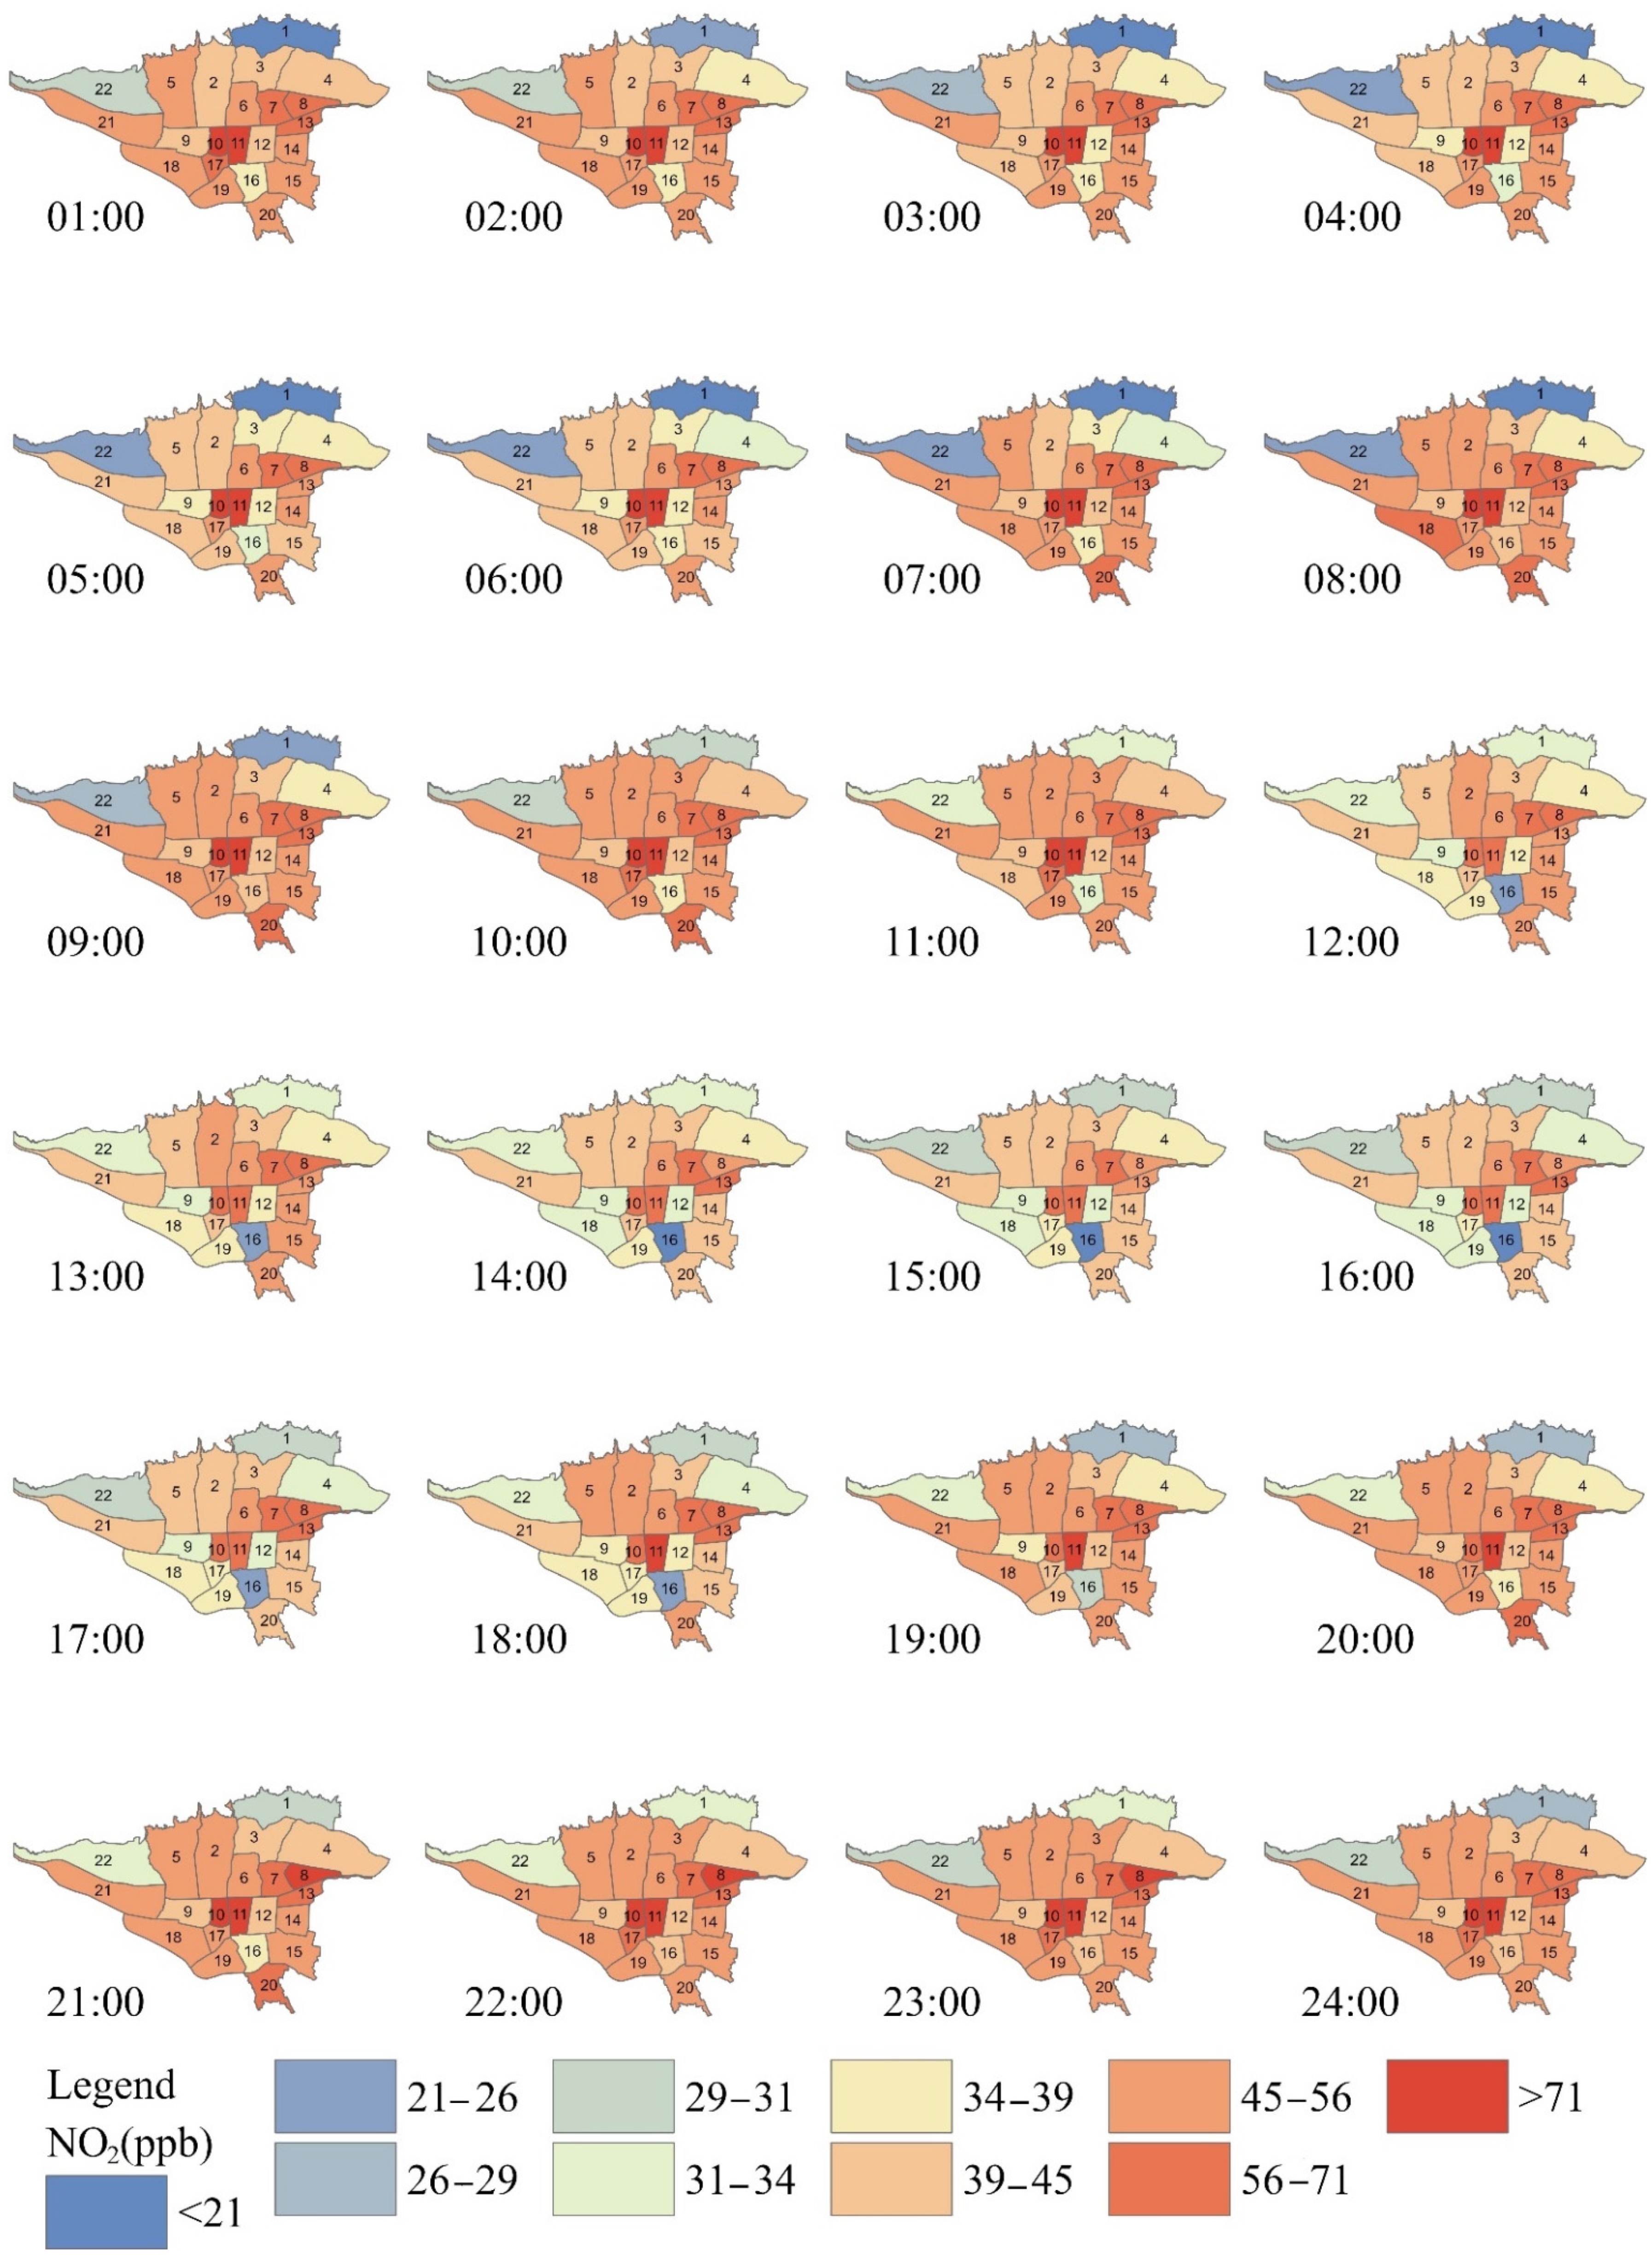
The predicted maps of NO 2 concentrations at the starting time point of each hour, from 1 to 24, are presented in Figure 7. According to the predicted maps, the central and east parts of Tehran (i.e., districts 7, 8, 10, 11,13,14,15, and 20 had the highest long-term concentration of NO 2 (upper 45 ppb) for almost all days). The north and northwest districts of Tehran in general have the lowest concentrations, which were almost lower than 34 ppb. Interestingly, this matrix of the predicted maps revealed the existence of different patterns of the NO 2 changes during the day. For example, the north and northwest parts had their cleanest conditions approximately the hours from 4 a.m. to 6 a.m., while it seems that the rest of Tehran had less polluted conditions from midday to 5 p.m.

4. Discussion and Conclusions

In this study, we presented the results of a functional kriging model for the long-term NO 2 diurnal curves in the Middle Eastern megacity of Tehran. Moreover, we investigated the effect of population density on the shape and values of the NO 2 diurnal curves using a functional analysis of variance.
The long-term mean NO2 concentrations in Tehran were typically above about 40 ppb (~75 µg/m3), which would be about 7 times higher than the 2021 World Health Organization’s recommended guidelines [44,45]. We found two peaks defining the maxima concentrations in the mean NO 2 diurnal curve: the local maximum occurred at 10:02 a.m. and the absolute maximum occurred at 10:12 p.m. Since the most important source of NO 2 emissions is road transport, the maxima concentrations of NO 2 may have occurred due to heavier traffic congestions at these special times of the day. In particular, most truck transport operates late at night in order to distribute goods from storehouses to small stores in the city. Therefore, the major increase in NO 2 concentrations late at night can be attributed to local regulations that allow for trucks and heavy vehicles to commute only between 10 p.m. and 6 a.m. Moreover, two minima were observed on 4:59 a.m. (local minimum) and 3:55 p.m. (absolute minimum). This trend in Tehran’s hourly NO 2 concentrations were also reported in other studies, for example, Masoudi reported descriptive statistics for the NO 2 hourly means of four monitoring stations in Tehran from 2009 to 2010 [36]. Taheri also reported that black carbon and PM 2.5 in Tehran had a similar trend [46]. In accordance with our study, bimodal diurnal NO 2 curves with the absolute minimum value in the afternoon and the absolute maximum in the night were reported by Cichowicz in central Poland, and by Moreno in Madrid, Spain [47,48].
Furthermore, we showed that the population density was positively associated with the NO 2 concentration. The prediction of NO 2 diurnal mean curves in areas with low population density was notably lower than that in areas with medium or high population densities. There was one exception where NO 2 concentrations remained the same at all population densities and that the time point coincided with the time of the overall minimum value. In line with our study, Zoest et al. showed a strong relationship between the NO 2 concentrations and population density in the city of Eindhoven, The Netherlands where they included population density as a covariate in a spatio-temporal regression kriging model [35]. Kaplan et al. also confirmed this relationship by investigating the correlation between the NO 2 concentrations and population densities [49]. We studied the relationship of the NO 2 concentrations and population densities over a diurnal time. The observed differences between the shapes and values of the predicted mean curves may be due to changes in the intensity of traffic over diurnal time and can also be associated with a difference in the working time of industrial activities in each area. In line with this result, as expected, the estimated NO 2 concentrations were higher at the central and eastern parts of Tehran that have a high population density.
To conclude, we presented here a model for long-term hourly NO 2 concentrations in the megacity of Tehran. Our results could benefit epidemiological studies of long-term exposure to nitrogen dioxides in the Middle Eastern megacity of Tehran. Examples of such epidemiological studies are the effect of long-term exposure to air pollutants on the incidence of lung cancer, the air pollutants’ long-term effects on low birth weight, and the effect of exposure to long-term multiple pollutants on the incidence of leukemia [50,51,52]. Our long-term exposure model provided not just an updated estimate for the long-term exposure to nitrogen dioxide, but it also provides for the long-term means across all times of the day. Future epidemiological studies of the effect of long-term air pollutants in Tehran could assign the exposure to each person based on a collection of locations such as the participants’ houses, workplaces, schools, etc., and the corresponding time that they spent at each location. This could be important because we revealed in our analysis that the trend in the changes in the concentrations of the pollutants was not consistent in all regions of Tehran. For example, regions 21 and 22 in the west of Tehran had less polluted conditions in the morning between 5 a.m. and 6 a.m., while the cleanest condition of regions 10 and 11 in the center of Tehran was in the afternoon between 3 p.m. and 5 p.m. (Figure 7).
From the statistical point of view, we used ordinary kriging for functional data (OKFD) where the functional data in our study were NO 2 long-term diurnal curves. This technique is a counterpart to conventional spatiotemporal models. The advantage of using the OKFD is its ability to predict the NO 2 concentrations over a continuous time scale because it first employs smoothing techniques to estimate curves from the observed discrete values of successive measurements and then spatially predicts these time indexed curves. Another advantage of the OKFD technique is its flexibility in modeling the temporal dimension of the spatiotemporal model, which is gifted by using non-parametric smoothing techniques using basis function expansion, while in the conventional spatiotemporal models, usually a temporal structure is imposed on the data. Luckily, this statistical framework for the spatiotemporal modeling of air pollutants is coded and is ready to use in the R “geofd” package [42]. However, the current version of the “geofd” package does not support simultaneous modeling of several pollutants using a multivariate OKFD method. Hence, there is still room for improvement in developing tools with more advanced functional geospatial techniques such as multi-response spatial modeling, which could help to simultaneously model several pollutants to achieve better spatial/temporal predictions.

Author Contributions

Conceptualization, B.M., E.A.B., S.M.T.-S. and H.A.; Methodology, B.M., E.A.B. and S.M.T.-S.; Software, E.A.B.; Validation, E.A.B. and B.M.; Formal analysis, E.A.B.; Investigation, E.A.B. and B.M.; Resources, B.M.; Data curation, E.A.B.; Writing—original draft preparation, E.A.B.; Writing—review and editing, E.A.B., S.M.T.-S., B.M. and H.A.; Visualization, E.A.B.; Supervision, B.M., S.M.T.-S. and H.A.; Project administration, B.M.; Funding acquisition, B.M. and E.A.B. All authors have read and agreed to the published version of the manuscript.

Funding

This research was funded by Isfahan University of Medical Sciences, Iran, grant number 395812.

Institutional Review Board Statement

Not applicable.

Informed Consent Statement

Not applicable.

Data Availability Statement

Data available on request from the authors.

Acknowledgments

This work was part of the first author’s PhD thesis in Biostatistics and was supported and approved by Isfahan University of Medical Sciences, Iran [approval code of ethics committee: IR.MUI.REC.1395.3.812]. The authors acknowledge the Tehran Air Quality Control Company and Iranian Department of Environment for providing air pollution monitored data. H.A. was supported by the Novo Nordisk Foundation Challenge Program (NNF17OC0027812).

Conflicts of Interest

The authors declare no conflict of interest.

References

  1. Kavousi, A.; Sefidkar, R.; Alavimajd, H.; Rashidi, Y. Spatial analysis of CO and PM10 pollutants in Tehran city. Arch. Adv. Biosci. J. Paramed. Sci. 2013, 4, 41–50. [Google Scholar] [CrossRef]
  2. So, R.; Andersen, Z.; Chen, J.; Stafoggia, M.; de Hoogh, K.; Katsouyanni, K.; Vienneau, D.; Rodopoulou, S.; Samoli, E.; Lim, Y.; et al. Long-term exposure to air pollution and mortality in a Danish nationwide administrative cohort study: Beyond mortality from cardiopulmonary disease and lung cancer. Environ. Int. 2022, 164, 107241. [Google Scholar] [CrossRef]
  3. Dominski, F.; Lorenzetti Branco, J.; Buonanno, G.; Stabile, L.; Gameiro da Silva, M.; Andrade, A. Effects of air pollution on health: A mapping review of systematic reviews and meta-analyses. Environ. Res. 2021, 201, 111487. [Google Scholar] [CrossRef] [PubMed]
  4. Habre, R.; Coull, B.; Moshier, E.; Godbold, J.; Grunin, A.; Nath, A.; Castro, W.; Schachter, N.; Rohr, A.; Kattan, M.; et al. Sources of indoor air pollution in New York City residences of asthmatic children. J. Expo. Sci. Environ. Epidemiol. 2014, 24, 269–278. [Google Scholar] [CrossRef]
  5. Movassaghi, K.; Campanella, L.; Avino, P. The first investigation on PM10 and SO2 levels in an Iranian megacity, Isfahan, and a relative comparison with Rome. Fresenius Environ. Bull. 2008, 17, 786–792. [Google Scholar]
  6. Kamińska, J.; Jiménez, F.; Lucena-Sánchez, E.; Sciavicco, G.; Turek, T. Lag Variables in Nitrogen Oxide Concentration Modelling: A Case Study in Wrocław, Poland. Atmosphere 2020, 11, 1293. [Google Scholar] [CrossRef]
  7. Ghaedrahmat, Z.; Vosoughi, M.; Tahmasebi Birgani, Y.; Neisi, A.; Goudarzi, G.; Takdastan, A. Prediction of O3 in the respiratory system of children using the artificial neural network model and with selection of input based on gamma test, Ahvaz, Iran. Environ. Sci. Pollut. Res. 2019, 26, 10941–10950. [Google Scholar] [CrossRef]
  8. Stafoggia, M.; Bellander, T.; Bucci, S.; Davoli, M.; de Hoogh, K.; de’ Donato, F.; Gariazzo, C.; Lyapustin, A.; Michelozzi, P.; Renzi, M.; et al. Estimation of daily PM10 and PM2.5 concentrations in Italy, 2013–2015, using a spatiotemporal land-use random-forest model. Environ. Int. 2019, 124, 170–179. [Google Scholar] [CrossRef]
  9. Di, Q.; Amini, H.; Shi, L.; Kloog, I.; Silvern, R.; Kelly, J.; Sabath, M.; Choirat, C.; Koutrakis, P.; Lyapustin, A.; et al. Assessing NO2 concentration and model uncertainty with high spatiotemporal resolution across the contiguous united states using ensemble model averaging. Environ. Sci. Technol. 2019, 54, 1372–1384. [Google Scholar] [CrossRef]
  10. Chen, L.; Bai, Z.; Kong, S.; Han, B.; You, Y.; Ding, X.; Du, S.; Liu, A. A land use regression for predicting NO2 and PM10 concentrations in different seasons in Tianjin region, China. J. Environ. Sci. 2010, 22, 1364–1373. [Google Scholar] [CrossRef]
  11. Majumder, S. Emission Load Distribution and Prediction of NO2 and PM10 using ISCST3 and CALINE4 Line Source Modeling. Int. Res. J. Eng. Technol. 2019, 6, 1436–1446. [Google Scholar]
  12. Lee, H.J.; Koutrakis, P. Daily ambient NO2 concentration predictions using satellite ozone monitoring instrument NO2 data and land use regression. Environ. Sci. Technol. 2014, 48, 2305–2311. [Google Scholar] [CrossRef] [PubMed]
  13. Chiusolo, M.; Cadum, E.; Stafoggia, M.; Galassi, C.; Berti, G.; Faustini, A.; Bisanti, L.; Vigotti, M.A.; Dessì, M.P.; Cernigliaro, A.; et al. Short-term effects of nitrogen dioxide on mortality and susceptibility factors in 10 Italian cities: The EpiAir study. Environ. Health Perspect. 2011, 119, 1233–1238. [Google Scholar] [CrossRef] [PubMed] [Green Version]
  14. Whitworth, K.W.; Symanski, E.; Lai, D.; Coker, A.L. Kriged and modeled ambient air levels of benzene in an urban environment: An exposure assessment study. Environ. Health 2011, 10, 21. [Google Scholar] [CrossRef] [PubMed] [Green Version]
  15. Araki, S.; Yamamoto, K.; Kondo, A. Application of regression kriging to air pollutant concentrations in Japan with high spatial resolution. Aerosol Air Qual. Res. 2015, 15, 234–241. [Google Scholar] [CrossRef] [Green Version]
  16. Halimi, M.; Farajzadeh, M.; Zarei, Z. Modeling spatial distribution of Tehran air pollutants using geostatistical methods incorporate uncertainty maps. Pollution 2016, 2, 375–386. [Google Scholar] [CrossRef]
  17. Taghavi-Shahri, S.M.; Fassò, A.; Mahaki, B.; Amini, H. Concurrent spatiotemporal daily land use regression modeling and missing data imputation of fine particulate matter using distributed space-time expectation maximization. Atmos. Environ. 2020, 224, 117202. [Google Scholar] [CrossRef]
  18. Beyaztas, U.; Salih, S.Q.; Chau, K.W.; Al-Ansari, N.; Yaseen, Z.M. Construction of functional data analysis modeling strategy for global solar radiation prediction: Application of cross-station paradigm. Eng. Appl. Comput. Fluid Mech. 2019, 13, 1165–1181. [Google Scholar] [CrossRef]
  19. Ullah, S.; Finch, C.F. Applications of functional data analysis: A systematic review. BMC Med. Res. Methodol. 2013, 13, 43. [Google Scholar] [CrossRef] [Green Version]
  20. Giraldo, R.; Mateu, J. Kriging for Functional Data. Encycl. Environ. 2012, 1–5. [Google Scholar] [CrossRef]
  21. Caballero, W.; Giraldo, R.; Mateu, J. A universal kriging approach for spatial functional data. Stoch. Environ. Res. Risk Assess. 2013, 27, 1553–1563. [Google Scholar] [CrossRef]
  22. Wang, Y.; Xu, K.; Li, S. The Functional Spatio-Temporal Statistical Model with Application to O3 Pollution in Beijing, China. Int. J. Environ. Res. Public Health 2020, 17, 3172. [Google Scholar] [CrossRef] [PubMed]
  23. Amini, H.; Taghavi-Shahri, S.M.; Henderson, S.; Hosseini, V.; Hassankhany, H.; Naderi, M.; Ahadi, S.; Schindler, C.; Künzli, N.; Yunesian, M. Annual and seasonal spatial models for nitrogen oxides in Tehran, Iran. Sci. Rep. 2016, 6, 32970. [Google Scholar] [CrossRef] [PubMed] [Green Version]
  24. Amini, H.; Schindler, C.; Hosseini, V.; Yunesian, M.; Künzli, N. Land Use Regression Models for Alkylbenzenes in a Middle Eastern Megacity: Tehran Study of Exposure Prediction for Environmental Health Research (Tehran SEPEHR). Environ. Sci. Technol. 2017, 51, 8481–8490. [Google Scholar] [CrossRef] [PubMed] [Green Version]
  25. Shamsoddini, A.; Aboodi, M.R.; Karami, J. Tehran air pollutants prediction based on Random Forest feature selection method. Int. Arch. Photogramm. Remote Sens. Spat. Inf. Sci.—ISPRS Arch. 2017, 42, 483–488. [Google Scholar] [CrossRef] [Green Version]
  26. Hong, S.; Wan, L.; Lin, H.; Lin, C.; Wei, C. Long-Term Ambient Air Pollutant Exposure and Risk of Recurrent Headache in Children: A 12-Year Cohort Study. Int. J. Environ. Res. Public Health 2020, 17, 9140. [Google Scholar] [CrossRef]
  27. Amini, H.; Dehlendorff, C.; Lim, Y.; Mehta, A.; Jørgensen, J.; Mortensen, L.; Westendorp, R.; Hoffmann, B.; Loft, S.; Cole-Hunter, T.; et al. Long-term exposure to air pollution and stroke incidence: A Danish Nurse cohort study. Environ. Int. 2020, 142, 105891. [Google Scholar] [CrossRef]
  28. Dehbi, H.-M.; Blangiardo, M.; Gulliver, J.; Fecht, D.; de Hoogh, K.; Al-Kanaani, Z.; Tillin, T.; Hardy, R.; Chaturvedi, N.; Hansell, A.L. Air Pollution and Cardiovascular Mortality with over 25 Years Follow-up: A Combined Analysis of Two British Cohorts. Environ. Int. 2017, 99, 275–281. [Google Scholar] [CrossRef] [Green Version]
  29. Toro, R.; Downward, G.S.; van der Mark, M.; Brouwer, M.; Huss, A.; Peters, S.; Hoek, G.; Nijssen, P.; Mulleners, W.M.; Sas, A. Parkinson’s Disease and Long-Term Exposure to Outdoor Air Pollution: A Matched Case-Control Study in the Netherlands. Environ. Int. 2019, 129, 28–34. [Google Scholar] [CrossRef]
  30. Wang, M.; Beelen, R.; Stafoggia, M.; Raaschou-Nielsen, O.; Andersen, Z.J.; Hoffmann, B.; Fischer, P.; Houthuijs, D.; Nieuwenhuijsen, M.; Weinmayr, G. Long-Term Exposure to Elemental Constituents of Particulate Matter and Cardiovascular Mortality in 19 European Cohorts: Results from the ESCAPE and TRANSPHORM Projects. Environ. Int. 2014, 66, 97–106. [Google Scholar] [CrossRef] [Green Version]
  31. Yang, Y.; Tang, R.; Qiu, H.; Lai, P.-C.; Wong, P.; Thach, T.-Q.; Allen, R.; Brauer, M.; Tian, L.; Barratt, B. Long Term Exposure to Air Pollution and Mortality in an Elderly Cohort in Hong Kong. Environ. Int. 2018, 117, 99–106. [Google Scholar] [CrossRef] [PubMed] [Green Version]
  32. Yorifuji, T.; Kashima, S.; Tsuda, T.; Ishikawa-Takata, K.; Ohta, T.; Tsuruta, K.; Doi, H. Long-Term Exposure to Traffic-Related Air Pollution and the Risk of Death from Hemorrhagic Stroke and Lung Cancer in Shizuoka, Japan. Sci. Total Environ. 2013, 443, 397–402. [Google Scholar] [CrossRef] [PubMed]
  33. Yousefian, F.; Mahvi, A.H.; Yunesian, M.; Hassanvand, M.S.; Kashani, H.; Amini, H. Long-Term Exposure to Ambient Air Pollution and Autism Spectrum Disorder in Children: A Case-Control Study in Tehran, Iran. Sci. Total Environ. 2018, 643, 1216–1222. [Google Scholar] [CrossRef] [PubMed]
  34. Moon, D.; Kwon, S.; Kim, S.; Kim, W. Air Pollution and Incidence of Lung Cancer by Histological Type in Korean Adults: A Korean National Health Insurance Service Health Examinee Cohort Study. Int. J. Environ. Res. Public Health 2020, 17, 915. [Google Scholar] [CrossRef] [Green Version]
  35. Van Zoest, V.; Osei, F.B.; Hoek, G.; Stein, A. Spatio-temporal regression kriging for modelling urban NO2 concentrations. Int. J. Geogr. Inf. Sci. 2020, 34, 851–865. [Google Scholar] [CrossRef] [Green Version]
  36. Masoudi, M.; Behzadi, F.; Sakhaei, M. Concentration of NO2 in the air over Tehran, Iran. Russ. Meteorol. Hydrol. 2017, 42, 728–730. [Google Scholar] [CrossRef]
  37. Amini, H.; Taghavi-Shahri, S.M.; Henderson, S.B.; Naddafi, K.; Nabizadeh, R.; Yunesian, M. Land use regression models to estimate the annual and seasonal spatial variability of sulfur dioxide and particulate matter in Tehran, Iran. Sci. Total Environ. 2014, 488–489, 343–353. [Google Scholar] [CrossRef]
  38. Giraldo, R.; Delicado, P.; Mateu, J. Ordinary kriging for function-valued spatial data. Environ. Ecol. Stat. 2011, 18, 411–426. [Google Scholar] [CrossRef] [Green Version]
  39. Ignaccolo, R.; Mateu, J.; Giraldo, R. Kriging with external drift for functional data for air quality monitoring. Stoch. Environ. Res. Risk Assess. 2014, 28, 1171–1186. [Google Scholar] [CrossRef] [Green Version]
  40. Ramsay, J.; Hooker, G.; Graves, S. Linear models for functional responses. In Functional Data Analysis with R and MATLAB; Use R; Springer: New York, NY, USA, 2009; pp. 147–177. [Google Scholar] [CrossRef]
  41. R Core Team. R: A Language and Environment for Statistical Computing; R Foundation for Statistical Computing: Vienna, Austria, 2021; Available online: https://www.R-project.org/ (accessed on 20 November 2021).
  42. Giraldo, R.; Delicado, P.; Mateu, J. Geofd: Spatial Prediction for Function Value Data. R Package, Version 2.0. 2020. Available online: https://CRAN.R-project.org/package=geofd (accessed on 20 November 2021).
  43. Ramsay, J.; Graves, S.; Hooker, G. FDA: Functional Data Analysis. R Package, Version 5.5.1. 2021. Available online: https://CRAN.R-project.org/package=fda (accessed on 20 November 2021).
  44. World Health Organization; European Centre for Environment. WHO Global Air Quality Guidelines: Particulate Matter (PM2. 5 and PM10), Ozone, Nitrogen Dioxide, Sulfur Dioxide and Carbon Monoxide; World Health Organization: Geneva, Switzerland, 2021. [Google Scholar]
  45. Amini, H. WHO air quality guidelines need to be adopted. Int. J. Public Health 2021, 66, 1604483. [Google Scholar] [CrossRef]
  46. Taheri, A.; Aliasghari, P.; Hosseini, V. Black carbon and PM2.5 monitoring campaign on the roadside and residential urban background sites in the city of Tehran. Atmos. Environ. 2019, 218, 116928. [Google Scholar] [CrossRef]
  47. Cichowicz, R.; Stelęgowski, A. Average Hourly Concentrations of Air Contaminants in Selected Urban, Town, and Rural Sites. Arch. Environ. Contam. Toxicol. 2019, 77, 197–213. [Google Scholar] [CrossRef] [PubMed] [Green Version]
  48. Moreno, T.; Karanasiou, A.; Amato, F.; Lucarelli, F.; Nava, S.; Calzolai, G.; Chiari, M.; Coz, E.; Artíñano, B.; Lumbreras, J.; et al. Daily and hourly sourcing of metallic and mineral dust in urban air contaminated by traffic and coal-burning emissions. Atmos. Environ. 2013, 68, 33–44. [Google Scholar] [CrossRef]
  49. Kaplan, G.; Yigit Avdan, Z. Space-borne air pollution observation from Sentinel-5p Tropomi: Relationship between pollutants, geographical and demographic data. Int. J. Eng. Geosci. 2020, 5, 130–137. [Google Scholar] [CrossRef]
  50. Khorrami, Z.; Pourkhosravani, M.; Rezapour, M.; Etemad, K.; Taghavi-Shahri, S.; Künzli, N.; Amini, H.; Khanjani, N. Multiple air pollutant exposure and lung cancer in Tehran, Iran. Sci. Rep. 2021, 11, 9239. [Google Scholar] [CrossRef]
  51. Nakhjirgan, P.; Kashani, H.; Naddafi, K.; Nabizadeh, R.; Amini, H.; Yunesian, M. Maternal exposure to air pollutants and birth weight in Tehran, Iran. J. Environ. Health Sci. Eng. 2019, 17, 711–717. [Google Scholar] [CrossRef]
  52. Khorrami, Z.; Pourkhosravani, M.; Eslahi, M.; Rezapour, M.; Akbari, M.; Amini, H.; Taghavi-Shahri, S.; Künzli, N.; Etemad, K.; Khanjani, N. Multiple air pollutants exposure and leukaemia incidence in Tehran, Iran from 2010 to 2016: A retrospective cohort study. BMJ Open 2022, 12, e060562. [Google Scholar] [CrossRef]
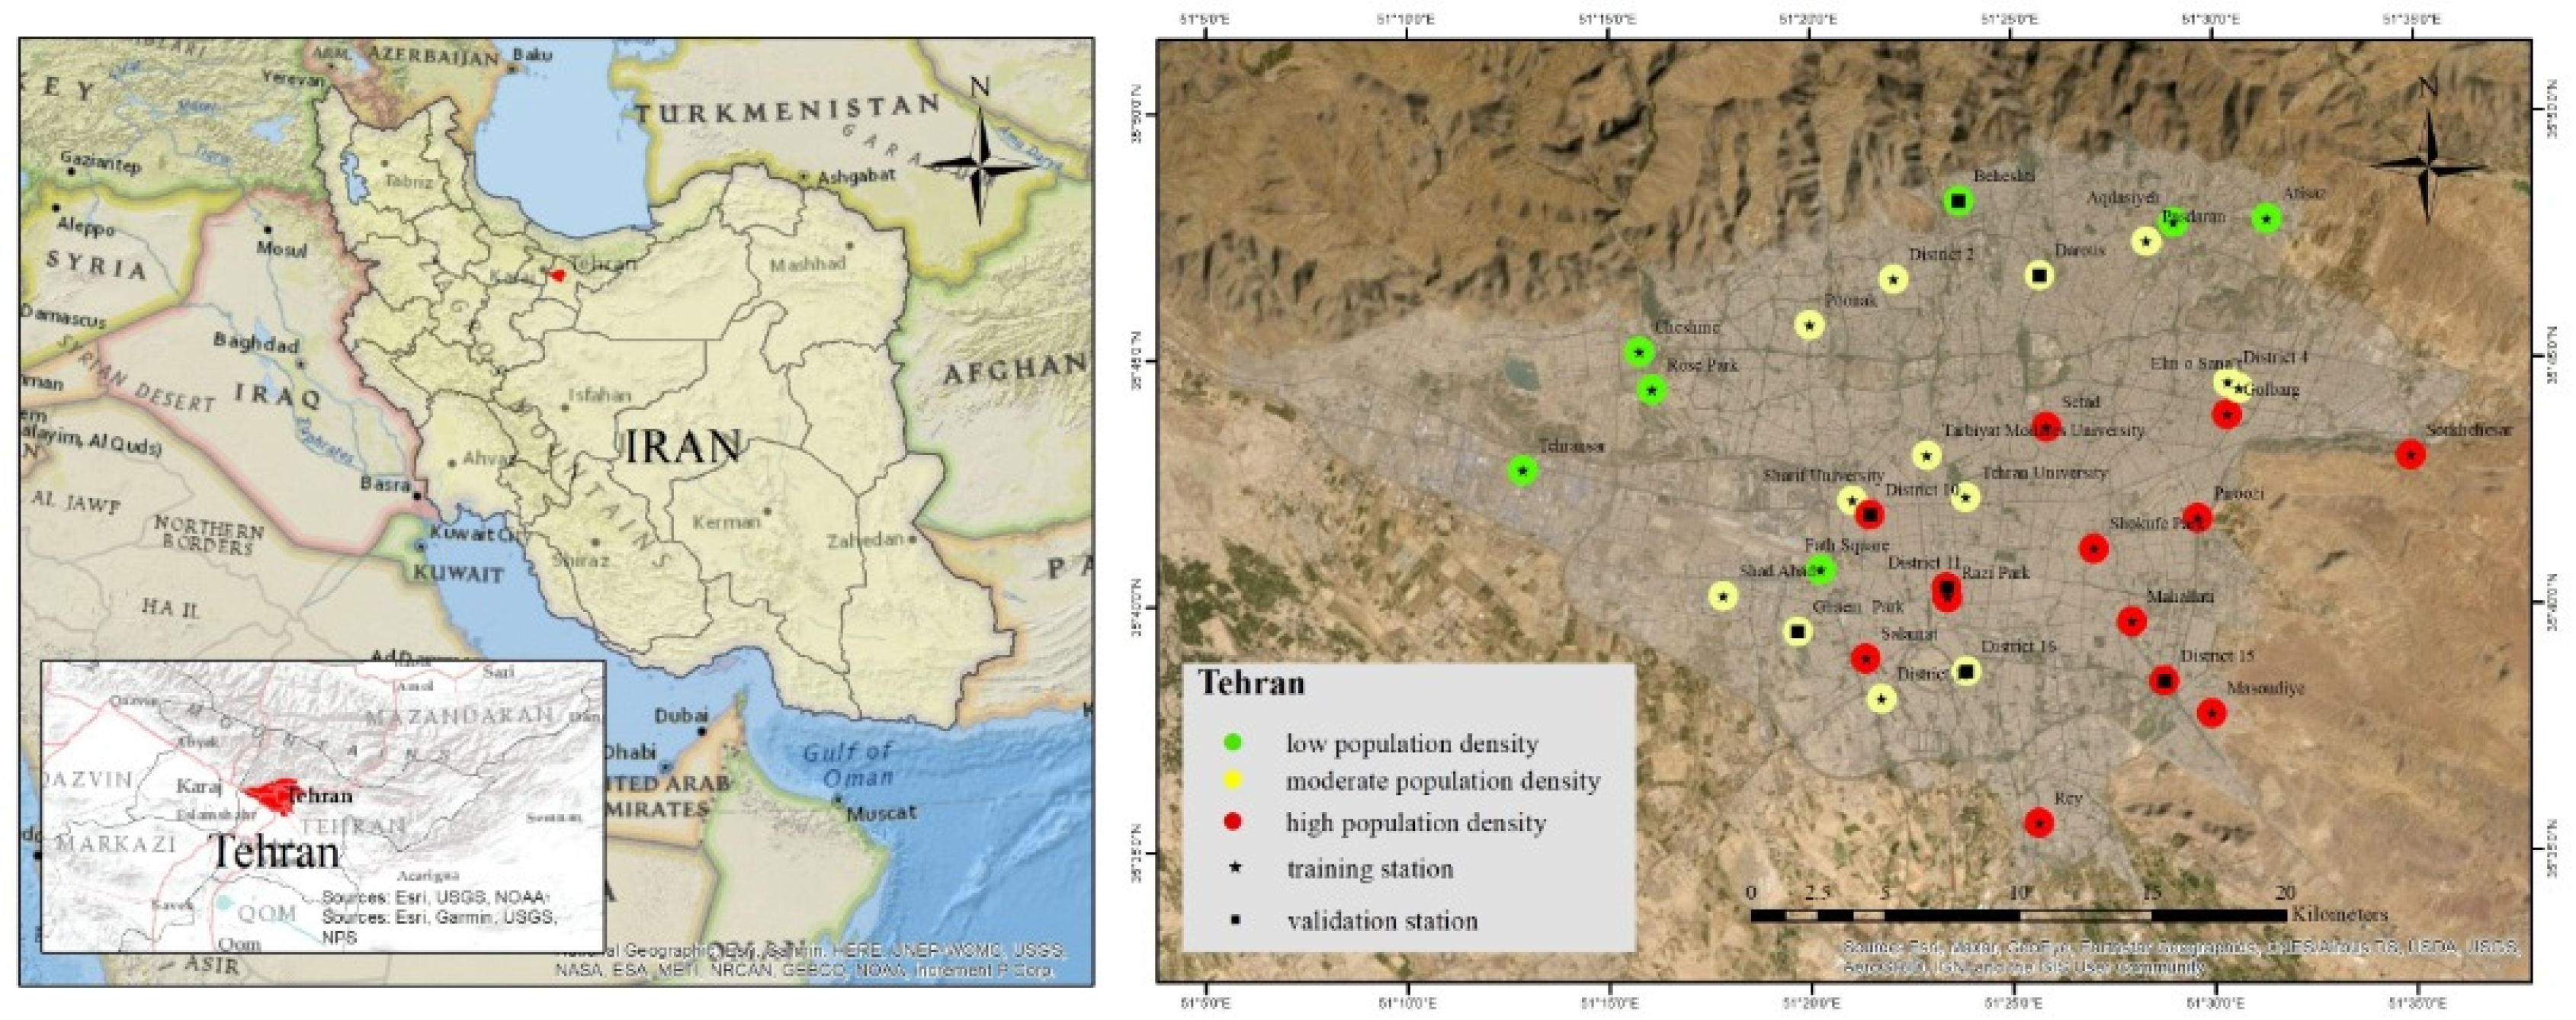
Figure 1. The study area (the Middle Eastern megacity of Tehran) in the left panel and the locations of 33 ambient NO 2 monitoring stations (26 training and seven validation stations) in the right panel.
Atmosphere 13 01095 g001
Figure 2. The smoothed diurnal curves of the NO 2 concentrations in 26 training monitoring stations (light lines) and their means (dark line).
Atmosphere 13 01095 g002
Figure 3. The mean (a) and the standard deviation (b) curves of the smoothed diurnal NO 2 (ppb) curves at the monitoring stations in Tehran.
Atmosphere 13 01095 g003
Figure 4. The observed versus predicted plot for (a) the validation station of district 11 that had the worst prediction based on the RMSE metric in Table 2. (b) The validation station of district 10 that had the best prediction based on the RMSE metric in Table 2; bold curves show the prediction of the OKFD model for that station and the red dots show the corresponding observed hourly data.
Atmosphere 13 01095 g004aAtmosphere 13 01095 g004b
Figure 5. Comparison of the NO 2   diurnal curves in areas with low, moderate, and high population densities using FANOVA. (a) The grand mean of the NO 2 diurnal curves in Tehran. (b) Mean difference in regions with low population. (c) Mean difference in regions with moderate population. (d) Mean difference in regions with high population density, all values presented in ppb scale.
Atmosphere 13 01095 g005aAtmosphere 13 01095 g005b
Figure 6. The prediction of the mean NO 2 diurnal curves in low population density areas (green curve), moderate population density areas (blue curve), and high population density areas (red curve).
Atmosphere 13 01095 g006
Figure 7. The predicted maps of the NO 2 concentrations for the hours from 1:00 to 24:00 in all districts of Tehran.
Atmosphere 13 01095 g007
Table 1. The results of the fitted trace-variogram models using various auto-correlation structures.
ModelRangeNugSillSSE
Spherical0.08648314.31535083.089710,041 × 103
Exponential0.02487231.83426038.375810,081 × 103
Gaussian0.04446973.23346452.336510,049 × 103
Matérn with fixed kappa = 11554.7828184.13812943.07610,131 × 103
Table 2. The goodness-of-fit metrics at the validation-monitoring stations.
Station NameNMBFRMSEWNNRCorrelation Coefficient
Beheshti0.1347.240.02760.649
Darous−0.0304.650.00040.846
Ghaem0.0335.510.00290.839
District 100.0012.490.00960.903
District 110.1426.520.05170.614
District 150.1306.170.01650.739
District 16−0.0663.450.00800.877
Publisher’s Note: MDPI stays neutral with regard to jurisdictional claims in published maps and institutional affiliations.