Article

Secondary Organic Aerosol (SOA) from Photo-Oxidation of Toluene: 1 Influence of Reactive Nitrogen, Acidity and Water Vapours on Optical Properties

1
Department of Chemistry and Molecular Biology, University of Gothenburg, SE-41296 Gothenburg, Sweden
2
Indo Gangetic Plains—Center for Air Research and Education (IGP—CARE), Hamirpur U.P. 210501, India
*
Author to whom correspondence should be addressed.
Current address: College of Environmental and Resource Sciences, Zhejiang University, Hangzhou 31005, China.
Atmosphere 2022, 13(7), 1099; https://doi.org/10.3390/atmos13071099
Submission received: 31 May 2022 / Revised: 29 June 2022 / Accepted: 30 June 2022 / Published: 13 July 2022
(This article belongs to the Section Aerosols)

Abstract

:
Many climate models treat the light-absorbing SOA component called “brown carbon” (BrC) as non-light absorbing because its formation and transformations are poorly understood. We therefore investigated the influence of reactive nitrogen (NOx, NH3)-, acidity (H2SO4)-, and water-mediated chemistry on SOA formed by the photo-oxidation of toluene, the subsequent formation and transformation of BrC, and its optical properties. We discovered that nitrogen-poor (NP) SOA is formed when the molar ratio of NOx to reacted toluene (henceforth, [NOx/ΔHC]) is 0.15 or less, whereas nitrogen-rich (NR) SOA is formed when [NOx/ΔHC] > 0.15. NR and NP SOA have markedly different characteristics. The light absorption coefficient (Babs) and mass absorption cross-section (MAC) of the SOA increased with [NOx/ΔHC] under both the NP and NR regimes. For NP SOA, the MAC increased with [NOx/ΔHC] independently of the relative humidity (RH). However, the MAC of NR SOA was RH-dependent. Under both NP and NR regimes, acidity promoted SOA browning while NH3 increased Babs and MAC at 80% RH. The highest MAC was observed at the lowest RH (20%) for acidic NR SOA, and it was postulated that the MAC of SOA depends mainly on the pH and the [H+]free/[SOA mass] ratio of the aqueous SOA phase.

1. Introduction

Atmospheric aerosols markedly affect the radiative balance in the Earth’s atmosphere and play key roles in climatic processes [1]. Carbonaceous aerosols consisting of organic carbon (OC) and black carbon (BC, commonly known as “soot”) comprise a major fraction of atmospheric aerosols [2,3]. Soot warms the planet because it strongly absorbs light, but most climate models have traditionally treated OC as a light-scattering (and thus cooling) substance [1]. The cooling due to this scattering partly offsets the warming caused by BC co-emitted during combustion processes [4]. The molecular composition of OC and its evolution during various atmospheric aging processes have been studied extensively in recent decades [2,3,5,6,7,8,9]. However, despite various advances, our understanding of the climate-related properties of atmospheric OC and its effects on the atmospheric environment and climate forcing remains incomplete. In particular, we need to better understand the behaviour of the OC fraction in various strongly light-absorbing complex mixing states that are collectively known as Brown Carbon (BrC). OC can be emitted directly through combustion processes that form so-called primary organic aerosol (POA) or formed in the atmosphere by gas-to-particle conversion processes that generate secondary organic aerosol (SOA). The latter processes include nucleation, condensation, and heterogeneous and multiphase chemical reactions that form highly oxidized multifunctional molecules (HOMs) with extremely low volatility and high molecular weights [3,10,11], some of which are strongly light-absorbing [12,13,14,15].
Known primary and secondary sources of BrC aerosols include fossil fuel combustion [16], biomass burning [17,18], biological aerosols (e.g., soil humics and bioaerosols) [19], and SOA formed from anthropogenic or biogenic precursors [13]. While the primary BrC sources are straightforward to identify, the mechanisms that generate light-absorbing SOA are largely unknown [8]. Quantifying BrC’s contribution to light absorption is critically important for accurate interpretation of the aerosol optical depth (AOD), i.e., the light extinction within the atmospheric column due to scattering and absorption.
Aromatic compounds comprise 20–40% of gasoline by volume and are major anthropogenic volatile organic compounds (VOCs) that play an important role in the formation of tropospheric ozone and SOA [20,21,22,23]. The aromatic compounds toluene and benzene are thought to be some of the most important SOA precursors because of their high anthropogenic emissions and SOA formation potential [20,22,24,25,26,27,28]. The optical properties of aromatic-derived SOA have therefore been studied extensively over the last decade [26,27,28,29,30,31,32,33,34]. The highest mass absorption coefficient (MAC) values are observed for toluene SOA formed under high-NOx conditions at moderate RH with short photolysis aging times [27]. However, the optical properties of toluene/benzene-derived SOA formed under other atmospherically-relevant conditions are unclear. In particular, there are four major factors whose effects on the light absorption characteristics of toluene SOA are unknown: (1) the molar ratio of NOx to reacted toluene ([NOx/ΔHC]) in the atmosphere, (2) the RH and the dependence of its effects on [NOx/ΔHC], (3) acidity and the dependence of its effects on [NOx/ΔHC] and the RH, and (4) aging in the presence of [OH]. Determining the effects of these factors will greatly improve our understanding of a complex and important air pollution component by explaining how NH3, water, NOx, and acidity affect the formation and transformation of secondary BrC (SBrC).
To holistically assess the environmental effects of BrC, a deep understanding of its optical properties and the relationships between SOA formation processes under diverse atmospheric pollution scenarios is required. This study therefore investigates the light absorption characteristics of laboratory-generated SOA under simulated urban environmental conditions. Toluene was chosen as an SOA precursor representative of anthropogenic emissions. A matrix of experiments was conducted to determine the effects of (1) NOx, (2) water, (3) NH3, and (4) acidity on the mass of SOA that is formed and its light absorption and scattering characteristics. It is shown that reactive nitrogen, acidity, and water all influence SOA browning and that the SOA formed during toluene photooxidation may be either nitrogen-poor (NP) or nitrogen-rich (NR). These results provide a base for (i) developing improved parametrizations to describe radiative forcing due to toluene SOA for climate models and (ii) evaluating models against field observations under various atmospheric pollution scenarios.

2. Materials and Methods

2.1. Experiments

2.1.1. Experimental Setup

The experiment was designed to generate SOA with tight control over experimental parameters and to measure and record changes in its formation, transformation, and properties under diverse experimental conditions. As shown in Figure S1 of the Supplementary Information (henceforth referred to as “Supplementary Materials”), the experimental set-up consisted of three serial zones: (i) the reactants input control zone, (ii) the reaction zone, and (iii) the instrumentation and measurement zone. The reactants input control zone regulated the flows and concentrations of gases and aerosols in the reaction zone. In the reaction zone, photo-induced reactions leading to SOA formation and transformation were allowed to occur subject to tightly controlled time constraints. In the instrumentation and measurement zone, various parameters, concentrations, and properties of the gas and aerosol mixture at the outflow of the reaction zone were measured and recorded.
The Gothenburg Potential Aerosol Mass chamber (Go:PAM) was used as the photo-oxidation reaction zone [35]. This apparatus is depicted schematically in Figure S1 OH radicals are produced in Go:PAM by photolyzing O3 in the presence of water vapour. Total flows through the apparatus were measured, revealing that the reactants had a median residence time of 100 s and SOA was formed in a laminar flow. The main inputs in the reactant input control zone were toluene (VOC), water vapour, and O3. NOx, NH3, and H2SO4 were also added in some experiments as described below. To the check the accelerated aging in lab environment with 100 s median residence time, the Toluene & O3 was taken in higher quantities than atmospherically-relevant conditions. Most of the experiments used ramping NOx concentrations but some used an NH3 ramp. If a given input was not used in an experiment, the pipe connecting that input to the Go:PAM chamber was blocked to ensure that only the desired reactants were admitted. VOC-free air was generated with a Zero-Air generator. O3 was generated by photolyzing VOC-free air with UVP Pen-Ray® mercury lamps (185 nm) and allowed to flow into the Go:PAM chamber. The desired RH in the Go:PAM chamber was set using an RH generator consisting of a water bubbler maintained at a user-specified temperature; VOC-free air was used to carry the required amount of moisture into the Go:PAM chamber. Similarly, to establish the desired VOC concentration in the Go:PAM chamber, VOC-free air was passed through a VOC container (which was heated to a user-specified temperature below the VOC’s boiling point using a water bath) to carry the VOC into Go:PAM chamber. H2SO4 seeds were generated from an H2SO4 solution using the TSI Atomizer flow with VOC-free air; the flow was controlled with a needle valve that allowed a majority of the H2SO4 to be sent to the exhaust with a small seed fraction being dried with a silicon drier and sent to the Go:PAM chamber. The required flow through the FIGAERO-HR-ToF-CIMS instrument during gas phase sampling differed from that for particle phase sampling. Therefore, VOC-free Air was used to dilute the FIGAERO-HR-ToF-CIMS flow to enable control over the flow through the instrument.
In the instrumentation and measurement zone, a SMPS (CPC 3775; EC3080 TSI Inc. Shoreview, MN, USA) was used to measure the particle number concentration and volume concentration of SOA in the sample outflow. The absorption and scattering properties of the SOA were measured with a 3-wavelength photoacoustic soot spectrometer (PASS-3) after passage through a charcoal filter to remove residual VOCs and NOx. Both instruments were described previously by Backstrom, D., et al. [36] and were used under the experimental conditions specified in Table 1. Gas- and aerosol-phase oxidation products were measured with the Filter Inlet for Gases and AEROsols (FIGAERO) instrument of Aerodyne Research Inc., Billerica, MA, USA [37] and by high-resolution chemical ionization mass spectrometry (ToF-CIMS, Aerodyne Research Inc. and Tofwerk AG, Thun, Switzerland) [38]. The reagent ion for CI detection was I. Additionally, an O3 monitor, a VOC monitor (photoionization technique using model: PID AH2, from ALPHASENSE LIMITED, Reg. no. 03264282, Essex, UK), an RH monitor, and a temperature monitor were used to measure the properties of the residual flow after passing through the Go:PAM Chamber. The NOx concentration (consisting of equal quantities of NO and NO2) was ramped from 61 ppb to 361 ppb, while that of NH3 was ramped from 42 to 203 ppb.

2.1.2. OH Radical Generation

The main oxidant of toluene in our experiments was OH generated by O3 photolysis in the presence of water vapor in GO:PAM. O3 was generated by external irradiation of VOC-free air with a mercury lamp (λ = 185 nm) and its concentration was measured with an O3 monitor (2B Technologies, Boulder, CO, USA). UV photolysis of O3 (λ = 254 nm) generated excited oxygen [O(1D)] atoms inside the flow tube (Go:PAM) at a relative humidity of 20–80%. It was previously established that Go:PAM OH exposures can be determined by measuring the residual VOC concentration at the outlet of Go:PAM with a VOC monitor [39,40]. In this study, the OH radical exposure and concentrations were estimated using Equation (3). Assuming an average atmospheric OH concentration of 1.5 × 10⁶ molecules cm−3 [41], our experimental conditions correspond to about 0.77 to 1.61 days of atmospheric oxidation aging (See Table S1 in Supplementary Materials).

2.1.3. Experimental Matrix

The experiments performed in this study are summarized in Table 1. Controlled experimental variables included the toluene concentration (ΔHC), the initial ozone concentration, the relative humidity, the NOx ramp and initial concentration (31 ppb to 362 ppb for experiments Tol-1 to Tol-4 and 30 ppb to 351 ppb for experiments Tol-7 to Tol-9), and the NH3 ramp (42 ppb to 203 ppb for experiments Tol-5 and Tol-6). The results of these experiments are summarized in Table 2. This table includes the experiment ID and the average mass of SOA formed under NP ([NOx]/[ΔHC] ≤ 0.15) and NR ([NOx]/[ΔHC] > 0.15) conditions as well as the average values of the aerosol absorption coefficient (Babs [Mm−1]), the aerosol scattering coefficient (Bscat [Mm−1]) at 405 nm and 781 nm, the mass absorption cross-section (MAC [m2 g−1]), the single scattering albedo (SSA), and the mass scattering cross-section (MSC [m2g−1]) for NP and NR SOA at 405 nm, together with the calculated OH concentration and estimated aging of SOA in days. The observations made during the experiments and rationales for their outcomes are discussed in Section 3.
The NOx concentration was ramped at a relatively slow rate of 1 ppb NOx/min so changes in its concentration and flow were not drastic. All of the experiments involved periodic flow changes at 30 min intervals because the FIGAERO-HR-ToF-CIMS instrument alternates between gas phase and particle phase sampling modes roughly every 30 min. The exhaust flow of the Go:PAM system was diluted with VOC-free air at a flow rate of 3 L per min with an MFC to manage the fluctuating requirements of the FIGAERO-HR-ToF-CIMS. The FIGAERO-HR-ToF-CIMS extracted 4 L per minute for gas phase measurements when operating in particle collection mode but only 2 L per minute while analysing the previously collected particle phase samples.

2.2. Methods

2.2.1. Data Processing

All results obtained using the SMPS and PASS3 instruments as well as the acidity values and concentrations of NOx and NH3 presented in this work are averages of measurements conducted over periods of around 30 min. Molecular speciation of toluene SOA was performed by analysing gas and aerosol samples drawn from the GO:PAM flow tube outlet at a rate of 4 L per minute by the FIGAERO-HR-ToF-CIMS, operating in particle collection mode. The FIGAERO-HR-ToF-CIMS operated in this mode in 30-min intervals; results obtained using other instruments when the FIGAERO-HR-ToF-CIMS was not operating in particle collection mode were discarded. Also excluded from the analysis were measurements of the SOA mass and bulk properties obtained in cases where the NOx concentration was initially very low or negligible, for example because the NOx ramp MFC valve failed to open.

2.2.2. Calculations

The toluene SOA mass was estimated using the previously reported densities of toluene SOA formed under low (1.24 g cm−3) and high (1.45 g cm−3) NOx conditions [20].
The absorption coefficient Babs and Bscat were calculated [42] as described in the operator’s manual of the PASS3 instrument.
The Mass Absorption Coefficient (MAC) of toluene SOA at a given wavelength λ, MACλ, was calculated as
MACλ = Babs(toluene SOA. λ)/toluene SOA mass
The Mass Scattering Coefficient (MSC) of toluene SOA at a given wavelength λ, MSCλ, was calculated as
MSCλ = Bscat(toluene SOA. λ)/toluene SOA mass
The total OH concentration exposure (OHexpo) under various experimental conditions was estimated using Equation (3) from the initial and final toluene concentrations in the flow reactor (Go: PAM) and the reaction constant (KOH) for the reaction between the OH radical and toluene [43] using Equation (3). The equivalent atmospheric aging was estimated in hours and days as OHexpo/3600 and OHexpo/86,400, respectively, as shown in Table S1 (See Supplementary Materials).
OH expo = ln ( T o l u e n e f i n a l T o l u e n e i n i t i a l )   K OH

2.2.3. Models

We used the Extended AIM Aerosol Thermodynamics Model [44] to estimate the aerosol water content in the H2SO4 seeds at various RH and the free H+ ion concentration in the aerosol phase. E-AIM is a community model for calculating gas/liquid/solid partitioning in aerosol systems containing inorganic and organic components and water, and solute and solvent activities in aqueous solutions and liquid mixtures. We used Model I under the assumption that the H2SO4 seeds in our experiments would have instantaneously absorbed water before the SOA condensed on them during the toluene-OH oxidation and condensation process. These calculations were used to estimate the pH of the aerosol mixture of H2SO4 coated with SOA.

3. Results and Discussion

3.1. Summary of Key Experimental Results

The mass of SOA formed at [NOx]/[ΔHC] molar ratios below 0.15 was substantially greater than at higher [NOx]/[ΔHC] values. Previous studies attributed the reduced SOA mass at higher NOx concentrations to the formation of nitrogen-rich SOA compounds such as organo-nitrates, which are relatively volatile and thus have a strong tendency to partition into the gas phase [45,46]. We therefore analyse the nitrogen-poor (NP) and nitrogen-rich (NR) SOA formation regimes separately.
The main experimental results obtained in this work are summarized in Table 2. It should be noted that the initial toluene and O3 concentration and the UV light intensity were the same in all experiments. However, the amount of toluene reacted (ΔHC) differed between experiments, especially in experiments Tol-1 to Tol-4, where RH was the only quantity that varied. This difference in ΔHC can be attributed to the variation in RH, which was found to be strongly and positively correlated with ΔHC (See Figure S1). The absorption of the 781 nm laser light by both SOA types was negligible (i.e., within the noise range) and is therefore not discussed further. The remaining experimental findings are discussed in more detail below.

3.2. Influence of NOx and RH on SOA (Experiments: Tol-1 to Tol-4)

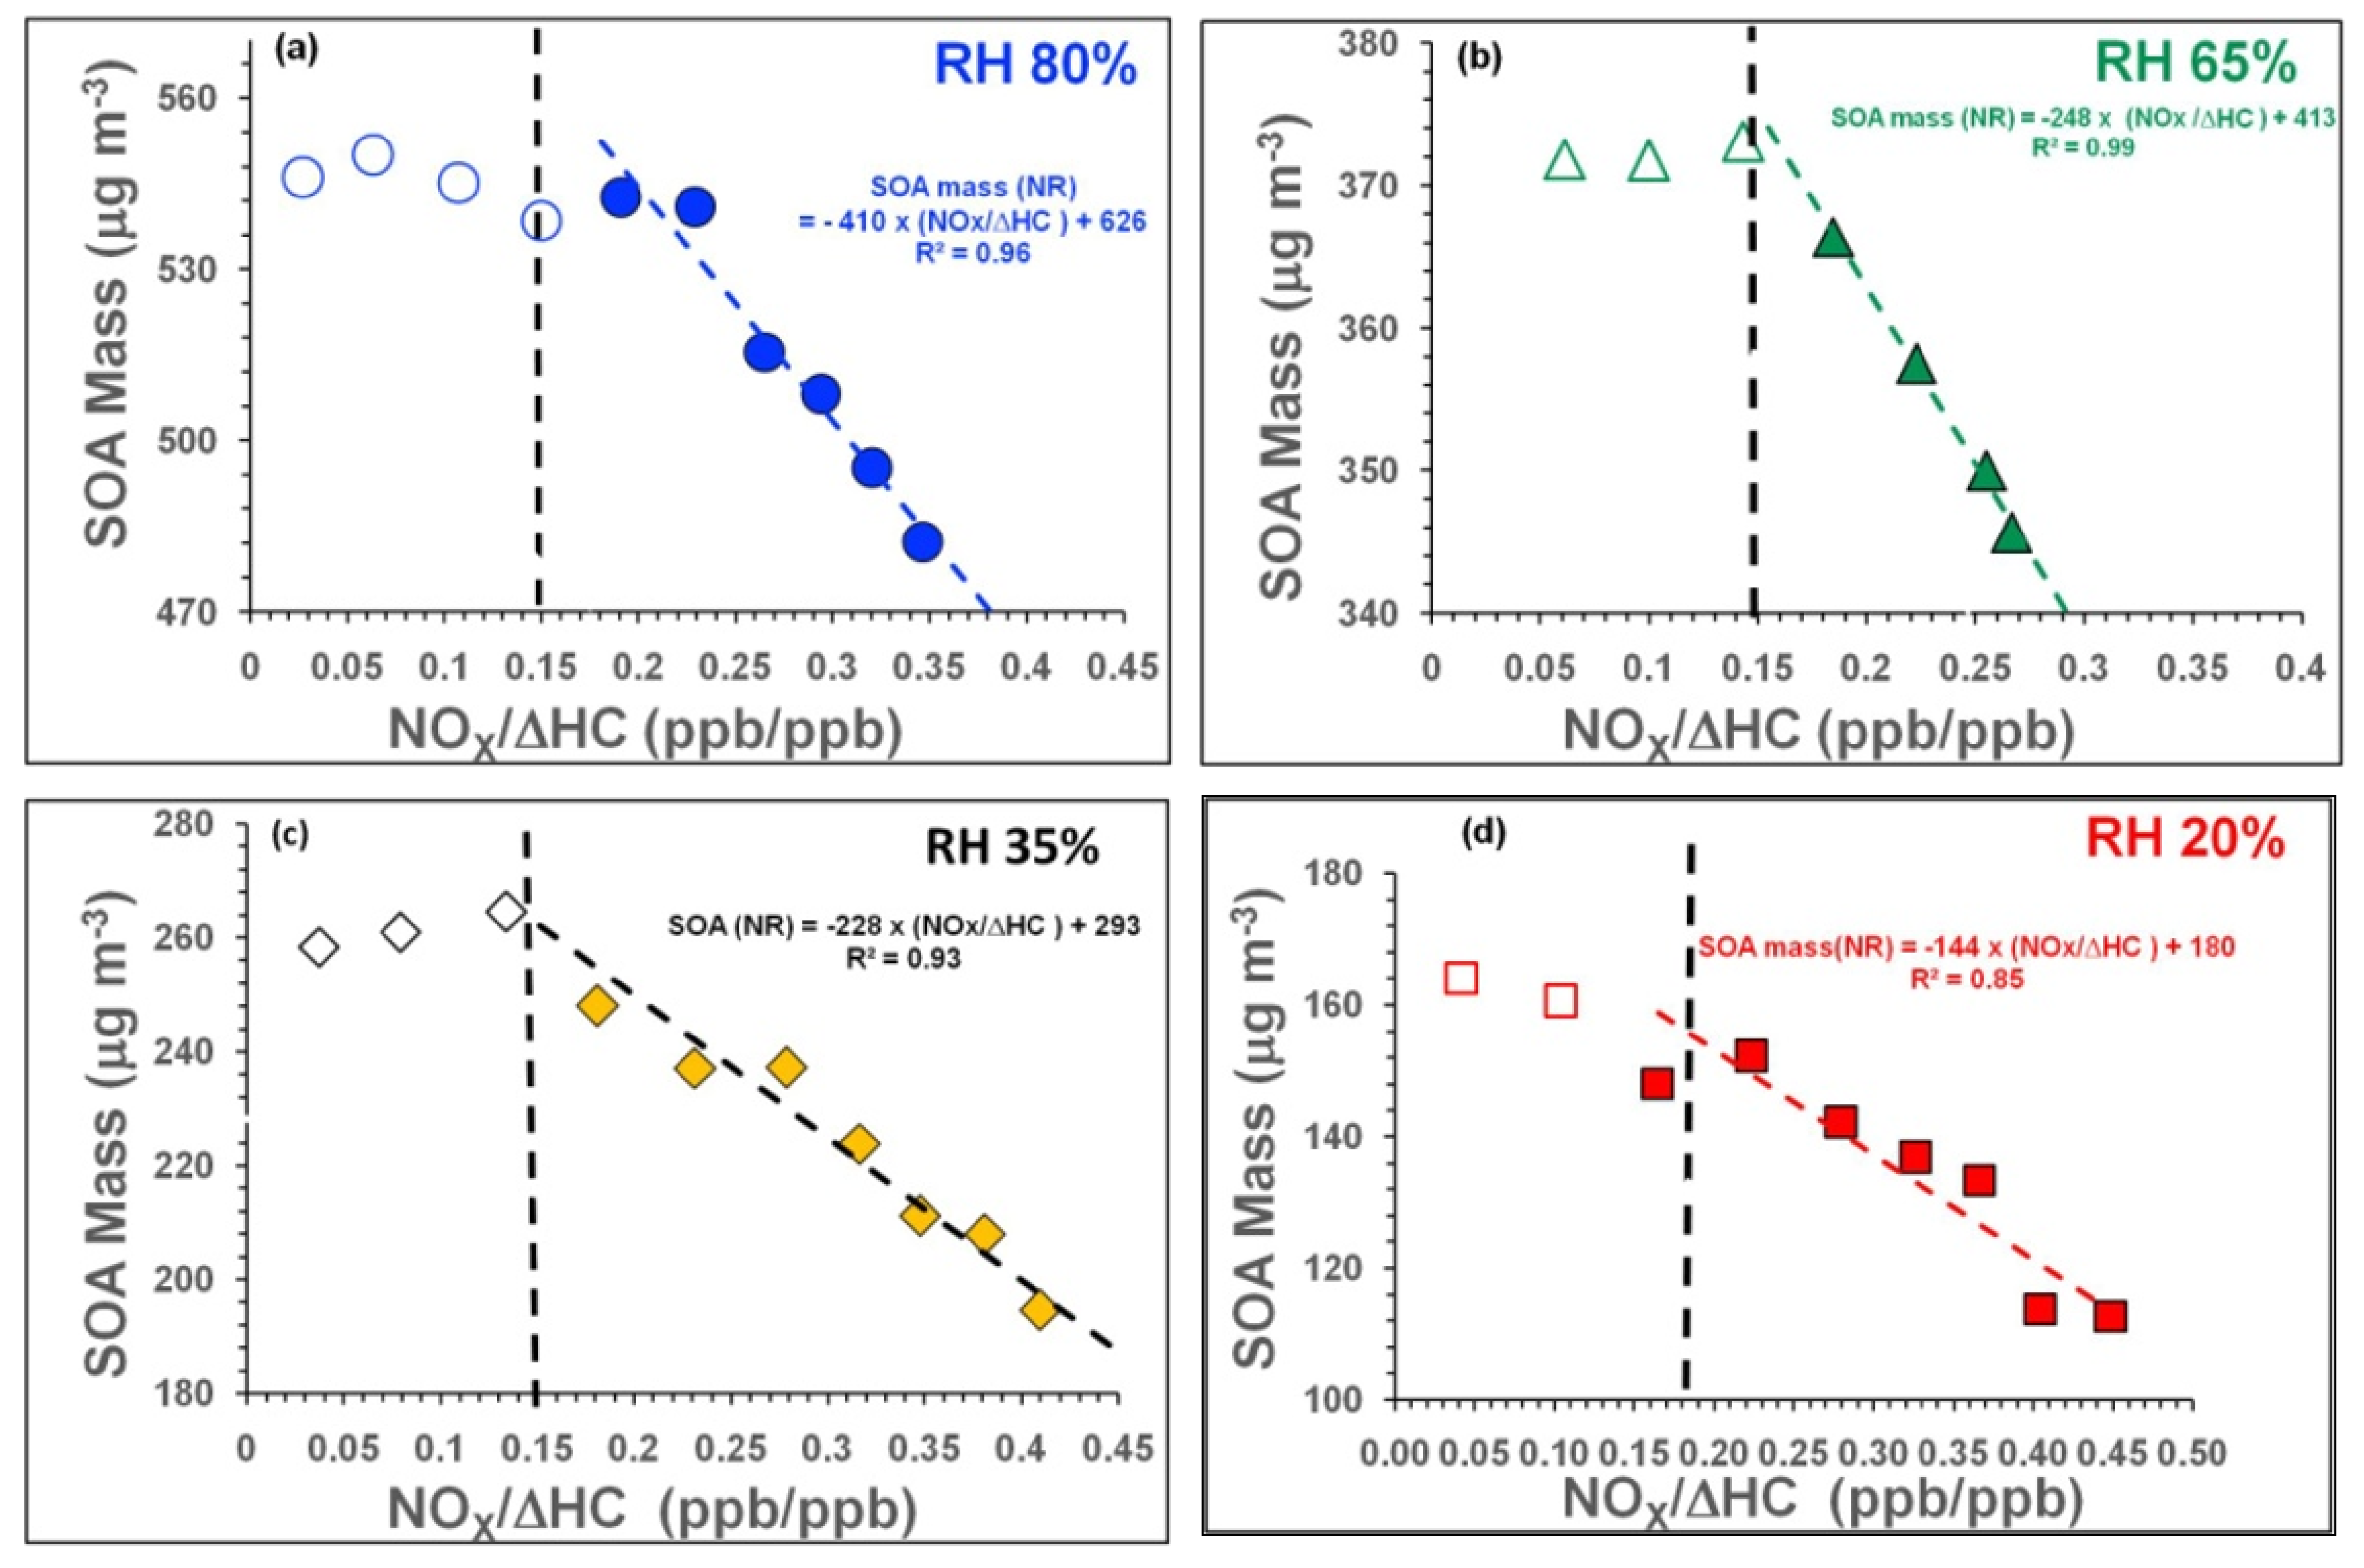
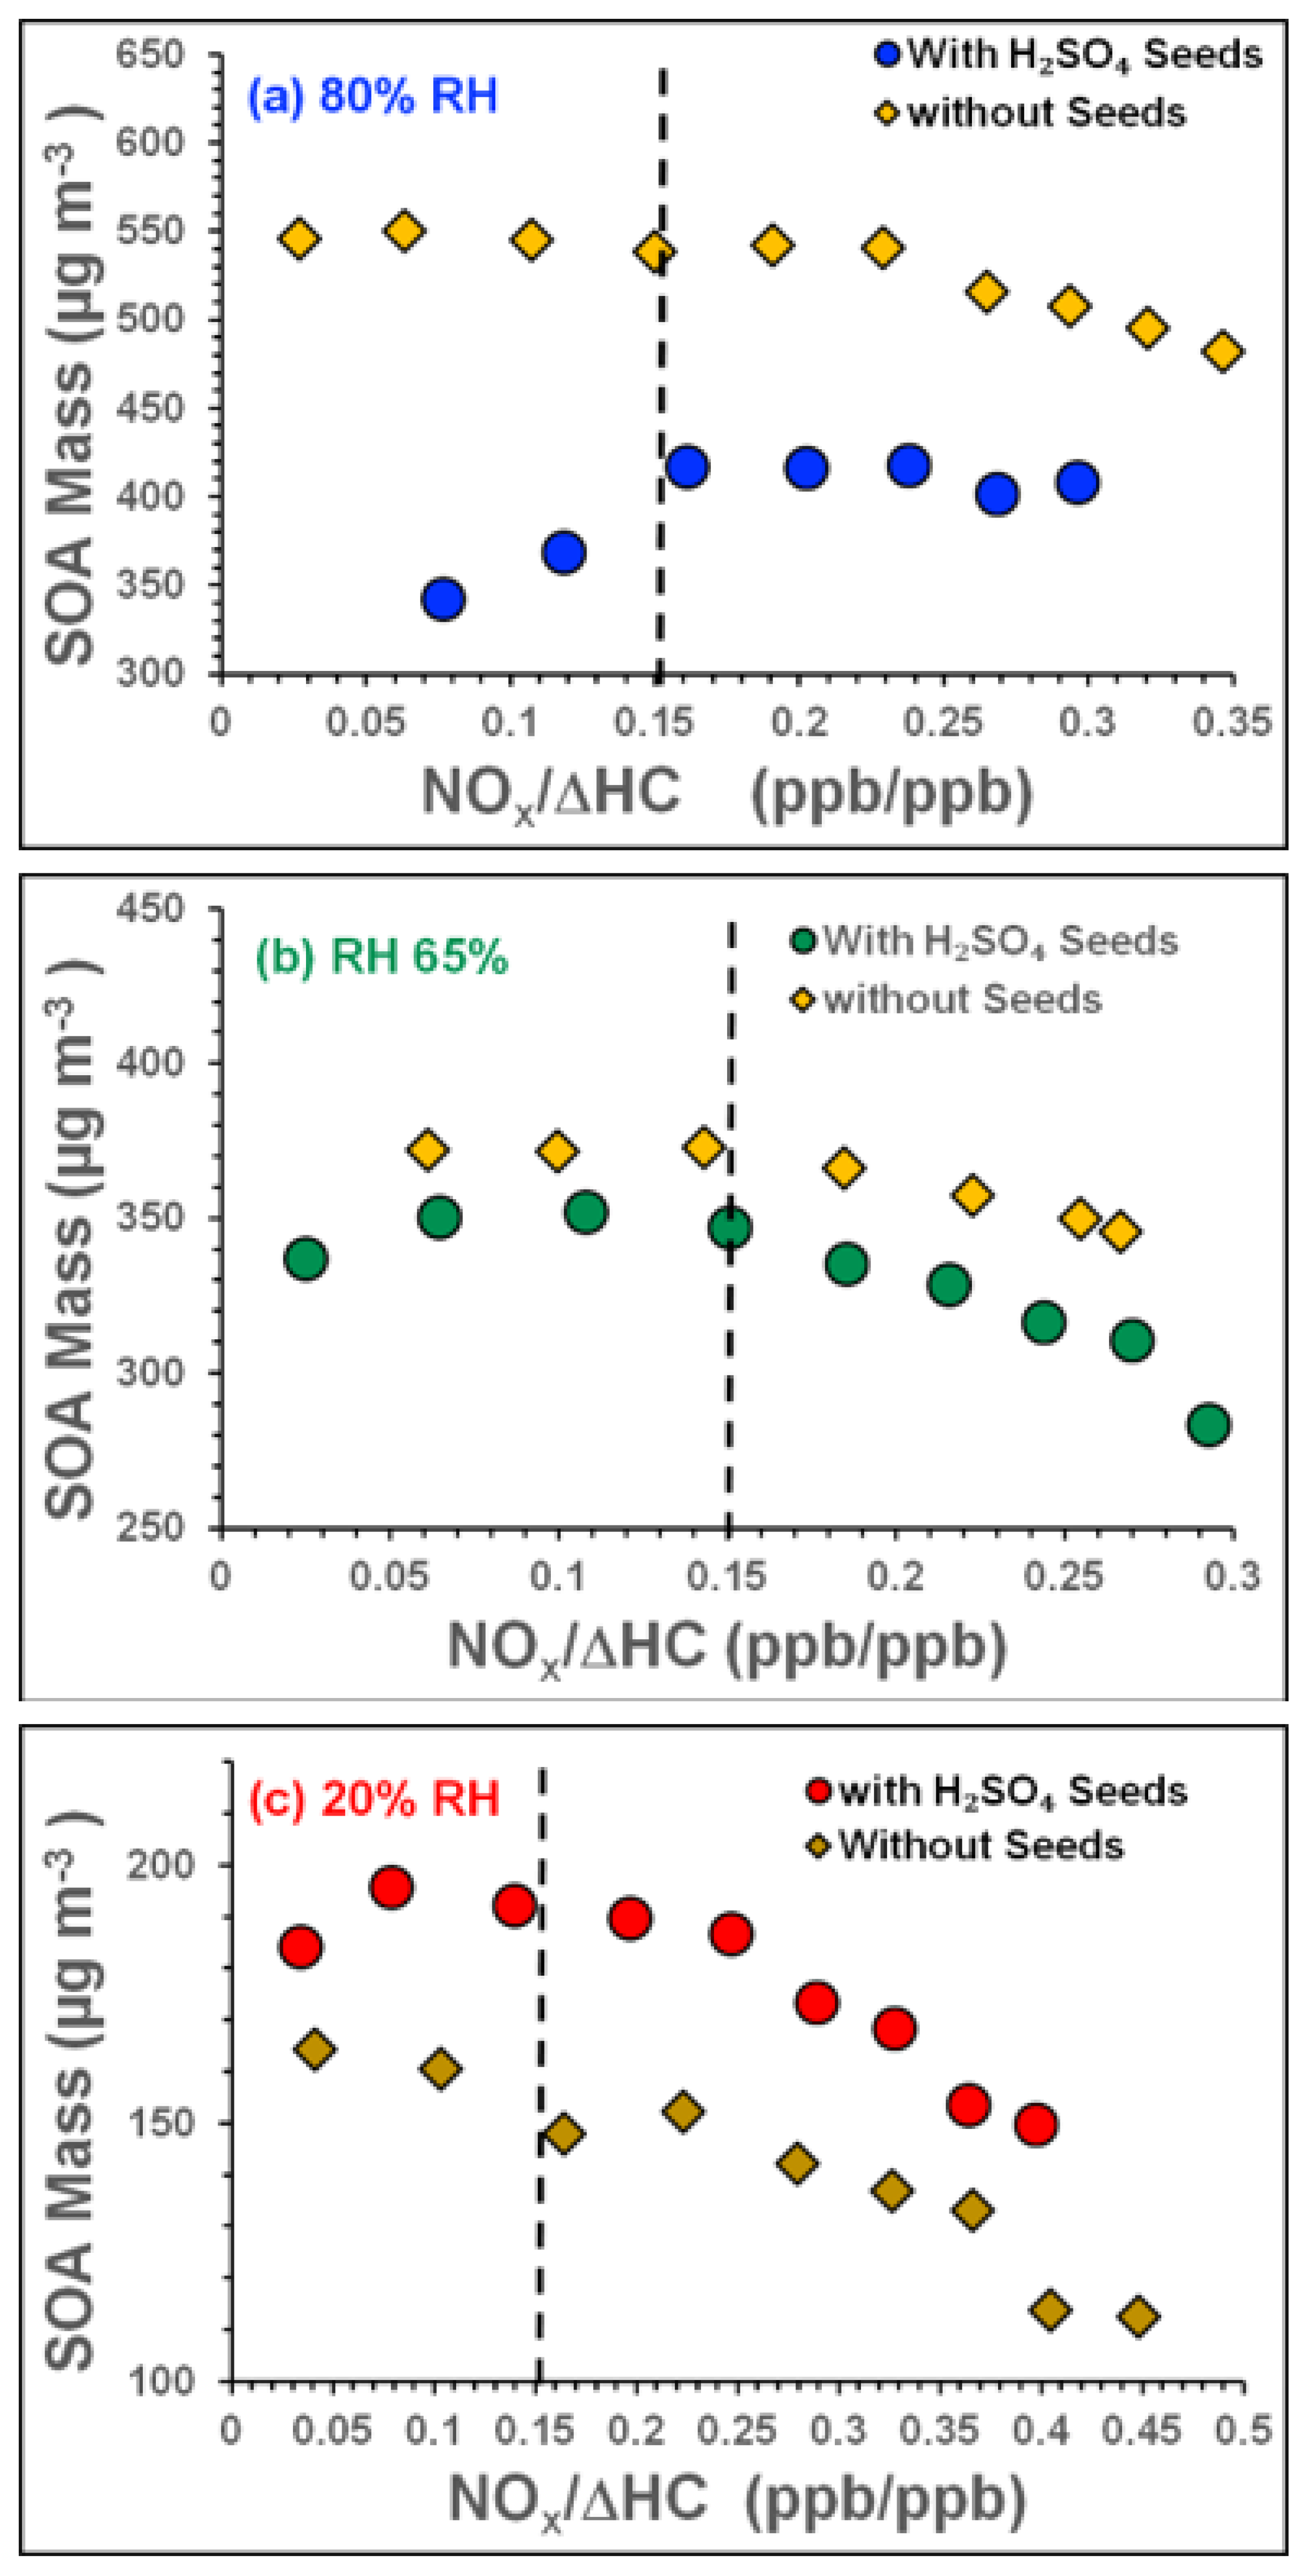
3.2.1. Influence of NOx and RH on SOA Mass Formation

As shown in Figure 1a–d, the SOA mass generally declined non-linearly as [NOx]/[ΔHC] increased in experiments Tol-1 to Tol-4; it was largely independent of [NOx]/[ΔHC] under NP conditions ([NOx]/[ΔHC] ≤ 0.15) but decreased with increasing [NOx]/[ΔHC] under NR conditions ([NOx]/[ΔHC] > 0.15). This suggests that the ongoing chemical reactions favoured the formation of more volatile organic products under NR conditions.
Conversely, the light absorption of the SOA (measured in terms of the aerosol absorption coefficient at 405 nm, i.e., Babs,405) generally increased with [NOx]/[ΔHC], irrespective of NP or NR regimes. However, the increase was again non-linear; in experiments Tol-1–Tol-4, Babs increased moderately with increasing [NOx]/[ΔHC] under NP conditions but the increase became steeper under NR conditions, as shown in Figure 2. These trends confirm the formation of some prominent SOA chromophores due to the influence of NOx on toluene-OH chemistry in the presence of water.
The results shown in Figure 1 and Figure 2 indicate that [NOx]/[ΔHC] has two opposing effects on SOA formation; higher [NOx]/[ΔHC] levels promote the formation of light absorbing chromophores (browning molecules) but reduce that of molecules contributing to SOA mass.
The effect of RH on the SOA mass was also non-linear. Under both NP and NR conditions, the SOA mass increased with the RH (see Figure S2 in Supplementary Materials) but the SOA mass was always higher under NP conditions than NR conditions, all else being equal. The increase in the SOA mass with the RH can be attributed to several factors including the amount of toluene reacted, the initial OH concentration, and the hygroscopic growth of SOA. As the RH increases, so too does the OH concentration in the reaction zone of the GO:PAM flow-tube, leading to higher toluene consumption and thus greater SOA mass formation. Water-mediated OH chemistry may also have contributed to SOA mass formation at the highest tested RH (80%). The effect of NOx on the SOA mass was comparatively small (the SOA masses at the highest and lowest NOx concentrations differed by <20%) and may be linked to the formation of nitrogen-rich SOA via RO2+NO reactions. These processes influenced the composition of the product compounds, for example by increasing the abundance of organo-nitrates (RONO2) at high NOx concentrations. They also influenced the distribution of common products such as carbonyls (R=O) [45]. Because the SOA mass depends on the distribution of product vapor pressures, it would be expected to be influenced by the [NOx]/[ΔHC] ratio, especially in the NR regime.

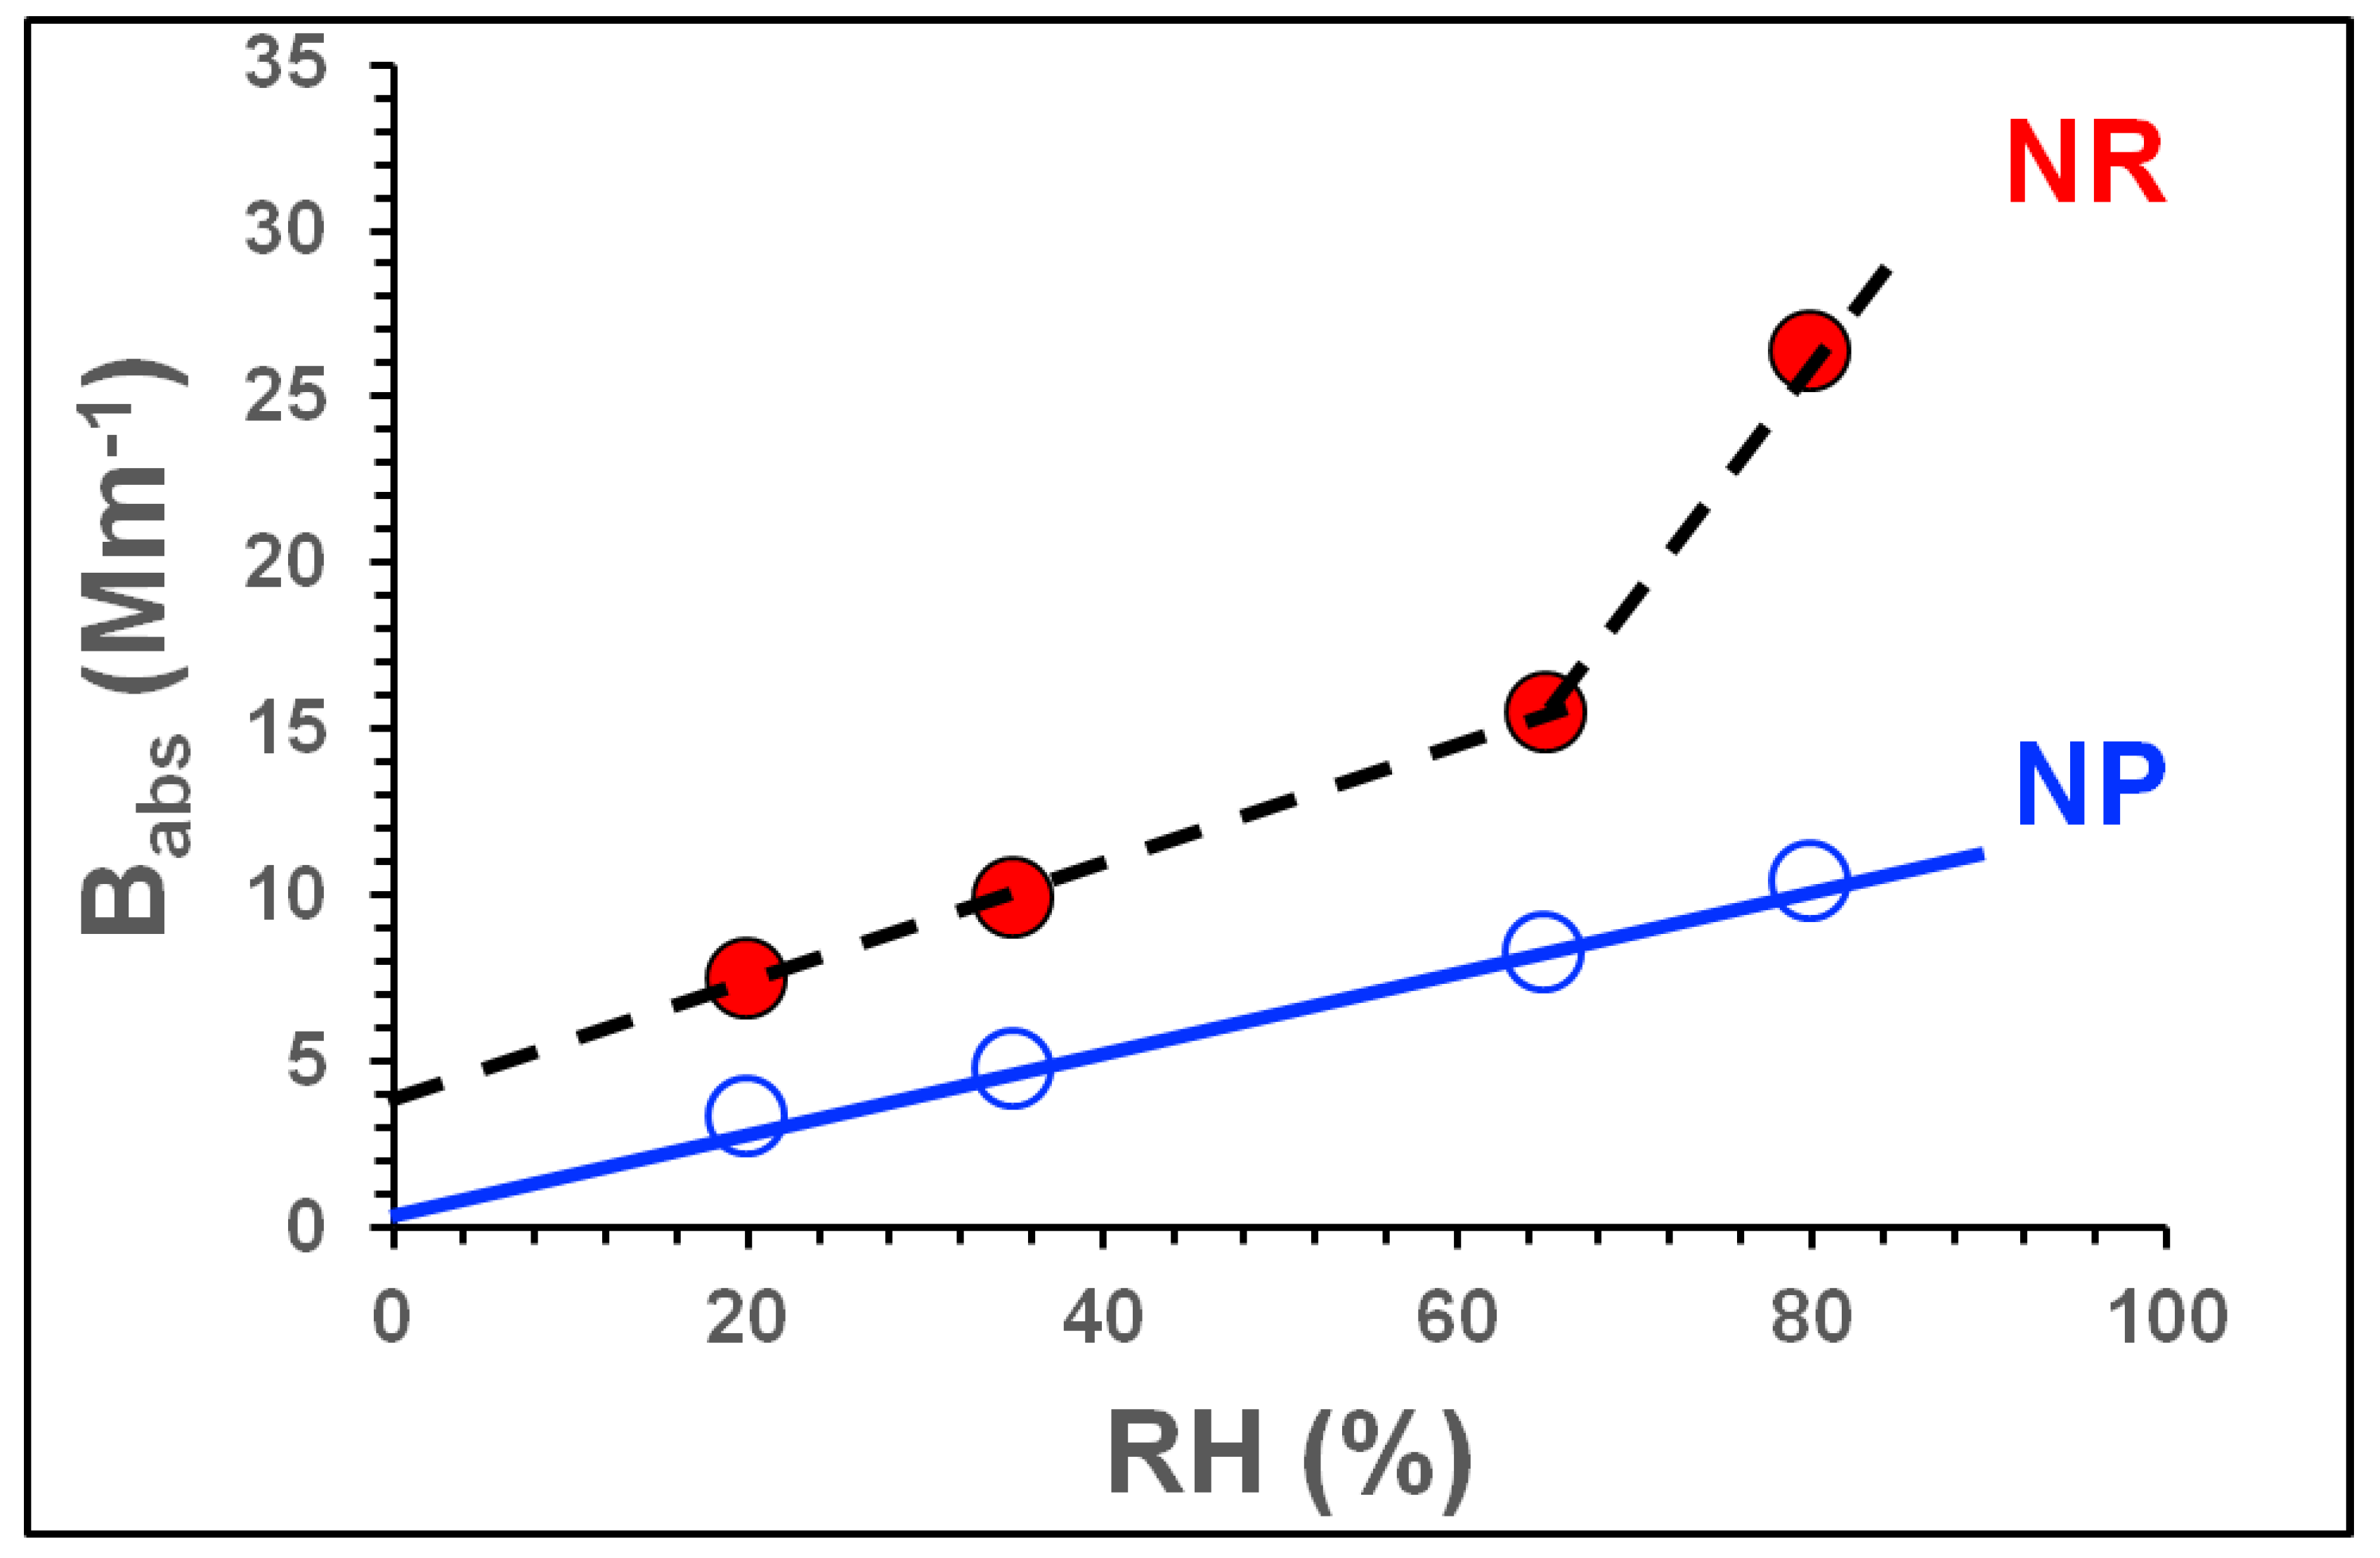
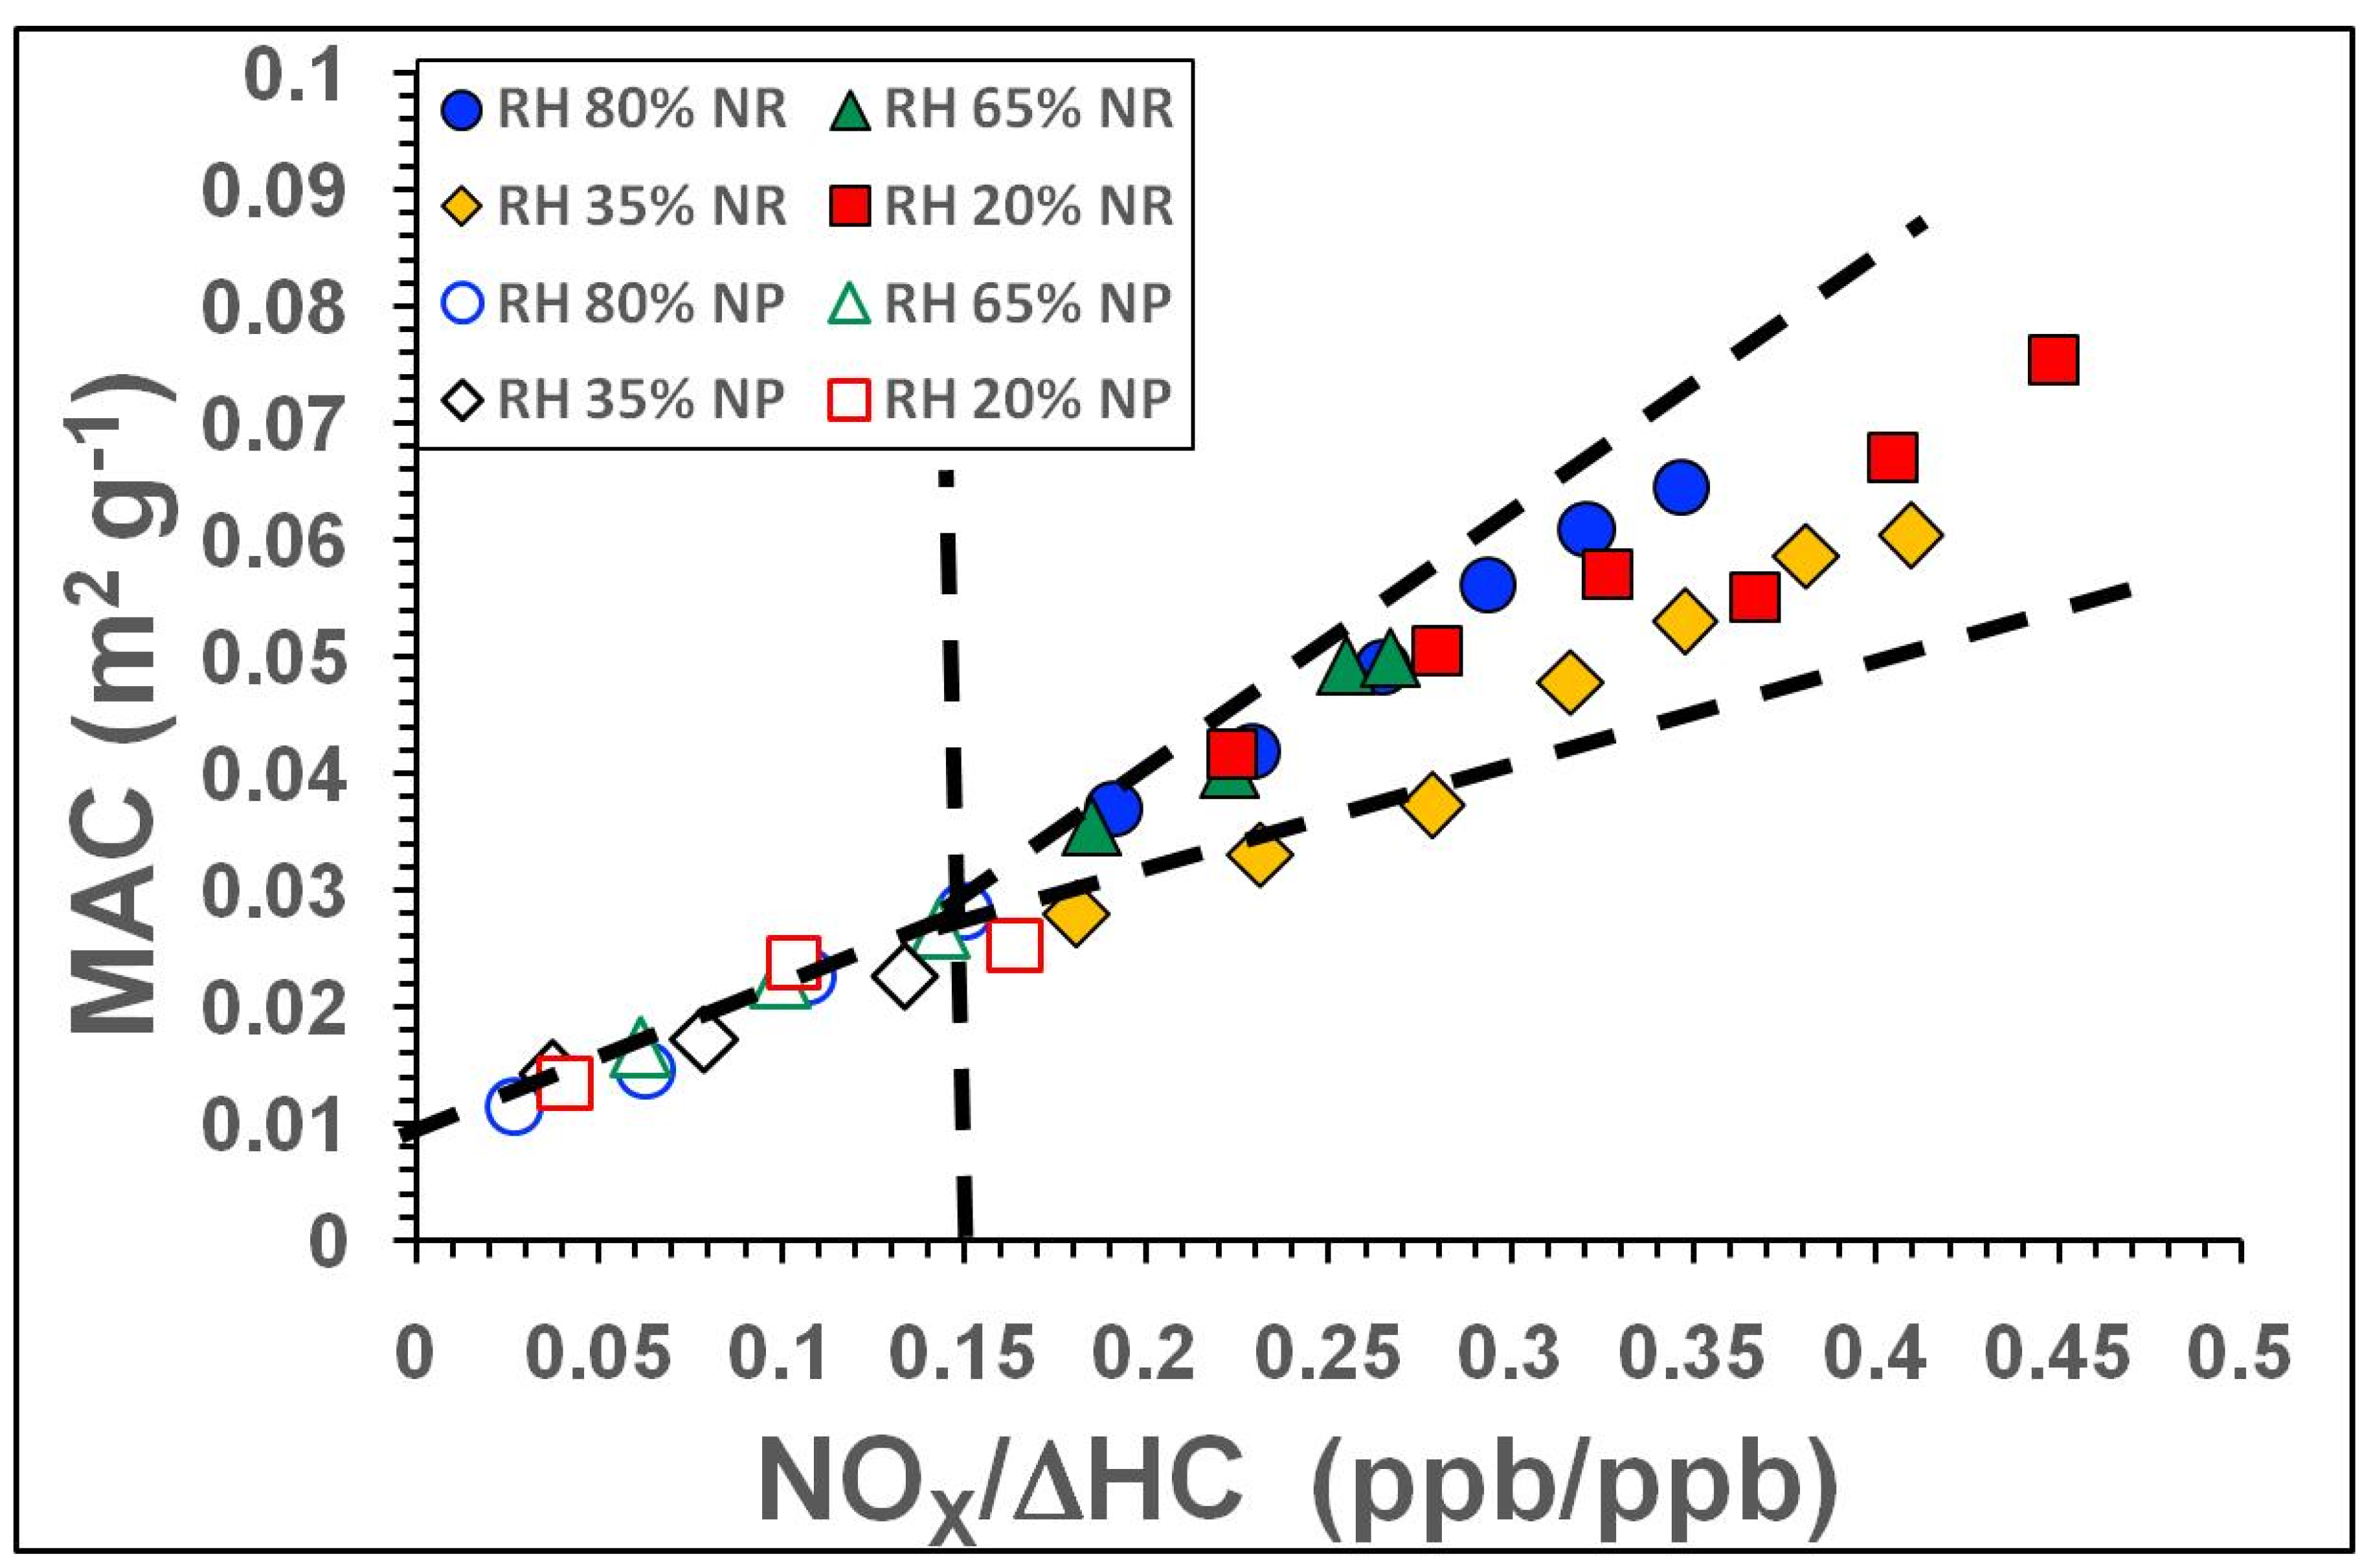
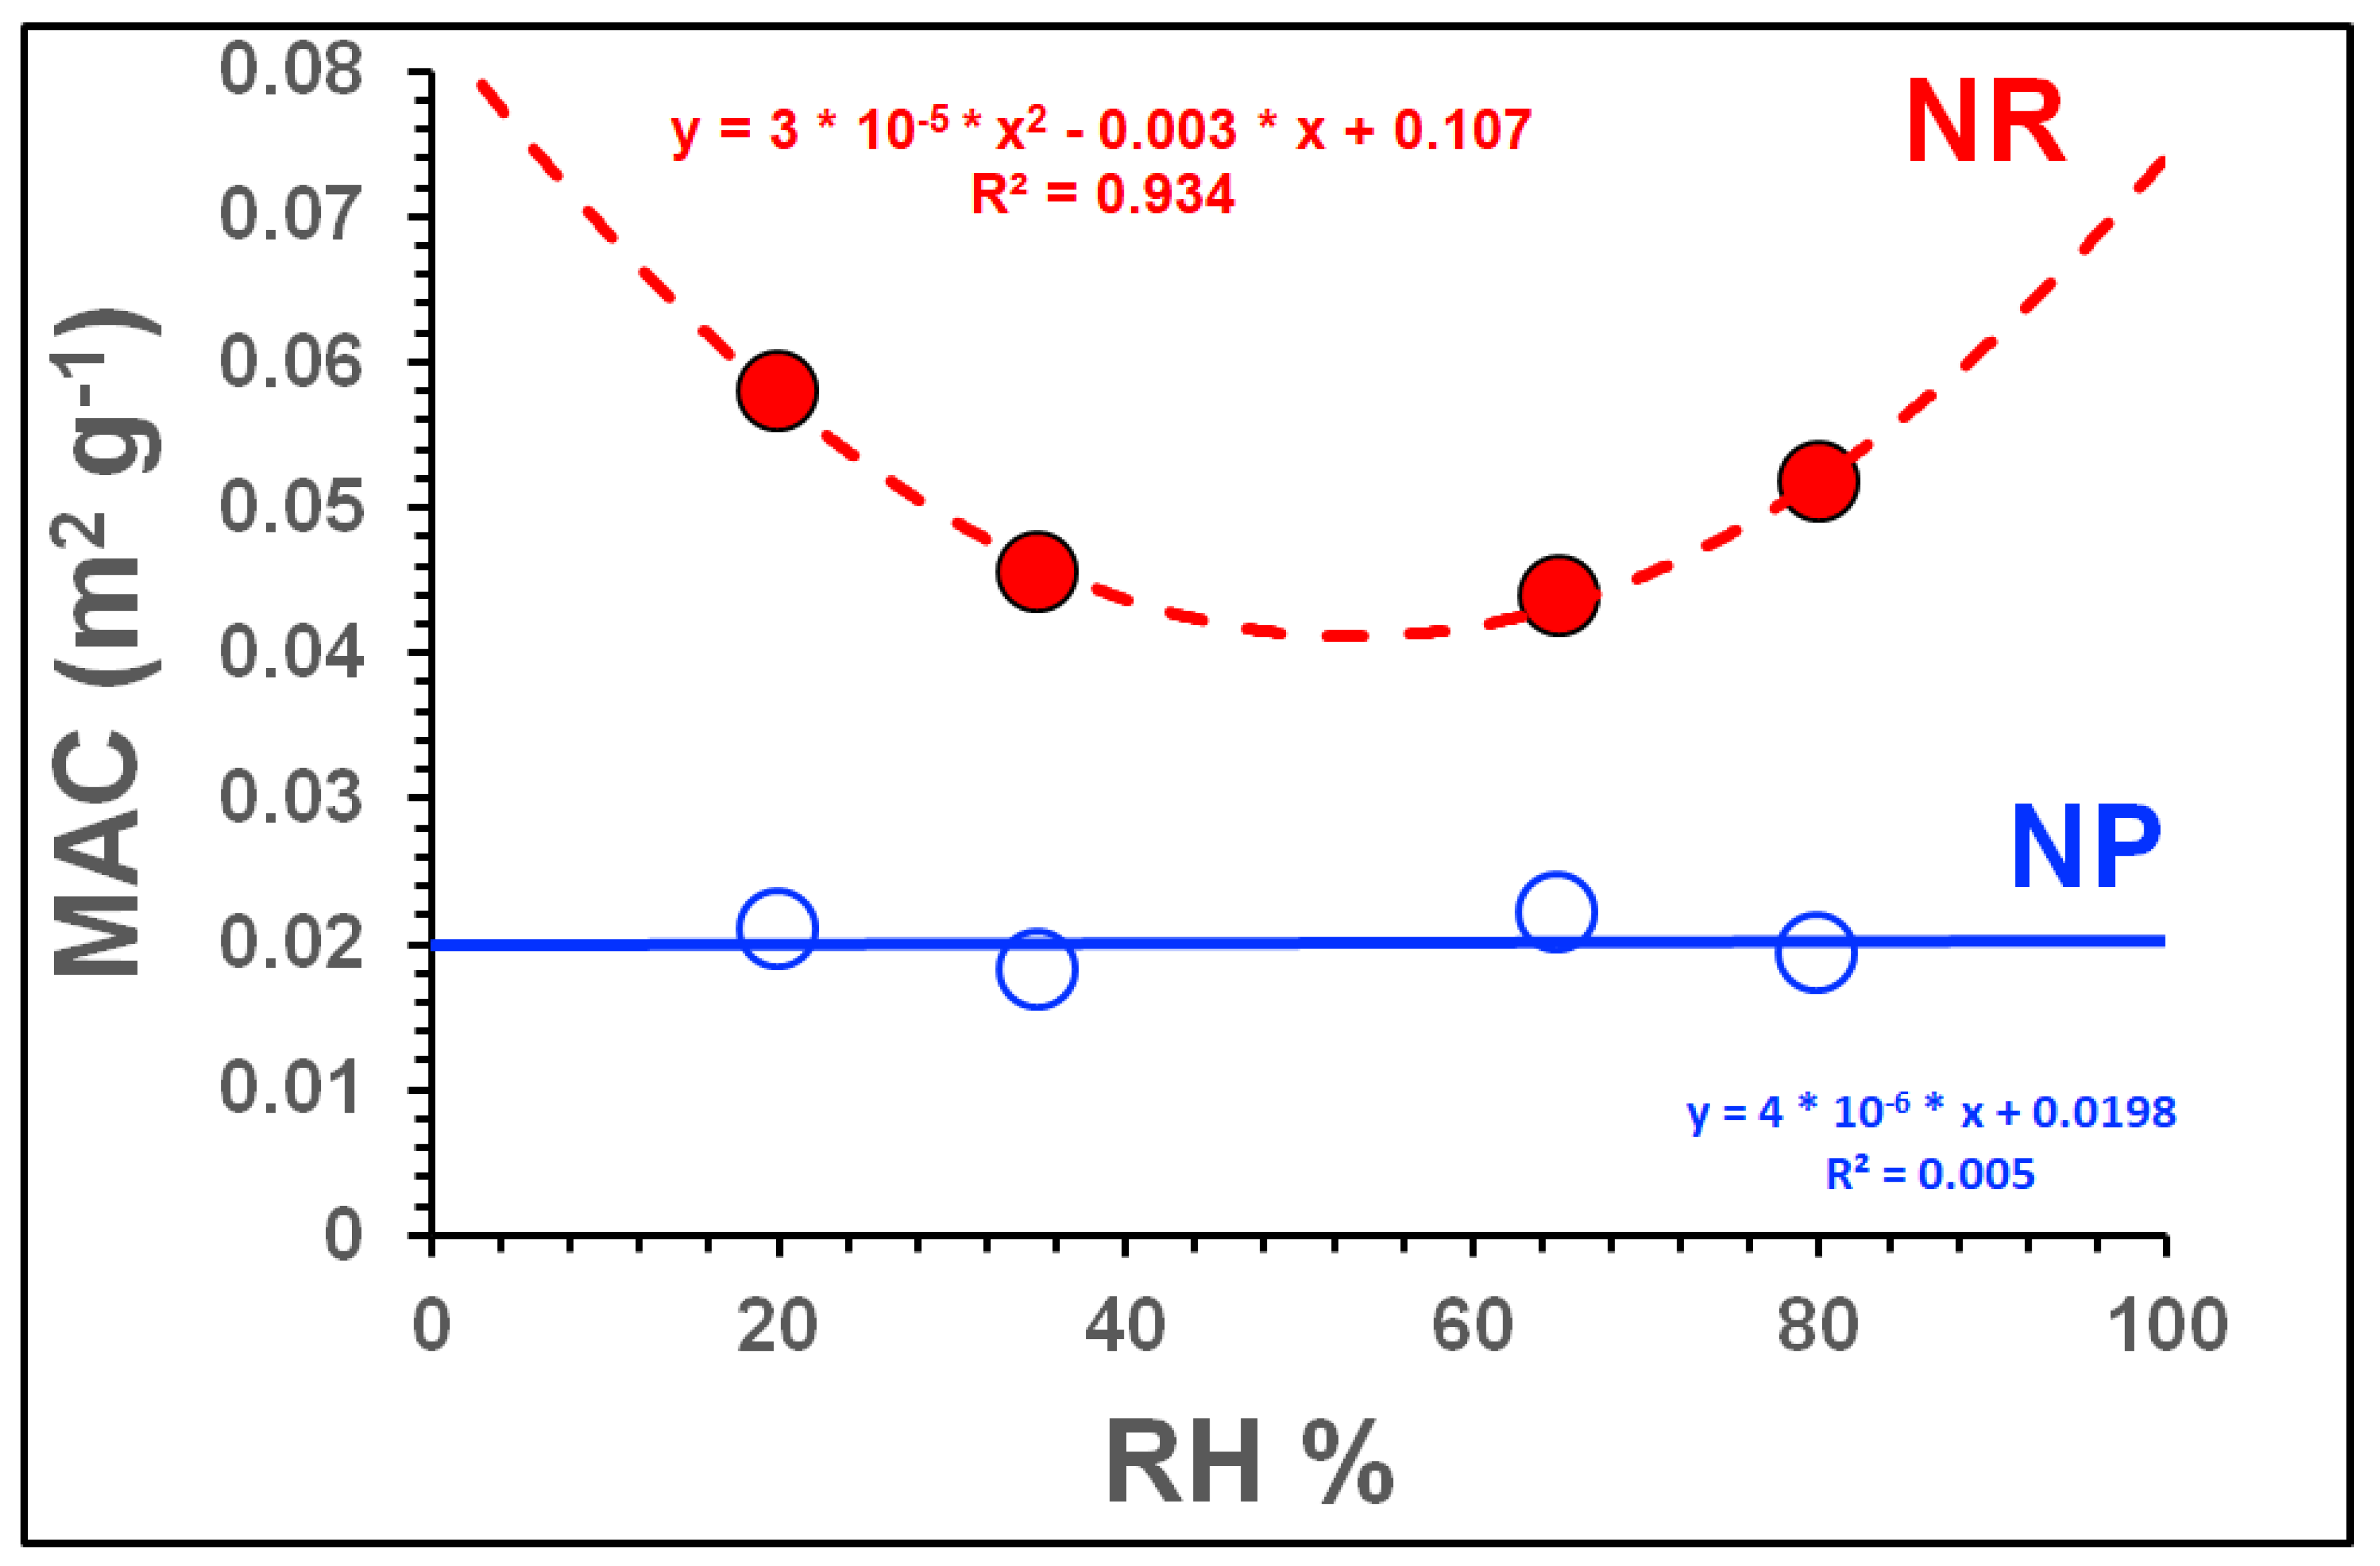
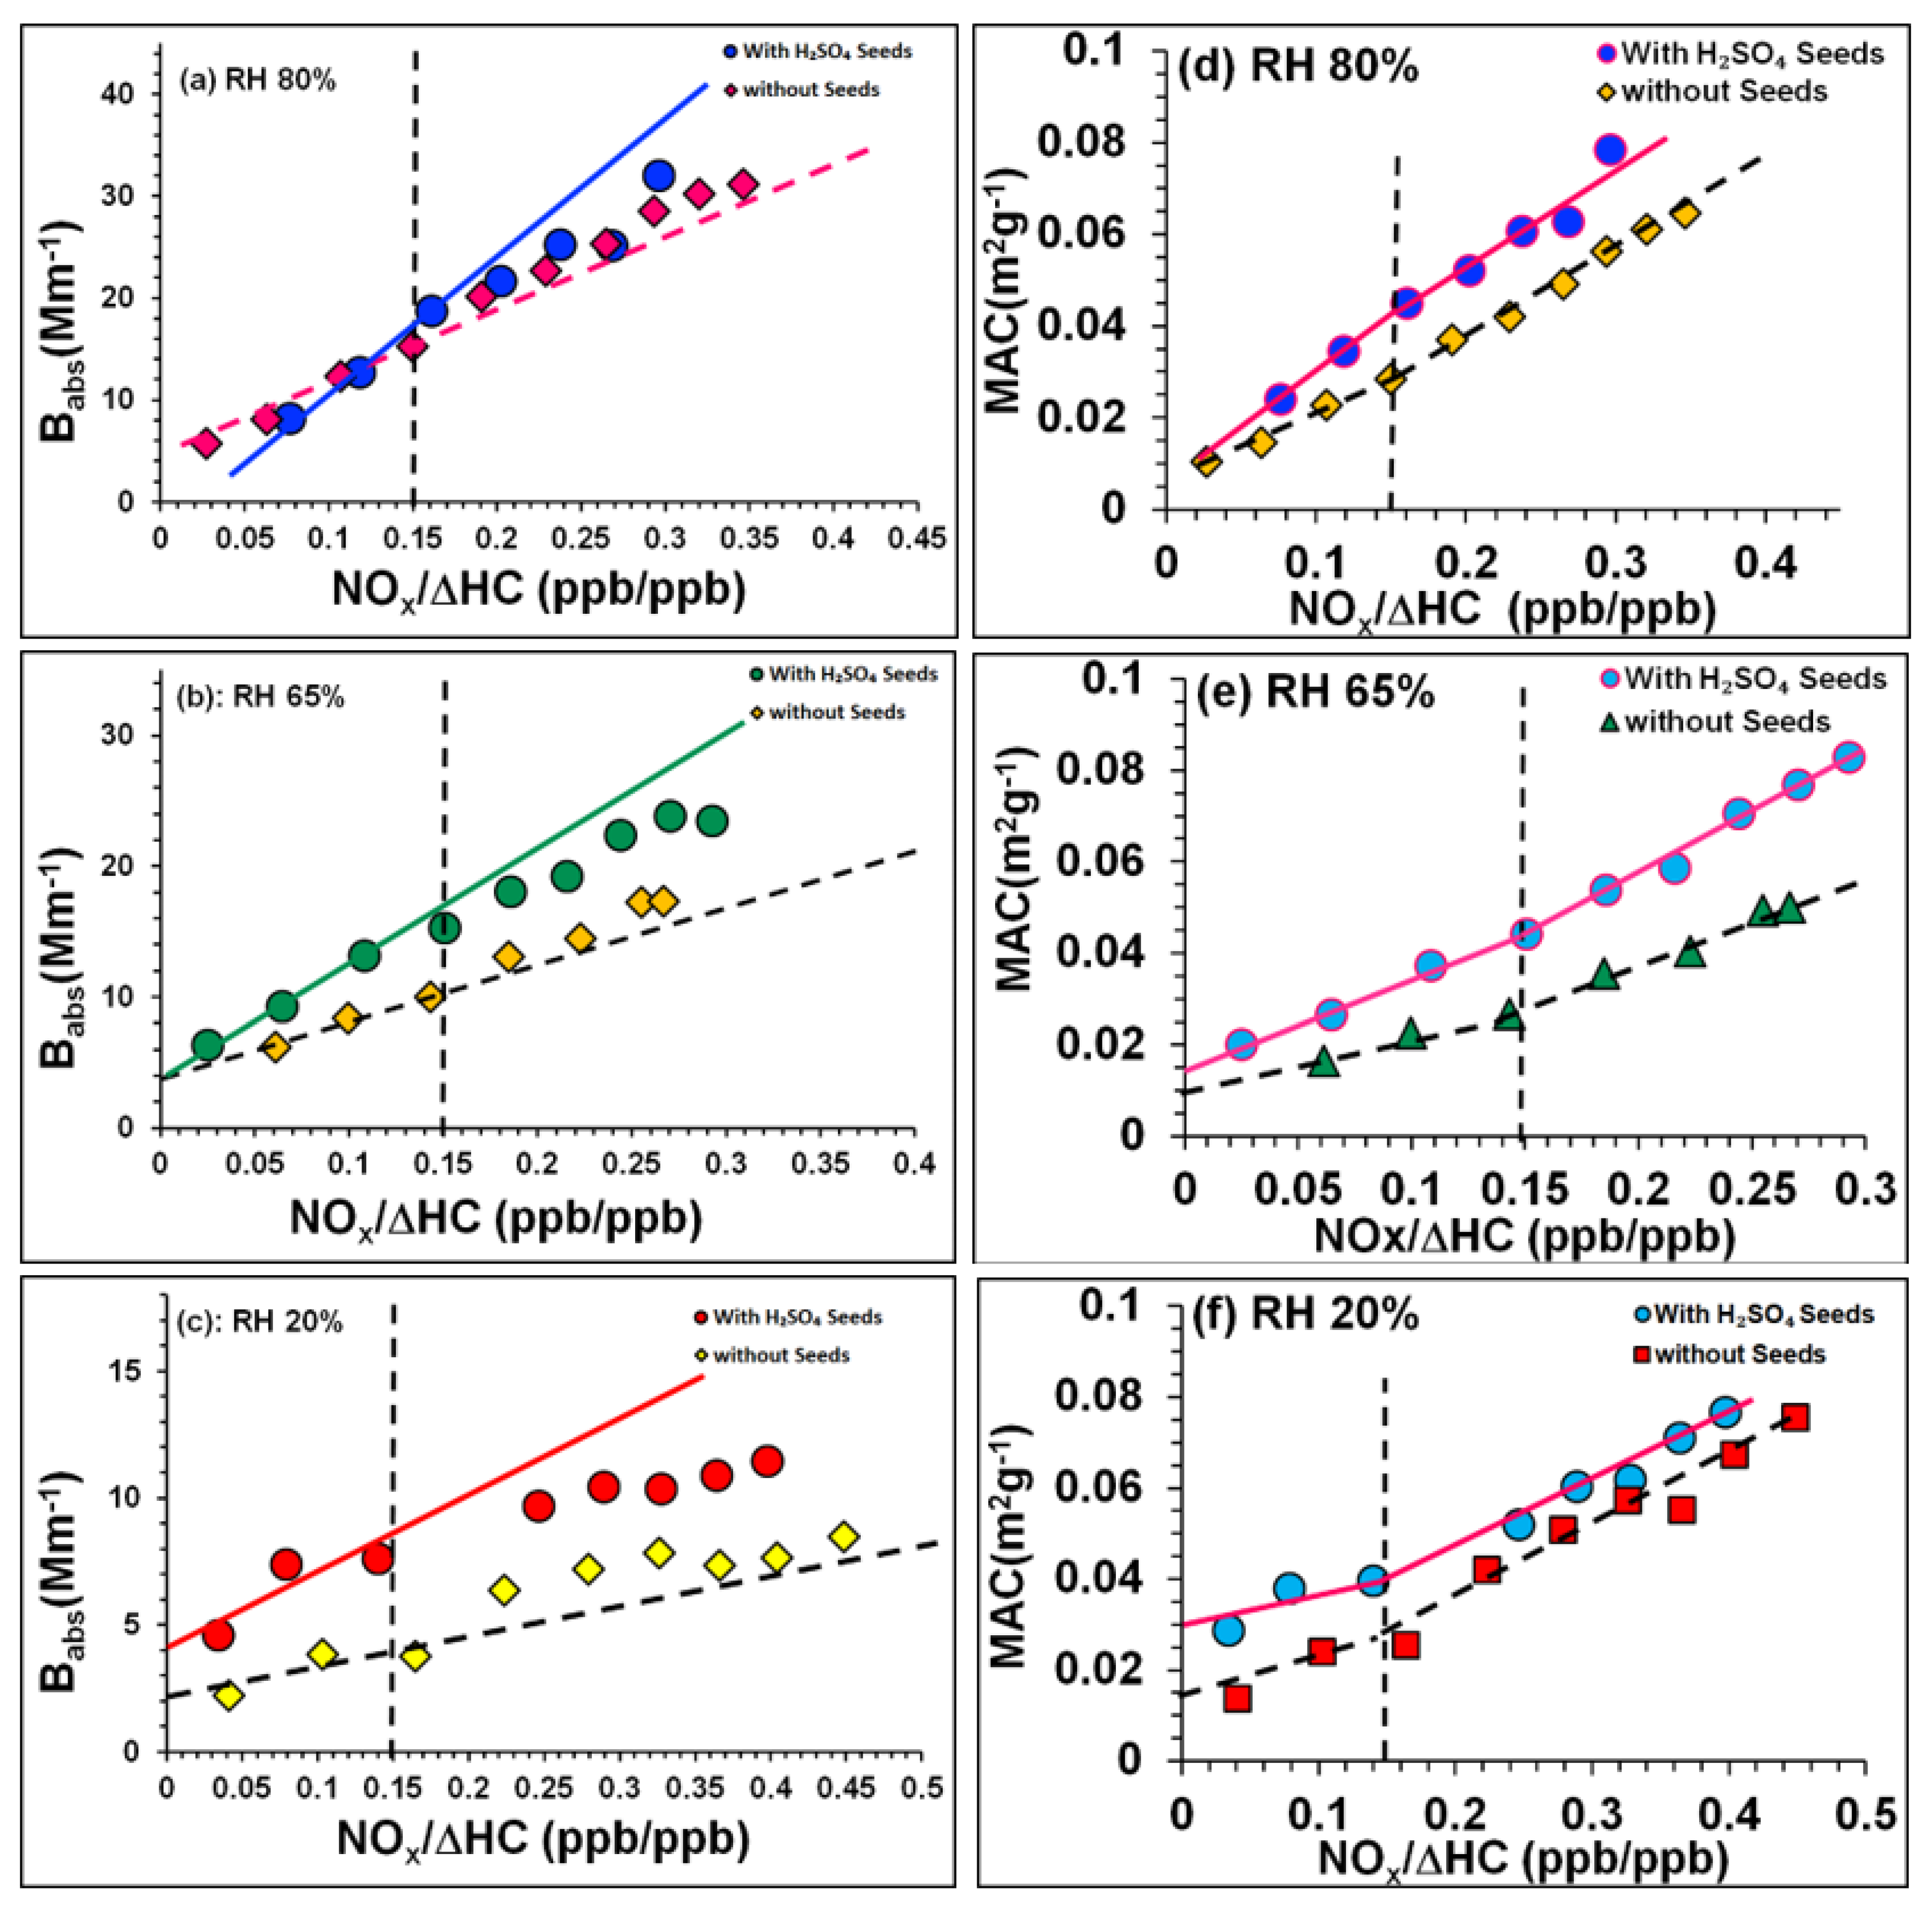
3.2.2. Influence of NOx and RH on Light Absorption

As outlined previously (see Section 3.2.1 and Figure 2), NOx promoted the formation of BrC-rich SOA. However, unlike the SOA mass, Babs increased steadily with [NOx]/[ΔHC] in the NP regime at the higher RH. Both the absolute values of Babs and the slope of the plot of Babs against RH became higher as the NOx increased from NP to NR regimes. The trend towards higher Babs values at higher RH is consistent with the trends observed for mass (see Figure 1). These results indicate that NOx- and water-mediated toluene-OH chemistry promote both SOA mass formation and BrC formation at high RH values (e.g., 80%) due to the synergistic effects of water vapour and high OH concentrations on water-mediated OH chemistry. These effects can also be seen in Figure 3, which shows the variation of Babs with RH under NR and NP conditions. Under NP conditions, Babs increases linearly with RH, but under NR conditions the increase becomes steeper and non-linear, as shown in Figure 3. These results suggest that the effect of RH on Babs (and thus BrC formation) is primarily due to water-mediated OH chemistry, and that the effect of NOx on the formation of BrC compounds (i.e., chromophores) is modest. In addition, the sudden non-linear increase in Babs at high RH (80%) under the NR regimes suggests that water-mediated NOx chemistry plays a significant role in the formation of strongly light-absorbing compounds under these conditions without greatly increasing the total SOA mass; the SOA masses under the NP and NR regimes were within 10–20% of each other at the same RH (see Figure S2 in Supplementary Materials).
The mass absorption cross section (MAC) of the SOA was estimated by normalizing Babs against the SOA mass (see Table S2 in the Supplementary Materials and Table 3). Figure 4 clearly shows that like the Babs, MAC of the SOA increased with [NOx]/[ΔHC] under all RH conditions, with a clear “switching point” at [NOx]/[ΔHC] = 0.15. The clear increase in MAC with [NOx]/[ΔHC] in the NP regime shows that NOx played a significant role in chromophore formation chemistry even when its concentration was low and that more strongly light-absorbing chromophores were formed as [NOx]/[ΔHC] increased. In other words, the light absorption potential of the formed SOA was highly sensitive to the [NOx]/[ΔHC] ratio under both NP and NR regimes. Interestingly, the increase in MAC due to the influence of NOx under NP conditions was independent of RH. At 80% RH, the increase in MAC with increasing [NOx]/[ΔHC] was slightly steeper under NR conditions than under NP conditions. However, the difference between NP and NR conditions was less clear at lower RH values (e.g., 35% RH).
Figure 5 shows how the influence of RH on the MAC clearly differed between the NP and NR regimes. This outcome is not easily explained and suggests the influence of two or more competing processes, notably (i) hygroscopic growth of the formed SOA, which increases the SOA mass through the incorporation of aerosol liquid water (ALW); and (ii) the water-mediated chemistry of the toluene-NOx-OH system and its effects on the composition and hygroscopicity of the formed SOA.
At a given RH, the Babs value of the SOA reflects only the number of chromophores formed as a result of toluene-NOx-OH-water-mediated chemistry. The increase in Babs with [NOx]/[ΔHC] indicates that NOx-water chemistry has an important effect on MAC at high RH levels. At the same time, hygroscopic growth at high RH enhances the contribution of ALW to the SOA mass measured by the SMPS, which is calculated using the SOA density functions of Ng et al. [20]. This in turn leads to underestimation of the MAC at high RH. These two processes may have opposing effects on the MAC because hygroscopic growth increases SOA mass, while toluene-NOx-OH-water-mediated chemistry promotes BrC formation. At high RH, hygroscopic growth reduces MAC, while VOC-NOx-OH-H2O-mediated chemistry increases Babs.
The trends in SOA formation observed in experiments Tol-1 to Tol-4 at RH values of 80% to 20% under NP and NR regimes were similar to those reported by Liu P. et al. [33]. However, the mass enhancement factor (MEF)determined at the lowest RH examined in our experiments (20%; see Figure S3 of the Supplementary Materials) was significantly higher than that reported by Liu P. et al. [33], which is notable because these authors studied a very hygroscopic toluene SOA formed at almost 1% RH and examined its absorption of water at higher RH values. Therefore, hygroscopic growth alone cannot explain the high MEF observed in this work. Instead, the MEF trends observed here can be attributed to several factors that were discussed above, namely: (i) the increase in the SOA mass due to increased concentrations of both OH radicals and reacted toluene [ΔHC] at higher RH values; (ii) the greater hygroscopicity of SOA formed at higher RH values and more extensive heterogeneous oxidation of SOA due to aging; and (iii) the influence of NOx chemistry on the gas-aerosol partitioning and hygroscopicity of the SOA. In addition, Liu T. et al. [34] showed that increasing OH exposure during SOA formation caused a sharp increase in ALW at constant RH in the low NOx regime. However, when normalized against the dry SOA mass, the ALW did not increase significantly as the OH concentration increased, indicating that the hygroscopicity of toluene SOA (i.e., its capacity to absorb water) at a given RH was independent of the OH concentration and was thus unaffected by OH-water mediated chemistry. This in turn implies that the large differences between the MEF values obtained in this work and those reported by Liu P. et al. [33] can be attributed to the water-mediated toluene-OH chemistry of NP SOA. Additionally, since the NP and NR MEF curves almost overlapped each other, it can be assumed that the hygroscopicity of NR SOA was similarly insensitive to high OH exposure at high RH levels, and also to high NOx concentrations. We therefore used the parametrization of Liu P. et al. [33] (See Equation (S18) in the Supplementary Materials of Liu P. et al.) to estimate the ALW contents of the SOAs prepared in this work, which are listed in Table 3.

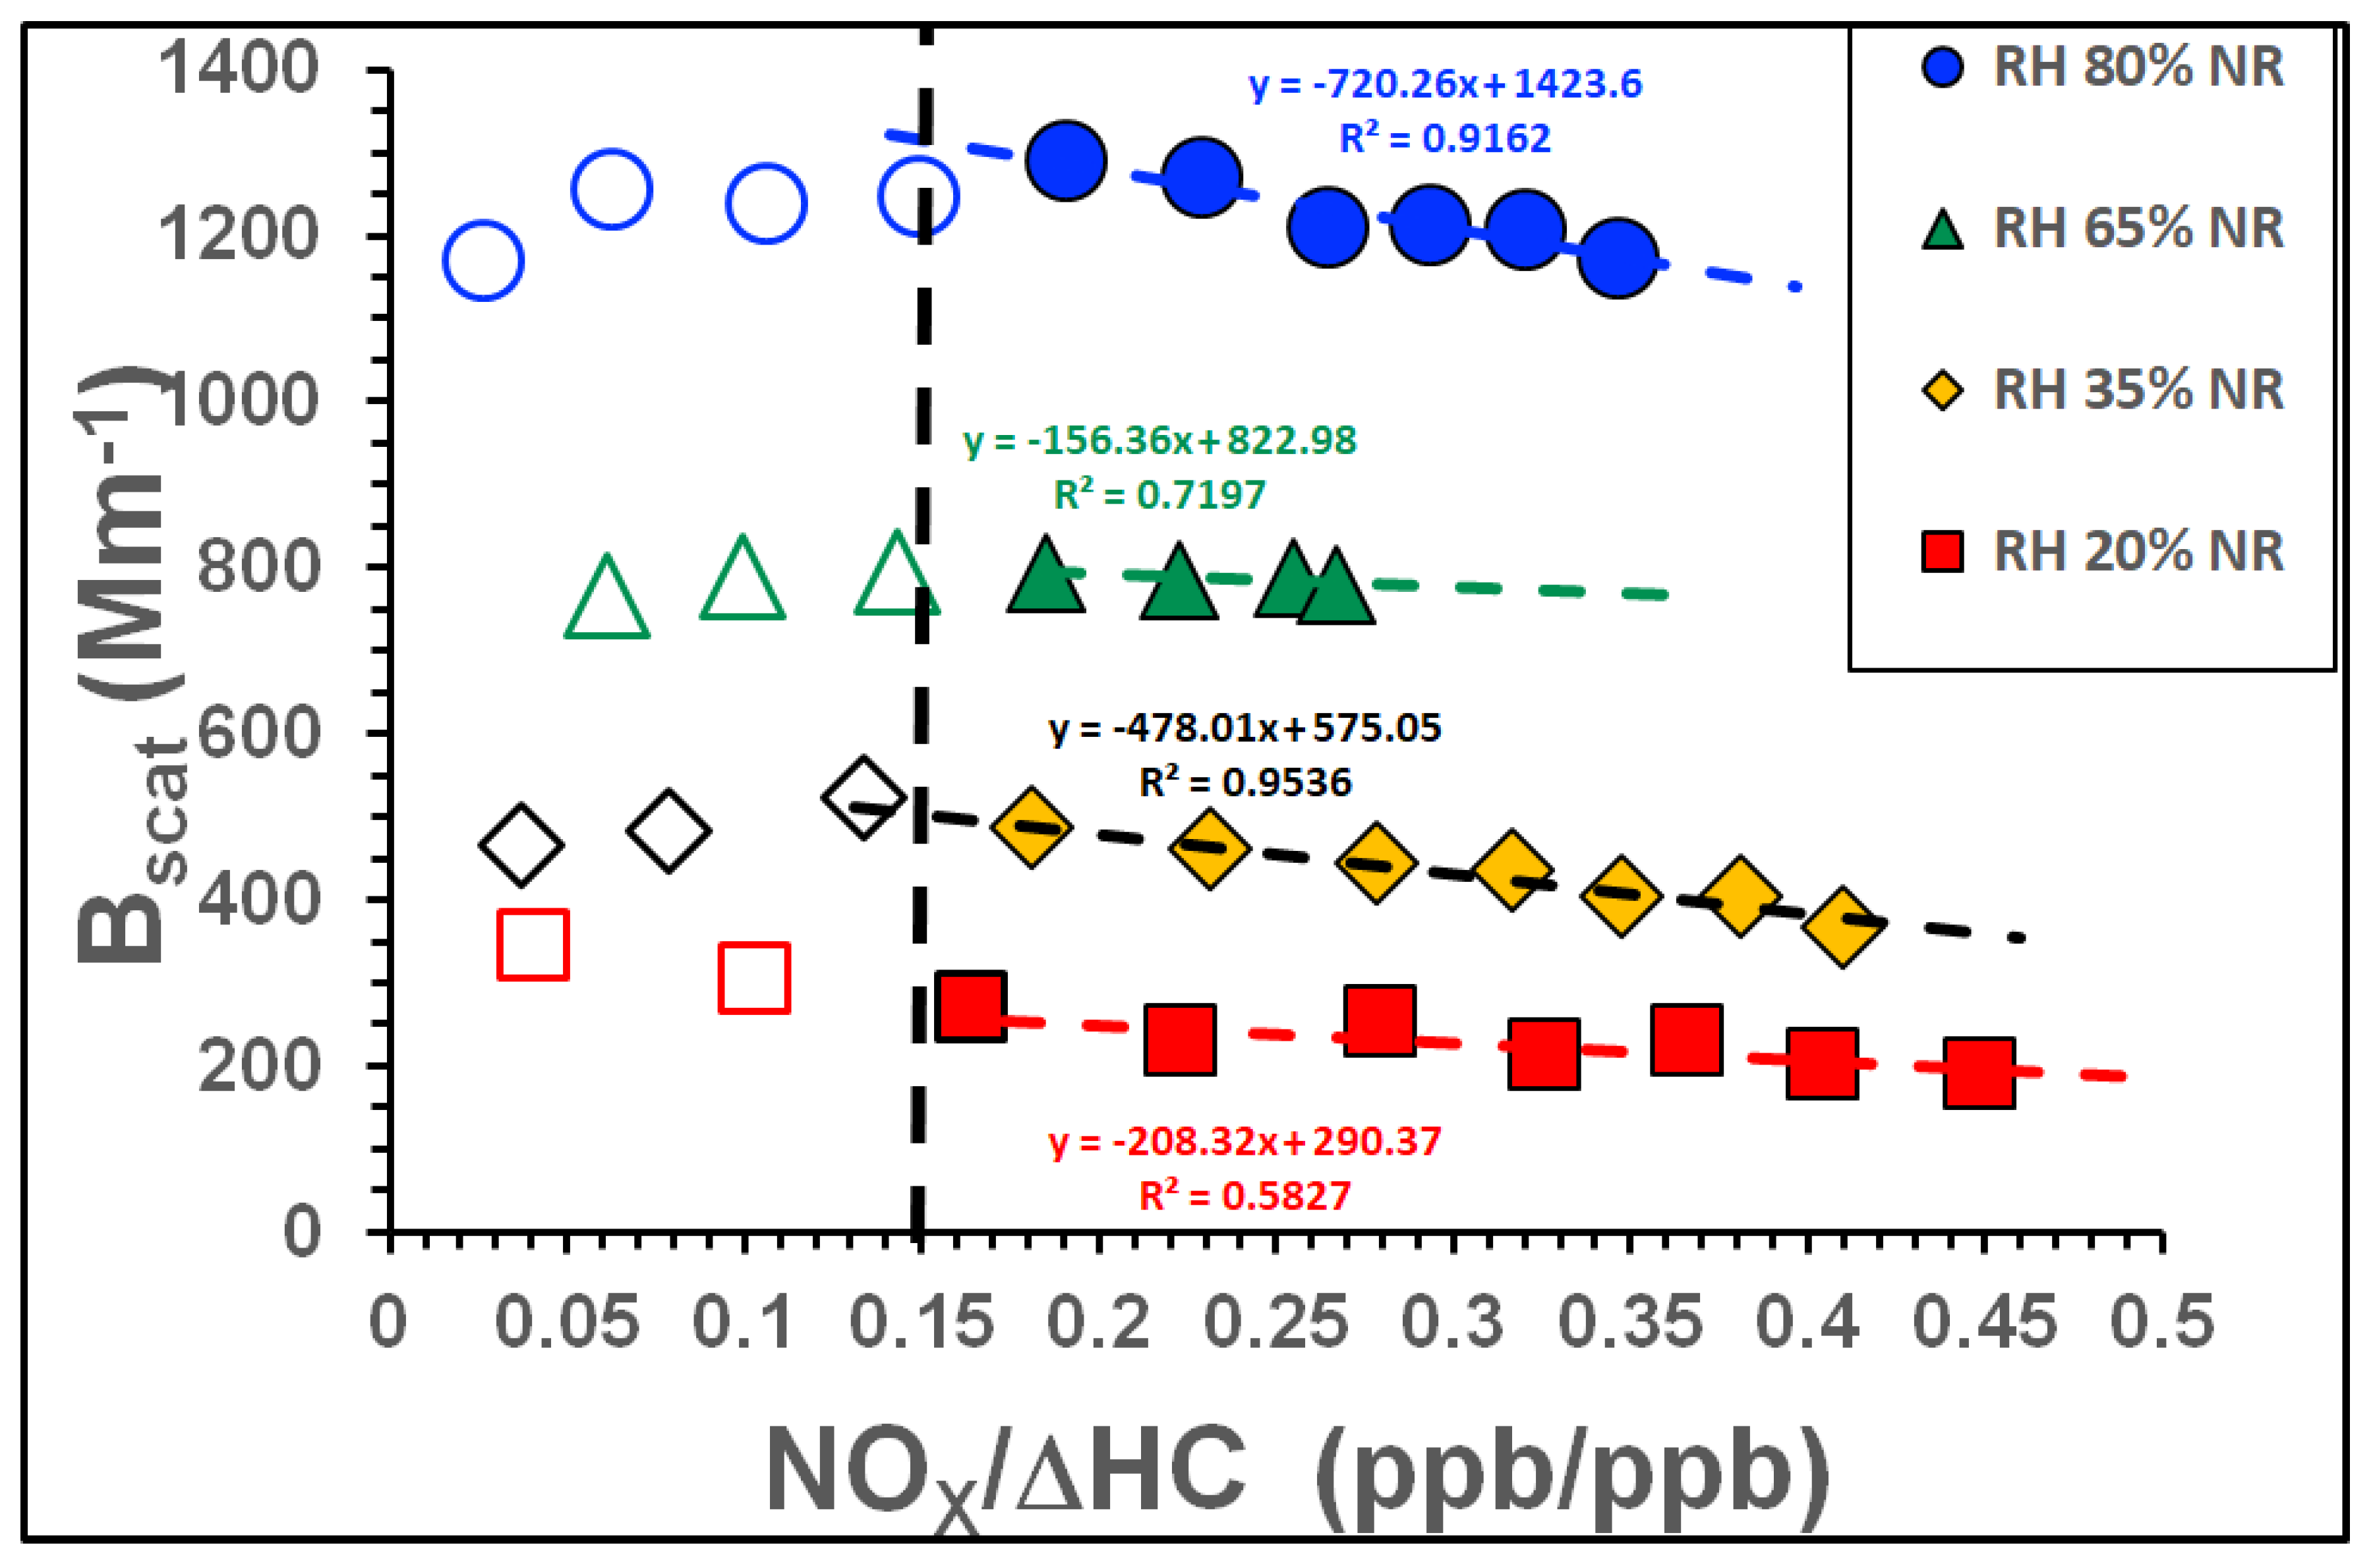
3.2.3. Influence of NOx and RH on Light Scattering

The SOA light scattering coefficient (Bscat) decreased non-linearly in response to linear increases in the NOx concentration at a constant RH. This decrease correlated non-linearly with the [NOx]/[ΔHC] ratio at RH values between 80% and 20%, as shown in Figure 6. Interestingly, the non-linearity in these curves again occurred at an [NOx]/[ΔHC] value of around 0.15. The total scattering (Bscat) of NP SOA did not vary greatly with [NOx]/[ΔHC] at constant RH. However, the Bscat for NR SOA decreased with increasing [NOx]/[ΔHC]. This decreasing trend in Bscat values mirrored that seen for the SOA mass (see Figure 1a–d) and can be attributed to the reduction in the mass (see the slopes of the parameterization of NR SOA against [NOx]/[ΔHC] in Table S2 of the Supplementary Materials) and surface area (data not shown) of the SOA at higher RH values.
In both the NP and NR regimes, Bscat increased non-linearly with RH (see Figure S4 of the Supplementary Materials), with the non-linearity becoming apparent above 65% RH; the Bscat at 80% RH was substantially higher than at lower RH values. This can be attributed to the high ALW content of the SOA at 80% RH (see Figure S5 in Supplementary Materials). As discussed previously, because the SOA hygroscopicity was similar in the NP and NR regimes, the ALW showed similar responses to increasing RH in both cases (see Figure S5).
As shown in Figure 7, the MSC (mass scattering cross-section) of the SOA varied non-linearly with increasing [NOx]/[ΔHC] and RH. In the NP regime, MSC increased slightly with increasing [NOx]/[ΔHC] for all RH values bar the lowest (20% RH), in which case the MSC decreased slightly as [NOx]/[ΔHC] increased. In the NR regime, MSC increased moderately with [NOx]/[ΔHC] at 80% and 65% RH but decreased as [NOx]/[ΔHC] increased at 20% RH and did not vary appreciably with increasing [NOx]/[ΔHC] at 35% RH. These results clearly reveal a switching point in the relationship between MSC and [NOx]/[ΔHC] at around 35% RH.
Plotting the MSC as a function of the RH (see Figure S6 of the Supplementary Materials) revealed a positive linear relationship between these two quantities in both the NP and NR regimes, so the scattering potential of the SOA was greatest at high RH. This can be attributed to the greater adsorption of water onto the SOA at higher RH values. Interestingly, however, the slope of the plot was steeper in the NR case (see Figure S6 in Supplementary Materials). As a result, the NR MSC was lower than the NP MSC when the RH was 35% or less, but the opposite was true at higher RH values. The light scattering potential of the NR SOA was thus more sensitive to the RH than that of the NP SOA. This outcome can be attributed to the ALW content of the SOA, which is higher in the NR case at high RH (>35%) and in the NP case at low RH (35% or less). In other words, the NR SOA absorbed more water and became more strongly scattering at high RH, while the reverse was true at low RH. This may indicate that the molecular composition of the SOA (i.e., its product distribution) changes significantly between 65% RH and 35% RH.
As expected, the single scattering albedo (SSA) of both NP and NR SOA was significantly affected by both NOx and water vapour. Generally, the SSA values decreased as [NOx]/[ΔHC] increased for both NP and NR SOA (see Figure S7 in Supplementary Materials) at constant RH. However, in the NR case there was a clear change in the SSA trend at an [NOx]/[ΔHC] ratio of 0.15. Like the MAC, the SSA was insensitive to RH in the NP case but not in the NR case, for which the SSA was lowest at 20% RH (see Figure S8 in the Supplementary Materials). This indicates that the relative contribution of absorption to the total light extinction by SOA was enhanced under drier conditions in the NR regime. These results suggest that water mediated toluene-NOx-OH chemistry increases the scattering potential of toluene SOA in the NR regime by substantially changing its composition, presumably by promoting the formation of more or stronger chromophores.

3.3. Influence of NH3 and NOx on SOA at High RH (Experiments: Tol-5 and Tol-6)

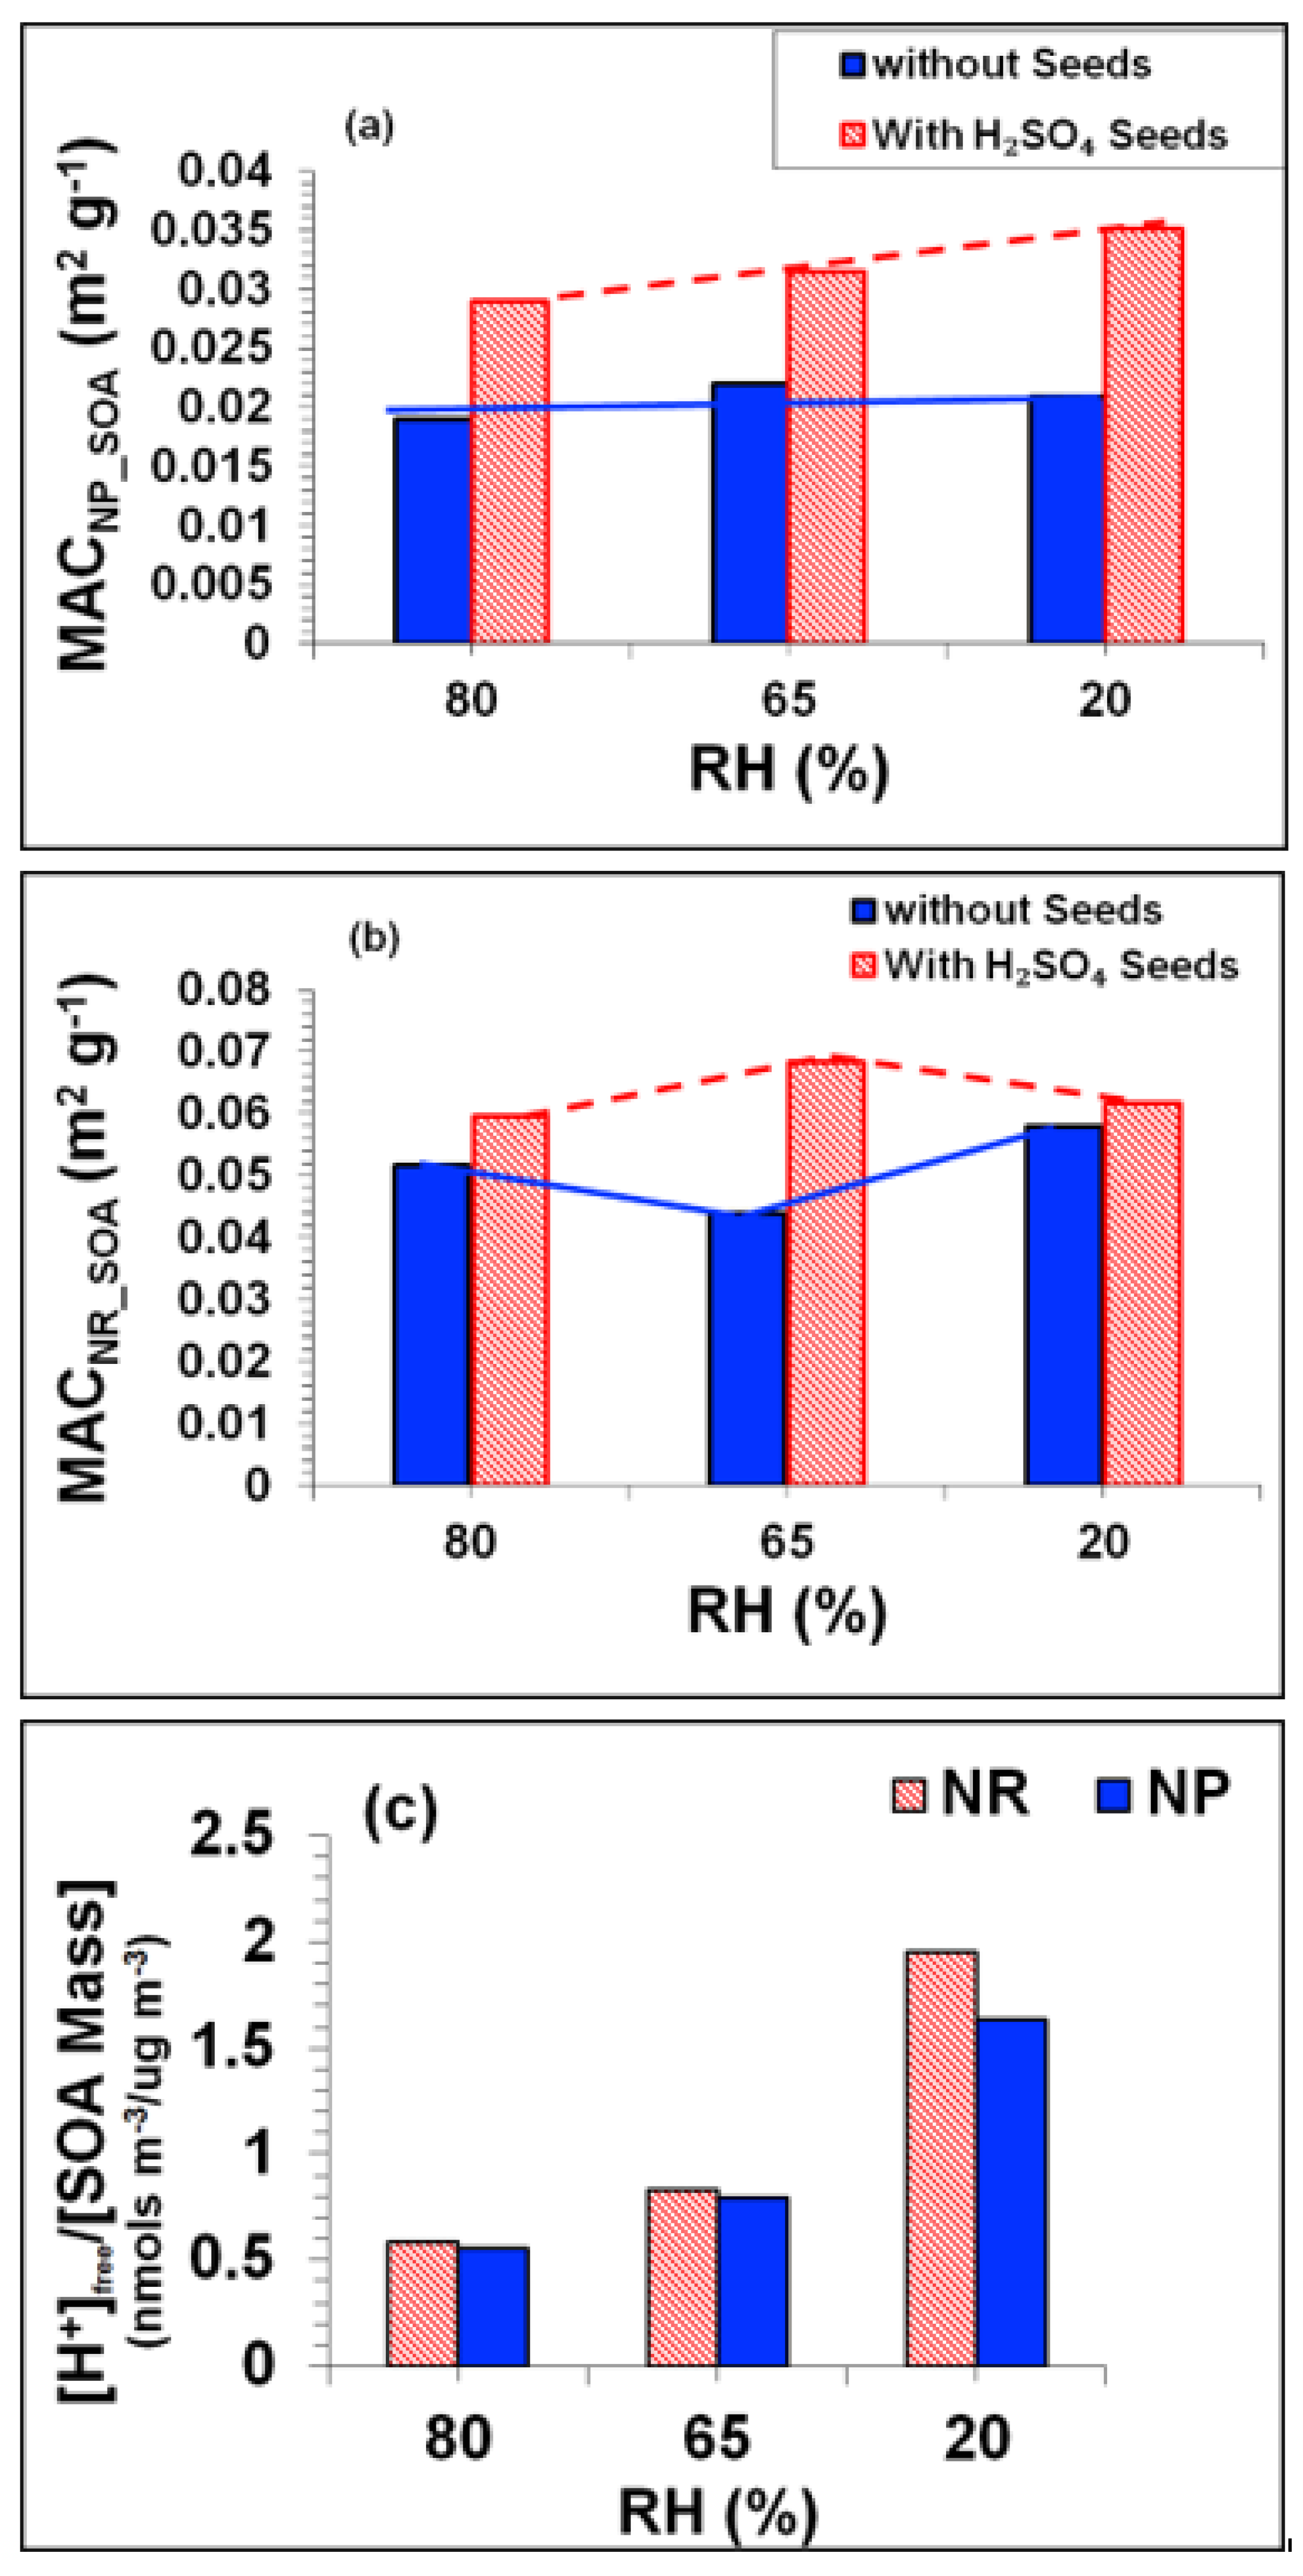
3.3.1. Influence of NH3 and NOx on SOA Mass at 80% RH

In experiments Tol-5 and Tol-6 (see Table 1 and Table 2), the RH was fixed at 80% and the NOx concentration was fixed at 61 ppb and 360 ppb, respectively, corresponding to [NOx]/[ΔHC] ratios of 0.05 (NP SOA regime) and 0.31 (NR SOA regime). The input NH3 concentration was ramped from 42 ppb, corresponding to an [NH3]/[ΔHC] ratio of 0.04, to 203 ppb, corresponding to an [NH3]/[ΔHC] ratio of 0.18 at 80% RH. The secondary brown carbon (SBrC) formation in these experiments showed unique trends that were not previously observed. First, for low NOx scenario (NP), the SOA mass against [NH3]/[ΔHC] ratio increase showed a large peak at [NH3]/[ΔHC] ~0.13 as shown in Figure 8. It is likely due to the formation of ammonium nitrate in toluene-NH3-OH system at low NOx reported by Qi X. et al. [47], where addition of NH3 enhanced the number concentration, average SOA diameter, and extinction and scattering coefficients due to the formation of significant amounts of condensable ammonium nitrate and nitrogen-containing (NOC) compounds.
On the other hand, SOA mass was relatively lower for a high NOx scenario that in a low NOx scenario and varied insignificantly (apparently constant ~435 ug m−3) when [NH3]/[ΔHC] increased as shown in Figure 8. This is consistent with the SOA mass formed in NP and NR regimes in experiments Tol-1 to Tol-4. These suggest that overall NH3 had little influence on SOA mass at high NOx scenario (e.g., NR regime).

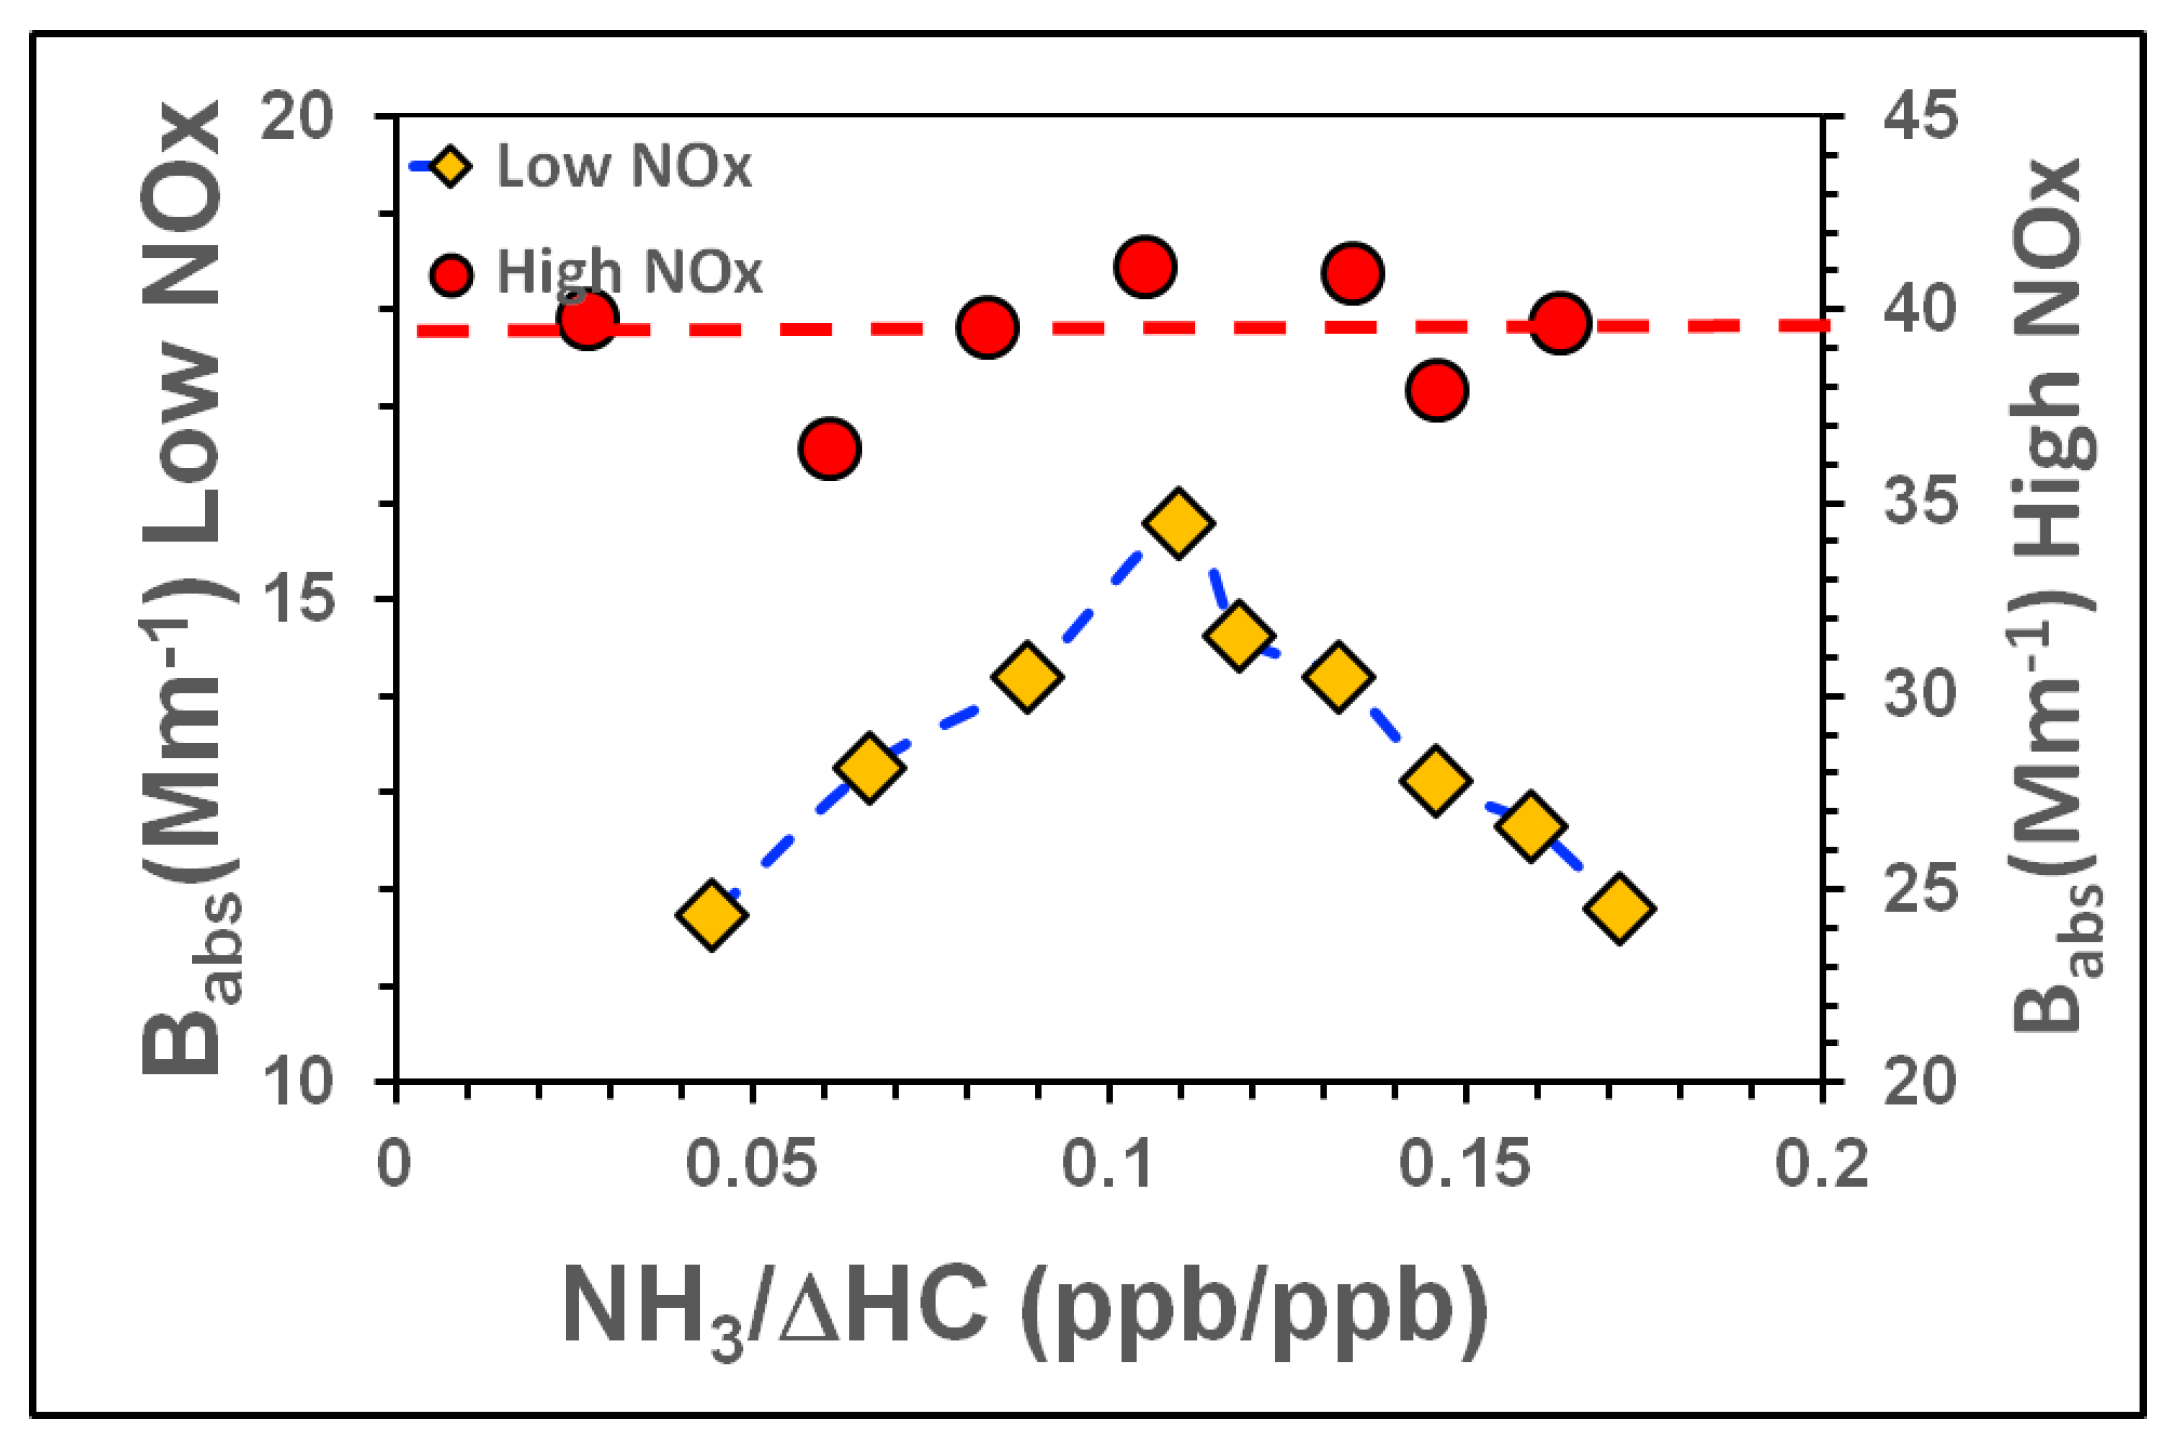
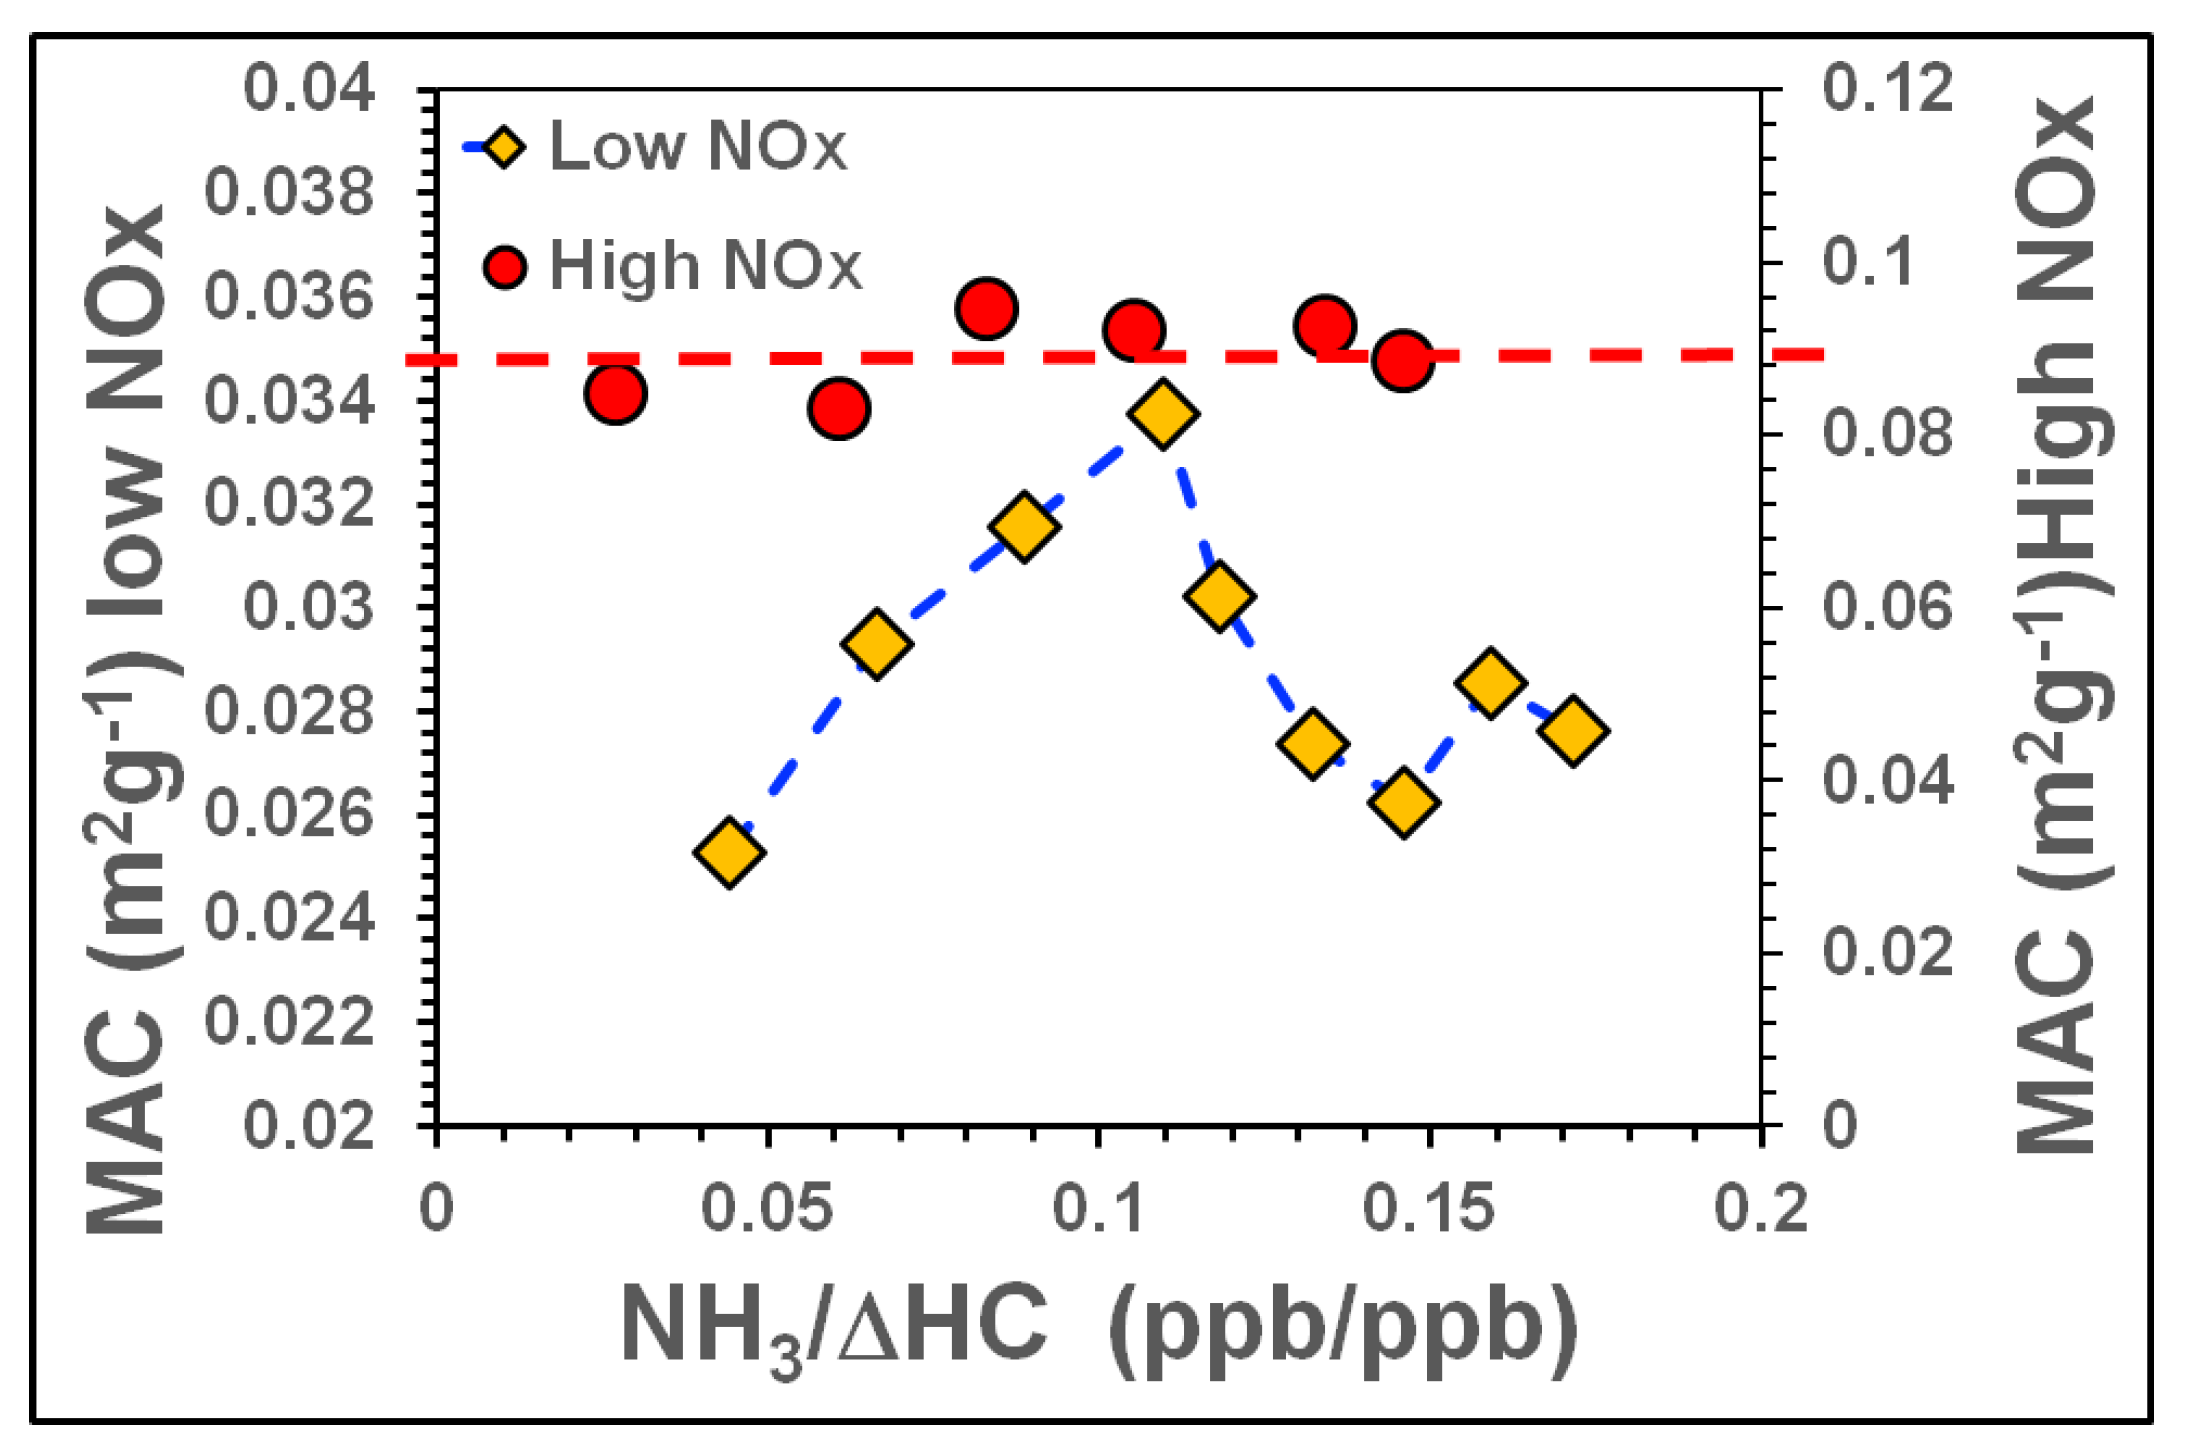
3.3.2. Influence of NH3, NOx on SOA Light Absorption at 80% RH

Two results shown in Figure 9 and Figure 10 are particularly noteworthy: (i) the Babs and MAC in the low NOx (Tol-5) also showed similar behaviour as SOA mass (see Figure 8) in response to increasing [NH3]/[ΔHC] but peaked at [NH3]/[ΔHC] ~0.11, however, (ii) the Babs and MAC in high NOx (Tol-6) were much higher than low NOx experiment (Tol-5 ) and SOA mass in the high NOx case (see Figure 8). The similar behaviors of Babs and MAC as functions of [NH3]/[ΔHC] suggest that N-H-containing organic chromophores (e.g., cyclic amines such as azo compounds) with similar light absorption profiles were formed in the low NOx regime [48,49]. In the high NOx regime, SOA formation via the NOx -water mediated chemistry appears to dominate because the Babs and MAC in this case behaved similarly to those of the NR SOA formed in experiments Tol-1 to Tol-4. That is to say, Babs and MAC were independent of [NH3]/[ΔHC] in the high NOx regime and almost constant (Babs~40 Mm−1, MAC~0.09 m2 g−1).

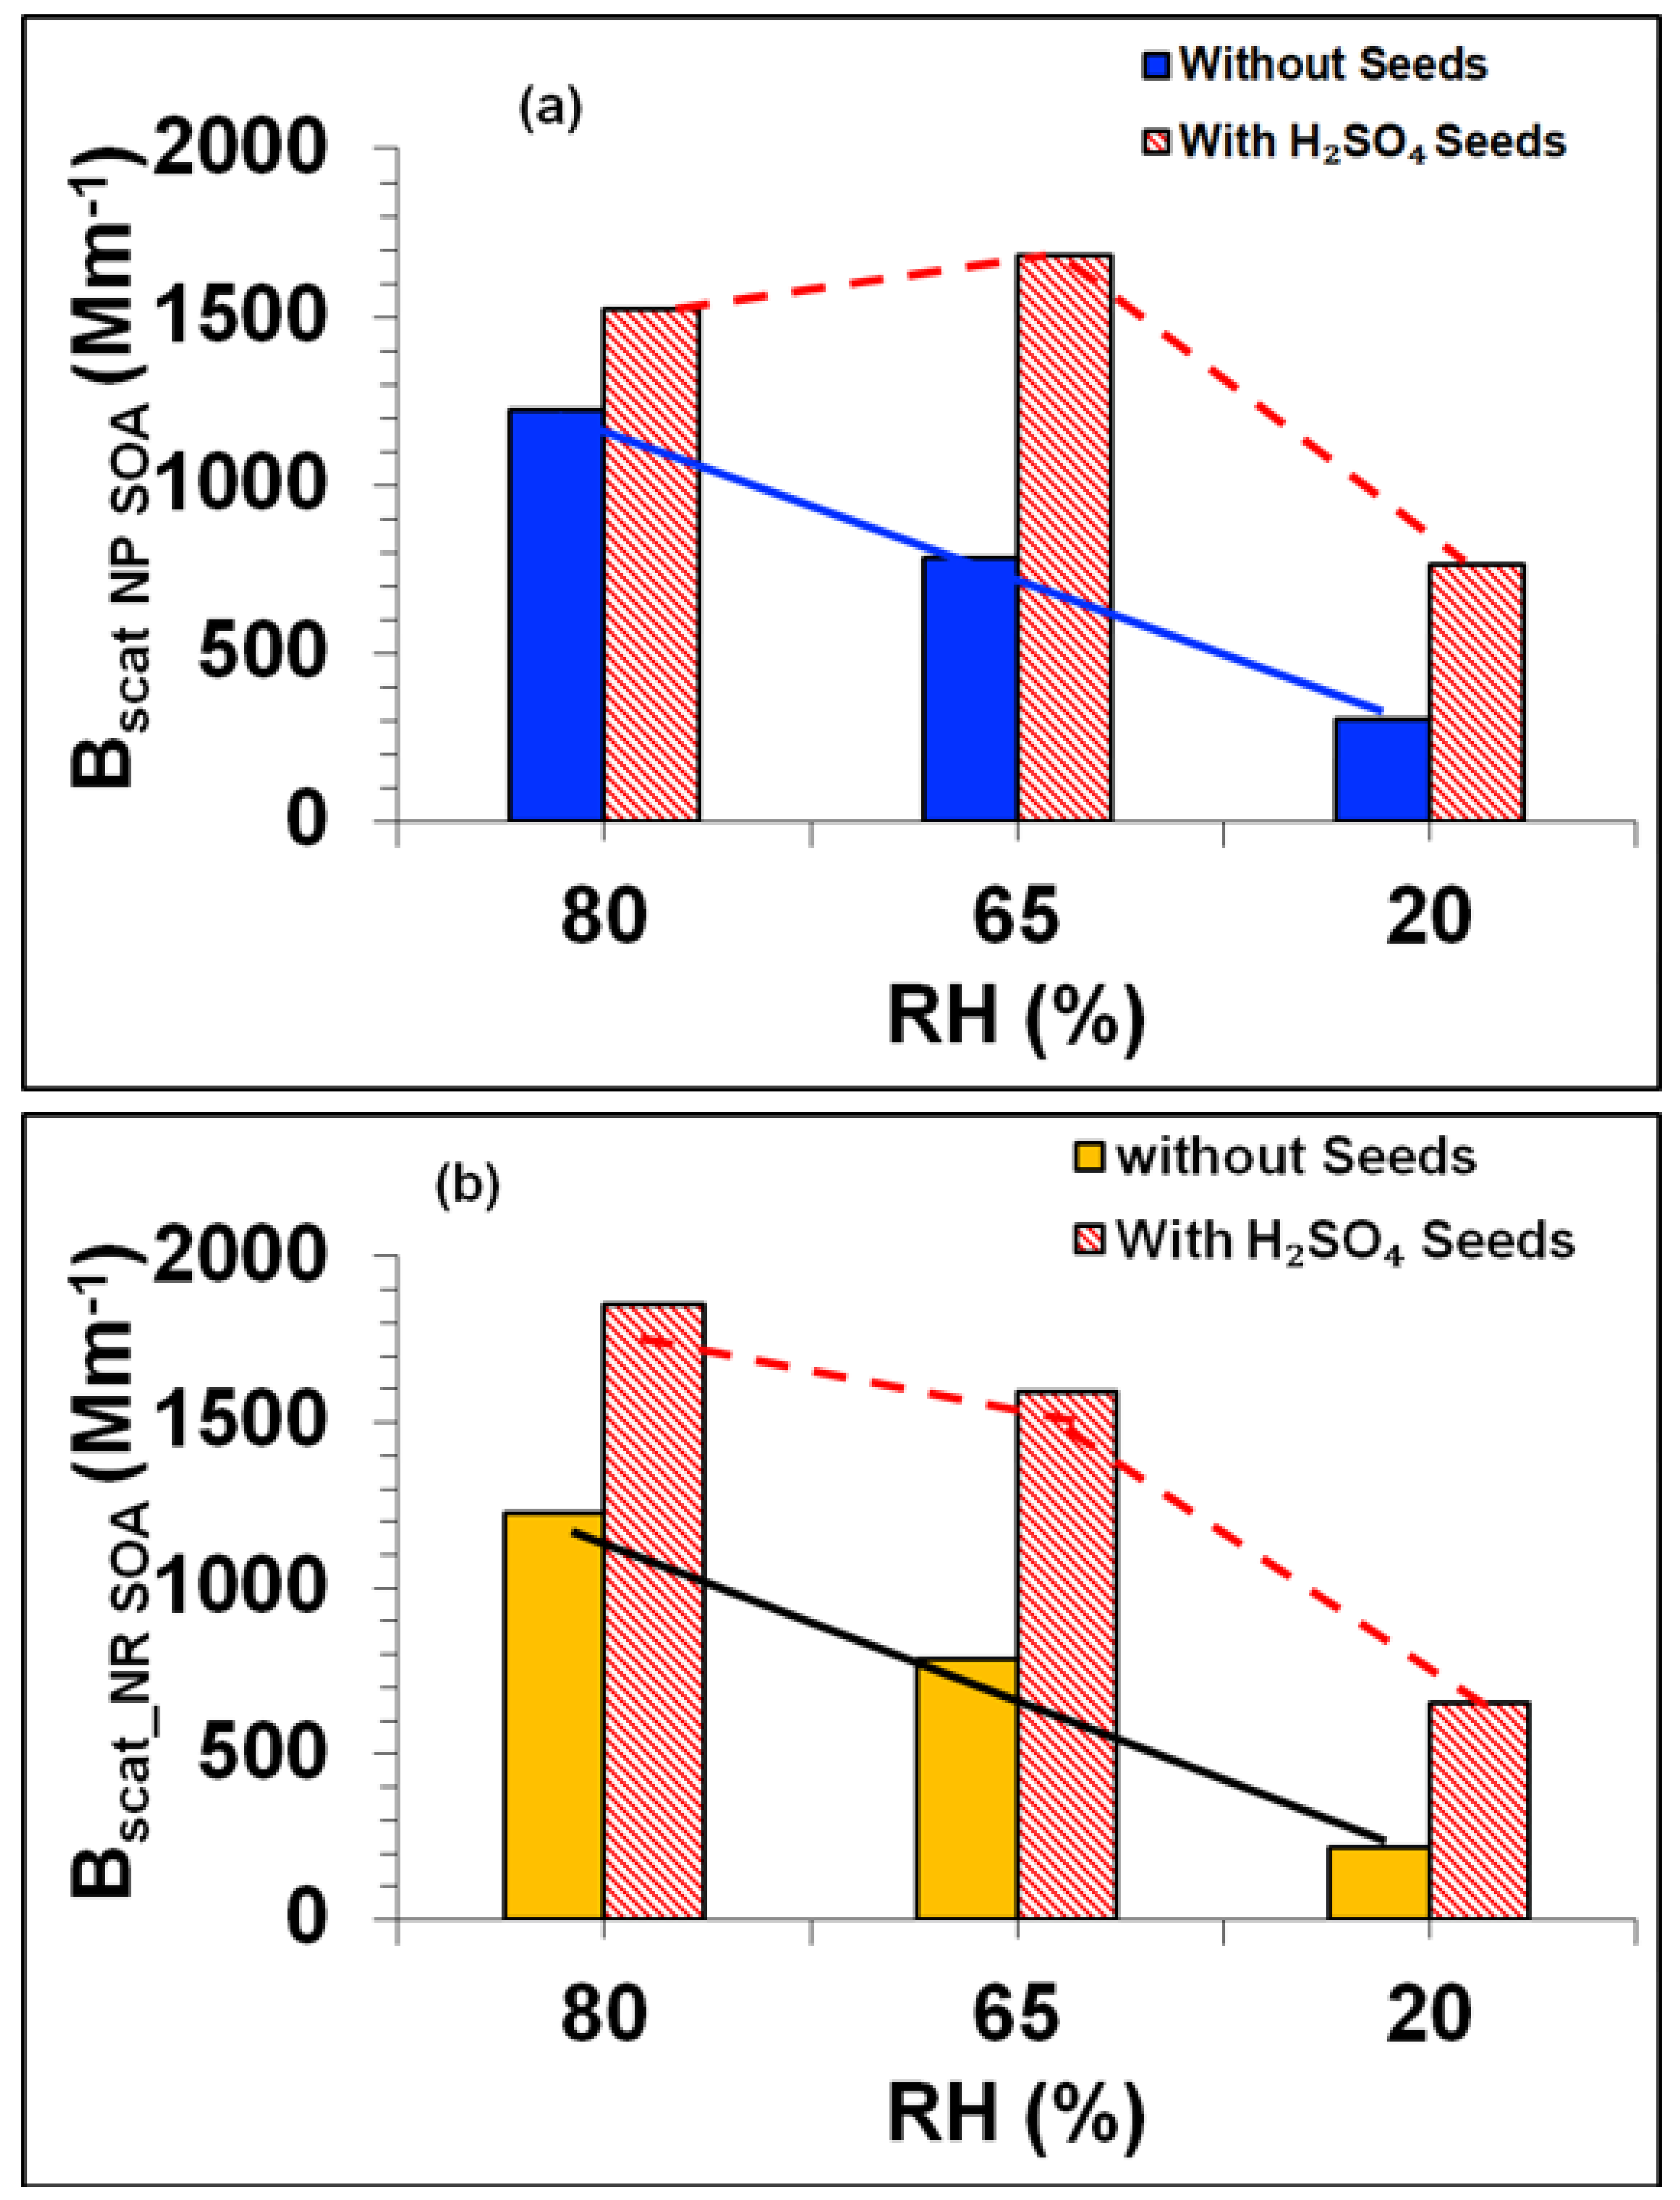
3.3.3. Influence of NH3 and NOx on SOA Light Scattering at 80% RH

Interestingly, the scattering coefficient (Bscat) and potential (MSC) were both high and did not respond to increases in [NH3]/[ΔHC] in the same way as Babs and the SOA mass under either high or low NOx regimes (see Figure S9a,b in the Supplementary Materials). Bscat and MSC initially increased with [NH3]/[ΔHC] in both high and low NOx regimes but then remained almost constant when the [NH3]/[ΔHC] ratio rose above 0.11. In other words, although the SOA mass decreased as the [NH3]/[ΔHC] ratio increased above 0.13, Bscat and MSC did not change significantly. These outcomes can potentially be attributed to the presence of highly scattering coatings of condensed ammonium nitrate on SOA in both NOx regimes. The MSC for SOA formed under the low NOx regime was significantly higher than in the high NOx regime. However, it is noteworthy that in both regimes the MSC was significantly higher than in any previous experiment that is Tol-1 to Tol-4. Bscat was also lower in the high NOx regime. This is probably because the effects of high NOx concentrations, which favour the formation of comparatively volatile organo-nitrates, outweigh those of organo-amines from NH3 reaction during SOA formation. These findings show that NH4NO3 strongly affects the formation and properties of SOA under the NP regime, and that the presence of NH3 under high NOx conditions promotes the formation of more light-absorbing SOA. Previous studies have similarly concluded that NH3 increases the O:C and N:C ratios of compounds formed by toluene-OH water-mediated chemistry and promotes the formation of SOA compounds containing carbonyl and carboxylic acid functional groups under low NOx conditions [48,49].
Figure 11 summarizes the complex influences of NH3 on the light absorption and scattering characteristics (i.e., MAC, MSC, Babs, and Bscat) of toluene SOA under the NP and NR regimes. First, NH3 clearly promotes SOA browning because both Babs and MAC increase with the NH3 concentration under both NP and NR conditions. Second, the scattering of toluene SOA was thought to be synergistically promoted by NH3 via NH4NO3 formation under the NP regime (i.e., in low NOx scenarios), which is consistent with Qi X. et al. [47]. Conversely, NH3 did not influence the scattering properties of toluene SOA under the NR regime.
Finally, the presence of NH3 led to higher Bscat and lower Babs values under low NOx conditions, with the reverse being true under high NOx conditions. These results indicate that NH3 increases the O:C content of the SOA under low NOx conditions and the N:C ratio of the SOA under high NOx conditions.

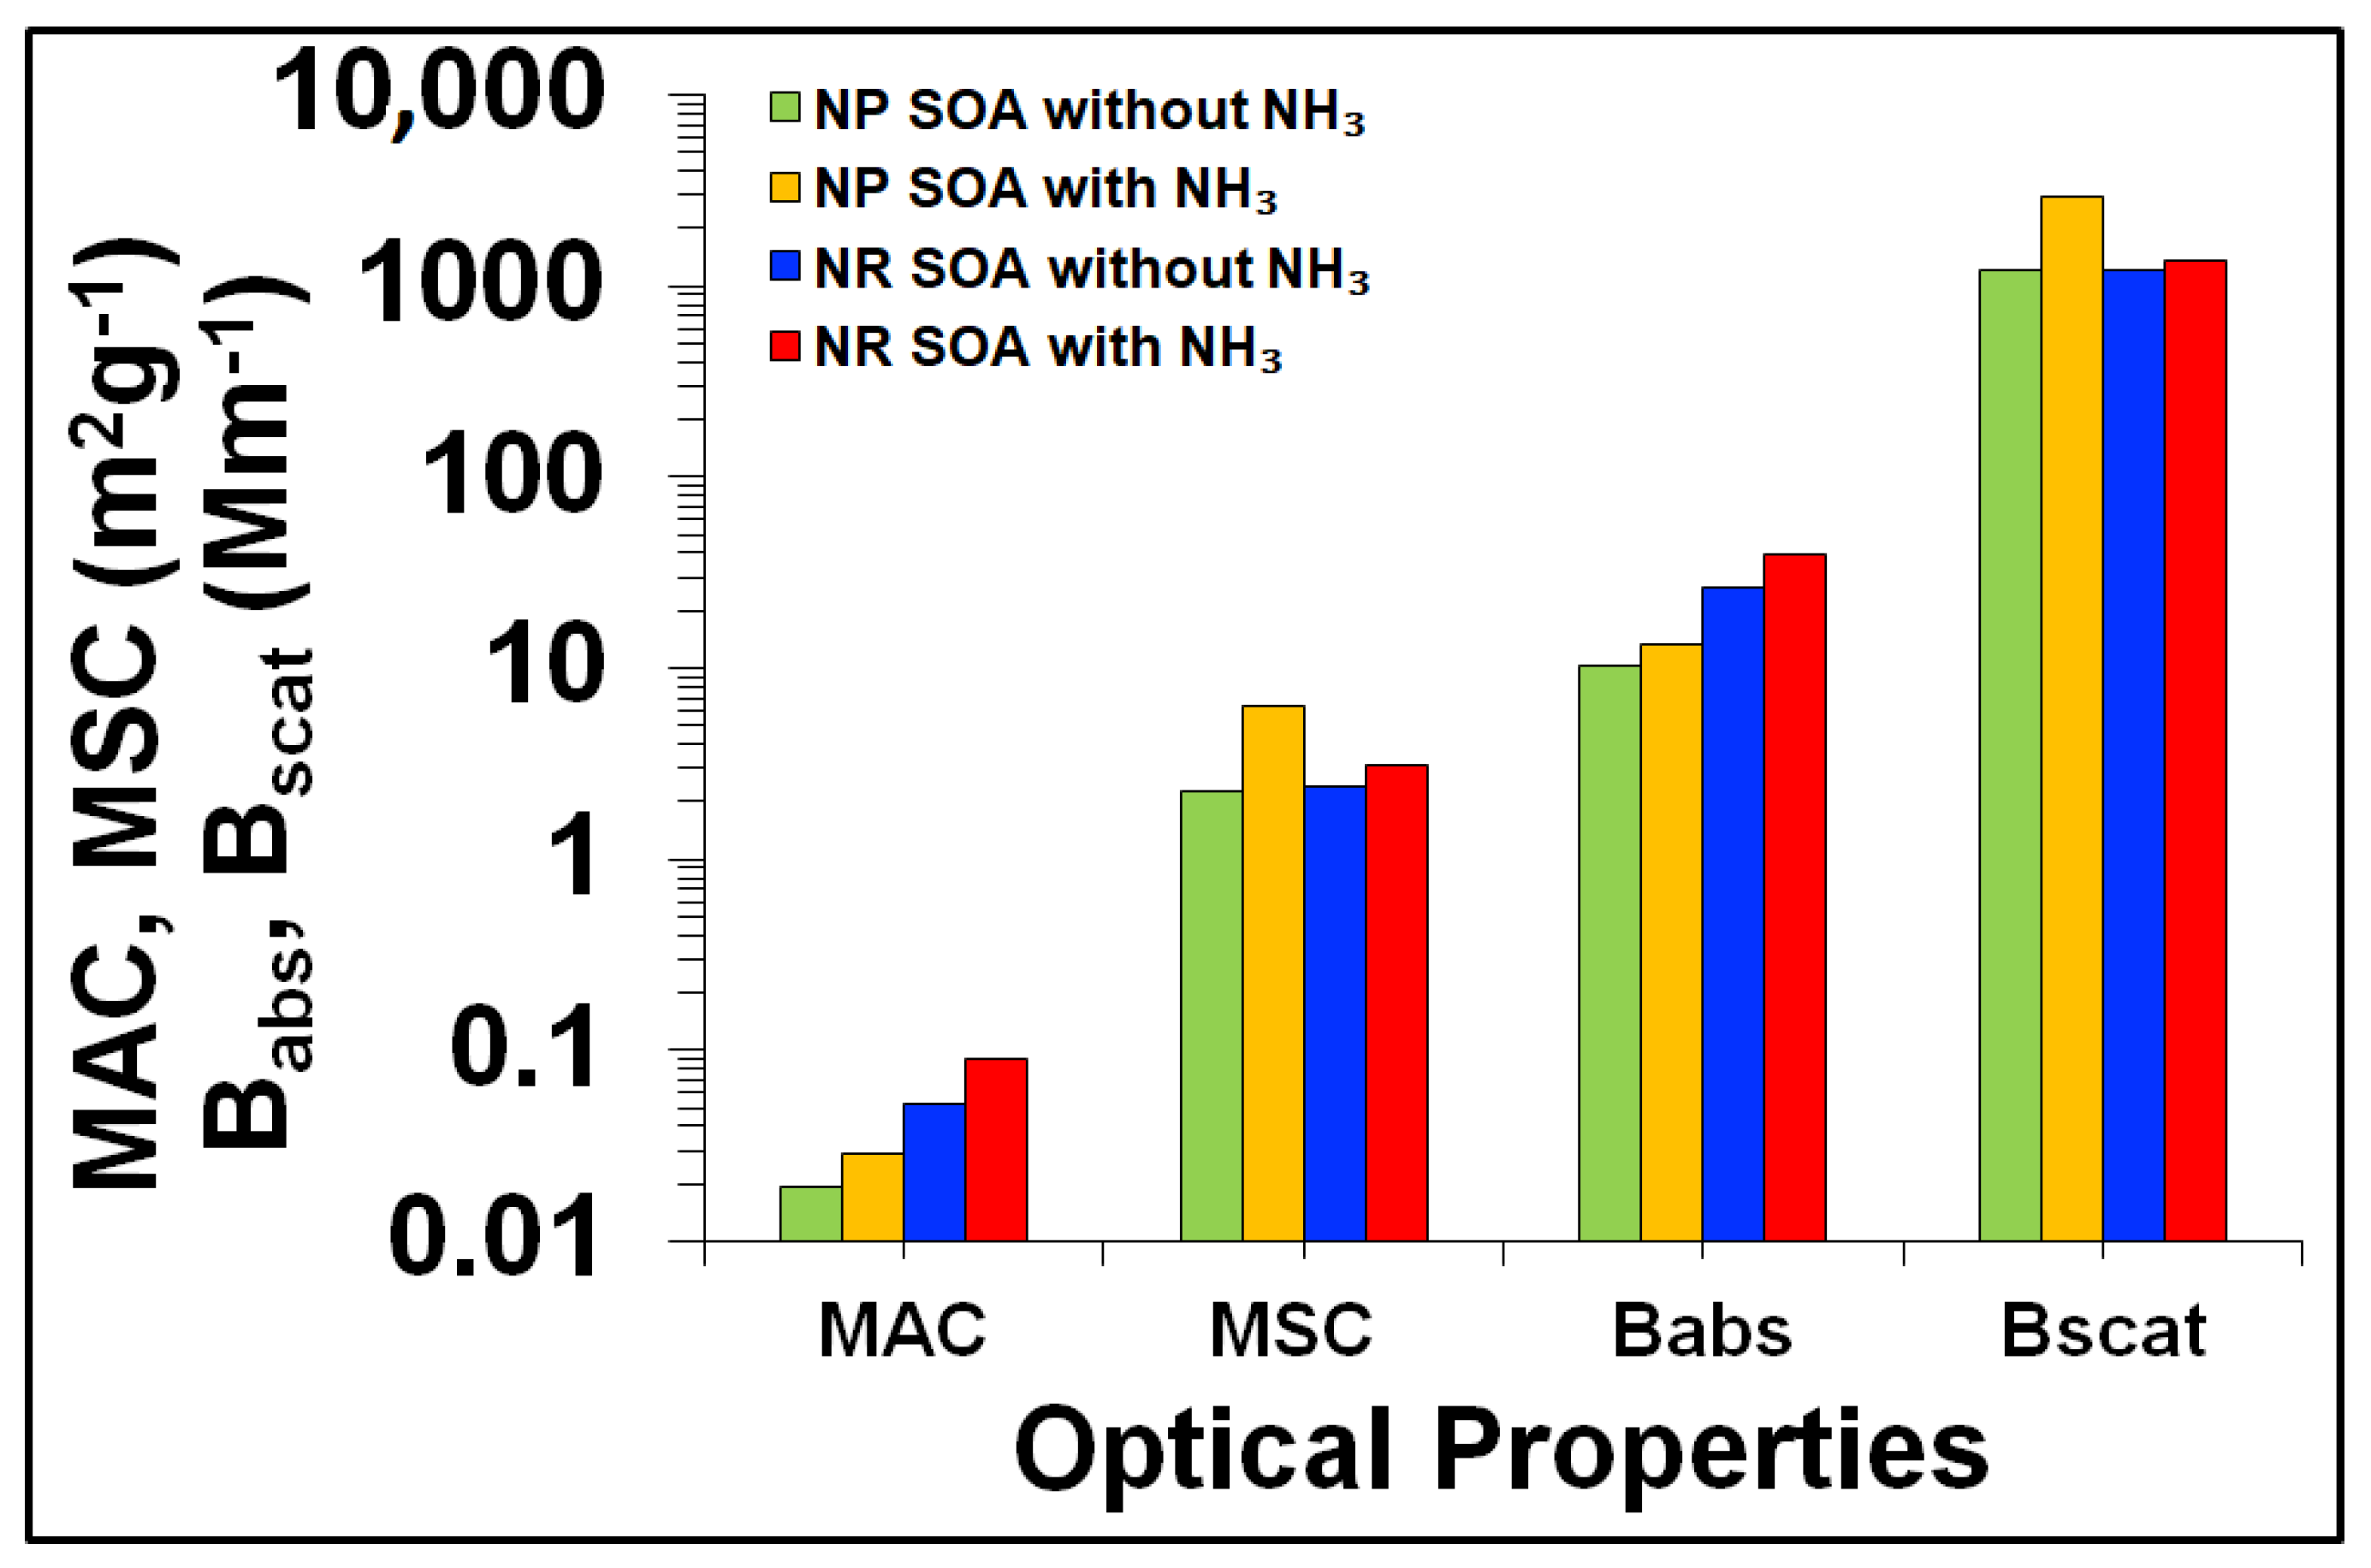
3.4. Influence of NOx Acidity and RH on SOA (Experiments: Tol-7 to Tol-9)

3.4.1. Influence of NOx Acidity and RH on SOA Mass

As shown in Figure 12a–c, SOA formation in the H2SO4-seeded experiments with NOx ramps (see Table 1 and Table 2; experiments Tol-7 to Tol-9) clearly depended on both NOx and RH. As in the case without H2SO4 seeding (experiments Tol-1 to Tol-4; see Figure 1a–d, the dependence of the SOA mass on [NOx]/[ΔHC] differed markedly between NP and NR conditions. However, the response of the SOA mass to increases in the [NOx]/[ΔHC] ratio also differed in some respects from that seen under non-seeded conditions (see Figure 1a–d). The similarities are due to the fact that SOA is formed by toluene-NOx chemistry in both cases, while the differences can be attributed to the impact of acidity-mediated heterogeneous chemistry and NOx on SOA formation [50,51,52]. In the acid-seeded experiment with 80% RH (Tol-7), the SOA mass increased with the [NOx]/[ΔHC] ratio under NP conditions but then became independent of [NOx]/[ΔHC] under NR conditions (see Figure 12a). Conversely, in the H2SO4 seeded experiments at 65% and 20% RH (Tol-8 and Tol-9), the SOA mass decreased significantly as [NOx]/[ΔHC] increased under NR conditions but did not vary greatly with [NOx]/[ΔHC] under NP conditions. Under both NP and NR conditions with acid seeding, the SOA mass at 80% RH was lower than in the corresponding non-seeded experiments whereas the opposite was true at 20% RH (see Figure S10a,b in the Supplementary Materials). At 65% RH, the SOA masses in the H2SO4-seeded and non-seeded experiments were comparable. To better understand these outcomes, the influence of ALW and pH on SOA mass formation was investigated (see Figure S10c–f and Table S3 in the Supplementary Materials). This suggested that ALW (see Figure S10c,d)) increased the availability of free acid, i.e., [H+]free (see Figure S10e) formed by H2SO4 dissociation at all RH levels (see Table S3 in Supplementary Materials). Therefore, the pH of the SOA was lowest at the lowest RH (20%) (see Figure S10f in Supplementary Materials). Moreover, whereas both ALW and the SOA mass increased with RH, the acidity of the SOA decreased (i.e., its pH increased; see Figure S10a–e in Supplementary Materials). Accordingly, the SOA mass increase due to acidity was most pronounced (30% in the NR case and 21% in the NP case) at the lowest pH at 20% RH. However, at 65% RH, the pH and SOA mass were both higher and acidity had no appreciable effect on the SOA mass, while at the highest pH (80% RH), acidity reduced the SOA mass significantly when compared to the non-seeded experiments–by 35% and 21% under NP and NR conditions, respectively. These results show that the effects of acidity on the formation and properties of SOA are complex. The observation that acid seeding and high RH (80%) caused NOx to increase SOA formation in the NR regime but not in the NP regime (in the Tol-7 experiment) is unprecedented and contrary to the observed SOA formation behaviour in the absence of H2SO4 seeding (i.e., in the Tol-1 experiment). Deng et al. [51] reported that SOA mass was increased by acidic seeding when SOA loadings were low, but that this increase was not observed at higher SOA loadings. Additionally, Cao and Jang [52] reported that the mass of toluene SOA formed under low and intermediate NOx conditions (which both fall within the NP regime as defined in this work) with acidic sulphate seeding was considerably higher (by ~15–21%) at low RH when compared to the case with neutral seeding, but was reduced at high RH (by ~38–48%). No significant particle acidity effect was observed in the high NOx experiments in their study [52]. These results provide important new insights into the effects of NOx, RH, and acidity on SOA formation and will thus facilitate better modelling of toluene SOA formation.

3.4.2. Influence of NOx Acidity and RH on SOA Light Absorption

We also investigated the influence of SOA mass, acidity, NOx, and RH on the optical properties of toluene SOA. Figure 13a–f shows the Babs and MAC of toluene SOA as functions of the [NOx]/[ΔHC] ratio at three different RH values in the H2SO4 seeded experiments (Tol-7, Tol-8, and Tol-9). As in the non-seeded experiments, Babs increased with [NOx]/[ΔHC] in the H2SO4 seeded experiments. However, the slope was slightly steeper in the seeded case and the absolute values of Babs were approximately 2 Mm−1 higher at all RH values below 80% (See Figure 13a–c).
At 80% RH, the Babs trends in the non-seeded (Tol-1) and H2SO4 seeded (Tol-7) experiments were almost identical, indicating that acidity had no obvious effect on Babs under either the NP or the NR regime in this case. However, because SOA mass formation was reduced under acidic conditions at 80% RH (see Figure 12a) and the MAC is the quotient of [Babs] and the SOA mass, the MAC was higher in the seeded case than in the non-seeded case (see Figure 13d). The MAC of acid-seeded SOA in the 65% and 20% RH cases (experiments Tol-8 and Tol-9, respectively) was also higher than in the corresponding non-seeded cases, as shown in Figure 13e,f. This indicates that acidity plays an important role in SOA browning. The effect of RH on the light absorbing properties of toluene SOA formed with acid seeding is clearly shown in Figure 14a–c: under NP conditions, the MAC at all three RH values was almost identical to that in the corresponding non-seeded experiments, but the MAC in the H2SO4-seeded experiments was generally higher than that in the corresponding non-seeded experiments and increased as the RH decreased. The high MAC of acidic SOA at lower RH values is tentatively linked to the formation of organo-sulphate chromophores, which is suggested to be governed by two major parameters: (i) the pH of the SOA aqueous phase, and (ii) the ratio of [H+]free (the concentration of free protons in the aqueous phase) to the SOA mass. Under NP conditions, the highest acidity (i.e., the lowest pH) and the highest [H+]free / SOA mass ratio were both observed with seeding, as shown in Figure 13e and Figure 14c, supporting our hypothesis. In addition, a modelling study conducted by McNeill et al. [53] suggested that organo-sulphate formation was maximized at low pH and low RH (<60%), i.e., when the aerosol was more concentrated. Conversely, under NR conditions the MAC of non-seeded SOA reached a minimum at an intermediate RH (65%), whereas the MAC of the H2SO4 seeded SOA peaked at the same RH (65%) and was lowest at 80% RH (see Figure 14b). These contrasting trends for seeded and non-seeded SOA under NR conditions are interesting and suggest that NOx has a strong influence on light absorption at the intermediate RH (65%). These observations indicate that the browning of toluene SOA is driven by complex interactions between the effects of acidity, NOx, and water vapor.

3.4.3. Influence of NOx Acidity and RH on SOA Light Scattering

The light scattering characteristics of toluene SOA were also significantly influenced by H2SO4 seeding under various NOx and RH conditions. The increase in Bscat with [NOx]/[ΔHC] mirrored that of the SOA mass in all three H2SO4 seeded experiments (e.g., Tol-7, Tol-8 and Tol-9) (see Figure S11 in the Supplementary Materials). Upon comparing the seeded experiments to their non-seeded counterparts (Tol-1, Tol-2 and Tol-4, respectively), it can be seen that the response of Bscat to increasing [NOx]/[ΔHC] differs and that acid seeding increased the absolute value of Bscat by factors of 1.25-2.5 in the NP regime and 1.5 to 3 in the NR regime (see Figure 15a,b). These increases in Bscat can be attributed to the presence of sulfuric acid seeds, which are likely to have increased the surface area and scattering potential of the formed SOA. The relative enhancement of Bscat in the H2SO4-seeded SOA was highest (2.5- to 3-fold) at the lowest RH (20%) indicating that the contribution of H2SO4 seeds to the aerosol mass fraction was highest at 20% RH. The response of the MSC to increases in [NOx]/[ΔHC] was similar in both the H2SO4 seeded and non-seeded experiments (see Figure S12a,b in the Supplementary Materials). However, like the Bscat values, the absolute MSC values were significantly higher in the H2SO4 seeded experiments than in their non-seeded counterparts, under both NP and NR conditions (see Figure S12 in the Supplementary Materials). A rationale for the higher MSC in the seeded case is that H2SO4 also acts as a strongly scattering substance and increases the surface area of the resulting SOA. The highest MSC values were observed at the intermediate RH (65%) in both the NP and NR SOA regimes (see Figure S12a,b). However, the effects of acidity and RH on the chemical composition of the SOA and the resulting changes in its light scattering properties remain unclear. It seems most likely that the higher values of Bscat and MSC observed for seeded SOA under both NP and NR conditions can be mainly attributed to the enhancement of surface growth of SOA particles caused by H2SO4 seeds.

4. Conclusions

We observed that the pattern of SOA mass formation at [NOx]/[ΔHC] molar ratios below 0.15 differed markedly from that seen at higher [NOx]/[ΔHC] ratios. We therefore distinguish between nitrogen-poor (NP) SOA formed under conditions with low initial NOx concentrations and nitrogen-rich (NR) SOA, which has a higher content of compounds such as organo-nitrates. We suggest that this distinction is valuable for understanding trends in the formation and properties of SOA formation in the presence of varying concentrations of NOx. The SOA mass generally decreased as the [NOx]/[ΔHC] ratio increased, especially under the NR regime of our proposed framework. In addition, NOx promoted SOA browning under both regimes.
Under the NP regime, MAC increased with [NOx]/[ΔHC] independently of the RH. However, for NR SOA, the MAC depended significantly on both [NOx]/[ΔHC] and the RH. The RH also had a complex effect on SOA browning (measured in terms of the MAC) under NR conditions but did not promote browning under NP conditions. The mass scattering cross-section (MSC, defined as [Bscat]/[SOA Mass]) of NR SOA also depended on the RH (and by extension, on OH exposure): it increased with [NOx]/[ΔHC] at RH values above 65%but decreased as [NOx]/[ΔHC] increased at RH values below 35%.
Both Babs and MAC increased with the [NH3]/[ΔHC] ratio, suggesting that NH3 promotes the formation of N-H-containing organic chromophores such as cyclic amines and azo compounds with similar peak Babs values under low NOx conditions. In addition, the formation of ammonium nitrate was observed in toluene-NH3-OH systems at low NOx concentrations. NH3 had no strong effect on SOA mass formation under high NOx conditions but when the NOx concentration was low, NH3 significantly increased both the mass of SOA that formed and its light absorbing and scattering capacity. In addition, under high NOx conditions, the presence of NH3 increased the MAC and MSC when compared to the case without NH3.
Acidity strongly promoted SOA mass formation. The SOA mass enhancement due to acidity was highest (30% and 21% in the NR and NP SOA, respectively) at the lowest RH (20%); under higher pH conditions with 65% RH, acidity had no appreciable effect on SOA mass formation. Moreover, at 80%, when the pH was highest, H2SO4 seeding reduced SOA mass formation by 35% and 21% in the NP and NR regimes, respectively. These results show that acidity has complex effects on SOA mass formation that depend on both the NOx concentration and the RH.
The MAC was significantly enhanced in both NP and NR regimes in the H2SO4 seeded SOA, indicating that acidity plays an important role in SOA browning. In addition, the MACs of the H2SO4-seeded SOA were higher at intermediate and low RH than at high RH (80%). This finding was rationalized by suggesting that the MAC enhancement of acidic SOA is linked to the formation of organosulphate chromophores and governed by two major parameters: the pH of the SOA aqueous phase and the ratio of the free hydrogen ion concentration in the aqueous phase ([H+]free) to the SOA mass.
Acid seeding also increased the Bscat of the SOA, which can be attributed to increases in the surface area and scattering potential of the SOA caused by the sulfuric acid seeds. There was no clear evidence that acid seeding or variation in the RH changed the chemical composition of the SOA in ways that greatly affected Bscat, however; instead, the changes in Bscat and MSC in seeded SOA under NP and NR conditions are primarily attributed to increased surface growth driven by H2SO4 seeds.
Incorporating these findings into climate and air quality models will reduce uncertainties in the treatment of SOA and a deeper understanding of its role in climate change.

Supplementary Materials

The following supporting information can be downloaded at https://www.mdpi.com/article/10.3390/atmos13071099/s1. Table S1: The estimated total OH concentration exposure (OH exp) and equivalent atmospheric aging (Hrs and Days) of SOA in GO:PAM. Table S2: NR Regime (NOx/ΔHC > 0.15) SOA properties and parameterization. Table S3: E-AIM model results and pH for 22.3 μg m−3 dried H2SO4 injected in each experiment. Figure S1: Process flow diagram of the experimental setup. Figure S2: SOA mass as a function of RH in the NP and NR SOA formation regimes. Figure S3: Mass enhancement factor (MEF) as a function of relative humidity for toluene-OH photo-oxidation SOA. A fit to data reported by Liu et al. [33] is plotted alongside a fit to data originating from this work for toluene SOAs formed at different RH values and NOx concentrations. The MEF in this study was estimated based on the SOA mass at 20% RH with the assumption that the hygroscopic growth factor for SOA at 20% RH relative to that at around 0% RH is approximately 1.03, as reported by Liu et al. [33]. Figure S4: Bscat as a function of RH in the NP and NR SOA formation regimes. NP and NR results are plotted using empty blue and filled red circles, respectively. Figure S5: Aerosol liquid water (ALW) content as a function of RH in the NP and NR regimes of SOA formation. NP and NR results are plotted using empty blue and filled red circles, respectively. Figure S6: MSC as a function of RH in the NP and NR SOA formation regimes. NP and NR results are plotted using empty blue and filled red circles, respectively. Best fits for NP and NR are shown using solid blue and dotted red lines, respectively. Figure S7: Single Scattering Albedo (SSA) as a function of the NOx to reacted toluene ratio ([NOx]/[ΔHC]) at 80% RH, 65% RH, 35% RH, and 20% RH. Empty and filled symbols show results for nitrogen poor (NP) and nitrogen rich (NR) SOA, respectively. The blue solid line is the trend line for NP SOA. Figure S8: SSA as a function of RH in the NP and NR SOA formation regimes. NP and NR results are plotted using empty blue and filled red circles, respectively. Best fit lines for NP and NR are solid blue and dotted red, respectively. Figure S9: (a,b): Effect of NH3 on the light scattering properties of SOA at 80% RH under low and high NOx conditions. (a) Bscat as a function of the ([NH3]/[ΔHC]) ratio; (b) MSC as a function of the ([NH3]/[ΔHC]) ratio. Figure S10: (a–f): Effects of acidity and RH on SOA mass, ALW, and pH for NP and NR SOA: (a) NP SOA mass as a function of RH in the H2SO4 seeded and non-seeded experiments; (b) NR SOA mass as a function of RH in the H2SO4 seeded and non-seeded experiments; (c) NP and NR SOA mass as functions of the RH in the H2SO4 seeded experiments; (d) ALW in NP SOA as a function of RH in the H2SO4 seeded and non-seeded experiments; (e) ALW in NR SOA as a function of RH in the H2SO4 seeded and non-seeded experiments; (f) pH of the NP and NR SOA as functions of the RH in the H2SO4 seeded experiments. Non-seeded experiments are Tol-1, Tol-2 and Tol-4, while H2SO4 seeded experiments are Tol-7, Tol-8 and Tol-9. Figure S11: (a–f): Effects of acidity, NOx, and RH on the Bscat and MSC of toluene SOA. (i) Bscat as a function of [NOx]/[ΔHC] for the H2SO4 seeded and non-seeded experiments at (a) 80%, (b) 65%, and (c) 20% RH. (ii) MSC as a function of [NOx]/[ΔHC] for the H2SO4 seeded and non-seeded experiments at (d) 80%, (e) 65%, and (f) 20% RH. Solid lines in (a), (b), and (c) are eye guides showing trends in Bscat for NP and NR SOA in the non-seeded case, while the dotted lines show trends for NP and NR SOA in the H2SO4-seeded SOA experiments. In (d–f) the solid lines are eye guides for the NP and NR SOA cases in the H2SO4 seeded experiments while the dotted lines are eye guides for NP and NR SOA in the non-seeded experiments. Figure S12: (a,b): Effects of water vapor and acidity on the MSC of toluene SOA. (a) MSC of NP SOA for the H2SO4 seeded and non-seeded experiments at three RHs; (b) MSC of NR SOA for the H2SO4 seeded and non-seeded experiments at the three RHs. Figure S13: An example time series of experimental results.

Author Contributions

Conceptualization, R.K.P.; methodology, R.K.P., K.M., X.P. and H.R.M.; software, K.M. and R.K.P.; validation, K.M., H.R.M. and R.K.P.; formal analysis, K.M., H.R.M. and R.K.P.; investigation, K.M., X.P. and R.K.P.; resources, R.K.P. and K.M.; data curation, K.M., H.R.M. and R.K.P.; writing—original draft preparation, K.M. and R.K.P.; writing—review and editing, K.M., H.R.M., X.P. and R.K.P.; visualization, K.M. and R.K.P.; supervision, R.K.P.; project administration, R.K.P. and K.M.; funding acquisition, R.K.P. All authors have read and agreed to the published version of the manuscript.

Funding

This research was funded by Vetenskapsrådet (Swedish Research Council, VR) under grant 2015-04123 and The RKP was funded by Vetenskapsrådet, Sweden.

Institutional Review Board Statement

Not applicable.

Informed Consent Statement

Not applicable.

Data Availability Statement

The data reported in this study are available within the manuscript and in Supplementary Materials. We will also publish at least one follow-up companion article with m/z values in this journal, along with that we will put all associated raw data to our university’s open access server.

Acknowledgments

We acknowledge support from Mattias Hallquist for providing the CIMS machine and Christian Mark Salvador for operating the CIMS machine.

Conflicts of Interest

The authors declare no conflict of interest. The funders had no role in the design of the study; in the collection, analyses, or interpretation of data; in the writing of the manuscript; or in the decision to publish the results.

References

  1. Arias, P.A.; Bellouin, N.; Coppola, E.; Jones, R.G.; Krinner, G.; Marotzke, J.; Naik, V.; Palmer, M.D.; Plattner, G.; Rogelj, J.; et al. IPCC, 2021: Technical Summary. In Climate Change 2021: The Physical Science Basis. Contribution of Working Group 15 I to the Sixth Assessment Report of the Intergovernmental Panel on Climate Change; Masson-Delmotte, V., Zhai, P., Pirani, A., Connors, S.L., Péan, C., Berger, S., Caud, N., Chen, Y., Goldfarb, L., Gomis, M.I., et al., Eds.; IPCC AR6 WGI; Cambridge University Press: Cambridge, UK, 2021; pp. 1–3949, in press. [Google Scholar]
  2. Kanakidou, M.; Seinfeld, J.H.; Pandis, S.N.; Barnes, I.; Dentener, F.J.; Facchini, M.C.; Van Dingenen, R.; Ervens, B.; Nenes, A.; Nielsen, C.J.; et al. Organic aerosol and global climate modelling: A review. Atmos. Chem. Phys. 2005, 5, 1053–1123. [Google Scholar] [CrossRef] [Green Version]
  3. Hallquist, M.; Wenger, J.C.; Baltensperger, U.; Rudich, Y.; Simpson, D.; Claeys, M.; Dommen, J.; Donahue, N.M.; George, C.; Goldstein, A.H.; et al. The formation, properties and impact of secondary organic aerosol: Current and emerging issues. Atmos. Chem. Phys. 2009, 9, 5155–5236. [Google Scholar] [CrossRef] [Green Version]
  4. Myhre, G.; Samset, B.H.; Schulz, M.; Balkanski, Y.; Bauer, S.; Berntsen, T.K.; Bian, H.; Bellouin, N.; Chin, M.; Diehl, T.; et al. Radiative forcing of the direct aerosol effect from AeroCom Phase II simulations. Atmos. Chem. Phys. 2013, 13, 1853–1877. [Google Scholar] [CrossRef] [Green Version]
  5. Ervens, B.; Turpin, B.J.; Weber, R.J. Secondary organic aerosol formation in cloud droplets and aqueous particles (aqSOA): A review of laboratory, field and model studies. Atmos. Chem. Phys. 2011, 11, 11069–11102. [Google Scholar] [CrossRef] [Green Version]
  6. Herckes, P.; Lee, T.; Trenary, L.; Kang, G.G.; Chang, H.; Collett, J.L. Organic matter in Central California radiation fogs. Environ. Sci. Technol. 2002, 36, 4777–4782. [Google Scholar] [CrossRef]
  7. Carlton, A.G.; Wiedinmyer, C.; Kroll, J.H. A review of Secondary Organic Aerosol (SOA) formation from isoprene. Atmos. Chem. Phys. 2009, 9, 4987–5005. [Google Scholar] [CrossRef] [Green Version]
  8. Kroll, J.H.; Seinfeld, J.H. Chemistry of secondary organic aerosol: Formation and evolution of low-volatility organics in the atmosphere. Atmos. Environ. 2008, 42, 3593–3624. [Google Scholar] [CrossRef]
  9. Rudich, Y.; Donahue, N.M.; Mentel, T.F. Aging of organic aerosol: Bridging the gap between laboratory and field studies. Annu. Rev. Phys. Chem. 2007, 58, 321–352. [Google Scholar] [CrossRef]
  10. Kalberer, M.; Paulsen, D.; Sax, M.; Steinbacher, M.; Dommen, J.; Prevot, A.S.H.; Fisseha, R.; Weingartner, E.; Frankevich, V.; Zenobi, R.; et al. Identification of polymers as major components of atmospheric organic aerosols. Science 2004, 303, 1659–1662. [Google Scholar] [CrossRef] [PubMed] [Green Version]
  11. Ehn, M.; Kleist, E.; Junninen, H.; Petaja, T.; Lonn, G.; Schobesberger, S.; Dal Maso, M.; Trimborn, A.; Kulmala, M.; Worsnop, D.R.; et al. Gas phase formation of extremely oxidized pinene reaction products in chamber and ambient air. Atmos. Chem. Phys. 2012, 12, 5113–5127. [Google Scholar] [CrossRef] [Green Version]
  12. Laskin, J.; Laskin, A.; Nizkorodov, S.A.; Roach, P.; Eckert, P.; Gilles, M.K.; Wang, B.B.; Lee, H.J.; Hu, Q.C. Molecular Selectivity of Brown Carbon Chromophores. Environ. Sci. Technol. 2014, 48, 12047–12055. [Google Scholar] [CrossRef] [PubMed]
  13. Laskin, A.; Laskin, J.; Nizkorodov, S.A. Chemistry of Atmospheric Brown Carbon. Chem. Rev. 2015, 115, 4335–4382. [Google Scholar] [CrossRef] [PubMed] [Green Version]
  14. Saleh, R.; Hennigan, C.J.; McMeeking, G.R.; Chuang, W.K.; Robinson, E.S.; Coe, H.; Donahue, N.M.; Robinson, A.L. Absorptivity of brown carbon in fresh and photo-chemically aged biomass-burning emissions. Atmos. Chem. Phys. 2013, 13, 7683–7693. [Google Scholar] [CrossRef] [Green Version]
  15. Zhong, M.; Jang, M. Dynamic light absorption of biomass-burning organic carbon photochemically aged under natural sunlight. Atmos. Chem. Phys. 2014, 14, 1517–1525. [Google Scholar] [CrossRef] [Green Version]
  16. Bond, T.C. Spectral dependence of visible light absorption by carbonaceous particles emitted from coal combustion. Geophys. Res. Lett. 2001, 28, 4075–4078. [Google Scholar] [CrossRef] [Green Version]
  17. Kirchstetter, T.W.; Novakov, T.; Hobbs, P.V. Evidence that the spectral dependence of light absorption by aerosols is affected by organic carbon. J. Geophys. Res. Atmos. 2004, 109, 12. [Google Scholar] [CrossRef] [Green Version]
  18. Lack, D.A.; Langridge, J.M.; Bahreini, R.; Cappa, C.D.; Middlebrook, A.M.; Schwarz, J.P. Brown carbon and internal mixing in biomass burning particles. Proc. Natl. Acad. Sci. USA 2012, 109, 14802–14807. [Google Scholar] [CrossRef] [Green Version]
  19. Andreae, M.O.; Crutzen, P.J. Atmospheric aerosols: Biogeochemical sources and role in atmospheric chemistry. Science 1997, 276, 1052–1058. [Google Scholar] [CrossRef] [Green Version]
  20. Ng, N.L.; Kroll, J.H.; Chan, A.W.H.; Chhabra, P.S.; Flagan, R.C.; Seinfeld, J.H. Secondary organic aerosol formation from m-xylene, toluene, and benzene. Atmos. Chem. Phys. 2007, 7, 3909–3922. [Google Scholar] [CrossRef] [Green Version]
  21. Odum, J.R.; Jungkamp, T.P.W.; Griffin, R.J.; Flagan, R.C.; Seinfeld, J.H. The atmospheric aerosol-forming potential of whole gasoline vapor. Science 1997, 276, 96–99. [Google Scholar] [CrossRef] [Green Version]
  22. Odum, J.R.; Jungkamp, T.P.W.; Griffin, R.J.; Forstner, H.J.L.; Flagan, R.C.; Seinfeld, J.H. Aromatics, reformulated gasoline, and atmospheric organic aerosol formation. Environ. Sci. Technol. 1997, 31, 1890–1897. [Google Scholar] [CrossRef]
  23. Zhang, R.Y.; Wang, G.H.; Guo, S.; Zarnora, M.L.; Ying, Q.; Lin, Y.; Wang, W.G.; Hu, M.; Wang, Y. Formation of Urban Fine Particulate Matter. Chem. Rev. 2015, 115, 3803–3855. [Google Scholar] [CrossRef] [PubMed]
  24. Hildebrandt, L.; Donahue, N.M.; Pandis, S.N. High formation of secondary organic aerosol from the photo-oxidation of toluene. Atmos. Chem. Phys. 2009, 9, 2973–2986. [Google Scholar] [CrossRef] [Green Version]
  25. Odum, J.R.; Hoffmann, T.; Bowman, F.; Collins, D.; Flagan, R.C.; Seinfeld, J.H. Gas/particle partitioning and secondary organic aerosol yields. Environ. Sci. Technol. 1996, 30, 2580–2585. [Google Scholar] [CrossRef]
  26. Lin, P.; Liu, J.M.; Shilling, J.E.; Kathmann, S.M.; Laskin, J.; Laskin, A. Molecular characterization of brown carbon (BrC) chromophores in secondary organic aerosol generated from photo-oxidation of toluene. Phys. Chem. Chem. Phys. 2015, 17, 23312–23325. [Google Scholar] [CrossRef]
  27. Liu, J.M.; Lin, P.; Laskin, A.; Laskin, J.; Kathmann, S.M.; Wise, M.; Caylor, R.; Imholt, F.; Selimovic, V.; Shilling, J.E. Optical properties and aging of light-absorbing secondary organic aerosol. Atmos. Chem. Phys. 2016, 16, 12815–12827. [Google Scholar] [CrossRef] [Green Version]
  28. Zhang, W.Y.; Wang, W.G.; Li, J.L.; Peng, C.; Li, K.; Zhou, L.; Shi, B.; Chen, Y.; Liu, M.Y.; Ge, M.F. Effects of SO2 on optical properties of secondary organic aerosol generated from photooxidation of toluene under different relative humidity conditions. Atmos. Chem. Phys. 2020, 20, 4477–4492. [Google Scholar] [CrossRef] [Green Version]
  29. Li, K.; Wang, W.G.; Ge, M.F.; Li, J.J.; Wang, D. Optical properties of secondary organic aerosols generated by photooxidation of aromatic hydrocarbons. Sci. Rep. 2014, 4, 9. [Google Scholar] [CrossRef]
  30. Kim, H.; Paulson, S.E. Real refractive indices and volatility of secondary organic aerosol generated from photooxidation and ozonolysis of limonene, alpha-pinene and toluene. Atmos. Chem. Phys. 2013, 13, 7711–7723. [Google Scholar] [CrossRef] [Green Version]
  31. Moise, T.; Flores, J.M.; Rudich, Y. Optical Properties of Secondary Organic Aerosols and Their Changes by Chemical Processes. Chem. Rev. 2015, 115, 4400–4439. [Google Scholar] [CrossRef]
  32. Nakayama, T.; Sato, K.; Matsumi, Y.; Imamura, T.; Yamazaki, A.; Uchiyama, A. Wavelength and NOx dependent complex refractive index of SOAs generated from the photooxidation of toluene. Atmos. Chem. Phys. 2013, 13, 531–545. [Google Scholar] [CrossRef] [Green Version]
  33. Liu, P.F.; Song, M.J.; Zhao, T.N.; Gunthe, S.S.; Ham, S.H.; He, Y.P.; Qin, Y.M.; Gong, Z.H.; Amorim, J.C.; Bertram, A.K.; et al. Resolving the mechanisms of hygroscopic growth and cloud condensation nuclei activity for organic particulate matter. Nat. Commun. 2018, 9, 10. [Google Scholar] [CrossRef] [PubMed] [Green Version]
  34. Liu, T.Y.; Huang, D.D.; Li, Z.J.; Liu, Q.Y.; Chan, M.N.; Chan, C.K. Comparison of secondary organic aerosol formation from toluene on initially wet and dry ammonium sulfate particles at moderate relative humidity. Atmos. Chem. Phys. 2018, 18, 5677–5689. [Google Scholar] [CrossRef] [Green Version]
  35. Tsiligiannis, E.; Hammes, J.; Salvador, C.M.; Mentel, T.F.; Hallquist, M. Effect of NOx on 1,3,5-trimethylbenzene (TMB) oxidation product distribution and particle formation. Atmos. Chem. Phys. 2019, 19, 15073–15086. [Google Scholar] [CrossRef] [Green Version]
  36. Backstrom, D.; Gunnarsson, A.; Gall, D.; Pei, X.Y.; Johansson, R.; Andersson, K.; Pathak, R.K.; Pettersson, J.B.C. Measurement of the size distribution, volume fraction and optical properties of soot in an 80 kW propane flame. Combust. Flame 2017, 186, 325–334. [Google Scholar] [CrossRef]
  37. Lopez-Hilfiker, F.D.; Mohr, C.; Ehn, M.; Rubach, F.; Kleist, E.; Wildt, J.; Mentel, T.F.; Lutz, A.; Hallquist, M.; Worsnop, D.; et al. A novel method for online analysis of gas and particle composition: Description and evaluation of a Filter Inlet for Gases and AEROsols (FIGAERO). Atmos. Meas. Tech. 2014, 7, 983–1001. [Google Scholar] [CrossRef] [Green Version]
  38. Aljawhary, D.; Lee, A.K.Y.; Abbatt, J.P.D. High-resolution chemical ionization mass spectrometry (ToF-CIMS): Application to study SOA composition and processing. Atmos. Meas. Tech. 2013, 6, 3211–3224. [Google Scholar] [CrossRef] [Green Version]
  39. Ziemann, P.J.; Atkinson, R. Kinetics, products, and mechanisms of secondary organic aerosol formation. Chem. Soc. Rev. 2012, 41, 6582–6605. [Google Scholar] [CrossRef]
  40. Jimenez, P.J.-L. Laboratory Experiments and Modeling for Interpreting Field Studies of Secondary Organic Aerosol Formation Using an Oxidation Flow Reactor; DOE/SC0006035-1; The U.S. Department OF Energy Office of Science Office of Biological and Environmental Research Atmospheric Systems Research Program under Contract NO. DE-SC0006035: Boulder, CO, USA, 2016; pp. 1–46.
  41. Mao, J.; Ren, X.; Brune, W.H.; Olson, J.R.; Crawford, J.H.; Fried, A.; Huey, L.G.; Cohen, R.C.; Heikes, B.; Singh, H.B.; et al. Airborne measurement of OH reactivity during INTEX-B. Atmos. Chem. Phys. 2009, 9, 163–173. [Google Scholar] [CrossRef] [Green Version]
  42. DMT. Three-Wavelength Photoacoustic Soot Spectrometer (PASS-3) Operator Manual; DOC-0163 Revision D; Droplet Measurement Technologies, Inc.: Boulder, CO, USA, 2011. [Google Scholar]
  43. Atkinson, R.; Aschmann, S.M. Rate Constants for the Gas-Phase Reactions of the Oh Radical with a Series of Aromatic-Hydrocarbons at 296+/−2-K. Int. J. Chem. Kinet. 1989, 21, 355–365. [Google Scholar] [CrossRef]
  44. Simon, L.; Clegg, P.B.; Anthony, S.W. Extended AIM Aerosol Thermodynamics Model. Available online: http://www.aim.env.uea.ac.uk/aim/aim.php (accessed on 8 March 2022).
  45. Presto, A.A.; Hartz, K.E.H.; Donahue, N.M. Secondary organic aerosol production from terpene ozonolysis. 2. Effect of NOx concentration. Environ. Sci. Technol. 2005, 39, 7046–7054. [Google Scholar] [CrossRef] [PubMed]
  46. Takeuchi, M.; Ng, N.L. Organic Nitrates and Secondary Organic Aerosol (SOA) Formation from Oxidation of Biogenic Volatile Organic Compounds. In Multiphase Environmental Chemistry in the Atmosphere; ACS Symposium Series; American Chemical Society: Washington, DC, USA, 2018; Volume 1299, pp. 105–125. [Google Scholar]
  47. Qi, X.; Zhu, S.P.; Zhu, C.Z.; Hu, J.; Lou, S.R.; Xu, L.; Dong, J.G.; Cheng, P. Smog chamber study of the effects of NOx and NH3 on the formation of secondary organic aerosols and optical properties from photo-oxidation of toluene. Sci. Total Environ. 2020, 727, 10. [Google Scholar] [CrossRef] [PubMed]
  48. Chen, L.H.; Bao, Z.E.; Wu, X.C.; Li, K.W.; Han, L.X.; Zhao, X.Y.; Zhang, X.; Wang, Z.H.; Azzi, M.; Cen, K.F. The effects of humidity and ammonia on the chemical composition of secondary aerosols from toluene/NOx photo-oxidation. Sci. Total Environ. 2020, 728, 10. [Google Scholar] [CrossRef]
  49. Bao, Z.E.; Xu, H.F.; Li, K.W.; Chen, L.H.; Zhang, X.; Wu, X.C.; Gao, X.; Azzi, M.; Cen, K.F. Effects of NH3 on secondary aerosol formation from toluene/NOx photo-oxidation in different O3 formation regimes. Atmos. Environ. 2021, 261, 11. [Google Scholar] [CrossRef]
  50. Jang, M.S.; Czoschke, N.M.; Lee, S.; Kamens, R.M. Heterogeneous atmospheric aerosol production by acid-catalyzed particle-phase reactions. Science 2002, 298, 814–817. [Google Scholar] [CrossRef] [PubMed]
  51. Deng, Y.G.; Inomata, S.; Sato, K.; Ramasamy, S.; Morino, Y.; Enami, S.; Tanimoto, H. Temperature and acidity dependence of secondary organic aerosol formation from alpha-pinene ozonolysis with a compact chamber system. Atmos. Chem. Phys. 2021, 21, 5983–6003. [Google Scholar] [CrossRef]
  52. Cao, G.; Jang, M. Secondary organic aerosol formation from toluene photooxidation under various NOx conditions and particle acidity. Atmos. Chem. Phys. Discuss. 2008, 2008, 14467–14495. [Google Scholar] [CrossRef] [Green Version]
  53. McNeill, V.F.; Woo, J.L.; Kim, D.D.; Schwier, A.N.; Wannell, N.J.; Sumner, A.J.; Barakat, J.M. Aqueous-Phase Secondary Organic Aerosol and Organosulfate Formation in Atmospheric Aerosols: A Modeling Study. Environ. Sci. Technol. 2012, 46, 8075–8081. [Google Scholar] [CrossRef]
Figure 1. (ad): SOA mass formed as a function of [NOx]/[ΔHC] at (a) 80% RH, (b) 65% RH, (c) 35% RH, and (d) 20% RH. Empty and filled symbols show results for NP and NR SOA, respectively. Dashed lines are included to guide the eye.
Atmosphere 13 01099 g001
Figure 2. The aerosol absorption coefficient Babs as a function of [NOx]/[ΔHC] at 80% RH, 65% RH, 35% RH and 20% RH. Empty and filled symbols show results for NP and NR SOA, respectively. Dashed lines are included to guide the eye.
Atmosphere 13 01099 g002
Figure 3. Babs as a function of RH in the NP and NR SOA formation regimes. NP (empty) and NR (filled) symbols are blue and red coloured, respectively. The solid and dashed lines are included to guide the eye.
Atmosphere 13 01099 g003
Figure 4. MAC (mass absorption cross-section) as a function of the [NOx]/[ΔHC] ratio at 80%, 65%, 35% and 20% RH. Empty and filled symbols show results for NP and NR SOA, respectively. The dashed lines are included to guide the eye.
Atmosphere 13 01099 g004
Figure 5. MAC as a function of RH in the NP and NR SOA formation regimes. Results for the NP and NR regimes are plotted using empty blue and filled red circles, respectively. Solid and dashed lines are included to guide the eye.
Atmosphere 13 01099 g005
Figure 6. Bscat as a function of the NOx to reacted toluene ratio ([NOx]/[ΔHC]) at 80% RH, 65% RH, 35% RH and 20% RH. Empty and filled symbols show results for NP and NR SOA, respectively. The dashed lines are included to guide the eye.
Atmosphere 13 01099 g006
Figure 7. MSC as a function of the NOx to reacted toluene ratio ([NOx]/[ΔHC]) at 80% RH, 65% RH, 35% RH and 20% RH. Empty and filled symbols show results for NP and NR SOA, respectively. The solid and dashed lines are included to guide the eye.
Atmosphere 13 01099 g007
Figure 8. SOA mass as a function of the ([NH3]/[ΔHC]) ratio at 80% RH under low and high NOx scenarios. Blue and red dotted lines are the eye guiding lines for low and high NOx scenarios, respectively.
Atmosphere 13 01099 g008
Figure 9. Babs as a function of the ([NH3]/[ΔHC]) ratio at 80% RH under low and high NOx scenarios. Blue and red dotted lines are the eye guiding lines for low and high NOx scenarios, respectively. The dashed lines are included to guide the eye.
Atmosphere 13 01099 g009
Figure 10. MAC as a function of the ([NH3]/[ΔHC]) ratio at 80% RH under low and high NOx scenarios. Blue and red dotted lines are the eye guiding lines for low and high NOx scenarios, respectively. The dashed lines are included to guide the eye.
Atmosphere 13 01099 g010
Figure 11. Summary of the effects of NH3 on the optical characteristics of toluene SOA, i.e., MAC MSC, Babs and Bscat at 80% RH under low and high NOx conditions (data are plotted using a log scale).
Atmosphere 13 01099 g011
Figure 12. (ac): SOA mass as a function of NOx]/[ΔHC] and the influence of acidity on SOA mass at (a) 80% RH, (b) 65% RH, and (c) 20% RH. The dashed lines are included to guide the eye.
Atmosphere 13 01099 g012
Figure 13. (af): Effects of acidity, NOx and RH on the Babs and MAC of toluene SOA. (i) Babs as a function of [NOx]/[ΔHC] in H2SO4 seeded and non-seeded experiments at (a) 80%, (b) 65%, and (c) 20% RH. (ii) MAC as a function of [NOx]/[ΔHC] in H2SO4 seeded and non-seeded experiments at (d) 80%, (e) 65%, and (f) 20% RH. The solid and dotted lines in Figure 13 (ac) are eye guides showing the trends in Babs for NP SOA in the H2SO4 seeded and non-seeded cases, respectively; eye guides for the NR case are not shown. Conversely, in Figure 13 (df), the solid and dotted lines are eye guides for both the NP and NR SOA in H2SO4 seeded and non-seeded experiments, respectively. The solid and dashed lines are included to guide the eye.
Atmosphere 13 01099 g013
Figure 14. (ac): Effects of water vapour and acidity on the MAC of toluene SOA. (a) MAC of NP SOA for the H2SO4 seeded and non-seeded experiments at the three RHs; (b) MAC of NR SOA for the H2SO4 seeded and non-seeded experiments at the three RHs; (c) concentration of [H+] (free acid) per unit SOA mass available in aqueous for heterogeneous chemistry at the three RHs. The solid and dashed lines are eye guides.
Atmosphere 13 01099 g014
Figure 15. (a,b): Effects of water vapour and acidity on the Bscat of toluene SOA. (a) Bscat of NP SOA for the H2SO4 seeded and non-seeded experiments at the three RHs; (b) Bscat of NR SOA for the H2SO4 seeded and non-seeded experiments at the three RHs. The solid and dashed lines are eye guides.
Atmosphere 13 01099 g015
Table 1. The experimental input matrix.
Exp.IDReacted Toluene (ΔHC) Concentration (ppb) §NOxO3RH%NH3H2SO4OHexpo (Calculated) × 1011Remarks
(NO:NO2 Ratio = 1:1)(Initial, ppb)Ramp(μg m−3)(cm−3·s)
Range
(Initial to Final, ppb)
Tol-1116131 to 36299980NoNo2.8NOx ramped
Tol-2106431 to 36299965NoNo2.3NOx ramped
Tol-387031 to 36299935NoNo1.6NOx ramped
Tol-477431 to 36299920NoNo1.3NOx ramped
Tol-511616199980YesNo2.8NH3 Ramp. NOx constant
Tol-6116136099980YesNo2.8NH3 Ramp. NOx constant
Tol-7116130 to 35199980NoYes (22.3)2.8NOx ramped
Tol-8116130 to 35199965NoYes (22.3)2.8NOx ramped
Tol-978030 to 35199920NoYes (22.3)1.6NOx ramped
§: Toluene reacted is calculated by measuring residual toluene from Go:PAM outlet with a VOC monitor with and without reaction at Go:PAM.
Table 2. Summary of experimental results.
Exp. IDSOA TypeSOA Mass μg m−3Babs.405
Mm−1
Babs781
Mm−1
Bscat405
Mm−1
Bscat781
Mm−1
MAC405
m2g−1
MSC405
m2g−1
OH (Molecules cm−3·s) × 1011;
[SOA Aging in Days]
Average Mobility Diameter (nm)
Tol-1NP
NR
552
520
11.8
25.2
0.320
0.112
1259
1258
66.5
67.4
0.021
0.048
2.29
2.38
2.8; [1.61]65.0
64.7
Tol-2NP
NR
372
358
8.15
14.5
0.000
0.000
805
788
39.1
38.3
0.022
0.040
2.13
2.20
2.3; [1.33]60.8
62.8
Tol-3NP
NR
261
223
5.31
10.3
0.937
0.195
516
451
22.3
20.3
0.020
0.045
1.88
1.95
1.6; [0.93]58.8
57.7
Tol-4NP
NR
162
134
3.73
6.10
0.000
0.042
318
258
14.0
11.4
0.024
0.041
2.05
1.77
1.3; [0.77]57.0
55.0
Tol-5NP46513.30.2462958285.80.0296.392.8; [1.61]94.6
Tol-6NR43240.10.02515000.0000.0933.482.8; [1.61]64.5
Tol-7NP
NR
375
416
11.5
25.6
0.000
0.626
1582
1950
113.8
139.6
0.030
0.061
4.19
4.57
2.8; [1.61]63.9
64.5
Tol-8NP
NR
348
321
12.4
21.4
0.085
0.987
1747
1632
127.4
117.9
0.035
0.068
5.05
5.06
2.8; [1.61]91.2
89.3
Tol-9NP
NR
192
182
7.86
10.3
0.000
0.000
807
738
55.2
51.4
0.041
0.058
4.14
4.05
1.6; [0.93]87.8
88.1
Table 3. SOA Properties under various experimental conditions in the NP and NR regimes.
Exp. IDRH
(%)
Avg. SOA Mass
(μg m−3)
Avg. NOx/ΔHCAvg. ALW *
(μg m−3)
Avg. SOA Mass # (dry)
(μg m−3)
Avg.
Babs405
(Mm−1)
Dry SOA
MAC405
(m2 g−1)
ALW+SOA
MAC405
(m2 g−1)
NPNRNPNRNPNRNPNRNPNRNPNRNPNR
Tol-180545 508 0.0940.28816715537835310.328.00.0270.0790.0190.055
Tol-265372 342 0.0940.28884772892658.219.00.0280.0720.0220.056
Tol -3352612270.0940.28819172422104.710.00.0190.0480.0180.044
Tol-4201581390.0940.288631521363.36.50.0220.0480.0210.047
ALW * = Aerosol Liquid Water calculated by Extended AIM Aerosol Thermodynamics Model [44]. Avg. SOA Mass # (dry) = ((SOA Mass at SMPS)—ALW).
Publisher’s Note: MDPI stays neutral with regard to jurisdictional claims in published maps and institutional affiliations.

