Article

Variability of Precipitation Recycling and Moisture Sources over the Colombian Pacific Region: A Precipitationshed Approach

by
Angelica M. Enciso
1,2,*,
Olga Lucia Baquero
3,
Daniel Escobar-Carbonari
1,
Jeimar Tapasco
1 and
Wilmar L. Cerón
4
1
Climate Action, Alliance of Bioversity International and the International Center for Tropical Agriculture (CIAT), Palmira 763537, Colombia
2
Postgraduate Program on Integrated Water Resources Management, Faculty of Engineering, Universidad del Valle, Cali 760032, Colombia
3
Cinara Institute, Faculty of Engineering, Universidad del Valle, Cali 760032, Colombia
4
Department of Geography, Faculty of Humanities, Universidad del Valle, Cali 760032, Colombia
*
Author to whom correspondence should be addressed.
Atmosphere 2022, 13(8), 1202; https://doi.org/10.3390/atmos13081202
Submission received: 11 June 2022 / Revised: 22 July 2022 / Accepted: 23 July 2022 / Published: 30 July 2022

Abstract

:
This study assessed the precipitation recycling and moisture sources in the Colombian Pacific region between 1980–2017, based on the monitoring of moisture in the atmosphere through the Eulerian Water Accounting Model-2 layer (WAM2 layer) and the delimitation of the area contributing to terrestrial and oceanic moisture in the region is performed using the “precipitationshed” approach. The results indicate a unimodal precipitation recycling ratio for the North and Central Pacific and Patía-Mira regions, with the highest percentages between March and April, reaching 30% and 34%, respectively, and the lowest between September and October (between 19% and 21%). Moreover, monthly changes in the circulation of the region promote a remarkable variability of the sources that contribute to the precipitation of the study area and the spatial dynamics of the precipitationshed. From December to April, the main contributions come from continental sources in eastern Colombia and Venezuela, the tropical North Atlantic, and the Caribbean Sea, a period of high activity of the Orinoco Low-Level jet. In September, the moisture source region is located over the Pacific Ocean, where a southwesterly cross-equatorial circulation predominates, converging in western Colombia, known as the Choco Jet (CJ), decreasing the continental contribution. An intensified Caribbean Low-Level Jet inhibits moisture sources from the north between June and August, strengthening a southerly cross-equatorial flow from the Amazon River basin and the southeastern tropical Pacific. The March–April (September–October) season of higher (lower) recycling of continental precipitation is related to the weakening (strengthening) of the CJ in the first (second) half of the year, which decreases (increases) the contribution of moisture from the Pacific Ocean to the region, increasing (decreasing) the influence of land-based sources in the study area.

1. Introduction

As a result of the interactions between the atmosphere and the Earth’s surface, precipitation and evaporation processes are generated. Precipitation over the land surface originates mainly from two mechanisms, advection of water vapor from the oceans and evaporation of surface moisture, whose contribution to the total precipitation in a region is called recycled precipitation [1,2,3]. Most surface hydrology studies are based on analyzing the division of precipitation between runoff and evaporation, describing how water molecules fall from the atmosphere to the surface. The concept of recycled precipitation describes a similar division. Still, in this case, it does not analyze where precipitation falls but rather the origin of the water vapor molecules that form it [4]. Although the source of precipitation is difficult to establish due to the variability of the processes that produce it, it is a fundamental factor in understanding the role of the hydrological cycle in the climate system. According to Van Der Ent [5], it is estimated that, on average, 40% of terrestrial precipitation comes from terrestrial evaporation, and 57% of this returns as precipitation over land.
In recent years, several researchers have developed new definitions of moisture recycling for studies on continental moisture feedback processes [5,6,7,8]. Among which is the one developed by Keys [8], which introduces the concept of “precipitationshed” or “atmospheric basins”, defined as the surface area of both water and land that provides evaporation to the precipitation of a specific region. This concept has been used to highlight areas where livelihoods depend on rainfed agriculture and where changes in the land use in precipitationshed could have significant consequences on society. The importance of the “atmospheric basins” approach is the inclusion of evaporation input in distant areas from the precipitation of a specific region, thus establishing hydroclimatological connections between remotely separated areas, which often overwhelm political–administrative divisions [9,10]. Therefore, terrestrial sources and water vapor sinks represent a particular interest in the hydrological analysis, as well as the understanding of moisture fluxes responsible for the transport of water vapor, a phenomenon that occurs on several temporal and spatial scales that generates a spatiotemporal redistribution of precipitation over the planet [11]. For example, in some regions of South America, precipitation recycling has been explored finding out that varies substantially in dry and wet years and under the influence of phenomena such as the North Atlantic Oscillation (NAO) or El Niño Southern Oscillation (ENSO) [4,10,12,13,14,15,16,17,18,19,20].
Otherwise, Van Der Ent [7] indicates that in the tropics and mountainous lands, the scale of the recycling process can be from 500 to 2000 km, and the timescale ranges vary from 3 to 20 days, except for deserts, where it is much longer. In this regard, Cuartas et al. [2], evidenced that in the Amazon the moisture recycling can represent between 35% and 50% of the total precipitation where the terrestrial recycling of moisture is essential in sustaining regional precipitation [13,21], whereas Satyamurti et al. [12] identified that wet years show about 55% more moisture convergence than dry years in the Amazon basin. A reduction in moisture inflow across the eastern and northern boundaries of the basin and an increase in outflow across the southern border at 15° S led to drier conditions. For his part, Martinez et al. [20] estimated the variability of moisture sources in the La Plata River Basin (LPB) using an extended version of the Dynamic Recycling Model, finding that 37% of the mean annual precipitation over the LPB comes from the South Pacific and Atlantic tropical oceans. The remaining 63% comes from South America, including 23% from local sources in the LPB and 20% from the southern Amazon.
In Colombia, several researchers have tried to explain some of the climatic and hydrological phenomena related to the interaction between the atmosphere and the surface, finding that the climate of the country, mainly in the center and western part, is strongly influenced by the physical interactions that occur in the Pacific Ocean, where moisture influx occurs at the lowest pressure levels (below 800 hPa), mainly due to surface winds or jets such as the Choco Jet (CJ) located at 925 hPa [22,23,24], which transports large amounts of moisture to the region. According to Jaramillo et al. [25], this jet contributes approximately 57% of the total precipitation in western Colombia and the Gulf of Panama. In addition, Gallego et al. [18] indicate that the CJ is deeply related to the dynamics of the Intertropical Convergence Zone (ITCZ) in the eastern equatorial Pacific and is responsible for up to 30% of the total precipitation in central and northern South America. Furthermore, in addition to the significant influence of the humid oceanic masses on the Pacific region’s climate, it has been determined that the Andes Mountain range is the main determining factor of the geographic, physical, biological, and hydrological configuration of the Pacific sub ecosystem. According to Velásquez-Restrepo and Poveda [26], these characteristics make the Pacific an ideal space for understanding the functioning and integrity of the hydrological cycle, mainly on atmospheric interactions with oceanic and surface processes.
Cuartas [27] and Cuartas and Poveda [2] indicated that the average value of atmospheric moisture input in Colombia is 5716 mm/year, with an important variability during ENSO phases, coming mainly from easterly and westerly trade winds. On the other hand, they found that, on average, 31% of the total precipitation in the country is due to evaporated moisture from the surface, and for the Pacific region, it is about 18%. Meanwhile, Hoyos et al. [10] evaluated the sources and processes of moisture transport for Colombia, finding that moisture from the Atlantic Ocean and terrestrial recycling are the main sources of moisture in the country; they also found that the CJ plays an important role in the convergence of moisture over western Colombia. Arias et al. [16] examined the primary sources of moisture during La Niña 2010–2012, finding that the main sources were the Pacific Ocean through the CJ and the Caribbean Sea, through the weakening of the Caribbean Low-Level Jet (CLLJ) and the development of southward anomalies toward northern South America.
Quantifying the terrestrial evaporation which feeds precipitation over land, i.e., the magnitude of recycled moisture, is of great importance in the analysis of the interactions and feedbacks between surface and atmospheric hydrology, being a possible indicator of climate sensitivity to land use changes [1,4,6,28], which is essential to understand the impact of anthropogenic activities on climate, as they can modify terrestrial moisture fluxes through changes in land use and water management.
The understanding of the interactions between precipitation and evaporation has changed over time. There are several models for calculating recycled precipitation; however, most of them are modifications of the generalized one-dimensional model of Budyko [29], which expresses the percentage of recycling in the direction of a single stream of velocity u and length l and as a function of regional evaporation (E) and atmospheric moisture transport (Q). This model was modified by Brubaker et al. [1] by considering the flow input to a region in two directions, for his part Eltahir and Bras [4] proposed a model that calculates the local recycling ratio on a spatially distributed grid for monthly or longer time scales, and Dominguez et al. [30] developed a model derived from the two-dimensional atmospheric water balance equation, which estimates the local recycling ratio for daily or longer time scales and only uses the hypothesis of a well-mixed atmosphere. Finally, Van Der Ent et al. [6] proposed a numerical model based on the atmospheric water balance, estimating the recycling ratio daily. The latter model labels each water particle to be traced back to the origin, determining the spatio-temporal distribution of the moisture origin rather than simply estimating the recycling ratio on a large spatial and temporal scale [7].
Among the most widely used moisture tracking models are Lagrangian models such as the 2D Dynamic Recycling Model (DRM) developed by Dominguez et al. [30], the Quasi-Isentropic 3D Backward Trajectory (QIBT) method by Dirmeyer and Brubaker [31], and others such as FLEXPART and HYSPLIT [7]. Furthermore, the Eulerian models allow the tracking of moisture on a global scale [6,7] and are highlighted by the speed of the calculation due to their simplicity, but also due to their Eulerian grid, which allows them to track the origin of moisture quickly in both large and small areas. An example of such an Eulerian trajectory model is the WAM-2 layers (Water Accounting Model-2 layers) [7].
Therefore, considering the complexity of the Colombian Pacific region, this study aims to identify the recycled precipitation and moisture sources in the study area by tracking atmospheric moisture through the Eulerian Water Accounting Model-2 layer (WAM-2 layer). This method estimates the recycling ratio of continental precipitation and the contribution of terrestrial moisture sources to the study area’s precipitation. Additionally, it delimits the area that contributes both terrestrial and oceanic moisture to the precipitation of the Colombian Pacific under the “precipitationshed” approach implemented by Keys [8]. This study contributes to the appropriate management and conservation of water resources in the Colombian Pacific region, increasing knowledge on land–atmosphere feedback and ocean–atmosphere feedback.

2. Materials and Methods

The percentage of recycled precipitation might be local (ρ), regional (ρr) and continental (ρc) [4,6,13,21,28,32]. Here, we define surface precipitation as a combination of oceanic and terrestrial moisture sources; this approach makes it possible to analyze the influence of evaporation from remote locations on the precipitation in a particular geographical area. Precipitation is defined as:
P ( t ,   x ,   y ) = P c ( t ,   x ,   y ) + P o ( t ,   x ,   y )
where P c is continental-sourced precipitation (evaporated from a continent region) and P o is ocean-sourced precipitation (evaporated from the ocean). The recycling ratio of continental precipitation, which shows the dependence of precipitation at a given location relative to continental evaporation, is provided as:
ρ c ( t ,   x ,   y ) = P c ( t ,   x ,   y ) P   ( t ,   x ,   y )
WAM-2 layers perform 2D ( x ,   y ) moisture tracking, globally and regionally, following the moisture backward (evaporation that will be precipitated in a predefined region) and forwards (precipitation that evaporated from a predefined region) in time. The model splits the atmosphere into two layers making moisture tracking more reliable than vertically integrated moisture fluxes [7]. Van Der Ent et al. [7] showed that the WAM-2 layer model provides similar results to a complex and highly detailed moisture tracking scheme in a regional climate model (RCM-tag) [33] but with a lower computational effort [34]. The WAM single-layer model struggled to estimate the correct moisture flux direction in this case study. However, by adding another layer, the results were closer to the RCM-tag method that directly uses highly accurate three-dimensional water tracking (including phase transitions) within a regional climate model.
The shear layer is approximately at the sigma level, corresponding to around 800 hPa. The horizontal moisture fluxes in the lower layer are calculated between the surface and the sigma level, while the horizontal moisture fluxes in the upper layer are calculated from sigma level to 175 hPa. Moreover, the vertical velocity given at the sigma level of around 800 hPa was used to calculate the moisture transport between the lower and upper layers. On the preceding basis, moisture is tracked from where it enters to where it leaves the atmosphere as evaporation and precipitation. Therefore, it is possible to identify when and where precipitation from a specific region entered the atmosphere as evaporation as time progresses.
The WAM-2 layer model is open access and requires input data with a daily resolution specified in Table 1. These input data were taken from the ERA-Interim climate reanalysis project dataset provided by the European Centre for Medium-Range Weather Forecasts Interim Reanalysis (ECMWF/ERA-I) [35,36]. According to Hoyos [10], the ECMWF/ERA-I dataset has a good qualitative, and quantitative representation of the Colombian climate features; depicting more realistically the regional orography when compared to the first-generation reanalysis data (NCEP/NCAR and ERA-40), allowing a better representation of regional humidity and atmospheric transport [10,35,37]. Furthermore, previous studies have used this dataset, presenting results suitable for the analysis of climate variability at interannual and decadal scales which affect Colombia [16,38,39]. All variables were obtained for the 1980–2017 period in the region 20° N–15° S and 120° W–60° W, with a horizontal resolution of 0.75° × 0.75°. The moisture source and the average recycling ratio were estimated over the same period. Precipitation and evaporation data at 3 h intervals, specific humidity, zonal and meridional wind velocity at 24 pressure levels (175–1000 hPa) (as required by WAM-2 layer), and surface pressure were used to calculate the vertically integrated moisture flux and precipitable water every 6 h.
The fundamental principle for the WAM-2 layers numerical model is the atmospheric water balance:
W k t = ( W k u ) x + ( W k v ) y + E k P k + ξ k ± Q V
where W k is the atmospheric moisture storage (precipitable water) in layer k (either the upper or lower layer), E k is evaporation flowing into layer k , P k is precipitation leaving layer k , ξ is an essential residual to correct the precipitation or evaporation, Q V is the vertical moisture transport between the lower and upper layers, x is the longitudinal direction (zonal component) and y is the latitudinal direction (meridional component). Moisture transport is calculated over grid cell boundaries. The change in atmospheric moisture due to horizontal transport is defined by:
Δ ( W u ) Δ x = F k , x F k , x +   ,   Δ ( W v ) Δ x = F k , y F k , y +
where F k is the moisture flow over the boundary of a grid cell in the upper or lower layer, which is positive from west to east and from south to north. The superscript “–” represents the west and south boundaries of the grid cell and “+” represents the east and north boundaries. The vertically integrated moisture flux ( F k ) is calculated as follows:
F k = L g ρ   p t o p p b o t t o m q u h d p
where L is the length of perpendicular cell to the moisture flow direction, g is the gravity, ρ is the density of liquid water (1000 kg·m–3), p is the pressure, q specific humidity and u h is the horizontal component in either x or y direction. For the top layer, applies p t o p = 0 and p b o t t o m = p d i v i d e . For the bottom layer applies p t o p = p d i v i d e and p b o t t o m = p s u r f a c e . Where p d i v i d e is the pressure between the upper and lower layer, which corresponds to 81,283 Pa at a standard surface pressure of 101,325 Pa and can be calculated as follows [5]:
p d i v i d e = 7438.803 + 0.728786 × p s u r f a c e   [ P a ]
Over the surface, the bottom layer represents about 40–80% of the total moisture storage in the column, and 30–70% of the total horizontal moisture flow [5]. Evaporation E enters only the lower layer, so E k = E in this layer while E k = 0 in the upper layer. Precipitation is assumed to be removed immediately from moisture storage (there is no downward precipitation exchange between the upper and lower layer), and the “well-mixed atmosphere” condition is assumed for precipitation:
P k = P W k W
where P is the total precipitation and W is the total atmospheric storage in the vertical.
The residual ξ is the result of the assimilation of the ERA-Interim dataset and the fact that the decoupled tracking scheme calculates the water balance at gross spatial and temporal resolution. The vertical moisture transport Q V is difficult to calculate because, in addition to the transport by the mean wind velocity in the vertical, there is a scattering moisture exchange due to the convective scheme in ERA-Interim. Therefore, it is assumed that the vertical exchange is the closing term of the water balance. However, due to the residual ξ the water balance cannot be completely closed. Therefore, the closure is defined by the ratio of upper and lower layer residuals, which is proportional to the moisture content of the layers:
ξ t o p W t o p = ξ b o t t o m W b o t t o m
From the above equation, the vertical moisture transport can be calculated as:
Q V = W b o t t o m W ( ξ b o t t o m * + ξ t o p * ) ξ b o t t o m *
where ξ b o t t o m * and ξ t o p * are the residuals to be considered before vertical transport.
The same water balance is applied for tracking moisture from a given origin (continental, regional or local) in WAM-2 layers. For example, the water balance of the evaporation to be tracked (identified by the subscript Ω) in the lower layer of the atmosphere for forwarding tracking (trajectory of moisture from where it evaporates to where it precipitates) is described by:
W Ω ,     b o t t o m t = ( W Ω , b o t t o m u ) x + ( W Ω , b o t t o m v ) y + E Ω P Ω + ξ Ω ± Q V , Ω
For backward tracking (trajectory of moisture from where it precipitates to where it evaporates) and upper layer calculation, equations similar to the above are used. Van Der Ent [7] found that the vertical flow was too small to adequately represent the vertical transport of the monitored water, which is attributed to the turbulent moisture exchange between the upper and lower layer. Based on Van Der Ent’s trial-and-error tests [7], this situation was resolved by keeping Q V as the net vertical moisture flux and using a vertical flux of 4 Q V in the net flow direction and 3 Q V in the opposite direction during the tagging experiments. Despite simplifying turbulent moisture exchange, the authors considered it a suitable parameterization for the study, and their results were not very sensitive to turbulent moisture exchange. For further details on the application of this model, refer to https://github.com/ruudvdent/WAM2layersPython (accessed on 22 July 2022). The specific structure of commands applied for the model execution and the division of the variables into atmospheric layers can be explicitly found at https://github.com/ruudvdent/WAM2layersPython/blob/master/Fluxes_and_States_Masterscript.py (accessed on 22 July 2022).
For this study, the Colombian Pacific region was selected as the unit of analysis based on the seasonality of the monthly mean precipitation in Colombia as defined by the Institute of Hydrology, Meteorology and Environmental Studies (IDEAM) [40] (Figure 1a,b). Out of the 12 regions defined by IDEAM, we used the North and Central Pacific (NCP) and Patía-Mira (P-M) regions covering the Colombian Pacific, as shown in Figure 1a. To determine the recycled precipitation in the Colombian Pacific region, moisture was tracked forward in time, which allows for determining the amount (percentage) of the total precipitation from the region that originated from the evaporation of continental sources.
In this case, the continental precipitation recycling ratio ( ρ c ) was estimated, as described in Equation (2), whose numerical implementation in the model is given by:
ρ c = t = t 0 t f i n a l P W c o n W t = t 0 t f i n a l P
where, W c o n is the atmospheric moisture storage of continental origin. The storage of atmospheric moisture of continental origin is the humidity coming from the evapotranspiration of the continental (terrestrial) zone. In the model, a layer or mask is added to define the oceanic and continental region of the study area, which in this case is slightly lower than the region where the information is downloaded and corresponds to the 15° N–6.75° S and 98.25° W–60.75° W. The region where the forward trajectory of the moisture is calculated and where the spatial distribution of the evaporated precipitation is obtained corresponds to the above-mentioned region. For the backward trajectory (where the spatial distribution of the evaporation that will be precipitated (precipitationshed) is obtained from the model and based on the loaded layer, the location of the study region (Colombian Pacific region) is specified.
To calculate the precipitationshed or source region of precipitation in the Pacific, we use the adaptation carried out by Keys et al. [41] to the WAM-2 layer, which allows backtracking of precipitation from the source region (in our case, the Pacific region), to identify the sources of evaporation or humidity. The backtracking method is based on the following approach:
P Ω ( t ,   x Ω , y Ω ,   A Ω ,   Δ Ω ) = i = 0 p j = 0 m E Ω ( t ,   x i , y i )
where P Ω is the precipitation in the sink region Ω (defined by longitude x Ω , latitude y Ω , area A Ω and shape Δ Ω ). Specifically, the amount of evaporation E Ω reaching the region Ω , which traveled through the atmosphere, and ends up as precipitation in that region, is calculated for each cell. E Ω is integrated over all grid cells, where i and j are the cell indices and p and m are the cell numbers along the parallel and meridian, respectively. Its numerical implementation in the model is given by:
E Ω = t = t 0 t f i n a l E W b o t t o m W
where, W o is the moisture storage tracked or labeled in the lower layer, and W is the total moisture in all layers. To find the precipitationshed with WAM-2 layer, a backward tracking in time is performed from the region defined as a moisture sink, which in this study corresponds to the Colombian Pacific region, whose result allows identifying the area contributing the highest percentage to the moisture that precipitates in this region. Nevertheless, the results of the model on their own do not correspond to the precipitationshed, because each cell, even if it is quite small or distant from the sink area, can contribute to the evaporation estimate; therefore, a threshold must be established to define a spatially explicit boundary of the precipitationshed, based on the evaporation contribution. In this case, the threshold was defined as the cells that contribute 80% of evaporation or humidity to the precipitation over the Colombian Pacific; this is based on the topographic limits of the country that directly affect the behavior of the airflow and on the usefulness of these limits for future analysis of vulnerability to changes in land use and land cover.
Moreover, indices of water balance variables, precipitation, evapotranspiration, and moisture convergence (moisture divergence multiplied by –1, hereinafter ConvQ), corresponding to the mean for each region, NCP and P-M separately, were constructed. To examine the variability of the continental recycled precipitation and its relationship with the winds coming from the Pacific Ocean, the CJ index was used as the mean of the zonal winds at 925 hPa in the region between 2° N and 7° N along the 80° W meridian. Several authors used the zonal winds at 925 hPa in northern South America to characterize the CJ and the associated moisture transport on monthly and seasonal scales [15,16,24,38,42].

3. Results and Discussion
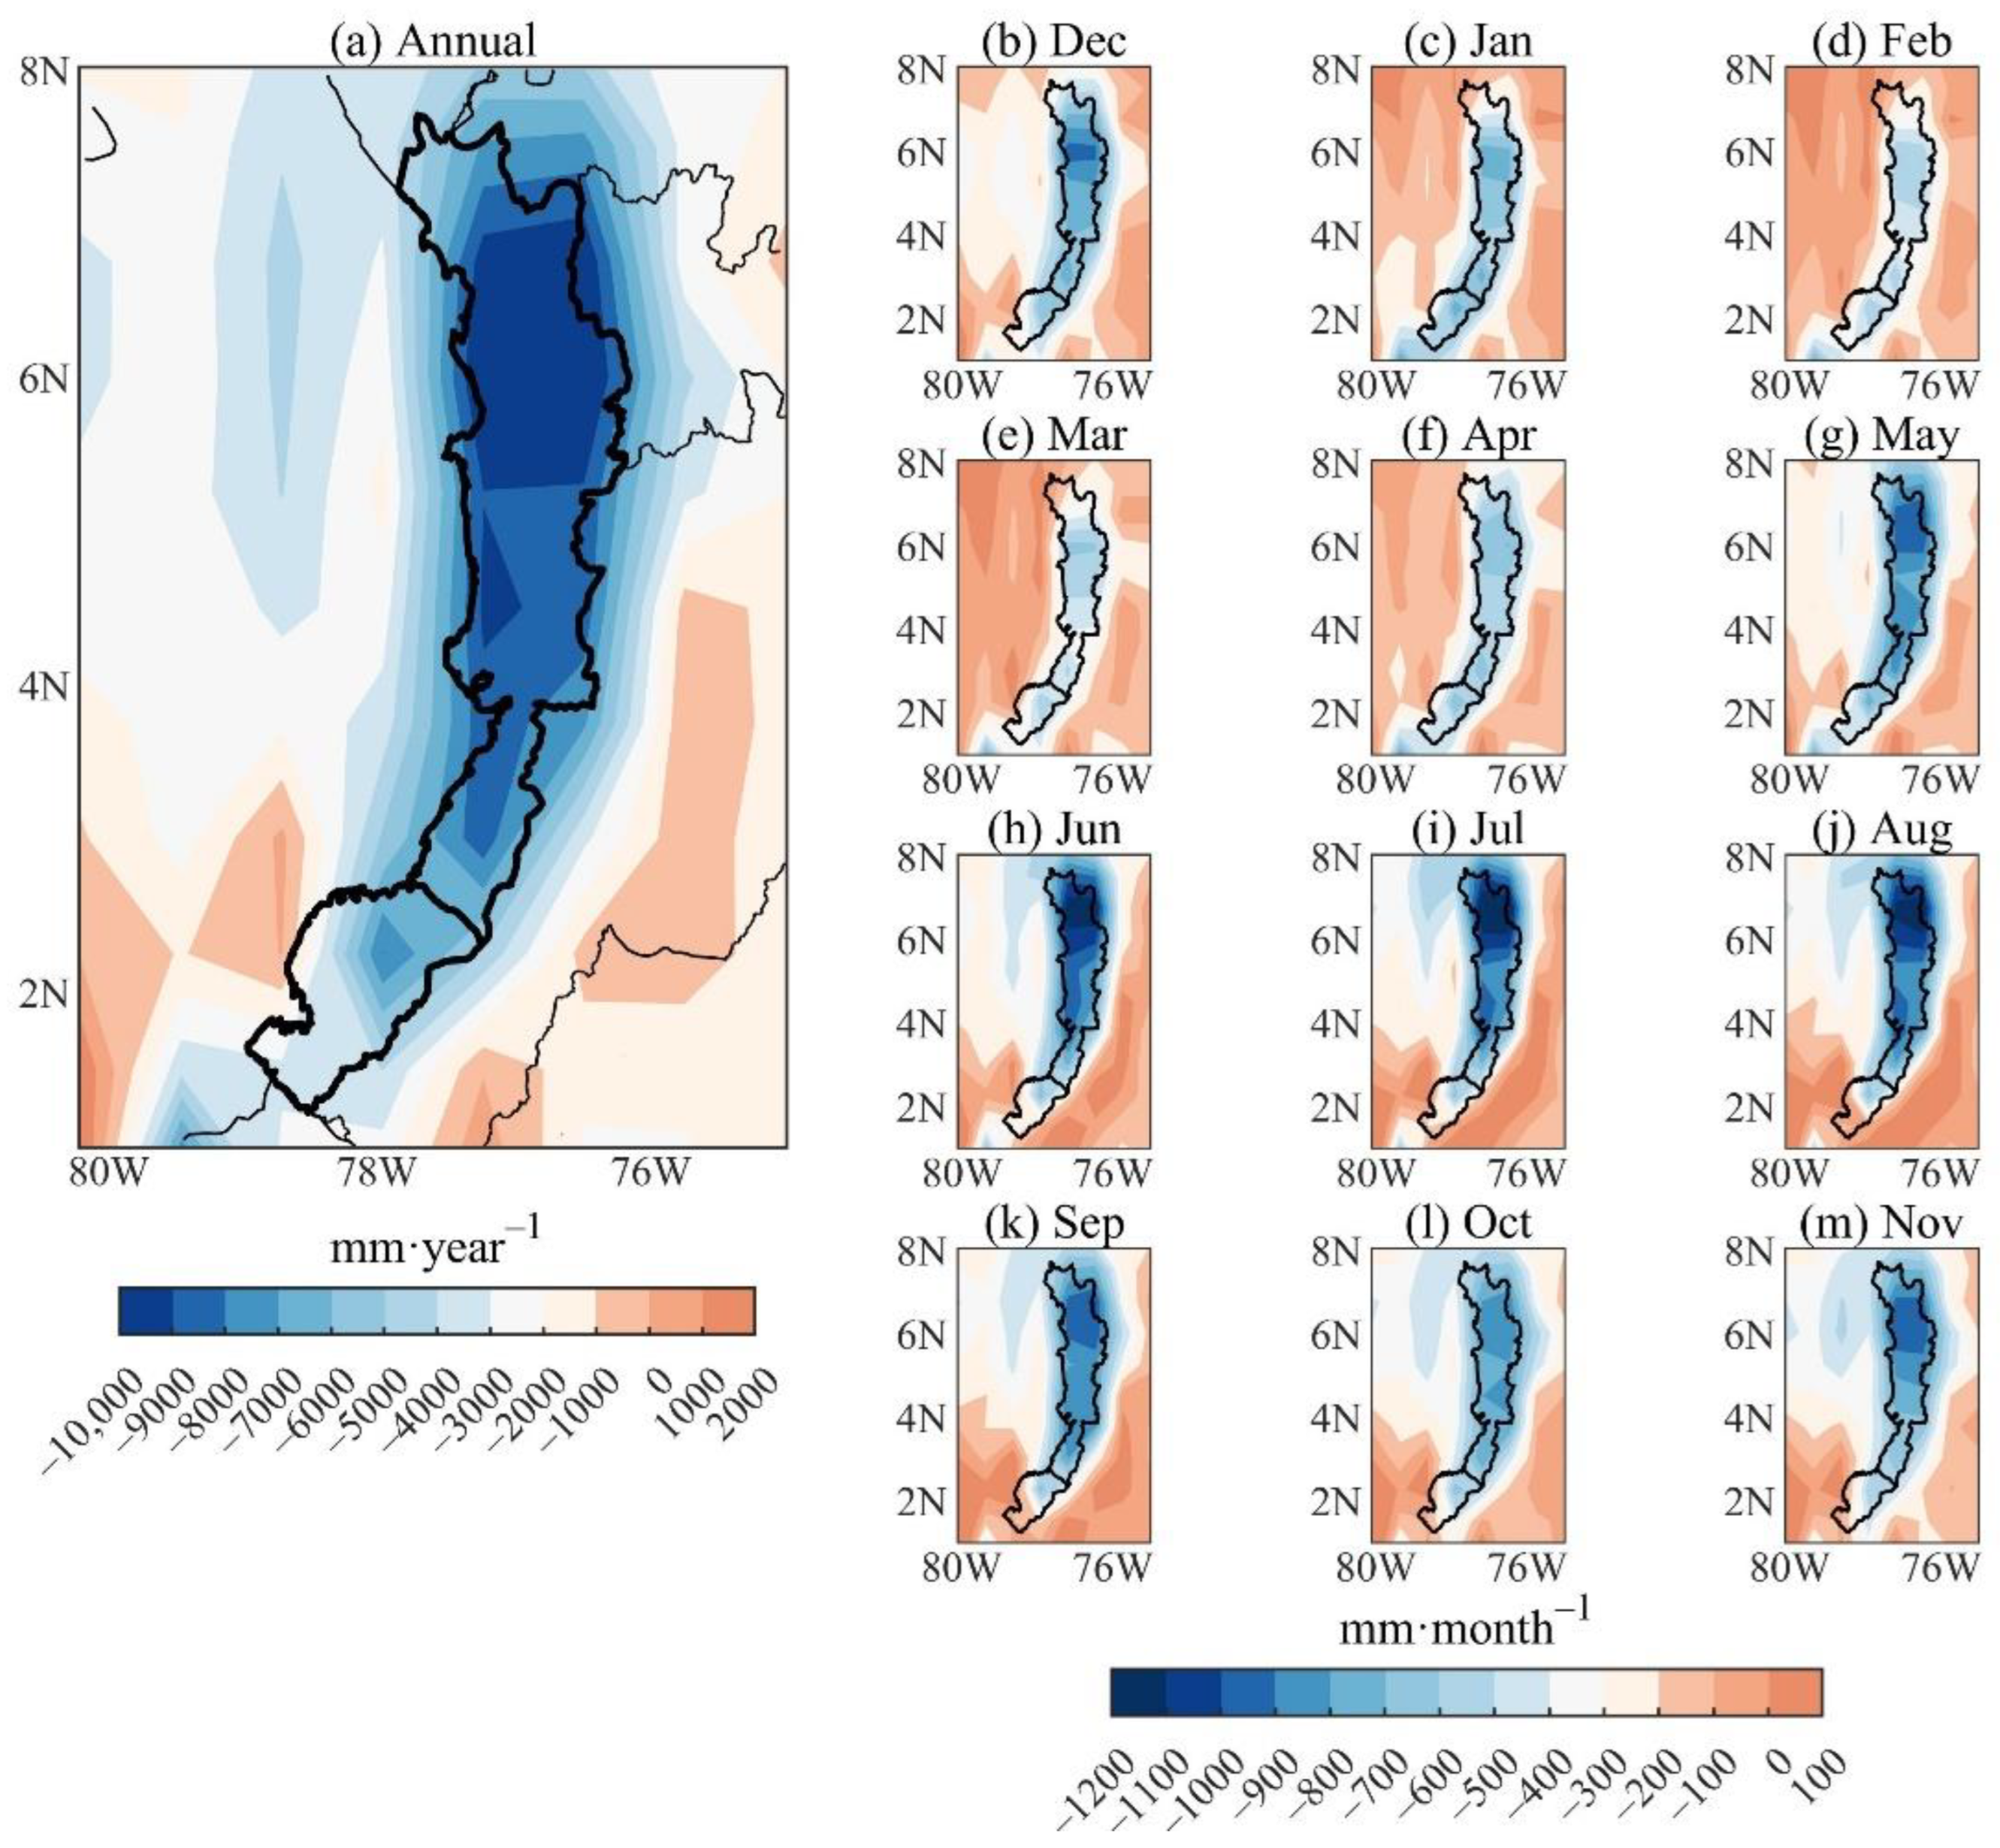
3.1. Water Balance

The spatio-temporal variability of water balance variables, including precipitation (P), evapotranspiration (E), moisture convergence (ConvQ), and the ratio between the precipitation and evapotranspiration (E/P) at annual and monthly scales for the NCP and P-M regions between 1980–2017 are presented below.
Figure 2a shows the total annual precipitation over the Colombian Pacific, with mean values between 10,000 and 12,000 mm·yr−1 in the northeast of the study area and precipitation close to 9000 mm·yr−1 at the border of the NCP and P-M regions, while in the south the annual precipitation oscillates between 3000 and 7000 mm. The mean annual precipitation in the NCP region was 9611 mm·yr−1, and in P-M, it was 5397 mm·yr−1, exceeding the country’s annual average of 3189 mm·yr−1 reported by Vallejo [11] and consistent with Cerón et al. [43]. They observed three cores of high precipitation over the Colombian Biogeographic Chocó region.
On a monthly scale, precipitation processes are conditioned by the latitudinal migration of the ITCZ, which, combined with the orographic effects created by the Serranía del Baudó and the foothills of the Western Cordillera, serve as a natural barrier for the air masses coming from the Pacific Ocean, discharging their moisture on the western slopes of the mountain ranges as orographic precipitation [15,43,44,45,46]. In the NCP region, there is no defined dry season, and the distribution during the year is relatively uniform (Figure 2b–m); however, from December to April, precipitation is lower (Figure 2b–f), when the ITCZ reaches its southernmost position, whereas, between May and November (Figure 2g–m) the highest precipitation is observed, the moment in which the ITCZ and in general the atmospheric systems record their greatest northward displacement [43,47,48,49]. Furthermore, in the P-M region, the least rainy season is observed from June to November (Figure 2h–m), when the country’s ITCZ is located in its most northerly position.
The analysis of evapotranspiration, which is another important component of the water balance, shows slightly pronounced differences in the study area (Figure 3a), reaching similar annual values in both regions, 921 mm·yr−1 for P-M and 855 mm·yr−1 for NCP; the lowest annual evapotranspiration (<650 mm·yr−1) occurs towards the center of the region, including the hydrographic zone of the San Juan River and the Pacific coast of the department of Valle del Cauca. The results are consistent with those reported by Vallejo [11], who indicates mean values between 600 and 800 mm·yr−1. According to Vallejo [11], the low evapotranspiration corresponds to the low amount of solar radiation that reaches the area due to the large-scale convective processes and a constant saturation of the atmosphere, coherent with the high convergence of annual moisture observed in the region (Figure 4a), in agreement with the studies of Velasco and Frischt [50], Zipser et al. [51], Zuluaga and Houze [52] and Jaramillo et al. [25]. On a monthly scale (Figure 3b–m), over the NCP region, evapotranspiration decreases while precipitation increases from May to November (<80 mm·month−1; Figure 2g–m and Figure 3g–m), and in coherence with the intensification of moisture convergence in the same period (Figure 4g–m), at the same time that higher evapotranspiration values occur in the P-M region (70–100 mm·month−1) when precipitation and moisture convergence decrease in this region (Figure 2g–m and Figure 4g–m). It should be noted that the magnitude of evapotranspiration concerning precipitation and moisture convergence does not show high variability in the two regions, with values below 90 mm·month−1 (standard deviation of 8 mm in NCP and 7 mm in P-M).
According to Cuartas and Poveda [2] and Marengo [53], a region acts as a source (sink) of moisture to the atmosphere when evaporation is greater (less) than precipitation. Additionally, Satyamurty et al. [12] and Do Nascimento et al. [54] explain that when there is moisture divergence (convergence) in a given region, it behaves as a source (sink) of moisture to neighboring regions. The relationship between evapotranspiration and precipitation (Figure 5), as an approximation to the regional moisture recycling ratio, shows that between January and April, the NCP has the greatest contribution of moisture to the atmosphere, between 11% and 17% of the total precipitation (Figure 5a), related to the reduction in the moisture convergence towards the region and with the increase in regional recycling (E/P); the rest of the year, the E/P ratio observed corresponds to 7% of the total precipitation, which indicates that the moisture recycled during most of the year comes from in other regions of the continent. In the case of the P-M region (Figure 5b), the region makes the most outstanding moisture to the atmosphere from June to November (dry season), when the E/P ratio varies between 18% and 23%, while moisture convergence decreases; this regional recycling represents almost 100% of the total, highlighting the regional processes of evapotranspiration over precipitation during the driest season, while during the period of higher precipitation, moisture arriving from other regions becomes more important. This is an indicator of the low rate of regional moisture recycling in the Colombian Pacific, which suggests that the region behaves as a moisture sink (E < P).

3.2. Continental Precipitation Recycling Ratio

Based on the results of the WAM-2 layer model implementation and ERA-I reanalysis data, results concerning the continental precipitation recycling ratio and the delimitation of the precipitationshed of the Colombian Pacific region are presented. Figure 6a shows the spatial distribution of the annual continental precipitation recycling ratio ( ρ c ), being on average higher in P-M with 26% per year and lower in NCP with 23%; these low values ratify the dominance of oceanic moisture sources over continental moisture recycling. Likewise, the annual recycling ratio increases from north to south and from west to east (coast to the mountain range). On a monthly scale (Figure 6b–m), the first half of the year shows a marked latitudinal orientation of the recycling ratio, with the highest values in the P-M region (south) and decreasing towards the NCP region (north), which may be related to the migration of the ITCZ from its southernmost position (December–February; DJF) to the north in the March–May (MAM) quarter. During the second half of the year, the recycling ratio shows a marked longitudinal orientation, with the highest values near the foothills of the western cordillera and the lowest near the Pacific Ocean, highlighting the role of the orographic barrier of the Colombian Andes and the moisture transport associated with the CJ during the second half of the year [23,42]. The CJ intensifies from June and reaches its highest velocity from September to November (SON) with values at its core (centered at 5° N along 80° W) of 5–8 m·s−1, in agreement with the maximum precipitation observed in the region during the second half of the year [16,24,55], and weakens from December to May with velocities between 2 and 3 m·s−1. The interaction of the CJ with the topography of the western Andes and the trade winds from the east favors deep convection producing large amounts of precipitation [15,22,23,56,57].
Figure 7a shows the monthly variability of the precipitation recycling ratio for the NCP and P-M regions. A unimodal recycling ratio pattern is observed in both areas, with the highest percentages between March and April, reaching 30% and 34% for NCP and P-M, respectively, and consistent with the spatial pattern shown in Figure 6e,f. Moreover, the lowest recycling season is between June and October, with the lowest percentage of NCP recycling occurring between September–October, with a value between 19% and 20%. In contrast, P-M has its lowest recycling ratio in September, corresponding to 21%. Figure 7b presents the climatological zonal wind values associated with the CJ, showing a greater wind intensity between September and November, and the interquartile distance (3rd quartile minus 1st quartile) is greater than during the rest of the year, while the winds associated with the CJ are less intense from January to April. In this sense, the season of higher (lower) continental precipitation recycling ratio is related to the weakening (strengthening) of the CJ in the first (second) half of the year, which decreases (increases) the contribution of moisture from the Pacific Ocean to the region, increasing (decreasing) the influence of the contribution of land-based sources in the study area. Furthermore, the higher continental precipitation recycling ratio in the P-M region can be related to its higher evapotranspiration concerning NCP and its southern location in the zone of greatest influence of the CJ, which allows the influence of other phenomena such as moisture feedback [7,8,49,58].

3.3. Precipitationshed

Figure 8 shows the monthly variability of the main sources that contribute to precipitation in the Colombian Pacific region and the changes in monthly precipitationshed. The contributions of these different sources change throughout the year, driven by seasonal changes in circulation. From December to April (Figure 8a–e), the largest contributions come from northern sources, mostly the tropical North Atlantic (TNA) and the Caribbean Sea from October to February, and from eastern Colombia and Venezuela; a period when the Orinoco Low-Level jet (OLLJ) exhibits its maximum wind speed, with values around 8–10 m·s−1 during DJF [59]. According to Builes-Jaramillo et al. [59], the OLLJ transports atmospheric moisture from TNA, linked to an area of moisture flux divergence located over northeastern South America. During June to August (Figure 8g–i), the ITCZ migration to its northernmost position results in an area of moisture flux convergence over TNA and the Caribbean Sea, which strengthens the CLLJ and inhibits the entrance of moisture from northerlies; thus, the southerly cross-equatorial flow from the Amazon River basin and the southeastern tropical Pacific predominates, as has been documented by Arias et al. [16] and Builes-Jaramillo et al. [59]. In September (Figure 8j), a southwesterly cross-equatorial circulation predominates, converging over the eastern Pacific and western Colombia, consistent with the spatial pattern associated with the easterly low-level jet, also known as the CJ [15,18,23,42]. The CJ transports moisture in the lower troposphere, interacting with the Colombian orography, inducing moisture convergence and convection in western Colombia, which leads to high precipitation over the Colombian Pacific [10,16], with greater intensity during the September to November quarter [23].
These seasonal changes in the region’s circulation drive a remarkable spatio-temporal variability of precipitationshed (Figure 8), which is significantly more dynamic than the relatively static limits of the surface watersheds since they depend on a defined threshold and the variability of climatic phenomena at multiple scales. Figure 8 highlights the large spatio-temporal variability of the 80% threshold of tracked moisture. The most significant contrast of moisture sources occurs during April and September (Figure 8e,j), representing the highest and lowest continental precipitation recycling ratio (Figure 7a). During April, the largest source region is located on the continent, reflecting the strong influence of northeastern Colombia and Venezuela and the transport of moisture from the Atlantic Ocean; while in September, the continental recycling ratio is reduced, and the moisture source region is located mainly in the Pacific Ocean, and the continental contribution decreases.
Even though the ocean is highlighted as the main source of moisture for the delimited atmospheric basin, these regions are located near the continent, which coincides with the results of Van Der Ent and Savenije [14], who found that ocean moisture source areas are more intense closer to the land surface. As shown in Figure 8, terrestrial sources of moisture encompass a larger area than oceanic sources; however, this is not directly related to the amount of moisture input [14]. This finding can also be related to those found for the precipitation recycling ratio, which indicates that in the NCP, this recycling comes from other regions, which are identified according to the precipitationshed as neighboring and in greater extension towards the northeastern part of the study region, covering almost all of the Andean region, the Orinoquia and the Colombian Caribbean.

4. Conclusions

The objective of this paper was to assess precipitation recycling and moisture sources in the Colombian Pacific region during the 1980–2017 period. We have used the atmospheric moisture tracking model WAM-2 layers to track moisture fluxes, as well as used the precipitationshed approach for the delimitation of the area contributing to terrestrial and oceanic moisture in the study area. We summarize our findings as follows: (1) The results show that on average, the Colombian Pacific region acts as a moisture sink (E < P), where convergence is mainly from the Pacific Ocean and represents the largest contribution to the precipitation production, in contrast to the regional (E/P) and neighboring areas. (2) Precipitationshed and its moisture sources present a significant monthly variability, with continental sources from eastern Colombia and Venezuela, and the tropical North Atlantic from December to April; the Pacific Ocean takes preponderance in these contributions during September–October, when the CJ intensifies and the continental contribution decreases; while the Amazon basin and the southeastern tropical Pacific make their greatest contributions during June and August. The importance of the “precipitationshed” approach in the analysis of the hydroclimatology of the Pacific region is the inclusion of the contribution of evaporation from remote land surfaces to the region’s precipitation, a factor that, to our knowledge, had not been considered before. This could become an input for analyzing the impacts that changes in land cover and land use may have on evapotranspiration ratios in this region. Furthermore, the alterations that climate change could represent, such as variations in moisture transport, could affect the interactions between the source regions and the continental Pacific.
Further research could address the analysis of moisture recycling by considering other atmospheric monitoring models, such as those developed under a Lagrangian approach, the comparison of both results will improve the accuracy of the results. In addition, the analysis should be carried out considering the impacts of climate change and climate variability events such as the ENSO phases, which affect the region’s climatic conditions and the country to a great extent. Research involving land cover and land use scenarios is recommended to explore the vulnerability of moisture recycling in the precipitationshed of the Pacific region.

Author Contributions

Conceptualization, A.M.E. and O.L.B.; methodology, A.M.E. and O.L.B.; software, A.M.E. and W.L.C.; validation, A.M.E., O.L.B. and W.L.C.; formal analysis, A.M.E., O.L.B. and W.L.C.; investigation, A.M.E., O.L.B. and W.L.C.; resources, D.E.-C. and J.T.; data curation, A.M.E. and W.L.C.; writing—original draft preparation, A.M.E. and W.L.C.; writing—review and editing, A.M.E., O.L.B., D.E.-C., J.T. and W.L.C.; visualization, A.M.E. and W.L.C.; supervision, O.L.B. and J.T.; funding acquisition, J.T. All authors have read and agreed to the published version of the manuscript.

Funding

This work was implemented as part of the Climate Action, Alliance of Bioversity International, and the International Center for Tropical Agriculture, Palmira, Colombia, under grants AEC D103D014OOP2.

Institutional Review Board Statement

Not applicable.

Informed Consent Statement

Not applicable.

Data Availability Statement

Not applicable.

Acknowledgments

The authors are grateful to the International Center for Tropical Agriculture (CIAT) and Universidad del Valle.

Conflicts of Interest

The authors declare no conflict of interest. The founding sponsors had no role in the design, analysis, and interpretation of data, the writing manuscript, or the decision to publish the results.

References

  1. Brubaker, K.L.; Entekhabi, D.; Eagleson, P.S. Estimation of continental precipitation recycling. J. Clim. 1993, 6, 1077–1089. [Google Scholar] [CrossRef] [Green Version]
  2. Cuartas, A.; Poveda, G. Balance atmosférico de humedad y estimación de la precipitación reciclada en colombia según el reanális ncep/ncar. Meteorol. Colomb. 2002, 5, 57–65. [Google Scholar]
  3. Sánchez, C. Estimation of the Precipitation Recycling Ratio; Delft University of Technology—National University of Singapore: Delft, The Netherlands, 2016. [Google Scholar]
  4. Eltahir, E.; Bras, R. Precipitation Recycling. Rev. Geophys. 1996, 34, 367–378. [Google Scholar] [CrossRef]
  5. Van Der Ent, R. A New View on the Hydrological Cycle over Continents. Ph.D. Thesis, Delft University of Technology, Delft, The Netherlands, 2014. [Google Scholar]
  6. Van Der Ent, R.J.; Savenije, H.H.G.; Schaefli, B.; Steele-Dunne, S.C. Origin and fate of atmospheric moisture over continents. Water Resour. Res. 2010, 46, 1–12. [Google Scholar] [CrossRef] [Green Version]
  7. Van Der Ent, R.J.; Wang-Erlandsson, L.; Keys, P.W.; Savenije, H.H.G. Contrasting roles of interception and transpiration in the hydrological cycle—Part 2: Moisture recycling. Earth Syst. Dyn. 2014, 5, 471–489. [Google Scholar] [CrossRef] [Green Version]
  8. Keys, P.W. The Precipitationshed: Concepts, Methods, and Applications; Stockholm University, Faculty of Science, Stockholm Resilience Centre: Stockholm, Sweden, 2016; ISBN 9789176494646. [Google Scholar]
  9. Hoyos, I. Transporte de Humedad Atmosférica en Colombia: Origen, Variabilidad y Acople con Fenómenos Climáticos Globales; Universidad de Antioquia: Medellín, Colombia, 2017. [Google Scholar]
  10. Hoyos, I.; Dominguez, F.; Cañón-Barriga, J.; Martínez, J.A.; Nieto, R.; Gimeno, L.; Dirmeyer, P.A. Moisture origin and transport processes in Colombia, northern South America. Clim. Dyn. 2018, 50, 971–990. [Google Scholar] [CrossRef]
  11. Vallejo, L. Dinámica Espacio-Temporal de Los Ríos Aéreos en el Norte de sur América y Posibles Efectos del Cambio Climático; Universidad Nacional de Colombia: Medellín, Colombia, 2014. [Google Scholar]
  12. Satyamurty, P.; da Costa, C.P.W.; Manzi, A.O. Moisture source for the Amazon Basin: A study of contrasting years. Theor. Appl. Climatol. 2013, 111, 195–209. [Google Scholar] [CrossRef]
  13. Eltahir, E.A.B.; Bras, R.L. Precipitation recycling in the Amazon basin. Q. J. R. Meteorol. Soc. 1994, 120, 861–880. [Google Scholar] [CrossRef]
  14. Van Der Ent, R.J.; Savenije, H.H.G. Oceanic sources of continental precipitation and the correlation with sea surface temperature. Water Resour. Res. 2013, 49, 3993–4004. [Google Scholar] [CrossRef]
  15. Poveda, G.; Jaramillo, L.; Vallejo, L.F. Seasonal precipitation patterns along pathways of South American low-level jets and aerial rivers. Water Resour. Res. 2014, 50, 98–118. [Google Scholar] [CrossRef]
  16. Arias, P.A.; Martínez, J.A.; Vieira, S.C. Moisture sources to the 2010–2012 anomalous wet season in northern South America. Clim. Dyn. 2015, 45, 2861–2884. [Google Scholar] [CrossRef]
  17. Morales, J.; Arias, P.; Martínez, J. Role of Caribbean low-level jet and Choco jet in the transport of moisture patterns towards Central America. Conf. Proc. Pap. 2017, 1, 4861. [Google Scholar]
  18. Gallego, D.; García-Herrera, R.; Gómez-Delgado, F.D.P.; Ordoñez-Perez, P.; Ribera, P. Tracking the moisture transport from the Pacific towards Central and northern South America since the late 19th century. Earth Syst. Dyn. 2019, 10, 319–331. [Google Scholar] [CrossRef] [Green Version]
  19. Drumond, A.; Nieto, R.; Gimeno, L.; Ambrizzi, T. A Lagrangian identification of major sources of moisture over Central Brazil and la Plata Basin. J. Geophys. Res. Atmos. 2008, 113, 1–9. [Google Scholar] [CrossRef] [Green Version]
  20. Martinez, A.J.; Dominguez, F. Sources of atmospheric moisture for the La Plata River Basin. J. Clim. 2014, 27, 6737–6753. [Google Scholar] [CrossRef]
  21. Gimeno, L.; Stohl, A.; Trigo, R.M.; Dominguez, F.; Yoshimura, K.; Yu, L.; Drumond, A.; Durán-quesada, A.M.; Nieto, R. Oceanic and terrestrial sources of continental precipitation. Rev. Geophys. 2012, 50, 1–41. [Google Scholar] [CrossRef]
  22. Poveda, G.; Mesa, O. La corriente de chorro superficial del oeste (“del Chocó”) y otras dos corrientes del chorro en Colombia: Climatología y variabilidad durante las fases ENSO. Rev. Académica Colomb. Ciencias Tierra 1999, 23, 517–528. [Google Scholar]
  23. Yepes, J.; Poveda, G.; Mejía, J.F.; Moreno, L.; Rueda, C. Choco-jex: A research experiment focused on the Chocó low-level jet over the far eastern Pacific and western Colombia. Bull. Am. Meteorol. Soc. 2019, 100, 779–796. [Google Scholar] [CrossRef]
  24. Cerón, W.L.; Kayano, M.T.; Andreoli, R.V.; Avila-Diaz, A.; de Souza, I.P.; Souza, R.A.F. Pacific and atlantic multidecadal variability relations with the choco and caribbean low-level jets during the 1900–2015 period. Atmosphere 2021, 12, 1120. [Google Scholar] [CrossRef]
  25. Jaramillo, L.; Poveda, G.; Mejía, J.F. Mesoscale convective systems and other precipitation features over the tropical Americas and surrounding seas as seen by TRMM. Int. J. Climatol. 2017, 37, 380–397. [Google Scholar] [CrossRef]
  26. Velásquez-Restrepo, M.; Poveda, G. Estimación del balance hídrico de la región Pacífica. Dyna 2019, 86, 297–306. [Google Scholar] [CrossRef]
  27. Cuartas, L. Balance Atmosférico de Humedad Para Colombia (Tesis de Maestría); Universidad Nacional de Colombia: Medellín, Columbia, 2001. [Google Scholar]
  28. Savenije, H.H.G. New definitions for moisture recycling and the relationship with land-use changes in the Sahel. J. Hydrol. 1995, 167, 57–78. [Google Scholar] [CrossRef]
  29. Budyko, M.I. Climate and life; Budyko, M.I., Miller, D.H., Eds.; Academic Press: London, UK; New York, NY, USA, 1974; ISBN 978-0-12-139450-9. Available online: https://www.sciencedirect.com/bookseries/international-geophysics/vol/18/suppl/C (accessed on 22 July 2022).
  30. Dominguez, F.; Liang, X.; Ting, M. Impact of Atmospheric Moisture Storage on Precipitation Recycling. J. Clim. 2006, 19, 1513–1530. [Google Scholar] [CrossRef]
  31. Dirmeyer, P.; Brubaker, K. Characterization of the Global Hydrologic Cycle from a Back-Trajectory Analysis of Atmospheric Water Vapor. J. Hydrometeorol. 2007, 8, 20–37. [Google Scholar] [CrossRef]
  32. Burde, G.; Zangvil, A. The estimation of regional precipitation recycling. Part I: Review of recycling models. J. Clim. 2001, 14, 2509–2527. [Google Scholar] [CrossRef]
  33. Knoche, H.R.; Kunstmann, H. Tracking atmospheric water pathways by direct evaporation tagging: A case study for West Africa. J. Geophys. Res. Atmos. 2013, 118, 12345–12358. [Google Scholar] [CrossRef]
  34. Van Der Ent, R.J.; Tuinenburg, O.A.; Knoche, H.R.; Kunstmann, H.; Savenije, H.H.G. Should we use a simple or complex model for moisture recycling and atmospheric moisture tracking? Hydrol. Earth Syst. Sci. 2013, 17, 4869–4884. [Google Scholar] [CrossRef] [Green Version]
  35. Dee, D.P.; Uppala, S.M.; Simmons, A.J.; Berrisford, P.; Poli, P.; Kobayashi, S.; Andrae, U.; Balmaseda, M.A.; Balsamo, G.; Bauer, P.; et al. The ERA-Interim reanalysis: Configuration and performance of the data assimilation system. Q. J. R. Meteorol. Soc. 2011, 137, 553–597. [Google Scholar] [CrossRef]
  36. European Centre for Medium-Range Weather Forecasts Interim Reanalysis (ECMWF/ERA-I) Atmospheric Data. Available online: http://apps.ecmwf.int/datasets/data/interim-full-moda/levtype=pl/ (accessed on 6 June 2019).
  37. Hoyos, I.; Baquero-Bernal, A.; Jacob, D.; Rodríguez, B. Variability of extreme events in the Colombian Pacific and Caribbean catchment basins. Clim. Dyn. 2013, 40, 1985–2003. [Google Scholar] [CrossRef]
  38. Cerón, W.L.; Andreoli, R.V.; Kayano, M.T.; Souza, R.A.F.; Jones, C.; Carvalho, L.M.V. The Influence of the Atlantic Multidecadal Oscillation on the Choco Low-Level Jet and Precipitation in Colombia. Atmosphere 2020, 11, 174. [Google Scholar] [CrossRef] [Green Version]
  39. Cerón, W.L.; Kayano, M.T.; Andreoli, R.V.; Avila, A.; Canchala, T.; Francés, F.; Ayes Rivera, I.; Alfonso-Morales, W.; Ferreira de Souza, R.A.; Carvajal-Escobar, Y. Streamflow Intensification Driven by the Atlantic Multidecadal Oscillation (AMO) in the Atrato River Basin, Northwestern Colombia. Water 2020, 12, 216. [Google Scholar] [CrossRef] [Green Version]
  40. Institute of Hydrology, Meteorology and Environmental Studies (IDEAM). Atlas climatológico de Colombia; IDEAM: Bogotá, Colombia, 2017.
  41. Keys, P.; Van Der Ent, R.; Gordon, L.; Hoff, H.; Nikoli, R.; Savenije, H. Analyzing precipitationsheds to understand the vulnerability of rainfall dependent regions. Biogeosciences 2012, 9, 733–746. [Google Scholar] [CrossRef] [Green Version]
  42. Cerón, W.L.; Andreoli, R.V.; Kayano, M.T.; Avila-Diaz, A. Role of the eastern Pacific-Caribbean Sea SST gradient in the Choco low-level jet variations from 1900–2015. Clim. Res. 2021, 83, 61–74. [Google Scholar] [CrossRef]
  43. Cerón, W.L.; Andreoli, R.V.; Kayano, M.T.; Ferreria, D.S.R.; Canchala, N.T.; Carvajal-Escobar, Y. Comparison of spatial interpolation methods for annual and seasonal rainfall in two hotspots of biodiversity in South America. An. Acad. Bras. Ciencias 2021, 93, 1–22. [Google Scholar] [CrossRef] [PubMed]
  44. Guzmán, D.; Ruíz, J.F.; Cadena, M. Regionalización de Colombia Según la Estacionalidad de la Precipitación Media Mensual; A Través Análisis de Componentes Principales (ACP): Bogotá, Colombia, 2014. [Google Scholar]
  45. Estupiñan, A.R.C. Estudio de la Variabilidad Espacio Temporal de la Precipitación en Colombia. Ph.D. Thesis, Universidad Nacional de Colombia, Medellín, Colombia, 2016. Available online: http://bdigital.unal.edu.co/54014/1/1110490004.2016.pdf (accessed on 5 October 2019).
  46. Cerón, W.L.; Andreoli, R.V.; Kayano, M.T.; Canchala, T.; Ocampo-marulanda, C.; Avila-diaz, A.; Antunes, J. Trend Pattern of Heavy and Intense Rainfall Events in Colombia from 1981–2018: A Trend-EOF Approach. Atmosphere 2022, 13, 156. [Google Scholar] [CrossRef]
  47. Canchala, T.; Cerón, W.L.; Francés, F.; Carvajal-Escobar, Y.; Andreoli, R.V.; Kayano, M.T.; Alfonso-Morales, W.; Caicedo-Bravo, E.; de Souza, R.A.F. Streamflow variability in colombian pacific basins and their teleconnections with climate indices. Water 2020, 12, 526. [Google Scholar] [CrossRef] [Green Version]
  48. Canchala, T.; Alfonso-Morales, W.; Cerón, W.L.; Carvajal-Escobar, Y.; Caicedo-Bravo, E. Teleconnections between monthly rainfall variability and large-scale climate indices in Southwestern Colombia. Water 2020, 12, 1863. [Google Scholar] [CrossRef]
  49. Poveda, G. La hidroclimatología de Colombia: Una síntesis desde la escala inter-decadal hasta la escala diurna. Rev. Acad. Colomb. Cienc. 2004, 28, 201–222. [Google Scholar]
  50. Velasco, I.; Fritsch, J.M. Mesoscale convective complexes in the Americas. J. Geophys. Res. Atmos. 1987, 92, 9591–9613. [Google Scholar] [CrossRef]
  51. Zipser, E.J.; Cecil, D.J.; Liu, C.; Nesbitt, S.W.; Yorty, D.P. Where are the most: Intense thunderstorms on Earth? Bull. Am. Meteorol. Soc. 2006, 87, 1057–1071. [Google Scholar] [CrossRef] [Green Version]
  52. Zuluaga, M.D.; Houze, R.A. Extreme convection of the near-equatorial Americas, Africa, and adjoining oceans as seen by TRMM. Mon. Weather Rev. 2015, 143, 298–316. [Google Scholar] [CrossRef] [Green Version]
  53. Marengo, J.A. Characteristics and spatio-temporal variability of the Amazon river basin water budget. Clim. Dyn. 2005, 24, 11–22. [Google Scholar] [CrossRef]
  54. Do Nascimento, M.G.; Herdies, D.L.; De Souza, D.O. The south American water balance: The influence of low-level jets. J. Clim. 2016, 29, 1429–1449. [Google Scholar] [CrossRef]
  55. Poveda, G.; Álvarez, D.M.; Rueda, Ó.A. Hydro-climatic variability over the Andes of Colombia associated with ENSO: A review of climatic processes and their impact on one of the Earth’s most important biodiversity hotspots. Clim. Dyn. 2011, 36, 2233–2249. [Google Scholar] [CrossRef]
  56. Sakamoto, M.S.; Ambrizzi, T.; Poveda, G. Moisture Sources and Life Cycle of Convective Systems over Western Colombia. Adv. Meteorol. 2011, 2011, 1–11. [Google Scholar] [CrossRef]
  57. Durán-Quesada, A.M.; Gimeno, L.; Amador, J. Role of moisture transport for Central American precipitation. Earth Syst. Dyn. 2017, 8, 147–161. [Google Scholar] [CrossRef] [Green Version]
  58. Bosilovich, M.G. On the vertical distribution of local and remote sources of water for precipitation. Meteorol. Atmos. Phys. 2002, 80, 31–41. [Google Scholar] [CrossRef] [Green Version]
  59. Builes-Jaramillo, A.; Yepes, J.; Salas, H.D. The Orinoco Low-Level Jet and Its Association with the Hydroclimatology of Northern South America. J. Hydrometeorol. 2022, 23, 209–223. [Google Scholar] [CrossRef]
Figure 1. (a) Study area and (b) precipitation regions in Colombia provided by IDEAM [40] file number 20199050007812 from 11 February 2019.
Atmosphere 13 01202 g001
Figure 2. Annual and monthly means precipitation in the Colombian Pacific regions for the 1980–2017 period. (a) Annual; (b) Dec; (c) Jan; (d) Feb; (e) Mar; (f) Apr; (g) May; (h) Jun; (i) Jul; (j) Aug; (k) Sep; (l) Oct; (m) Nov.
Atmosphere 13 01202 g002
Figure 3. Annual and monthly means evapotranspiration in the Colombian Pacific regions for the 1980–2017 period. (a) Annual; (b) Dec; (c) Jan; (d) Feb; (e) Mar; (f) Apr; (g) May; (h) Jun; (i) Jul; (j) Aug; (k) Sep; (l) Oct; (m) Nov.
Atmosphere 13 01202 g003
Figure 4. Annual and monthly means moisture divergence in the Colombian Pacific regions for the 1980–2017 period. Negative values reflect rising motions, and positive values reflect sinking motions. (a) Annual; (b) Dec; (c) Jan; (d) Feb; (e) Mar; (f) Apr; (g) May; (h) Jun; (i) Jul; (j) Aug; (k) Sep; (l) Oct; (m) Nov.
Atmosphere 13 01202 g004
Figure 5. Water balance variables (mm month−1) over the (a) North and Central Pacific (NCP) and (b) Patia-Maria (P-M) regions from 1980 to 2017. The left y-axis is orange for evapotranspiration (E), black for precipitation (P) and moisture convergence (ConvQ), and the right y-axis for E/P ratio (blue).
Atmosphere 13 01202 g005
Figure 6. Annual and monthly mean continental precipitation recycling ratio ( ρ c ). (a) Annual; (b) Dec; (c) Jan; (d) Feb; (e) Mar; (f) Apr; (g) May; (h) Jun; (i) Jul; (j) Aug; (k) Sep; (l) Oct; (m) Nov.
Atmosphere 13 01202 g006
Figure 7. (a) Continental precipitation recycling ratio ( ρ c ) for the North and Central Pacific (NCP) and Patía-Mira (P-M) regions. (b) Boxplots of the Choco jet index (m·s–1). In (b) each box represents the range between the first and third quartiles, divided by the median of the sample, with maximum and minimum values (whiskers) shown by vertical stems.
Atmosphere 13 01202 g007
Figure 8. Seasonal variability of precipitationshed in the Colombian Pacific region and vertically integrated moisture fluxes (vectors) from 1980 to 2017 for (a) December, (b) January, (c) February, (d) March, (e) April, (f) May, (g) June, (h) July, (i) August, (j) September, (k) October, and (l) November. The white line represents the threshold whereby the grids with the higher values account for 80% of the tracked moisture. The grids compose the Primary Source region, also known as the precipitationshed. The color bar represents the contribution ratio of the moisture sources to the precipitation. The arrows represent the 1000–175 hPa vertically integrated moisture flux (Kg·m−1·s−1) over the study area.
Atmosphere 13 01202 g008
Table 1. Variables are included in the WAM-2 layer, with the units described in ERA-I.
Surface Variables
SymbolVariableUnit
P Precipitationm·day–1
E Evaporationm·day–1
TCW Total column waterkg·m–2
TCWV Total column of water vaporkg·m–2
EWVF Vertical integral of eastward water vapor fluxkg·m−1·s−1
NWVF Vertical integral of northward water vapor fluxkg·m−1·s−1
ECLWF Vertical integral of eastward cloud liquid water flux kg·m−1·s−1
NCLWF Vertical integral of northward cloud liquid water flux kg·m−1·s−1
ECFWF Vertical integral of eastward cloud solid water flux kg·m−1·s−1
NCFWF Vertical integral of northward cloud solid water flux kg·m−1·s−1
p s Surface pressurePa
Pressure levels variables
q Specific humiditykg·kg–1
u Zonal component of windm·s–1
v Meridional component of windm·s–1
Publisher’s Note: MDPI stays neutral with regard to jurisdictional claims in published maps and institutional affiliations.

