Article

Atmospheric Factors Affecting Global Solar and Photosynthetically Active Radiation Relationship in a Mediterranean Forest Site

by
Nikolaos D. Proutsos
1,*,
Aristotle Liakatas
2,3,
Stavros G. Alexandris
3,
Ioannis X. Tsiros
3,
Dimitris Tigkas
4 and
George Halivopoulos
5
1
Institute of Mediterranean Forest Ecosystems-Hellenic Agricultural Organization “DEMETER”, Terma Alkmanos, 11528 Athens, Greece
2
Hellenic Agricultural Academy, 75 Iera Odos, 11855 Athens, Greece
3
Agricultural University of Athens, 75 Iera Odos, 11855 Athens, Greece
4
Centre for the Assessment of Natural Hazards and Proactive Planning & Laboratory of Reclamation Works and Water Resources Management, School of Rural and Surveying Engineering, National Technical University of Athens, 9 Iroon Polytechneiou Str., 15780 Zographos, Greece
5
Forest Research Institute-Hellenic Agricultural Organization “DEMETER”, Vassilika, 57006 Thessaloniki, Greece
*
Author to whom correspondence should be addressed.
Atmosphere 2022, 13(8), 1207; https://doi.org/10.3390/atmos13081207
Submission received: 15 June 2022 / Revised: 16 July 2022 / Accepted: 27 July 2022 / Published: 31 July 2022
(This article belongs to the Special Issue Agrometeorology)

Abstract

:
Light availability and its composition in components affecting plant growth as photosynthetically active radiation (PAR), are of critical importance in agricultural and environmental research. In this work, radiation data for the period 2009–2014 in a forest site in Greece were analyzed to identify the effect of meteorological variables on the formation of the photosynthetically active to global solar radiation ratio. The temporal changes of the ratio are also discussed. Results showed that the ratio values are higher in summer (0.462) and lower in autumn (0.432), resulting in an annual average of 0.446. In addition, for the investigated site, which was characterized by relatively high water content in the atmosphere, the atmospheric water content and clearness were found to be the most influential factors in the composition of the global solar radiation in the wavelengths of PAR. On the contrary, temperature and related meteorological attributes (including relative humidity, vapor pressure deficit and saturation vapor pressure) were found to have minor effect.

1. Introduction

Radiation magnitude, optical characteristics, and composition, especially at the photosynthetically active waveband, are factors of critical importance in environmental, ecological, and atmospheric research [1,2,3,4]. Their spatial and temporal variations determine the energy availability for photosynthesis and the local patterns of vegetation, also affecting the vegetation dynamics, species composition, and canopy architecture in forest ecosystems.
The specific site characteristics can affect the richness of the incident solar radiation at specific wavelengths imposing the need for continuous monitoring of the radiation fluxes and the establishment of radiometric networks with highly equipped units. This is partly implemented by installing radiometers to existing meteorological stations but in only a few cases or for only one radiation component (usually the global solar radiation, Rs). Measurements of photosynthetically active radiation (PAR) are even today rare, and this imposes a need for modelling, aimed at accurately estimating PAR fluxes, which, in turn, in many cases is difficult due to the different factors prevailing in each area that may significantly alter the solar radiation composition. The few studies about PAR are attributed by many authors to the scarcity of PAR measurements and the absence of relevant radiometric networks worldwide [2,3,5,6,7,8].
The ratio of PAR/Rs, indicating the proportion of the total incoming shortwave radiation that is effective for photosynthesis, is a factor of major importance in ecological and agricultural studies and in recent years has been considered a focus issue in current research. There are many studies around the world for the investigation of the ratio temporal and spatial variation. Many of them focus on identifying the most influential factors forming the ratio values or trying to model them, considering other commonly measured meteorological parameters, including air temperature, humidity, or other radiation-related attributes.
Many researchers propose the estimation of PAR from Rs and commonly measured meteorological data such as dewpoint temperature, clearness index, and solar zenith angle [6,9,10,11,12,13]. Noriega Gardea et al. [14] reviewed empirical models that were developed from several researchers during the last 25 years and also identified dewpoint temperature, atmospheric clearness, and solar elevation angle as the most influential factors determining Rs radiation composition in the wavelengths of PAR. In Brazil, Custódio et al. [15] evaluated the relationship between PAR and Rs, and found that the PAR/Rs ratio varies with local weather conditions, indicating the atmospheric clearness as the most influential factor for its formation. In Spain, Ferrera Cobos et al. [5] analyzed the spatial and temporal changes o PAR/Rs using data from three stations in different climate types, and found that the ratio is site-dependent and also influenced by atmospheric clearness. Foyo-Moreno et al. [11] proposed a regression model for the estimation of hourly PAR from Rs under all sky conditions, using data for the period 2014–2015 obtained by an urban site in Granada, Spain. The authors indicated solar zenith angle and clearness index as most important parameters for the estimation of PAR from Rs. In Lhasa (Tibetan Plateau), Peng et al. [16] analyzed PAR and Rs fluxes from 2006 to 2012 and developed an all-weather model based on the cosine of solar zenith angle and the clearness index that produced acceptable estimations for PAR. Akitsu et al. 2015 found that PAR/Rs is dependent on both atmospheric vapor pressure and the clearness index, with the larger dependence on the vapor pressure, suggesting also that the solar zenith angle has zero impact on the formation of the ratio. Based on this work, Akitsu et al. [17] developed two new empirical models for the PAR/Rs estimation, using in situ climatic data, with input parameters either the vapor pressure or vapor pressure and the clearness index, that were identified as most influential factors for the determination of the radiation ratio. Wang et al. [18,19,20,21] suggested solar zenith angle and clearness index, as most critical parameters for the estimation of PAR over Rs. Lozano et al. [22] detected seasonality for the ratio values with higher values in summer, attributed to the higher water content of the atmosphere during the summer period.
In Greece, Zempila et al. [23] constructed generic models for the PAR calculation from Rs, by developing linear regression, multiple linear regression, and nonlinear neural networks, using solar zenith angle, aerosol optical depth, and water vapor as input parameters. Proutsos et al. [2], also in Greece, studied the factors affecting the hourly PAR/Rs ratio in a high altitude forest site and found an annual average ratio value of 0.438, which was presenting small seasonal variability. They identified that the radiation ratio is highly affected by sky clearness, presenting also a positive relationship with relative humidity, optical thickness, and relative optical air mass and a negative one with saturation vapor pressure, vapor pressure deficit and to a lesser degree with air temperature. In addition, Proutsos et al. [3] studied the changes of the PAR/Rs ratio under various atmospheric conditions above a Mediterranean oak forest in Greece and found an annual PAR/Rs value of 0.454 varying seasonally from 0.443 to 0.478 in spring and autumn respectively. In their study, they detected a positive relationship of the ratio with dewpoint temperature and a negative one with solar elevation angle and Rs, however, atmospheric clearness index (negative relationship) and actual water vapor pressure (positive relationship) were the key factors determining the ratio.
The dependence of the PAR/Rs ratio by the solar angle was found to be either positive [24,25], or negative [6,12] in many studies, but there are also researchers, supporting that the solar angle has no effect [17,26]. Similarly, although most studies identify the clearness index as the most influential factor, determining the radiation ratio, there are also studies indicating that it has no effect. More specifically, Lozano et al. [22] analyzed an 11-year database of measured PAR attributes recorded in a Mediterranean site, for both clear-sky and all-sky scenarios and found no dependence on the clearness index, stating however a great dispersion of the PAR/Rs values at the lower clearness index values.
On the other hand, most research studies, recognize that the radiation ratio is site or seasonally dependent [9,27,28], imposing a need to further study the changes of the ratio to more sites around the world with different environments and climates.
The purpose of the present work is to investigate the changes of the PAR/Rs ratio in a humid forest site in Greece. It should be noted here that very few studies about the radiation ratio have been conducted in agricultural areas and even fewer in forest environments. The humid conditions generally persisting in the site can expand the knowledge on the relations between the meteorological attributes and PAR/Rs, since atmospheric water content may affect the incoming Rs and PAR flux densities. This work follows two previous works by Proutsos et al. [2,3] who investigated the changes of PAR/Rs in forested Greek sites at altitudes of 840 m and 1896 m. The work is focused on the temporal (diurnal and seasonal) variability of the radiation ratio and the influence of atmospheric characteristics and aims to detect the most influential atmospheric factors that determine the radiation ratio, and to extend knowledge about the efficiency of solar radiation for photosynthesis under the variable Mediterranean forest climate conditions.

2. Materials and Methods

Data were obtained by the automatic meteorological station of Arnea in Chalkidiki (Northern Greece), installed in an open meadow of a deciduous forest (40°29′35′′ N, 23°36′09′′ E) at an altitude of 520 m a.s.l. (Figure 1).
Arnea forest’s dominant species are Querqus frainetto and Fagus sylvatica. The wider area is characterized as of high ecological importance and is protected by the national and European legislation as a NATURA 2000 site. Two special protection areas (SPA): GR1220009 “Limnes Koroneias-Volvis, stena Rentinas kai evryteri periochi” and GR1270012 “Oros Cholomontas” with the lakes of Koroneia and Volvi, hosting many feeding, nesting, breeding, wintering, and refuge habitats for bird species [29,30]. “Oros Cholomontas” is, in addition, protected as a site of community importance (SCI GR1270001), hosting a variety of habitats including an oak forest that dominates the landscape (habitat types 91M0 “Pannonian-Balkanic turkey oak–sessile oak forests” and 9280 “Quercus frainetto woods”) and to a lesser extent “Castanea sativa woods” (9260), “Platanus orientalis and Liquidambar orientalis woods (Platanion orientalis)” (92C0) and “Arborescent matorral with Juniperus spp.” (5210) [31].
The climate of the region is humid [32,33] with an aridity index of 0.94 according to UNEP’s [34] aridity classification system based on Thornthwaite’s [35] water balance approach. For the examined period (2009–2014), the annual patterns of the meteorological parameters were as expected and follow the typical patterns of the Mediterranean climate (Figure 2). The air temperature (12.7 °C annual average, with standard deviation SD = 8.4) presents seasonal variation with warmer conditions in summer (21.9 °C, SD = 5.2) and cooler (4.4 °C, SD = 5.0) in winter. Precipitation is about 682 mm on an annual basis and its total amount is mainly distributed in autumn (38%) and winter (28%) and to a lesser degree in spring (20%) and summer (14%). Relative humidity is, in general, high (78% annual average, varying from 69% in summer to 84% in winter), and in association with air temperature determine the annual patterns of the vapor pressure attributes and related parameters (Figure 2). Radiation components follow the temperature distribution with high values in summer (235 and 101 W m−2 for Rs and PAR, 24-h seasonal averages) and low in winter (73 and 23 W m−2, respectively).
The weather station of the Forest Research Institute of the Hellenic Agricultural Organization “DEMETER”, has been equipped since 2009 with sensors to monitor radiation components, which are recognized to play a significant role for the development of the natural forest. Rs and PAR were recorded with a 10 min timestep, and average hourly values were extracted. The radiation measurements were recorded by an SKS 1110 (SKYE Instruments, UK) pyranometer for Rs and by an SKP 215 (SKYE Instruments, UK) quantum sensor for PAR, both with typical absolute calibration error of less than 3% (max. 5%) and 3% to maximum 5% cosine error, placed at a height of 3 m. Air temperature and relative humidity were measured by a HD9009TR (DELTAOHM, Italy) thermohygrometer (accuracy ±0.15 °C for temperature and ±1.5% for RH less than 90% or ±2.0% for greater RH values), 2.5 m above the soil surface. The station equipment was periodically (annually) checked for its operation. For the calibration of the radiometers 2–3-day campaigns were performed every summer (mainly in July) and the sensors were horizontally adjusted, whereas their data quality was checked against new not previously used, high precision sensors (pyranometer A-class LP PYRA 02. DELTAOHM, Italy, for Rs and quantum sensor SKP 210, SKYE Instruments, UK, for PAR), that were kindly provided by the supplier (Scientact S.A.) every year. These sensors were installed for at least two days next to the station’s radiometers and their data were correlated to detect differences.
The radiation and all other meteorological data used in this study were thoroughly checked for inconsistencies following the procedure described in detail by Proutsos et al. [2]. Measured and estimated meteorological parameters were employed, including solar (atmospheric clearness Kt, solar angle h, optical thickness δ(ε), relative optical air mass m), temperature (air temperature T and dewpoint Td) and vapor (actual ea and saturation es vapor pressure, vapor pressure deficit VPD, relative humidity, RH) attributes in hourly timesteps. More details on the estimation of the examined factors may be found in Proutsos et al. [2].
More specifically, the solar inclination angle h and atmospheric clearness Kt [36] expressed as the ratio of Rs to extraterrestrial radiation Ra on a horizontal surface [9,28,37,38], were used in the present study and Ra was calculated according to Duffie and Beckman [39]. Kt is considered as an adequate index to assess sky cloudiness [40,41] and, in the present work, was used to classify sky conditions as overcast for Kt ≤ 0.3, partly cloudy to clear for 0.3 < Kt < 0.7 and clear for Kt ≥ 0.7,as proposed by Iqbal [36] and Yu et al. [21], and also used in previous works of the authors [2,3]. The optical thickness was estimated by the equation δ(ε) = −ln(Ra/Rs)), whereas the equation proposed by Kasten and Young [42] was employed to estimate the relative optical air mass, m.
The vapor pressure attributes es and ea and their difference, which expresses the atmospheric vapor pressure deficit (VPD), were also used and estimated by the Tetens’ [43] equation. Based on the values of ea, the dewpoint temperature T d = 116.9 + 237.3 · l n ( e a ) 16.78 l n ( e a ) was also employed in the analysis. The conversion factor 4.57 mol MJ−1, proposed by McCree [44], was applied to convert PAR photo flux densities (μmol m−2 s−1) to energy values (W m−2).
The data were processed in order to remove inappropriate values. Specifically, the following radiation measurements were excluded:
  • Measurements recorded at solar elevation angles less than 12°, due to cosine response inconsistencies of the sensors, as suggested by Ge et al. [6].
  • Energy fluxes of PAR (in W m−2) greater than Rs.
  • Rs flux densities greater than Ra.
  • Rs values less than 5 W m−2.
  • Measurements for PAR/Rs greater than 2.8 and less than 1.3 mol MJ−1 [18,19,20,40,45,46].
  • Measurements recorded at air temperatures below zero.
Of a total 32,191 hourly PAR/Rs values for the time period from 15 December 2009 to 31 December 2014, 10,522 were appropriate for further analysis and were seasonally distributed as follows: 16% in winter, 23% in spring, 37% in summer, and 24% in autumn. The data distribution in different categories of cloudiness and solar inclination angle is presented in Figure 3. The majority (a percentage of 62%) of the PAR/Rs hourly values range between 1.9 and 2.2 mol MJ−1, whereas 25%, 44%, and 31% were recorded under clear (Kt ≥ 0.7), intermediate (0.3 < Kt < 0.7), and overcast (Kt ≤ 0.3) sky conditions, respectively (Figure 3a). The data distribution in classes based on the solar inclination angle (Figure 3b), shows that most of them (43%) were recorded at sun angles between 20° and 40°, whereas the respective percentages for lower (12°–20°) or higher (40°–60° and >60°) are much lower (16%, 29% and 12%, respectively).
For the rest of the analyzed parameters that were produced by the filtered dataset used in this study, the general descriptive statistical attributes are presented in Table 1.

3. Results and Discussion

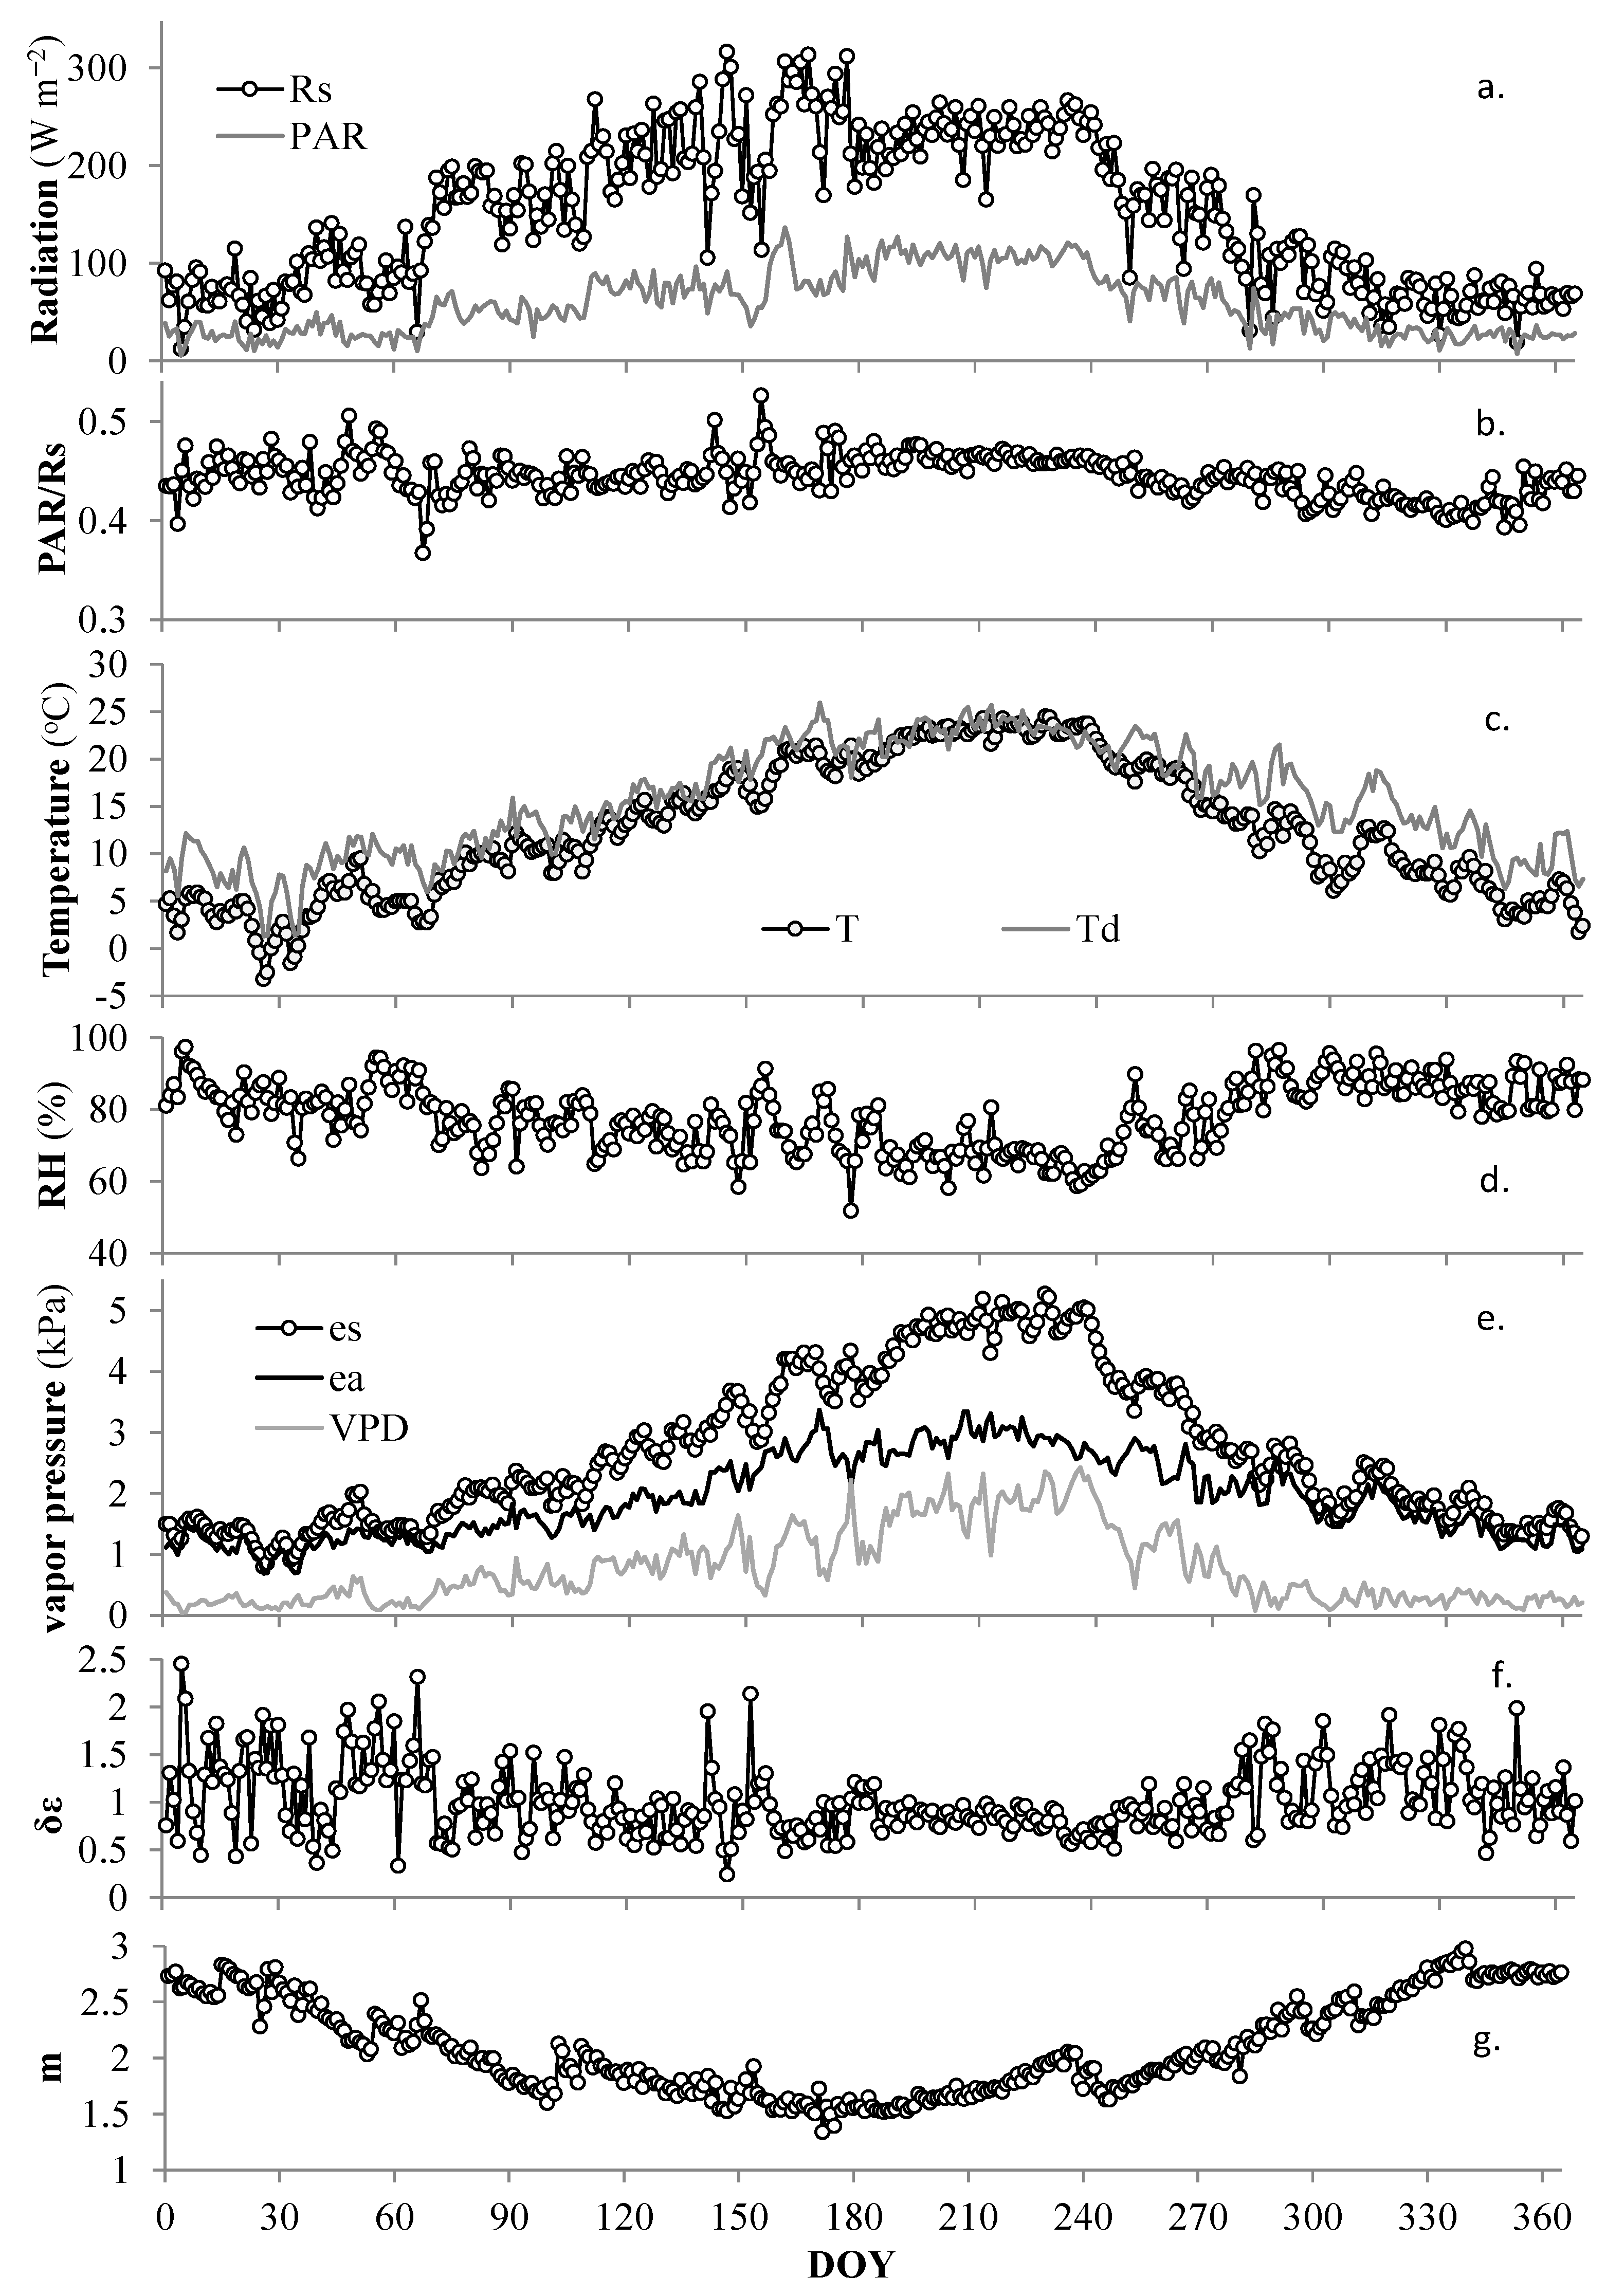
3.1. Temporal Variation

The monthly patterns of Rs and PAR diurnal changes are presented in Figure 4. All fluxes present similar variability, with lower values during the winter months and higher in summer. The diurnal variations also confirm the commonly known bell-shaped pattern with maximum values at noon, with lower values in the morning and in the afternoon.
The PAR/Rs seasonal variations are presented in Table 2. Its monthly averages vary from 0.419 (SD = 0.042) in November to 0.464 (SD = 0.048) in July, whereas the seasonal values range from 0.432 (SD = 0.051) in autumn to 0.462 (SD = 0.046) in summer, resulting in an annual value of 0.446 (SD = 0.048). The slopes (a) of the y = ax + b and y = ax regression lines also present similar monthly and seasonal distribution with, however, lower values compared with the PAR/Rs averages, but with strong correlation (high R2 values) between the PAR and Rs attributes. In all cases, the general pattern indicates higher ratios in summer and lower in winter. These results are in line with findings presented in other studies conducted in Greece. Specifically, the annual PAR/Rs in Arnea (0.446) is slightly higher than the respective hourly ratio (0.438) for the high-altitude mountainous site of Mt. Iti in central Greece [2]. For the same site, Proutsos et al. [2] also identified smaller slope (a) values obtained by the linear regressions compared with the annual means. In other sites the reported results are quite similar: 0.436 [47], 0.429 [48], and 0.437 [49] for Athens, Greece, 0.454 for the Mogostos forest in Peloponnese, Greece [3]. In addition, other sites around the world present quite similar PAR/Rs values: 0.435 for Beijing, China [50] and for Girona, Spain [12], 0.436 for Lusaka, Zambia [51], 0.439 for Tibet, China [52], 0.449 for San Joaquin Valley, USA [53], 0.454 for Cyprus [27], 0.455 for Nigeria [25], and 0.457 for Corvallis, USA [54]. There are, however, studies reporting quite different annual values for the ratio, e.g., 0.420 for Cyprus [55], 0.471, 0.480, and 0.521 for different sites in Israel [56], 0.490 for Brazil [57], etc.
In agreement with the high summer ratio values in Arnea, are results presented by other researchers [26,27,47,54]. There are studies, however, indicating higher values in winter and autumn or even small seasonal variations [2,3,58]. This may be attributed to the effect of sky conditions at specific sites as also discussed by Yu et al. [21] and Proutsos et al. [2,3].
The effect of atmospheric cloudiness in conjunction with the seasonal variation of PAR/Rs is also presented in Table 2, confirming the highest ratio value under overcast conditions in summer (0.499, SD = 0.060) and the lowest during clear winter days (0.424, SD = 0.030). These changes are clearly depicted in Figure 5, suggesting that there is also an impact on the ratio values due to the inclination solar angle (h), as expected [10,20,59]. More specifically, it appears that at low h angles, prevailing mainly in early morning and late afternoon, the PAR/Rs values are slightly higher, compared with midday, although even less evident in winter, which is associated with low radiation fluxes. This is attributed to the higher absorbance of Rs over PAR, in association with the fact that during the morning and afternoon hours, solar rays have to pass through longer paths inside the atmosphere, leading to a higher reduction of Rs against PAR, and thus to increased values of the PAR/Rs ratio. The ratio’s diurnal changes also differ under various sky conditions presenting higher values for overcast skies and lower at hours of the day with clear skies, due to the absorbance and multiple scattering of the radiation rays, affecting more the Rs compared with PAR. Apart from the smaller daily variation with h, the increased PAR/Rs may be attributed to the very high water content in the atmosphere (RH = 84% in winter and 69% in summer) in conjunction with the relatively low, for a Mediterranean site, daytime hours with clear skies (20% in winter and 32% in summer).

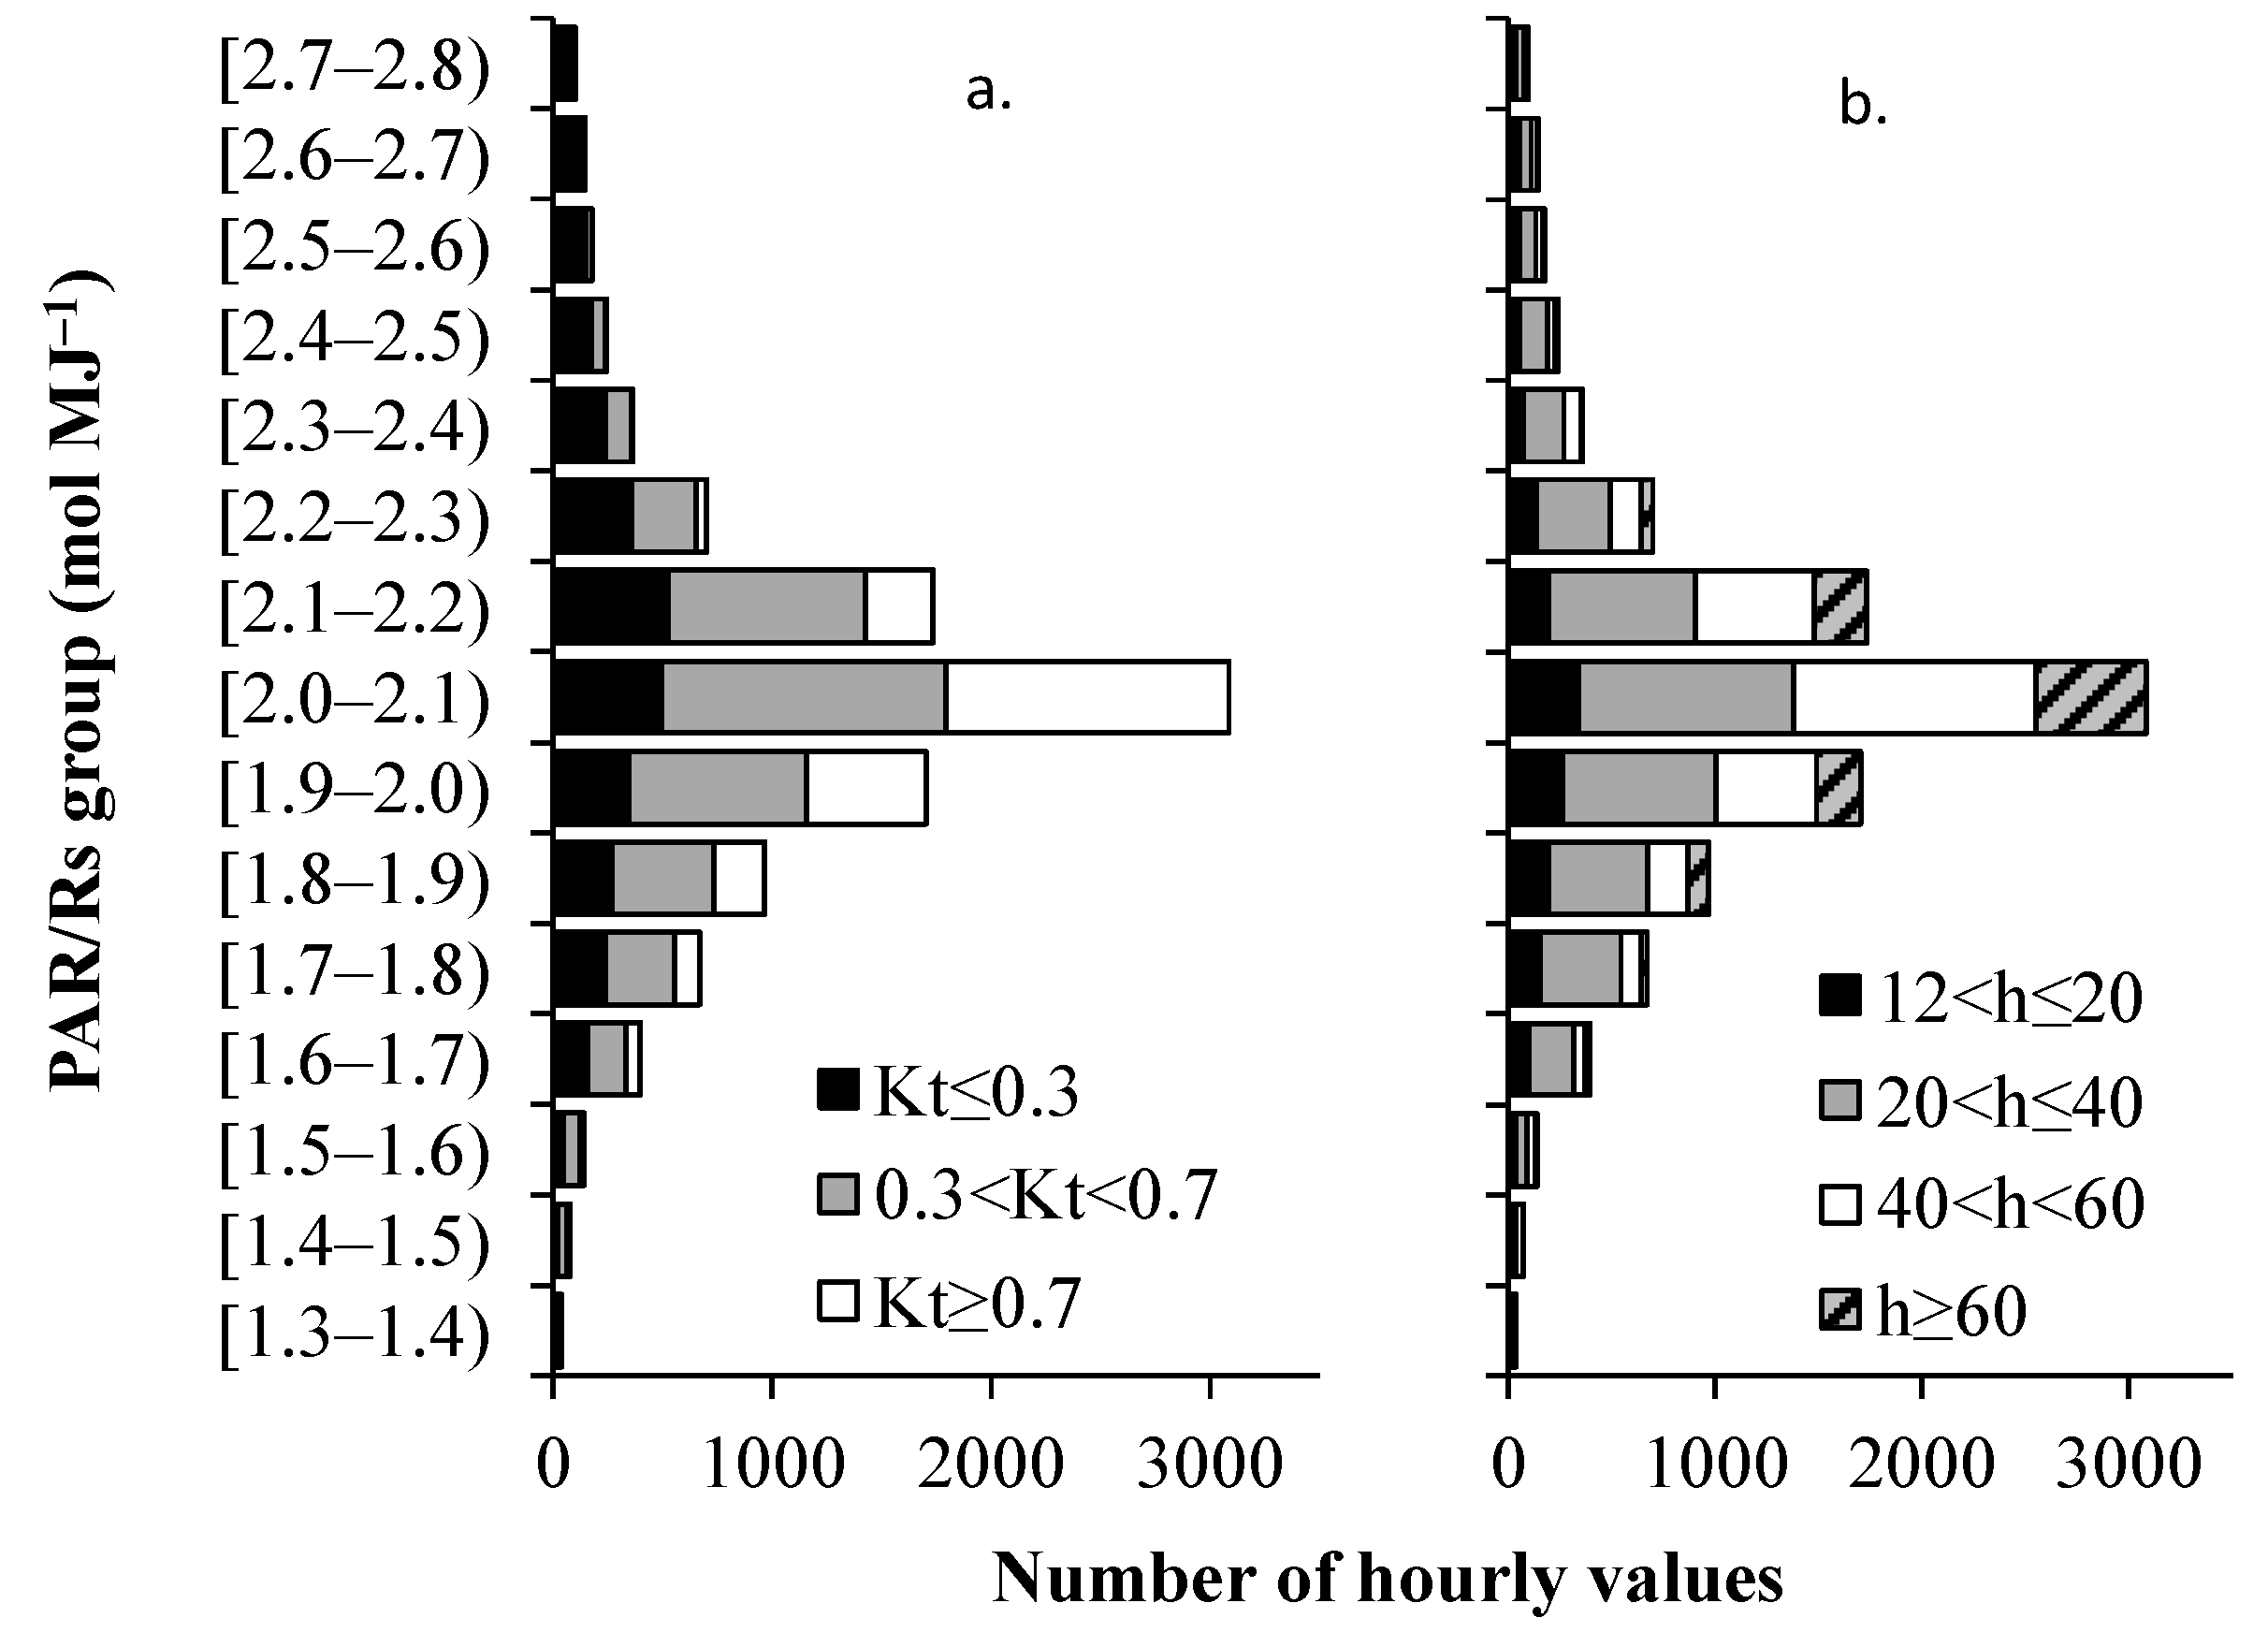
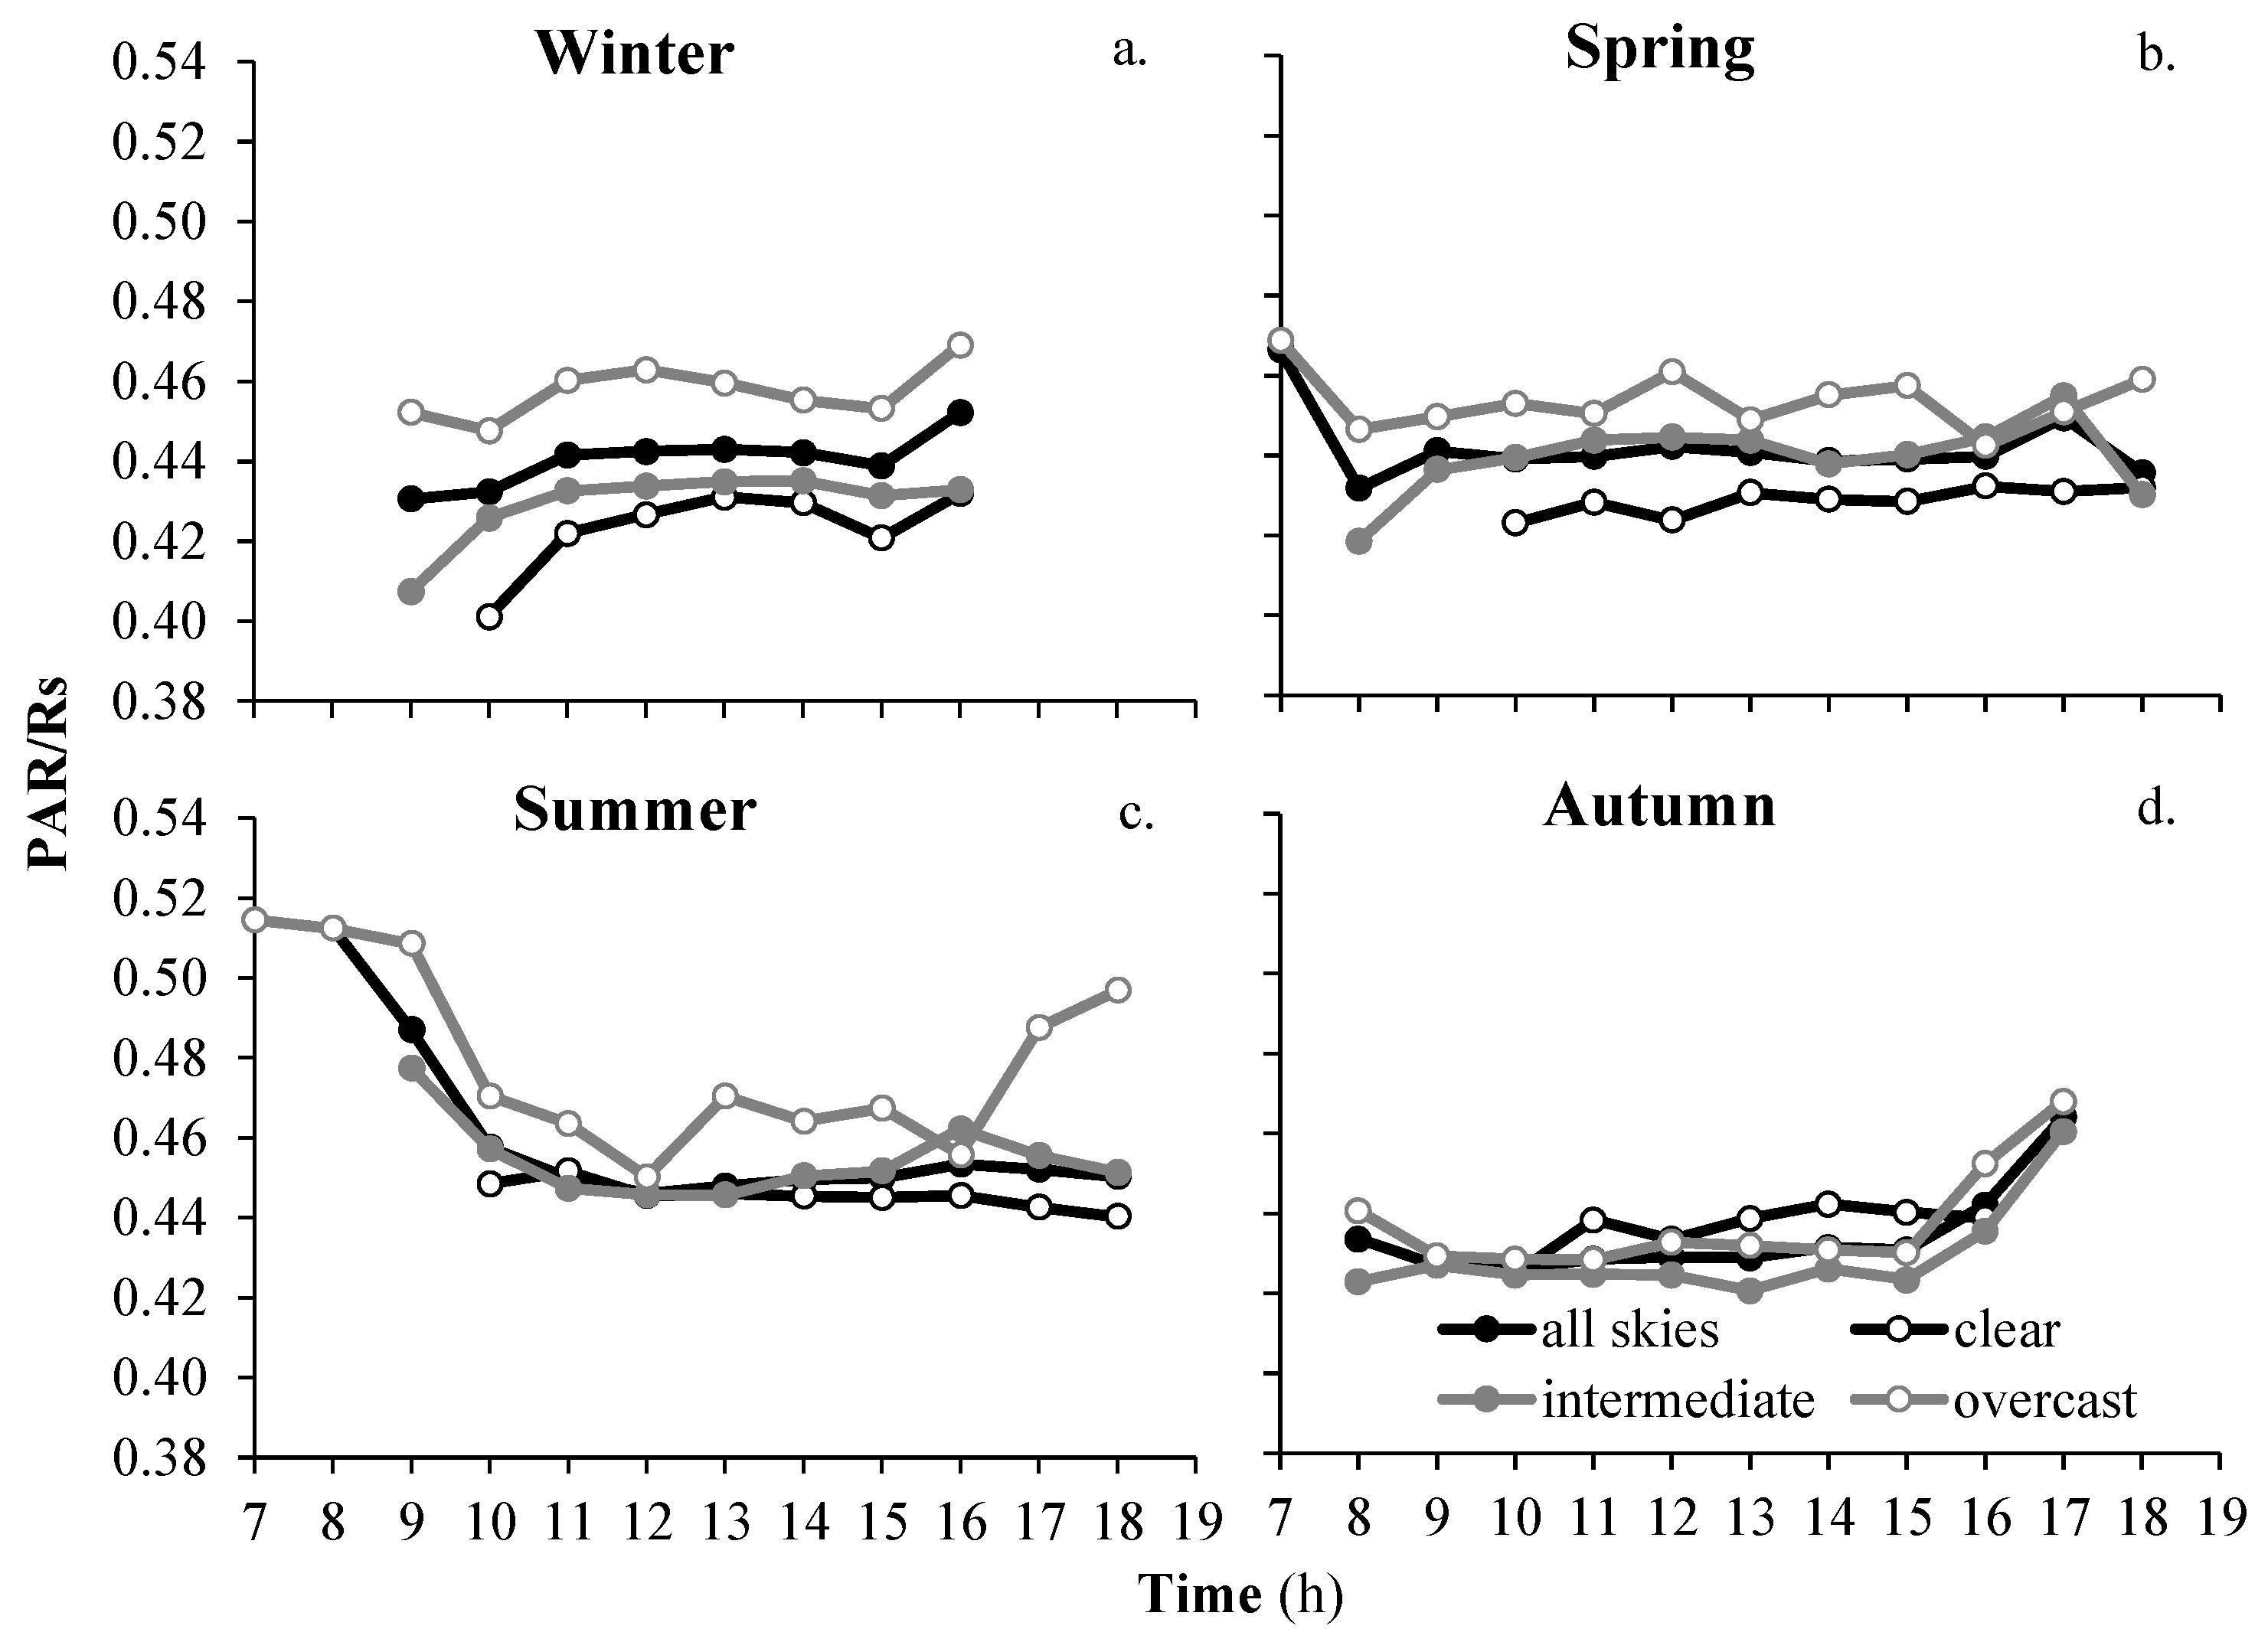
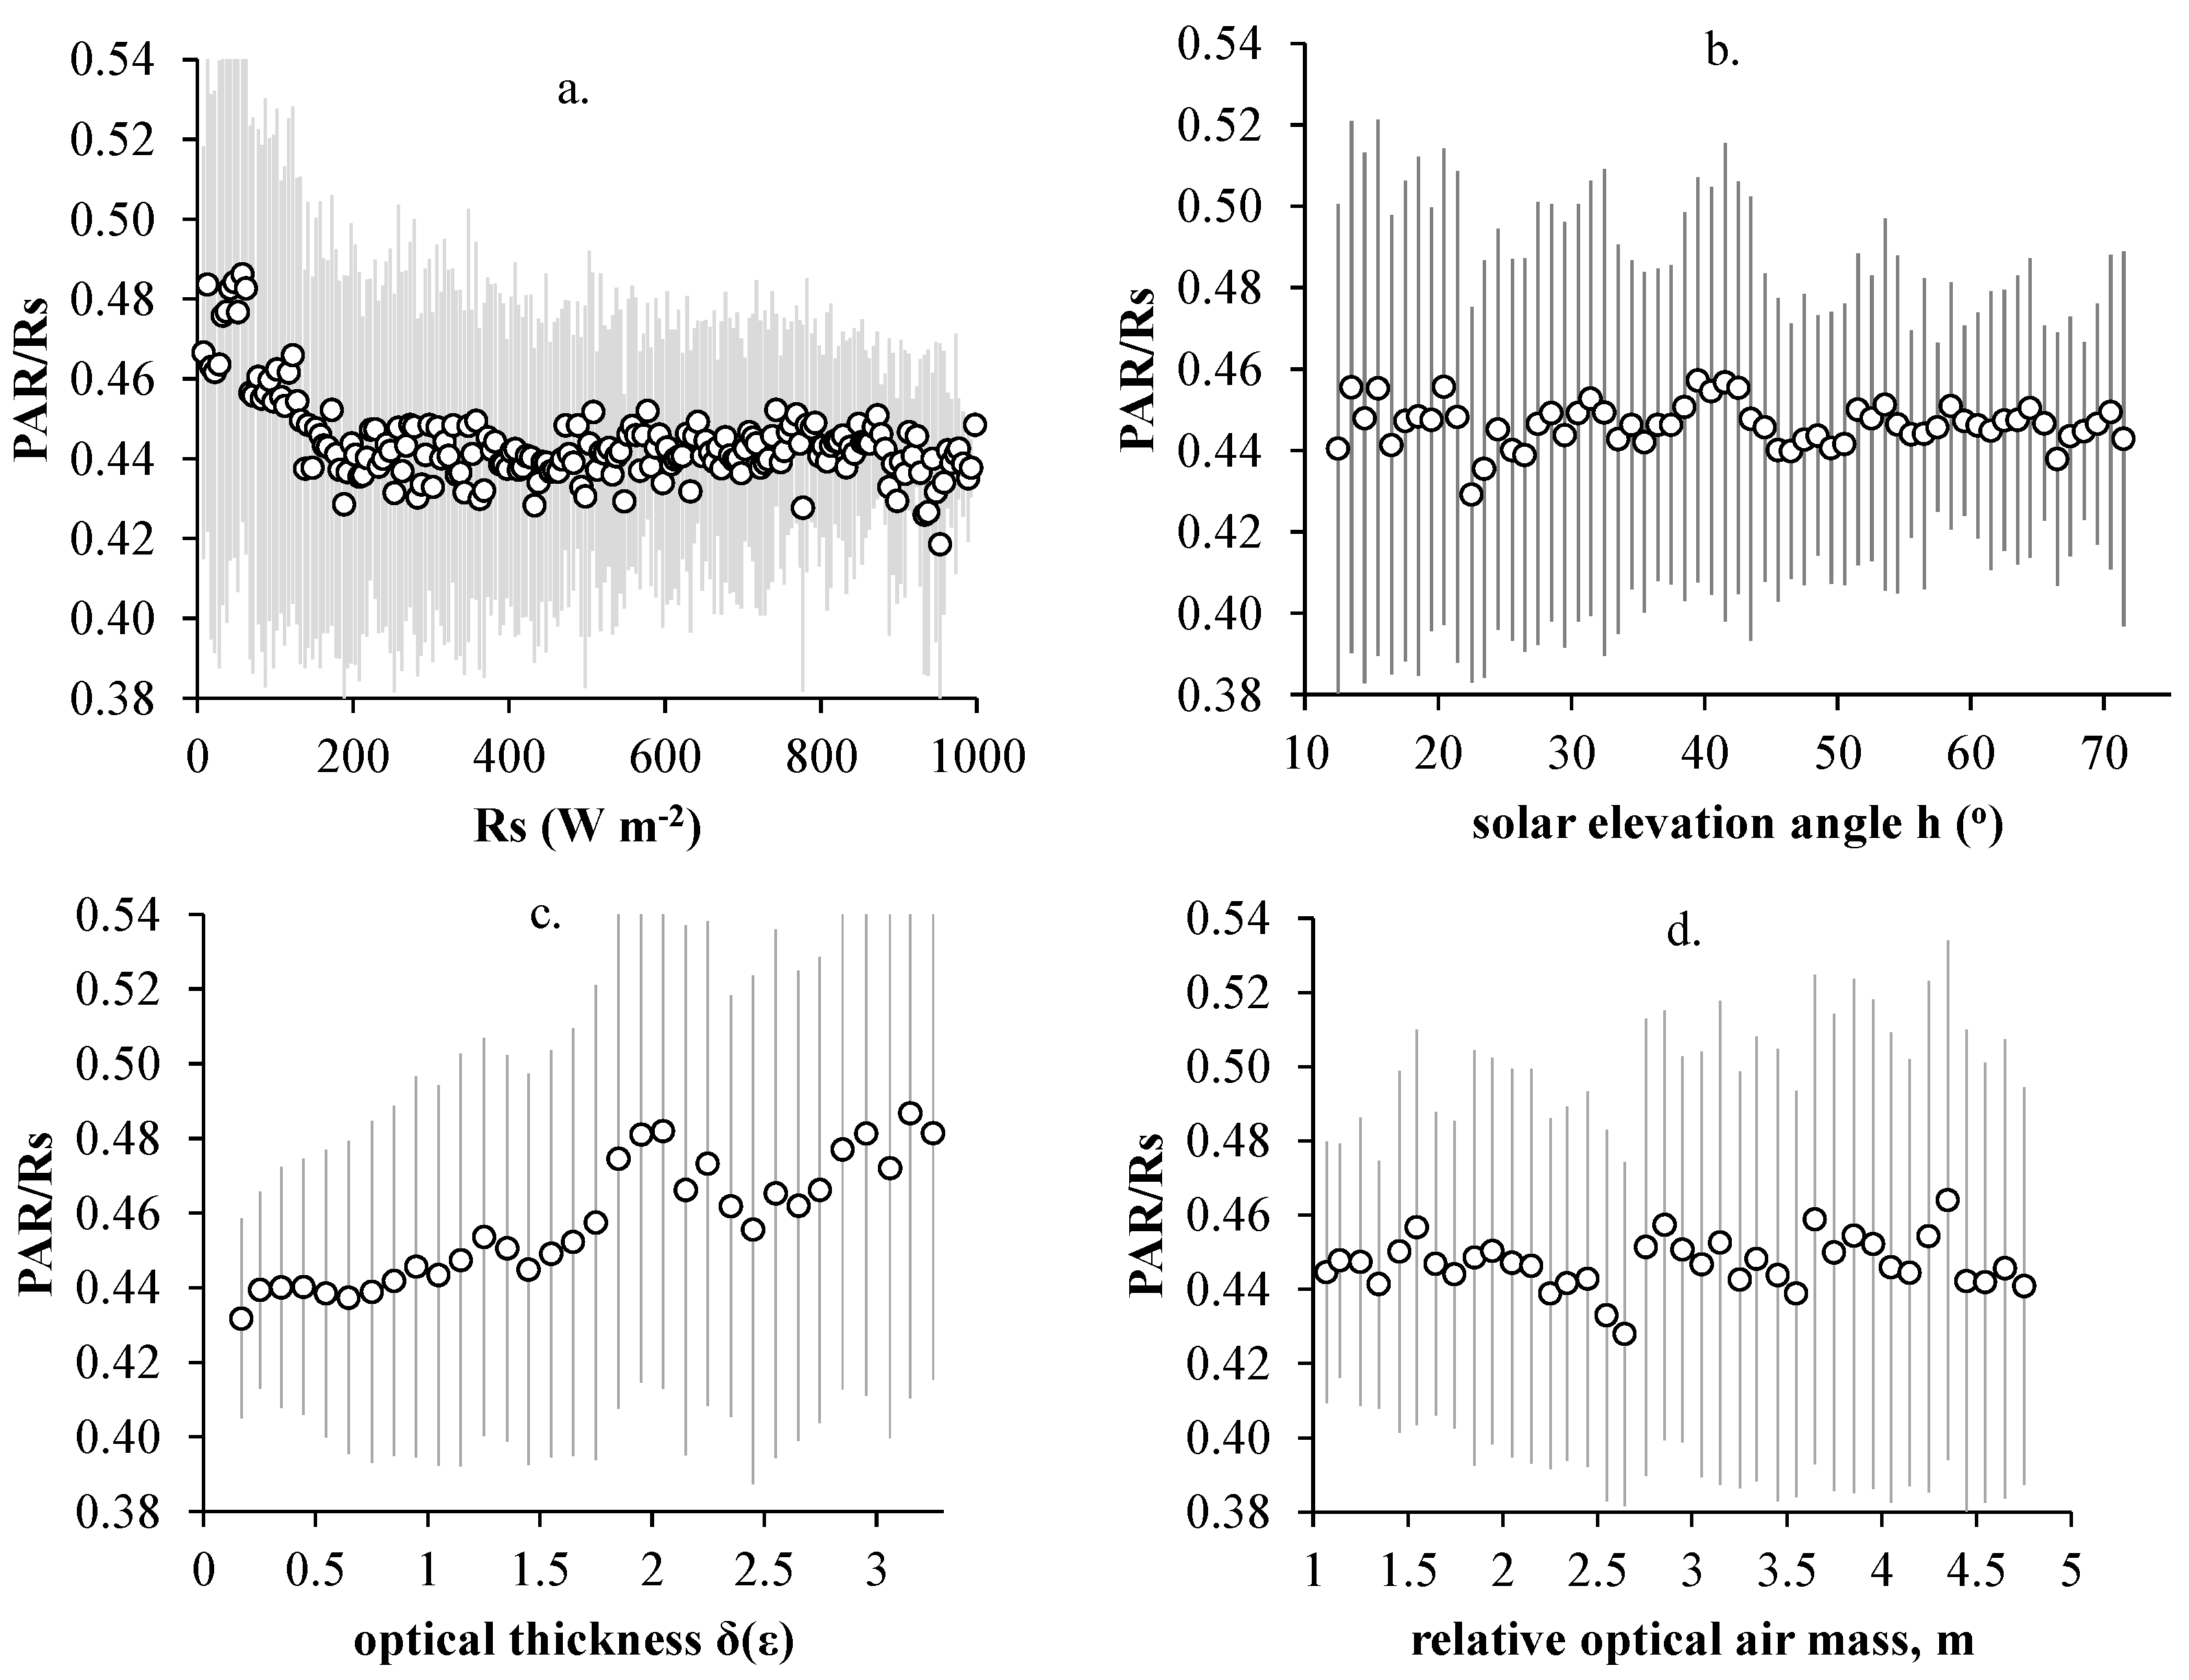
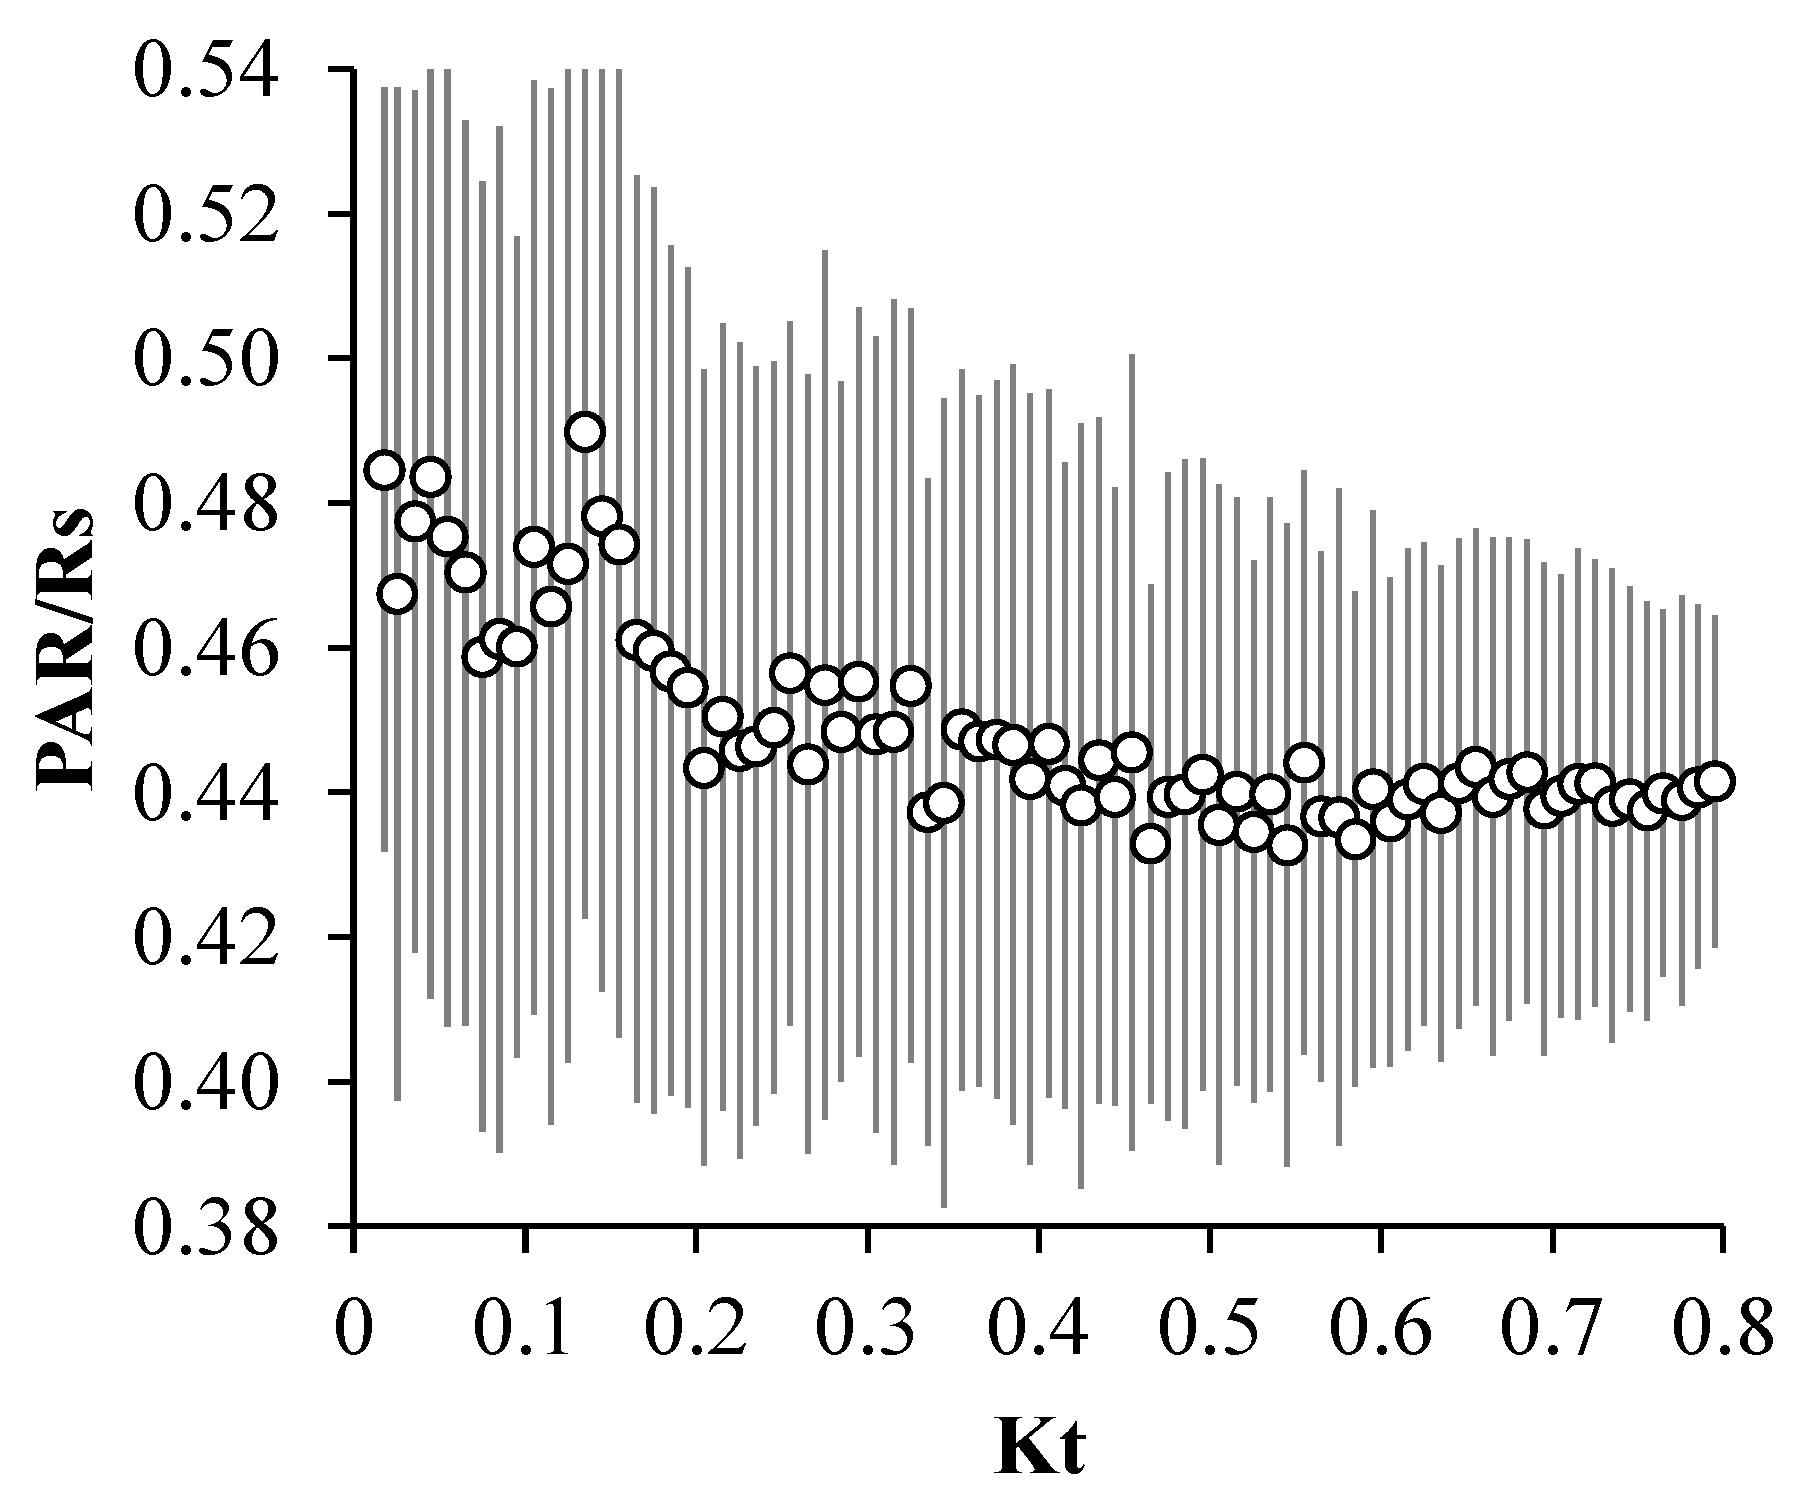
3.2. Solar Attributes Effects

Atmospheric wetness and cloudiness can highly affect radiation absorbance, especially at the PAR wavelengths and result in the elimination of the diurnal solar radiation inclination angle effect. This is obvious in Figure 6b, where almost stable PAR/Rs values are recorded regardless of the h angle. The negligible effect of the solar angle on the radiation ratio is in line with the findings of Akitsu et al. [17,26] in Japan. However many other studies detected either positive [24,25] or negative [6,12] relations with the radiation ratio. The patterns identified in this study, although rather unexpected, may be explained by the location of the examined forest site, which is close to the sea, thus highly affected by the increased atmospheric water content.
Similar to the rather unimportant effect of the solar inclination angle on PAR over Rs, is the effect of the relative optical airmass, m (Figure 6d). It appears, however, that its pattern affects similarly the distribution of the PAR/Rs ratio with m (Figure 6d), presenting almost stable values regardless of the m. This is rather expected, since m is determined by the sun’s zenith angle z, which as the h solar angle, appears to have a minor effect on the composition of Rs to PAR. It seems that the high relative humidity and the small number of sunny days minimize the impact of the relative optical air mass m on the PAR/Rs values.
For the other radiation attributes, it seems that the magnitude of the incident solar radiation affects the PAR/Rs but only for the low (below 200 Wm−2) Rs hourly values. As already addressed by Proutsos et al. [2,3], low Rs fluxes are combined with low PAR over Rs values, whereas higher fluxes have rather no or minor effect on the ratio (Figure 6a).
The optical thickness, δ(ε), of a light-absorbing atmosphere, seems to play an important role affecting the composition of Rs to PAR wavelengths. The PAR/Rs ratio appears to increase with δ(ε) up to a threshold of about 2, taking high but stable values thereafter (Figure 6c). This is rather anticipated, since δ(ε) depends on atmospheric clearness, and its highest values are associated with overcast sky conditions favoring multiple scattering and absorption of Rs, thus increasing PAR/Rs, as also found for Mt. Iti, Greece, by Proutsos et al. [2]. It is interesting to note, however, that in the study of Proutsos et al. [2] the range of δ(ε) was not exceeding the value of 2.0, due to the atmospheric conditions persisting at the specific high altitude forest. Our findings indicate that δ(ε), and thus atmospheric clearness, has a strong influence on the formation of the PAR/Rs, but at very high δ(ε) values (turbid skies), the impact of atmospheric clearness becomes less strong.
In general, atmospheric clearness, expressed by the clearness index Kt, is recognized as the most influential factor for the determination of the PAR/Rs ratio. Under clear skies the ratio presents decreased values which, however, increase as sky conditions change to overcast (Figure 7). For the Arnea forest, the ratio varies between 0.437 (SD = 0.029) under clear (Kt ≥ 0.7) to 0.461 (SD = 0.062) under overcast (Kt ≤ 0.3) sky conditions. It is interesting to note that similar values were found in other studies. For example, Udo and Aro [25] reported a PAR/Rs value of 0.460 in Ilorin (Nigeria) for clear skies whereas Proutsos et al. [2] found PAR/Rs values 0.417 and 0.483 in Iti’s forest (Greece) for clear and overcast conditions, respectively. Similarly, for Cyprus, Pashiardis et al. [58] reported values of 0.439 and 0.478 whereas Jacovides et al. [27] 0.460 and 0.501, for clear and cloudy skies, respectively. It is worth noting that in a recent study by Lazano et al. [22] conducted in an urban site in Granada (Spain), the authors found no influence of the Kt on the PAR/Rs ratio. It should be stated, though, that in the specific study site, clear sky conditions (high Kt values) persist whereas the urban atmospheric conditions may have affected the ratio. Lazano et al. [22], however, also found a high dispersion at low Kt values, probably attributed to the relatively small and variable radiation fluxes recorded in mornings and afternoons regardless of the season and additionally in winter throughout daytime, that can introduce high variability to the ratio.

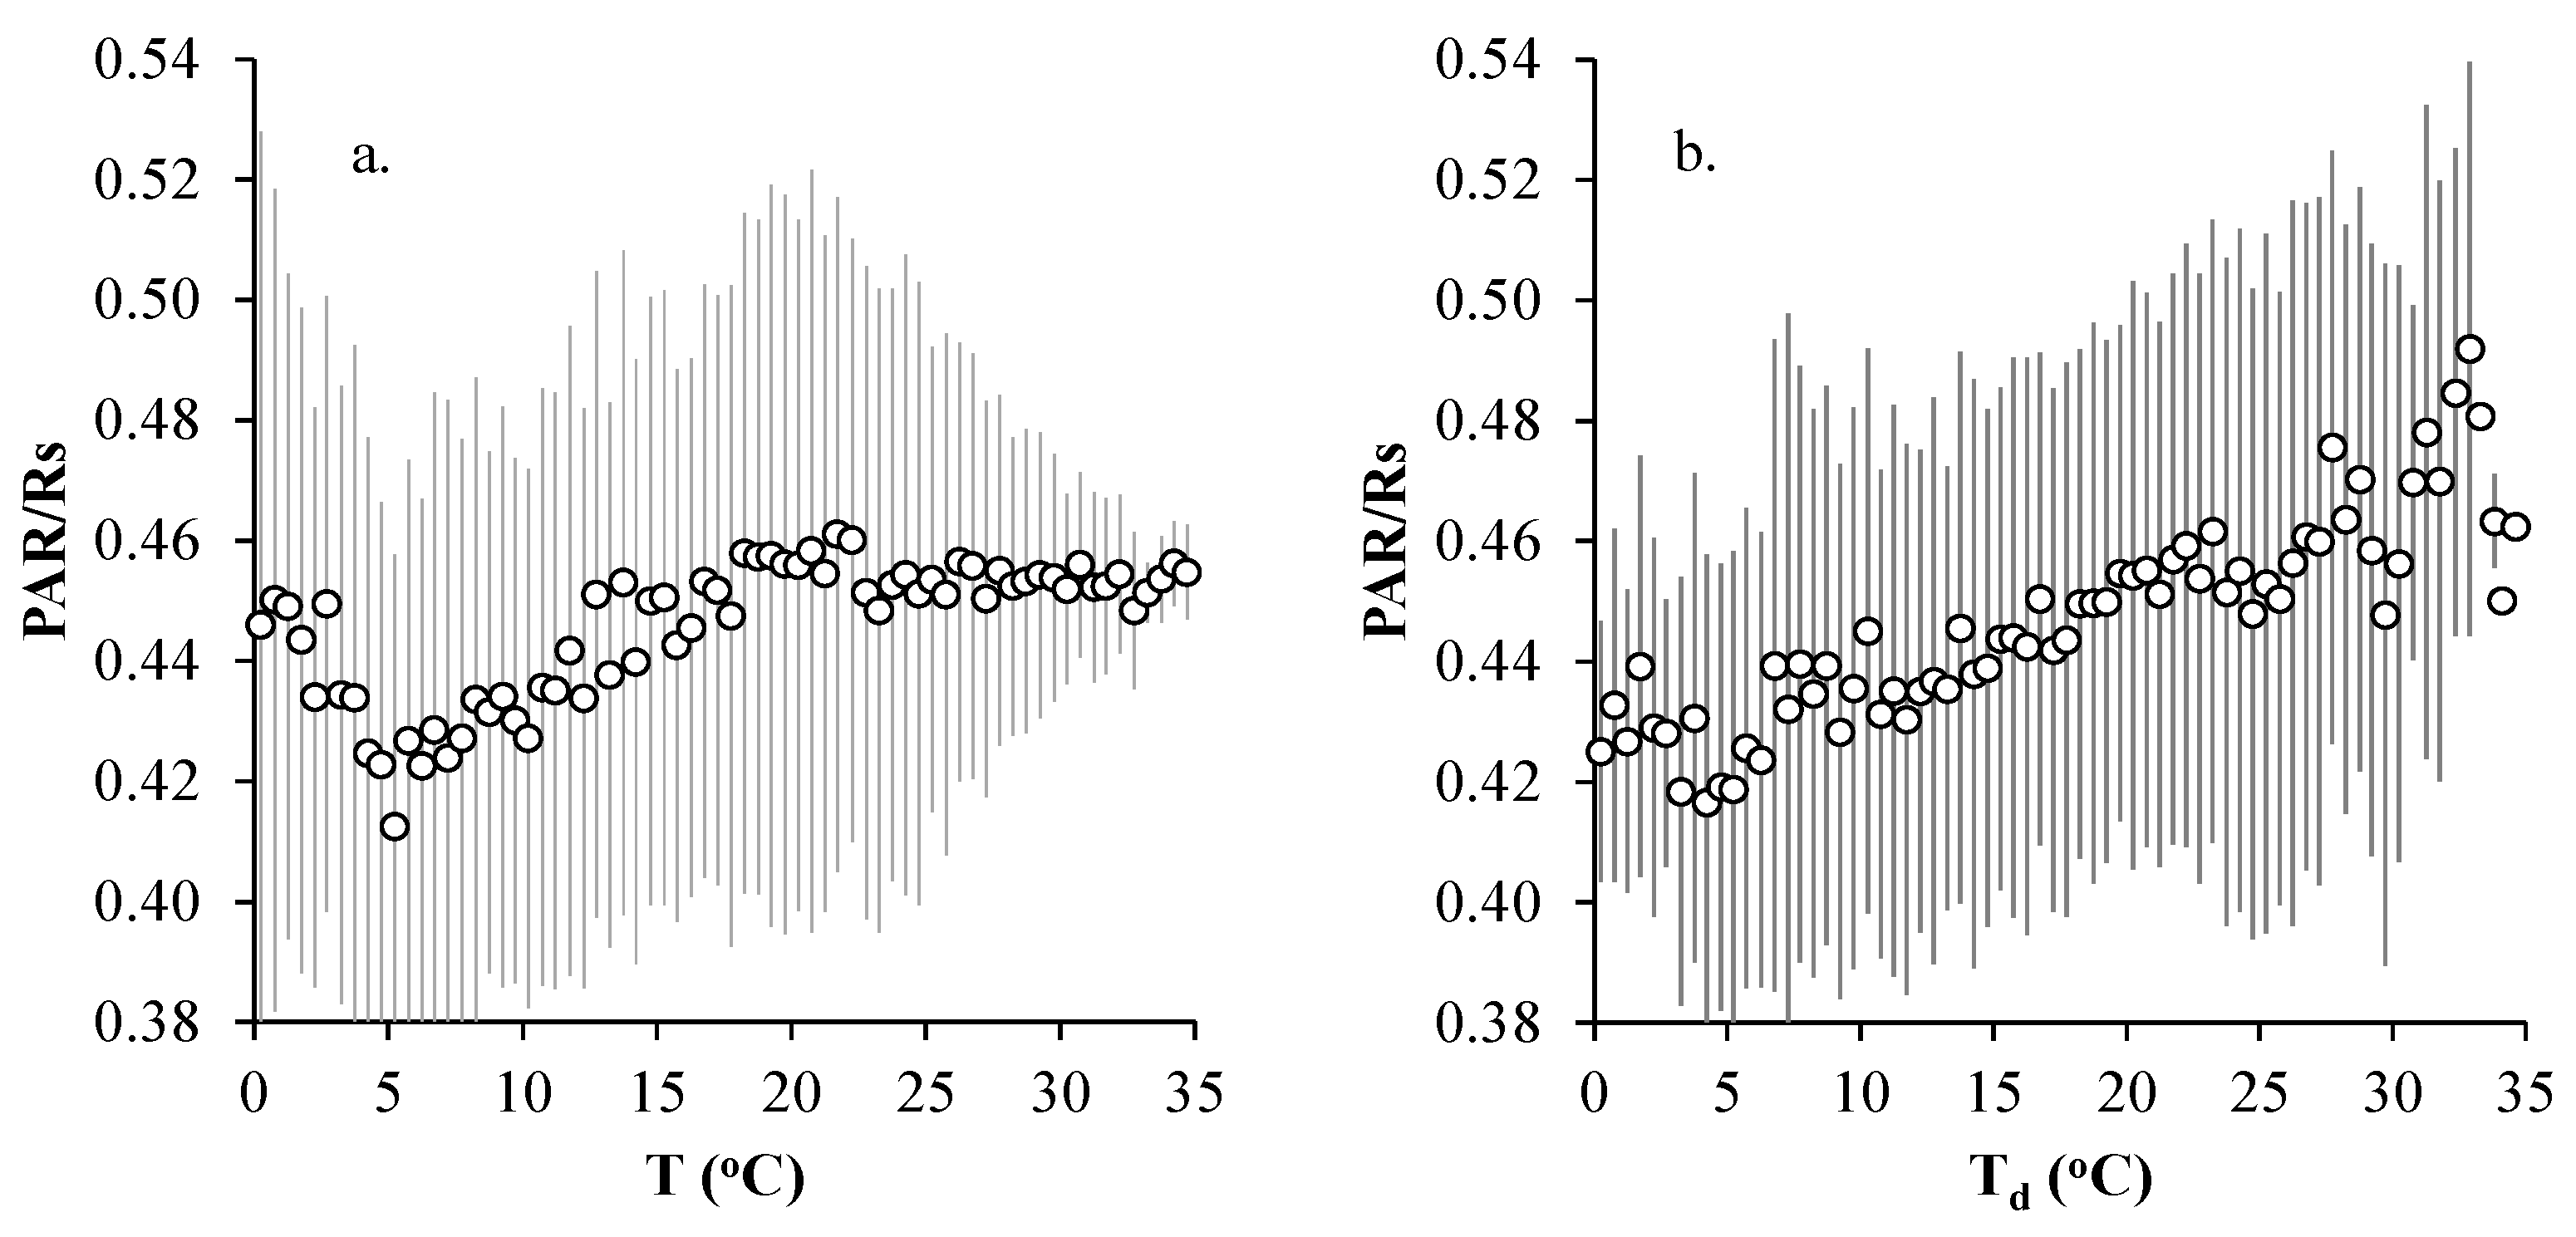
3.3. Temperature Effects

The effect of air temperature is not clear (Figure 8). PAR/Rs shows a rather stable value (0.45) at temperatures close to 0 °C or higher than about 15 °C. The ratio takes a minimum value (0.41) at 5 °C (Figure 8a), presumably because T in the range 0–15 °C is associated with high atmospheric humidity (77% compared with 55% for higher values). Proutsos et al. [2], working at a high altitude forest (Mt. Iti) in central Greece, found that T has a negligible effect on the ratio at values lower than 12 °C.
The dewpoint temperature (Td) effect is clearly positive for the radiation ratio (Figure 8b). PAR/Rs increases with Td and at a stable rate (Figure 8b), a finding also discussed in other research studies. Yu et al. [21], having found in Contiguous United States a negative relationship of the ratio with Td, mention that Td is not an optimal parameter to predict PAR/Rs, since it presents high variability. There are, however, other studies that also indicate a positive relationship between Td and PAR/Rs [2,3,52], probably attributed to the increase in the extinction of infrared radiation as Td increases, imposing an increase in the PAR/Rs ratio. It should be noted, however, that in our previous works [2,3], the site characteristics (high altitude and low Td values) did not allow the study of the effect for high temperature values.

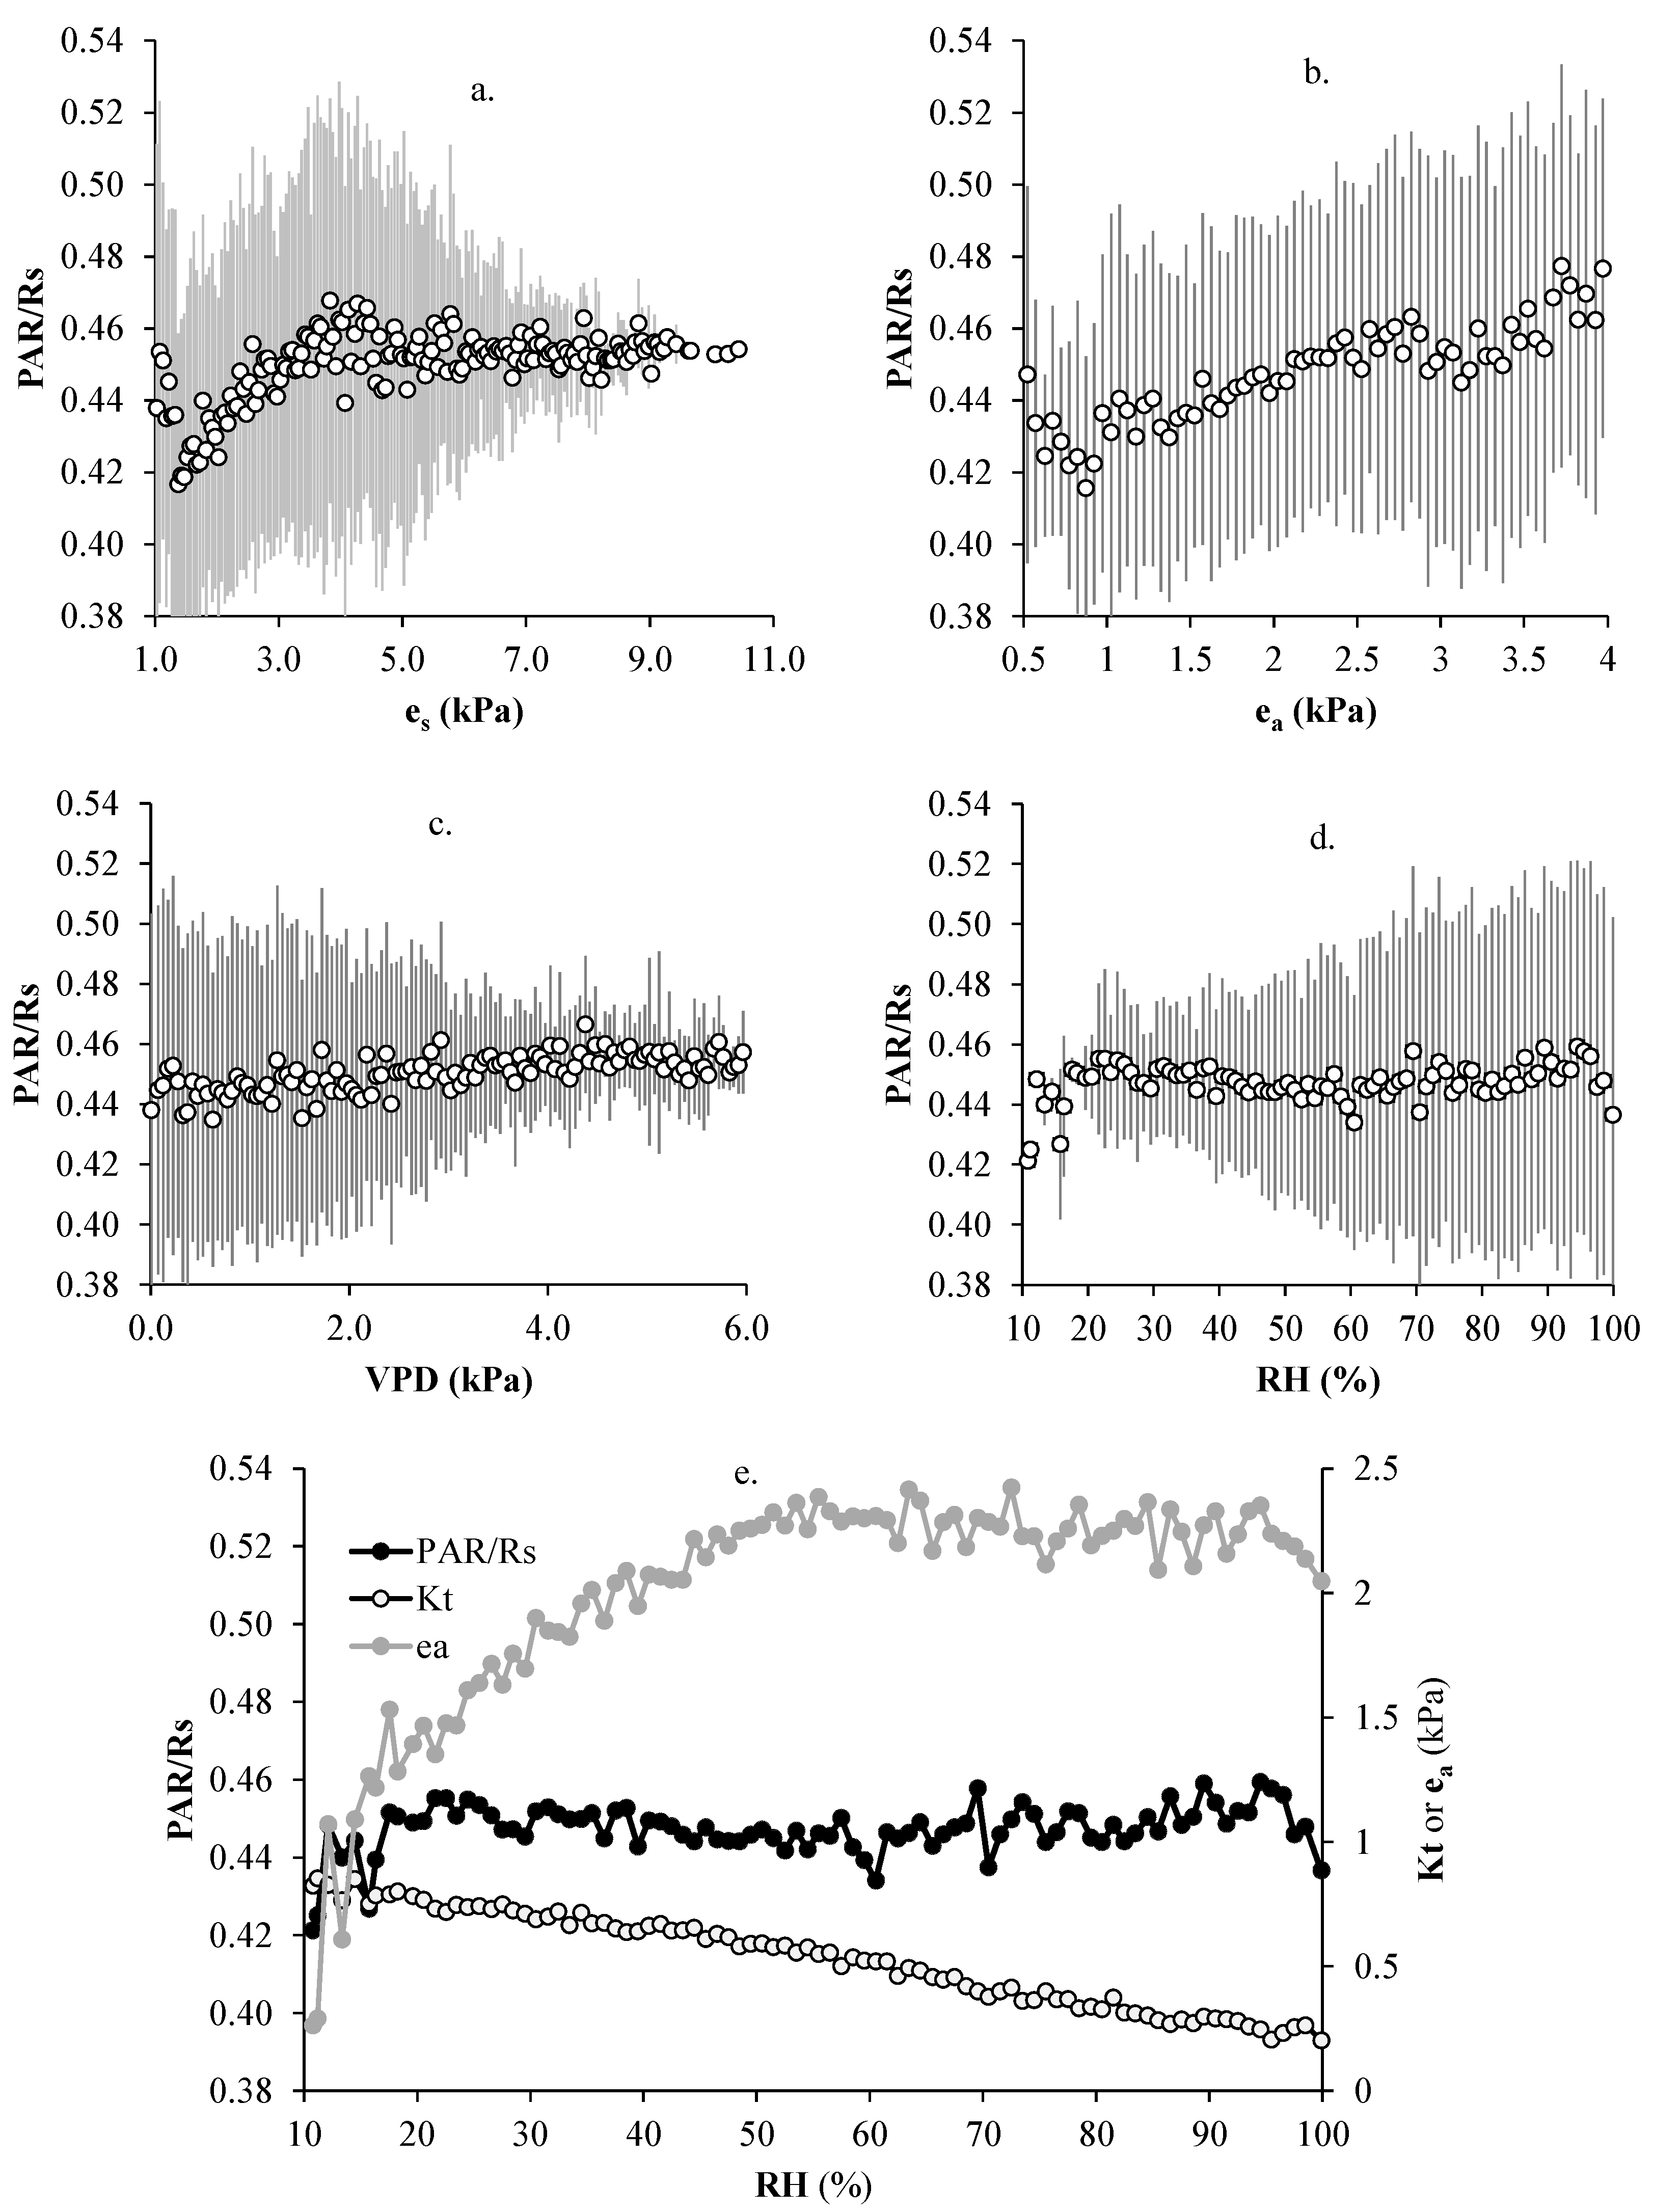
3.4. Air Water Content Effects

Atmospheric vapor content and associated parameters are recognized as influential meteorological factors for the PAR/Rs ratio determination [19,60,61]. This is mainly due to the enhanced absorption of Rs at the infrared waveband during periods with increased water content in the atmosphere [18,40]. For the site at Arnea, the relations between PAR/Rs and several vapor related parameters are depicted in Figure 9.
The most influential humidity-related factor for the formation of the PAR/Rs ratio appears to be the actual vapor pressure, ea, ranging, in our site, up to 4 kPa (Figure 9b). The pattern clearly indicates a positive relation of the radiation ratio with ea. Akitsu et al. [26], working under similar site characteristics, also found a positive relation between PAR/Rs and ea. In central China, Wang et al. [19] attributed the higher PAR/Rs to sky conditions and also to the increased water vapor in the atmosphere. In Greece, Proutsos et al. [2] reported a positive but weak relationship between PAR/Rs and ea (ranging at the specific site up to only 2 kPa) for a high altitude forest site (Mt. Iti), whereas Proutsos et al. [3] described a highly variable pattern for a southern and lower mountainous forest site (Mogostos). The higher range of ea in our study site compared with other similar studies, allows a clearer assessment of its effect on PAR/Rs. This suggests that the surrounding environment may significantly impact on the formation of the PAR/Rs ratio, that is a fact also supported by other studies [2,3,8]. Considering the relationship between the temperature dependent saturation vapor pressure es and PAR/Rs (Figure 9b), it appears to follow the pattern of temperature.
To further investigate the effect of humidity parameters, results from the analysis of the PAR/Rs with relative humidity RH and vapor pressure deficit VPD are also presented in Figure 9c,d. RH is recognized as a significant parameter for many PAR~Rs models [8,13]. Proutsos et al. [3], having analyzed the relation between RH and PAR/Rs in Greece, in conjunction with the Kt and ea values, suggest that the RH value of 60% is critical for the formation of PAR/Rs. For RH less than 60%, PAR/Rs is highly affected by the atmospheric clearness (Kt). However, for RH greater than 60%, the effect of Kt becomes weaker and appears that the ea effect (which is now maximum and stable) dominates and drives the changes of the radiation ratio. The above findings are in line with our findings depicted in Figure 9e. PAR/Rs presents constant values regardless of the RH magnitude. Keeping in mind, however, the effects of ea, discussed previously, it is revealed that for RH less than 60%, PAR/Rs slightly decreases with RH and follows the distribution of Kt. At higher RH values, where ea reaches its maximum and becomes constant, the previously slightly decreasing PAR/Rs trend is interrupted. The ratio stops following the trend of Kt and stabilizes, following thereafter the distribution of ea. This effect of RH is not identified in Figure 9d which, in general, presents constant PAR/Rs regardless of the RH magnitude, indicating a negligible or minor effect of RH.
Similarly, the VPD distribution also implies a non-significant effect of atmospheric dryness on the radiation ratio, which remains almost constant regardless of the VPD (Figure 9c). It should be noted, however, that at VPD values lower than 4 kPa, PAR/Rs presents a weak positive trend with VPD and also that the lower VPD values (i.e., lower vapor demand of the atmosphere) are associated with higher PAR/Rs variability. This pattern is different compared with other altitudinal higher forest sites, where the effect of VPD on the radiation ratio was found to be clear especially for the low VPD values often recorded in such environments [2,3] where wetter conditions prevail. However, in our study the minor positive relation of VPD with PAR/Rs can be explained by the atmospheric water availability, since at the lower VPD values the atmosphere is wetter and thus to a higher degree saturated with water vapor, a fact that enhances the absorbance of Rs over PAR, consequently resulting to an increased radiation ratio.

4. Conclusions

The present work examined the atmospheric parameters affecting the formation of the photosynthetically active to global solar radiation ratio, as an index indicating the effectiveness of solar light for photosynthesis. The analysis was performed to detect the changes on a temporal (seasonal and monthly) basis, also assessing the effect of different radiation, humidity, temperature, and other related meteorological factors in a Mediterranean forest site under the impact of the sea environment.
The results reveal that the radiation ratio is site dependent, producing an annual average of 0.446 (SD = 0.048) with a seasonal variability ranging from 0.432 (with standard SD = 0.051) in autumn to 0.462 (SD = 0.046) in summer. The water content of the atmosphere, either as droplets, expressed by the degree of cloudiness, or as water vapor, expressed by actual water vapor, optical thickness, or dewpoint temperature, leads to radiation absorbance at certain wavebands and, finally, higher PAR availability of Rs. On the contrary, atmospheric clearness reduces the PAR/Rs ratio, which presents values varying from 0.437 (SD = 0.029) under clear to 0.461 (SD = 0.062) under overcast sky conditions. Temperature-dependent factors, like relative humidity, vapor pressure deficit and saturation vapor pressure seem to have no significant effect on the ratio at humid environments.

Author Contributions

Conceptualization, N.D.P.; methodology, N.D.P. and A.L.; validation, N.D.P. and A.L.; formal analysis, N.D.P. and D.T.; investigation, N.D.P., S.G.A., I.X.T. and D.T.; data curation, N.D.P. and D.T.; writing—original draft preparation, N.D.P. and A.L.; writing—review and editing, N.D.P., A.L., S.G.A., I.X.T., D.T. and G.H.; visualization, N.D.P. and S.G.A.; supervision, N.D.P. and A.L. All authors have read and agreed to the published version of the manuscript.

Funding

This research received no external funding.

Institutional Review Board Statement

Not applicable.

Data Availability Statement

Restrictions apply to the availability of these data. Data were obtained from the Forest Research Institute of the Hellenic Agricultural Organization “DEMETER” and are available from the authors with the permission of the Forest Research Institute of the Hellenic Agricultural Organization “DEMETER”.

Acknowledgments

The climate data for the Arnea station were kindly provided by the Forest Research Institute of the Hellenic Agricultural Organization “DEMETER”. The authors highly acknowledge the contribution of the company Scientact S.A. for kindly providing the additional high precision equipment for the calibration of the radiometers.

Conflicts of Interest

The authors declare no conflict of interest.

References

  1. Liakatas, A.; Proutsos, N.; Alexandris, S. Optical properties affecting the radiant energy of an oak forest. Meteorol. Appl. 2002, 9, 433–436. [Google Scholar] [CrossRef]
  2. Proutsos, N.; Alexandris, S.; Liakatas, A.; Nastos, P.; Tsiros, I.X. PAR and UVA composition of global solar radiation at a high altitude Mediterranean forest site. Atmos. Res. 2022, 269, 106039. [Google Scholar] [CrossRef]
  3. Proutsos, N.; Liakatas, A.; Alexandris, S. Ratio of photosynthetically active to total incoming radiation above a Mediterranean deciduous oak forest. Theor. Appl. Climatol. 2019, 137, 2927–2939. [Google Scholar] [CrossRef]
  4. Proutsos, N.; Liakatas, A.; Alexandris, S.; Tsiros, I. Carbon fluxes above a deciduous forest in Greece. Atmósfera 2017, 30, 311–322. [Google Scholar] [CrossRef] [Green Version]
  5. Ferrera-Cobos, F.; Vindel, J.M.; Valenzuela, R.X.; González, J.A. Analysis of spatial and temporal variability of the PAR/GHI ratio and PAR modeling based on two satellite estimates. Remote Sens. 2020, 12, 1262. [Google Scholar] [CrossRef] [Green Version]
  6. Ge, S.; Smith, R.G.; Jacovides, C.P.; Kramer, M.G.; Carruthers, R.I. Dynamics of photosynthetic photon flux density (PPFD) and estimates in coastal northern California. Theor. Appl. Climatol. 2011, 105, 107–118. [Google Scholar] [CrossRef] [Green Version]
  7. Niu, Z.; Wang, L.; Niu, Y.; Hu, B.; Zhang, M.; Qin, W. Spatiotemporal variations of photosynthetically active radiation and the influencing factors in China from 1961 to 2016. Theor. Appl. Climatol. 2019, 137, 2049–2067. [Google Scholar] [CrossRef]
  8. Wang, L.; Kisi, O.; Zounemat-Kermani, M.; Hu, B.; Gong, W. Modeling and comparison of hourly photosynthetically active radiation in different ecosystems. Renew. Sustain. Energy Rev. 2016, 56, 436–453. [Google Scholar] [CrossRef]
  9. Aguiar, L.J.; Fischer, G.R.; Ladle, R.J.; Malhado, A.; Justino, F.B.; Aguiar, R.G.; da Costa, J.M.N. Modeling the photosynthetically active radiation in South West Amazonia under all sky conditions. Theor. Appl. Climatol. 2012, 108, 631–640. [Google Scholar] [CrossRef]
  10. Alados, I.; Foyo-Moreno, I.; Alados-Arboledas, L. Photosynthetically active radiation: Measurements and modelling. Agric. For. Meteorol. 1996, 78, 121–131. [Google Scholar] [CrossRef]
  11. Foyo-Moreno, I.; Alados, I.; Alados-Arboledas, L. A new conventional regression model to estimate hourly photosynthetic photon flux density under all sky conditions. Int. J. Climatol. 2017, 37, 1067–1075. [Google Scholar] [CrossRef] [Green Version]
  12. Gonzalez, J.; Calbó, J. Modelled and measured ratio of PAR to global radiation under cloudless skies. Agric. For. Meteorol. 2002, 110, 319–325. [Google Scholar] [CrossRef]
  13. Mizoguchi, Y.; Yasuda, Y.; Ohtani, Y.; Watanabe, T.; Kominami, Y.; Yamanoi, K. A practical model to estimate photosynthetically active radiation using general meteorological elements in a temperate humid area and comparison among models. Theor. Appl. Climatol. 2014, 115, 583–589. [Google Scholar] [CrossRef]
  14. Noriega Gardea, M.M.Á.; Corral Martínez, L.F.; Anguiano Morales, M.; Trujillo Schiaffino, G.; Salas Peimbert, D.P. Modeling photosynthetically active radiation: A review. Atmósfera 2021, 34, 357–370. [Google Scholar] [CrossRef]
  15. Custódio, L.L.; Silva, B.B.D.; dos Santos, C.A. Relationship between photosynthetically active radiation and global radiation in Petrolina and Brasília, Brazil. Rev. Bras. Eng. Agríc. Ambient. 2021, 25, 612–619. [Google Scholar] [CrossRef]
  16. Peng, S.; Du, Q.; Lin, A.; Hu, B.; Xiao, K.; Xi, Y. Observation and estimation of photosynthetically active radiation in Lhasa (Tibetan Plateau). Adv. Space Res. 2015, 55, 1604–1612. [Google Scholar] [CrossRef]
  17. Akitsu, T.K.; Nasahara, K.N.; Ijima, O.; Hirose, Y.; Ide, R.; Takagi, K.; Kume, A. The variability and seasonality in the ratio of photosynthetically active radiation to solar radiation: A simple empirical model of the ratio. Int. J. Appl. Earth Obs. Geoinf. 2022, 108, 102724. [Google Scholar] [CrossRef]
  18. Wang, L.; Gong, W.; Li, C.; Lin, A.; Hu, B.; Ma, Y. Measurement and estimation of photosynthetically active radiation from 1961 to 2011 in Central China. Appl. Energy 2013, 111, 1010–1017. [Google Scholar] [CrossRef]
  19. Wang, L.; Gong, W.; Lin, A.; Hu, B. Analysis of photosynthetically active radiation under various sky conditions in Wuhan, Central China. Int. J. Biometeorol. 2014, 58, 1711–1720. [Google Scholar] [CrossRef]
  20. Wang, L.; Gong, W.; Ma, Y.; Hu, B.; Zhang, M. Photosynthetically active radiation and its relationship with global solar radiation in Central China. Int. J. Biometeorol. 2014, 58, 1265–1277. [Google Scholar] [CrossRef] [PubMed]
  21. Yu, X.; Wu, Z.; Jiang, W.; Guo, X. Predicting daily photosynthetically active radiation from global solar radiation in the Contiguous United States. Energy Convers. Manag. 2015, 89, 71–82. [Google Scholar] [CrossRef]
  22. Lozano, I.; Sánchez-Hernández, G.; Guerrero-Rascado, J.; Alados, I.; Foyo-Moreno, I. Analysis of cloud effects on long-term global and diffuse photosynthetically active radiation at a Mediterranean site. Atmos. Res. 2022, 268, 106010. [Google Scholar] [CrossRef]
  23. Zempila, M.-M.; Taylor, M.; Bais, A.; Kazadzis, S. Modeling the relationship between photosynthetically active radiation and global horizontal irradiance using singular spectrum analysis. J. Quant. Spectrosc. Radiat. Transf. 2016, 182, 240–263. [Google Scholar] [CrossRef]
  24. Meek, D.; Hatfield, J.; Howell, T.; Idso, S.; Reginato, R. A generalized relationship between photosynthetically active radiation and solar radiation 1. Agron. J. 1984, 76, 939–945. [Google Scholar] [CrossRef]
  25. Udo, S.; Aro, T. Global PAR related to global solar radiation for central Nigeria. Agric. For. Meteorol. 1999, 97, 21–31. [Google Scholar] [CrossRef]
  26. Akitsu, T.; Kume, A.; Hirose, Y.; Ijima, O.; Nasahara, K.N. On the stability of radiometric ratios of photosynthetically active radiation to global solar radiation in Tsukuba, Japan. Agric. For. Meteorol. 2015, 209, 59–68. [Google Scholar] [CrossRef]
  27. Jacovides, C.; Tymvios, F.; Asimakopoulos, D.; Theofilou, K.; Pashiardes, S. Global photosynthetically active radiation and its relationship with global solar radiation in the Eastern Mediterranean basin. Theor. Appl. Climatol. 2003, 74, 227–233. [Google Scholar] [CrossRef]
  28. Li, R.; Zhao, L.; Ding, Y.; Wang, S.; Ji, G.; Xiao, Y.; Liu, G.; Sun, L. Monthly ratios of PAR to global solar radiation measured at northern Tibetan Plateau, China. Sol. Energy 2010, 84, 964–973. [Google Scholar] [CrossRef]
  29. NATURA2000-SDF. Natura 2000 Standard Data Form for Special Protection Areas (SPA). Site GR1220009 “Limnes Koroneias-Volvis, Stena Ren-Tinas Kai Evryteri Periochi”. Available online: https://natura2000.eea.europa.eu/Natura2000/SDF.aspx?site=GR1220009 (accessed on 26 May 2022).
  30. NATURA2000-SDF. Natura 2000 Standard Data Form for Special Protection Areas (SPA). Site GR1270012 “OROS CHOLOMONTAS”. Available online: https://natura2000.eea.europa.eu/Natura2000/SDF.aspx?site=GR1270012 (accessed on 26 May 2022).
  31. NATURA2000-SDF. Natura 2000 Standard Data Form for Sites of Community Importance (SCI). Site GR1270001 “Oros Cholomontas”. Available online: https://natura2000.eea.europa.eu/Natura2000/SDF.aspx?site=GR1270001 (accessed on 26 May 2022).
  32. Proutsos, N.D.; Tsiros, I.X.; Nastos, P.; Tsaousidis, A. A note on some uncertainties associated with Thornthwaite’s aridity index introduced by using different potential evapotranspiration methods. Atmos. Res. 2021, 260, 105727. [Google Scholar] [CrossRef]
  33. Tsiros, I.X.; Nastos, P.; Proutsos, N.D.; Tsaousidis, A. Variability of the aridity index and related drought parameters in Greece using climatological data over the last century (1900–1997). Atmos. Res. 2020, 240, 104914. [Google Scholar] [CrossRef]
  34. Arnold, E. World Atlas of Desertification; UNEP: London, UK, 1992. [Google Scholar]
  35. Thornthwaite, C. Una aproximación para una clasificación racional del clima (An approach toward a rational classification of climate). Geogr. Rev. 1948, 38, 85–94. [Google Scholar] [CrossRef]
  36. Iqbal, M. An Introduction to Solar Radiation; Elsevier: New York, NY, USA, 1983. [Google Scholar]
  37. Liang, F.; Xia, X. Long-term trends in solar radiation and the associated climatic factors over China for 1961–2000. Ann. Geophys. 2005, 23, 2425–2432. [Google Scholar] [CrossRef] [Green Version]
  38. Tsubo, M.; Walker, S. Relationships between photosynthetically active radiation and clearness index at Bloemfontein, South Africa. Theor. Appl. Climatol. 2005, 80, 17–25. [Google Scholar] [CrossRef]
  39. Duffie, J.A.; Beckman, W.A. Solar Engineering of Thermal Processes; Research Supported by the University of Wisconsin; Wiley-Interscience: New York, NY, USA, 1980; p. 775. [Google Scholar]
  40. Hu, B.; Wang, Y.; Liu, G. Long-term trends in photosynthetically active radiation in Beijing. Adv. Atmos. Sci. 2010, 27, 1380–1388. [Google Scholar] [CrossRef]
  41. Kaplanis, S.; Kaplani, E. Stochastic prediction of hourly global solar radiation for Patra, Greece. Appl. Energy 2010, 87, 3748–3758. [Google Scholar] [CrossRef]
  42. Kasten, F.; Young, A.T. Revised optical air mass tables and approximation formula. Appl. Opt. 1989, 28, 4735–4738. [Google Scholar] [CrossRef]
  43. Tetens, O. Uber einige meteorologische Begriffe. Z. Geophys. 1930, 6, 297–309. [Google Scholar]
  44. McCree, K.J. Test of current definitions of photosynthetically active radiation against leaf photosynthesis data. Agric. Meteorol. 1972, 10, 443–453. [Google Scholar] [CrossRef]
  45. Wang, L.; Gong, W.; Feng, L.; Lin, A.; Hu, B.; Zhou, M. Estimation of hourly and daily photosynthetically active radiation in Inner Mongolia, China, from 1990 to 2012. Int. J. Climatol. 2015, 35, 3120–3131. [Google Scholar] [CrossRef]
  46. Zhu, Z.; Wang, L.; Gong, W.; Xiong, Y.; Hu, B. Observation and estimation of photosynthetic photon flux density in Southern China. Theor. Appl. Climatol. 2015, 120, 701–712. [Google Scholar] [CrossRef]
  47. Papaioannou, G.; Nikolidakis, G.; Asimakopoulos, D.; Retalis, D. Photosynthetically active radiation in Athens. Agric. For. Meteorol. 1996, 81, 287–298. [Google Scholar] [CrossRef]
  48. Papaioannou, G.; Papanikolaou, N.; Retalis, D. Relationships of photosynthetically active radiation and shortwave irradiance. Theor. Appl. Climatol. 1993, 48, 23–27. [Google Scholar] [CrossRef]
  49. Jacovides, C.; Tymvios, F.; Assimakopoulos, V.; Kaltsounides, N. The dependence of global and diffuse PAR radiation components on sky conditions at Athens, Greece. Agric. For. Meteorol. 2007, 143, 277–287. [Google Scholar] [CrossRef]
  50. Hu, B.; Wang, Y.; Liu, G. Measurements and estimations of photosynthetically active radiation in Beijing. Atmos. Res. 2007, 85, 361–371. [Google Scholar] [CrossRef]
  51. Finch, D.; Bailey, W.; McArthur, L.; Nasitwitwi, M. Photosynthetically active radiation regimes in a southern African savanna environment. Agric. For. Meteorol. 2004, 122, 229–238. [Google Scholar] [CrossRef]
  52. Zhang, X.; Zhang, Y.; Zhoub, Y. Measuring and modelling photosynthetically active radiation in Tibet Plateau during April–October. Agric. For. Meteorol. 2000, 102, 207–212. [Google Scholar] [CrossRef]
  53. Howell, T.; Meek, D.; Hatfield, J. Relationship of photosynthetically active radiation to shortwave radiation in the San Joaquin Valley. Agric. Meteorol. 1983, 28, 157–175. [Google Scholar] [CrossRef]
  54. Nagaraja Rao, C. Photosynthetically active components of global solar radiation: Measurements and model computations. Arch. Meteorol. Geophys. Bioclimatol. Ser. B 1984, 34, 353–364. [Google Scholar] [CrossRef]
  55. Jacovides, C.; Timvios, F.; Papaioannou, G.; Asimakopoulos, D.; Theofilou, C. Ratio of PAR to broadband solar radiation measured in Cyprus. Agric. For. Meteorol. 2004, 121, 135–140. [Google Scholar] [CrossRef]
  56. Stanhill, G.; Fuchs, M. The relative flux density of photosynthetically active radiation. J. Appl. Ecol. 1977, 14, 317–322. [Google Scholar] [CrossRef]
  57. Escobedo, J.F.; Gomes, E.N.; Oliveira, A.P.; Soares, J. Ratios of UV, PAR and NIR components to global solar radiation measured at Botucatu site in Brazil. Renew. Energy 2011, 36, 169–178. [Google Scholar] [CrossRef]
  58. Pashiardis, S.; Kalogirou, S.A.; Pelengaris, A. Statistical analysis for the characterization of solar energy utilization and inter-comparison of solar radiation at two sites in Cyprus. Appl. Energy 2017, 190, 1138–1158. [Google Scholar] [CrossRef]
  59. Mottus, M.; Ross, J.; Sulev, M. Experimental study of ratio of PAR to direct integral solar radiation under cloudless conditions. Agric. For. Meteorol. 2001, 109, 161–170. [Google Scholar] [CrossRef]
  60. Hu, B.; Liu, H.; Wang, Y. Investigation of the variability of photosynthetically active radiation in the Tibetan Plateau, China. Renew. Sustain. Energy Rev. 2016, 55, 240–248. [Google Scholar] [CrossRef]
  61. Hu, B.; Tang, L.; Liu, H.; Zhao, X.; Liu, Z.; Wang, Y.; Wang, L. Trends of photosynthetically active radiation over China from 1961 to 2014. Int. J. Climatol. 2018, 38, 4007–4024. [Google Scholar] [CrossRef]
Figure 1. Geophysical map of the Arnea’s meteorological station and broader area (Chalkidiki, N. Greece), also depicting the expansion of the Natura 2000 protected sites (SPA GR1220009, SPA GR1270012 and SCI GR1270001).
Atmosphere 13 01207 g001
Figure 2. Mean of the period 2009–2014 daily variations of (a) global solar Rs and photosynthetically active PAR radiation fluxes, (b) PAR/Rs ratio, (c) air T and dewpoint Td temperatures, (d) relative humidity RH, (e) saturation es, actual es vapor pressure values and vapor pressure deficit VPD, (f) optical thickness δ(ε), and (g) relative optical air mass m.
Atmosphere 13 01207 g002
Figure 3. Frequency distribution of the hourly PAR/Rs values according to their magnitude in different (a) sky clearness conditions based on the Kt index and (b) solar inclination angles, h.
Atmosphere 13 01207 g003
Figure 4. Diurnal variation of the PAR and Rs hourly average radiation fluxes, during the different months of the year.
Atmosphere 13 01207 g004
Figure 5. Diurnal variation of the PAR/Rs hourly average values during the different seasons of the year: (a) winter, (b) spring, (c) summer and (d) autumn, under overcast, intermediate, clear, and all sky conditions.
Atmosphere 13 01207 g005
Figure 6. Averages and standard deviations of the PAR/Rs hourly ratio with the variation of (a) the magnitude of Rs grouped in 5 Wm−2 bin classes, (b) the solar elevation angle h grouped in 1o bin classes, (c) the optical thickness h grouped in 0.1 bin classes, and (d) the relative optical air mass m grouped in 0.1 bin classes.
Atmosphere 13 01207 g006
Figure 7. Averages and standard deviations of the PAR/Rs hourly ratio with the variation of the clearness index Kt grouped in 0.01 bin-classes.
Atmosphere 13 01207 g007
Figure 8. Averages and standard deviations of the PAR/Rs hourly ratio with the variation of (a) the air temperature T and (b) dewpoint temperature Td, grouped in 0.1 bin-classes.
Atmosphere 13 01207 g008
Figure 9. Averages and standard deviations of the PAR/Rs hourly ratio with the variation of (a) saturation vapor pressure es, (b) actual vapor pressure ea, and (c) vapor pressure deficit VPD grouped in 0.05 bin-classes and also with (d) relative humidity grouped in 1% bin-classes. The comparative changes of PAR/Rs with RH is also presented (e) in association with the respective values of ea and Kt per 1% RH bin-classes.
Atmosphere 13 01207 g009
Table 1. Descriptive statistics of the measured and estimated meteorological factors for the filtered 10,522 hourly data of this study.
ParameterDescriptionUnitsMeanMaximumMinimumSDCV (%)
RsGlobal solar radiationW m−2396.51166.45.1269.167.9
PARPhotosynthetically Active RadiationW m−2175.3489.12.1119.468.1
KtClearness Indexunitless0.481.000.010.2552.0
TAir Temperature°C18.237.30.08.345.7
TdDewpoint Temperature°C17.734.7−11.46.637.4
RHRelative Humidity%63.6100.010.821.734.2
eaActual vapor pressurekPa2.175.520.260.8237.9
esSaturation vapor pressurekPa3.8210.441.001.8748.8
VPDVapor pressure deficitkPa1.658.670.001.4990.0
δ(ε)Optical thicknessunitless0.954.210.000.7679.1
mRelative optical airmassunitless2.014.801.050.8642.8
Table 2. Monthly, seasonal, and annual averages of the ratio PAR/Rs, number of hourly datasets (N) and standard deviations (SD) under deferent sky conditions, along with the respective slope (a), offset (b) and R2 values of the linear regressions PAR = a Rs and PAR = a Rs + b.
Time PeriodΣ(PAR/Rs)/N
All Skies
Linear CorrelationsΣ(PAR/Rs)/N
PAR = a Rs + b
(y = ax + b)
PAR = a Rs
(y = ax)
Overcast Skies
(Kt < 0.3)
Intermediate Skies
(0.3 ≤ Kt ≤ 0.7)
Clear Skies
(Kt > 0.7)
AverageSDNabR2aR2AverageSDNAverageSDNAverageSDN
Month
January0.4490.0445380.4292.00.9810.4360.9810.4660.0462770.4300.0381840.4370.02677
February0.4520.0454950.4293.40.9770.4370.9790.4740.0441910.4460.0441810.4280.031123
March0.4380.0497150.4242.20.9870.4280.9880.4510.0612690.4310.0452780.4260.024168
April0.4400.0429060.4264.40.9760.4330.980.4480.0512560.4420.0404400.4270.031210
May0.4460.0397970.4285.40.9810.4360.9850.4670.0561820.4430.0313880.4330.025227
June0.4590.0556950.4357.10.9560.4460.9650.4850.0581890.4570.0563190.4370.037187
July0.4640.04814510.4367.70.9840.4480.9790.5000.0633670.4580.0396140.4450.021470
August0.4620.03916850.4434.00.9910.4490.9880.5060.0553490.4520.0267580.4480.017578
September0.4400.05110940.443−2.00.9710.4390.9720.4460.0682720.4340.0475510.4440.032271
October0.4330.0587190.4240.70.9650.4250.9660.4490.0692800.4200.0463310.4310.048108
November0.4190.0427520.429-1.70.9720.4240.9730.4160.0433570.4200.0422990.4230.04096
December0.4250.0416750.4151.40.9750.4200.9780.4340.0462450.4230.0402920.4130.028138
Season
Winter0.4410.04517080.4261.60.9770.4310.9780.4570.0487130.4310.0416570.4240.030338
Spring0.4410.04424180.4273.50.9810.4330.9840.4540.0577070.4400.03911060.4290.027605
Summer0.4620.04638310.4396.00.9810.4480.9780.4990.0609050.4550.03816910.4450.0231235
Autumn0.4320.05125650.439−2.40.9740.4340.9730.4360.0629090.4270.04611810.4370.039475
Annual0.4460.04810,5220.4350.20.9820.4360.9800.4620.06232340.4410.04346350.4370.0292653
Publisher’s Note: MDPI stays neutral with regard to jurisdictional claims in published maps and institutional affiliations.

