Article

Identification and Risk Characteristics of Agricultural Drought Disaster Events Based on the Copula Function in Northeast China

1
Institute of Atmospheric Environment, China Meteorological Administration, Shenyang 110166, China
2
Key Laboratory of Agrometeorological Disasters Liaoning Province, Shenyang 110166, China
3
Institute of Meteorological Science of Heilongjiang Province, Harbin 150030, China
4
Institute of Meteorological Science of Jilin Province, Changchun 130062, China
*
Author to whom correspondence should be addressed.
Atmosphere 2022, 13(8), 1234; https://doi.org/10.3390/atmos13081234
Submission received: 13 June 2022 / Revised: 22 July 2022 / Accepted: 29 July 2022 / Published: 3 August 2022
(This article belongs to the Special Issue Extreme Weather Events and Atmospheric Circulation)

Abstract

:
Accurate feature identification of drought disaster events is required for proper risk management in agriculture. This study improved the crop water deficit index (CWDI) by including the daily meteorological, crop development stage, soil moisture content, and yield data for 1981–2020 in northeastern China. Two drought characteristic variables (drought duration and intensity) were extracted using the theory of runs to produce the improved crop water deficit index (CWDIwp). Thresholds for the bivariate indicators were also determined for agricultural drought events of varying severity. A joint distribution model for drought variables was constructed based on five types of Archimedean copulas. The joint probability and the joint recurrence period for agricultural drought events were analyzed for drought events with varying intensities in northeast China. The results suggest that the CWDIwp can reliably identify the onset, duration, and intensity of drought events over the study area and can be used to monitor agricultural drought events. The conditional probability of drought intensity (duration) decreased as the drought duration (intensity) threshold increased, whereas the drought recurrence period increased as the threshold for drought duration and intensity rose. In the period (1981–2020), drought intensity in the three Northeastern provinces showed an increasing trend in the order Jilin Province > Liaoning Province > Heilongjiang Province. The spatial distribution of the joint probability and the joint recurrence period was obvious, and the joint probability showed a decreasing distribution trend from west to east. The distribution trend for the joint probability was opposite to that of the joint recurrence period. Furthermore, the areas with high drought probability values corresponded to the areas with low values for the recurrence period, indicating that the drought occurrence probability was higher, and the recurrence period value was lower in the drought-prone areas. The high-risk drought areas (60–87%) were in western Liaoning and western Jilin, with a recurrence period of 1–3 years, whereas the low-risk areas (<40%) were located in the mountainous areas of eastern Liaoning and eastern Jilin. The joint probability and joint recurrence period for agricultural drought events of varying severity were quite different, with the probability following the order light drought > moderate drought > severe drought > extreme drought. The order for the recurrence period was light drought < moderate drought < severe drought < extreme drought. The results provide technical support for disaster prevention and mitigation in drought risk management.

1. Introduction

Drought is one of the most detrimental agricultural natural disasters because it threatens agricultural production and worldwide food security [1,2]. Crop yield losses caused by drought can exceed the losses caused by all other factors combined. More than half of all crop yield losses are attributed to drought due to its high frequency and its long duration compared to other natural disasters [3,4]. The fifth IPCC assessment report indicated that the global atmospheric temperature increased by 0.85 °C between 1980 and 2012 and will continue to rise in the future. The precipitation pattern will undergo significant changes, such as increased precipitation intensity and decreased precipitation frequency. Furthermore, evapotranspiration will also increase along with the increased drought frequency and intensity [5,6,7,8,9]. Climate change may result in a series of ecological and environmental challenges [6]. It is projected that by the end of the 21st century, the global drought-affected area may increase by 15–44%. The crop area affected by drought could increase from 11.6 million hectares to 25 million hectares, which would greatly affect food production, cause fluctuations in global food prices, and threaten food security [8,10,11]. Therefore, there is an urgent need to conduct in-depth research into the occurrence and development of drought events [12].
Drought events have multi-element and multi-scale characteristics, obvious spatial and temporal distribution characteristics, and show dynamic evolution [13]. Extracting the correct feature variables to characterize drought events will improve drought event identification and drought frequency analysis [14,15]. Previous studies had different emphases and evaluation indicators for drought events. To date, most researchers have focused on a single variable, which leads to overestimation or underestimation of the occurrence probability for drought events and cannot accurately describe the complexity and impact of drought events [16]. Therefore, a complete, accurate description of drought events requires a clear expression of multiple features, such as drought duration, degree of occurrence, spatial distribution, and the correlation between variables [17,18,19,20,21]. Drought events are usually studied by selecting appropriate drought indicators for a specific area and then identifying drought events using univariate analyses. Since the introduction of the Copula function into drought research, there has been considerable improvements and progress in the analysis of multiple drought characteristics and multivariate events [22]. For example, the Copula function has been widely used to study meteorological drought and hydrological drought events. First, features such as the duration and intensity of drought events are extracted from the standardized precipitation index (SPI) and Palmer drought index (PDSI) based on run theory. The optimal Copula function is then used to fit drought features to analyze the probability of drought events and their recurrence period [12,23,24,25,26,27]. In agricultural drought research there have been few related reports that have combined drought duration and intensity to describe the characteristics of drought probability and its recurrence period. Agricultural drought refers to drought that affects crop growth and yield. Drought indexes that are closely related to crops should be selected to evaluate drought. The crop water deficit index (CWDI) is used to analyze the crop water deficit from two aspects: water source and expenditure. Including both crop water demand and crop water supply in an analysis can better reflect the comprehensive influence of soil, plants, and meteorology, and the crop water deficit situation. However, the climate, topography, and soil condition differences in different regions can have an impact on the crop coefficient and precipitation availability. Thus, the methods used to calculate the crop coefficient and precipitation availability should be refined in future studies to obtain more accurate results [28].
Northeast China mainly supports rain-fed agriculture, and is one of the main grain-producing regions in China. The yield losses and fluctuations in grain production are mainly caused by drought. As one of the three major maize belts in the world, northeast China accounts for one third of the country’s maize output and half of its maize exports. The total sown area of maize is more than 6 million hm2, and about 94% of the maize is grown on rain-fed farmland [29,30]. Severe droughts were recorded in the maize growing seasons of 2000, 2009, 2014, 2015, 2018, and 2020. Furthermore, drought has become the greatest threat to maintaining stable grain production in Northeast China, which means that it affects food security in China and across the globe [31]. The main aims of this study were as follows. (1) To more accurately identify agricultural drought events by improving the calculation method for the CWDI through optimization of the crop, soil, and meteorology aspects. The agricultural drought threshold index was determined by considering the water deficit accumulation degree and its degree of influence on maize. (2) To construct the optimal drought duration and intensity distribution function and, based on the joint distribution Copula function, the probability of agricultural drought events of varying severity in northeast China. The temporal and spatial distribution characteristics of the recurrence period were also clarified. The findings will improve the scientific decision-making basis for drought risk management, the practical application of agricultural disaster prevention and mitigation, and regional socio-economic sustainable development.

2. Study Area and Methods
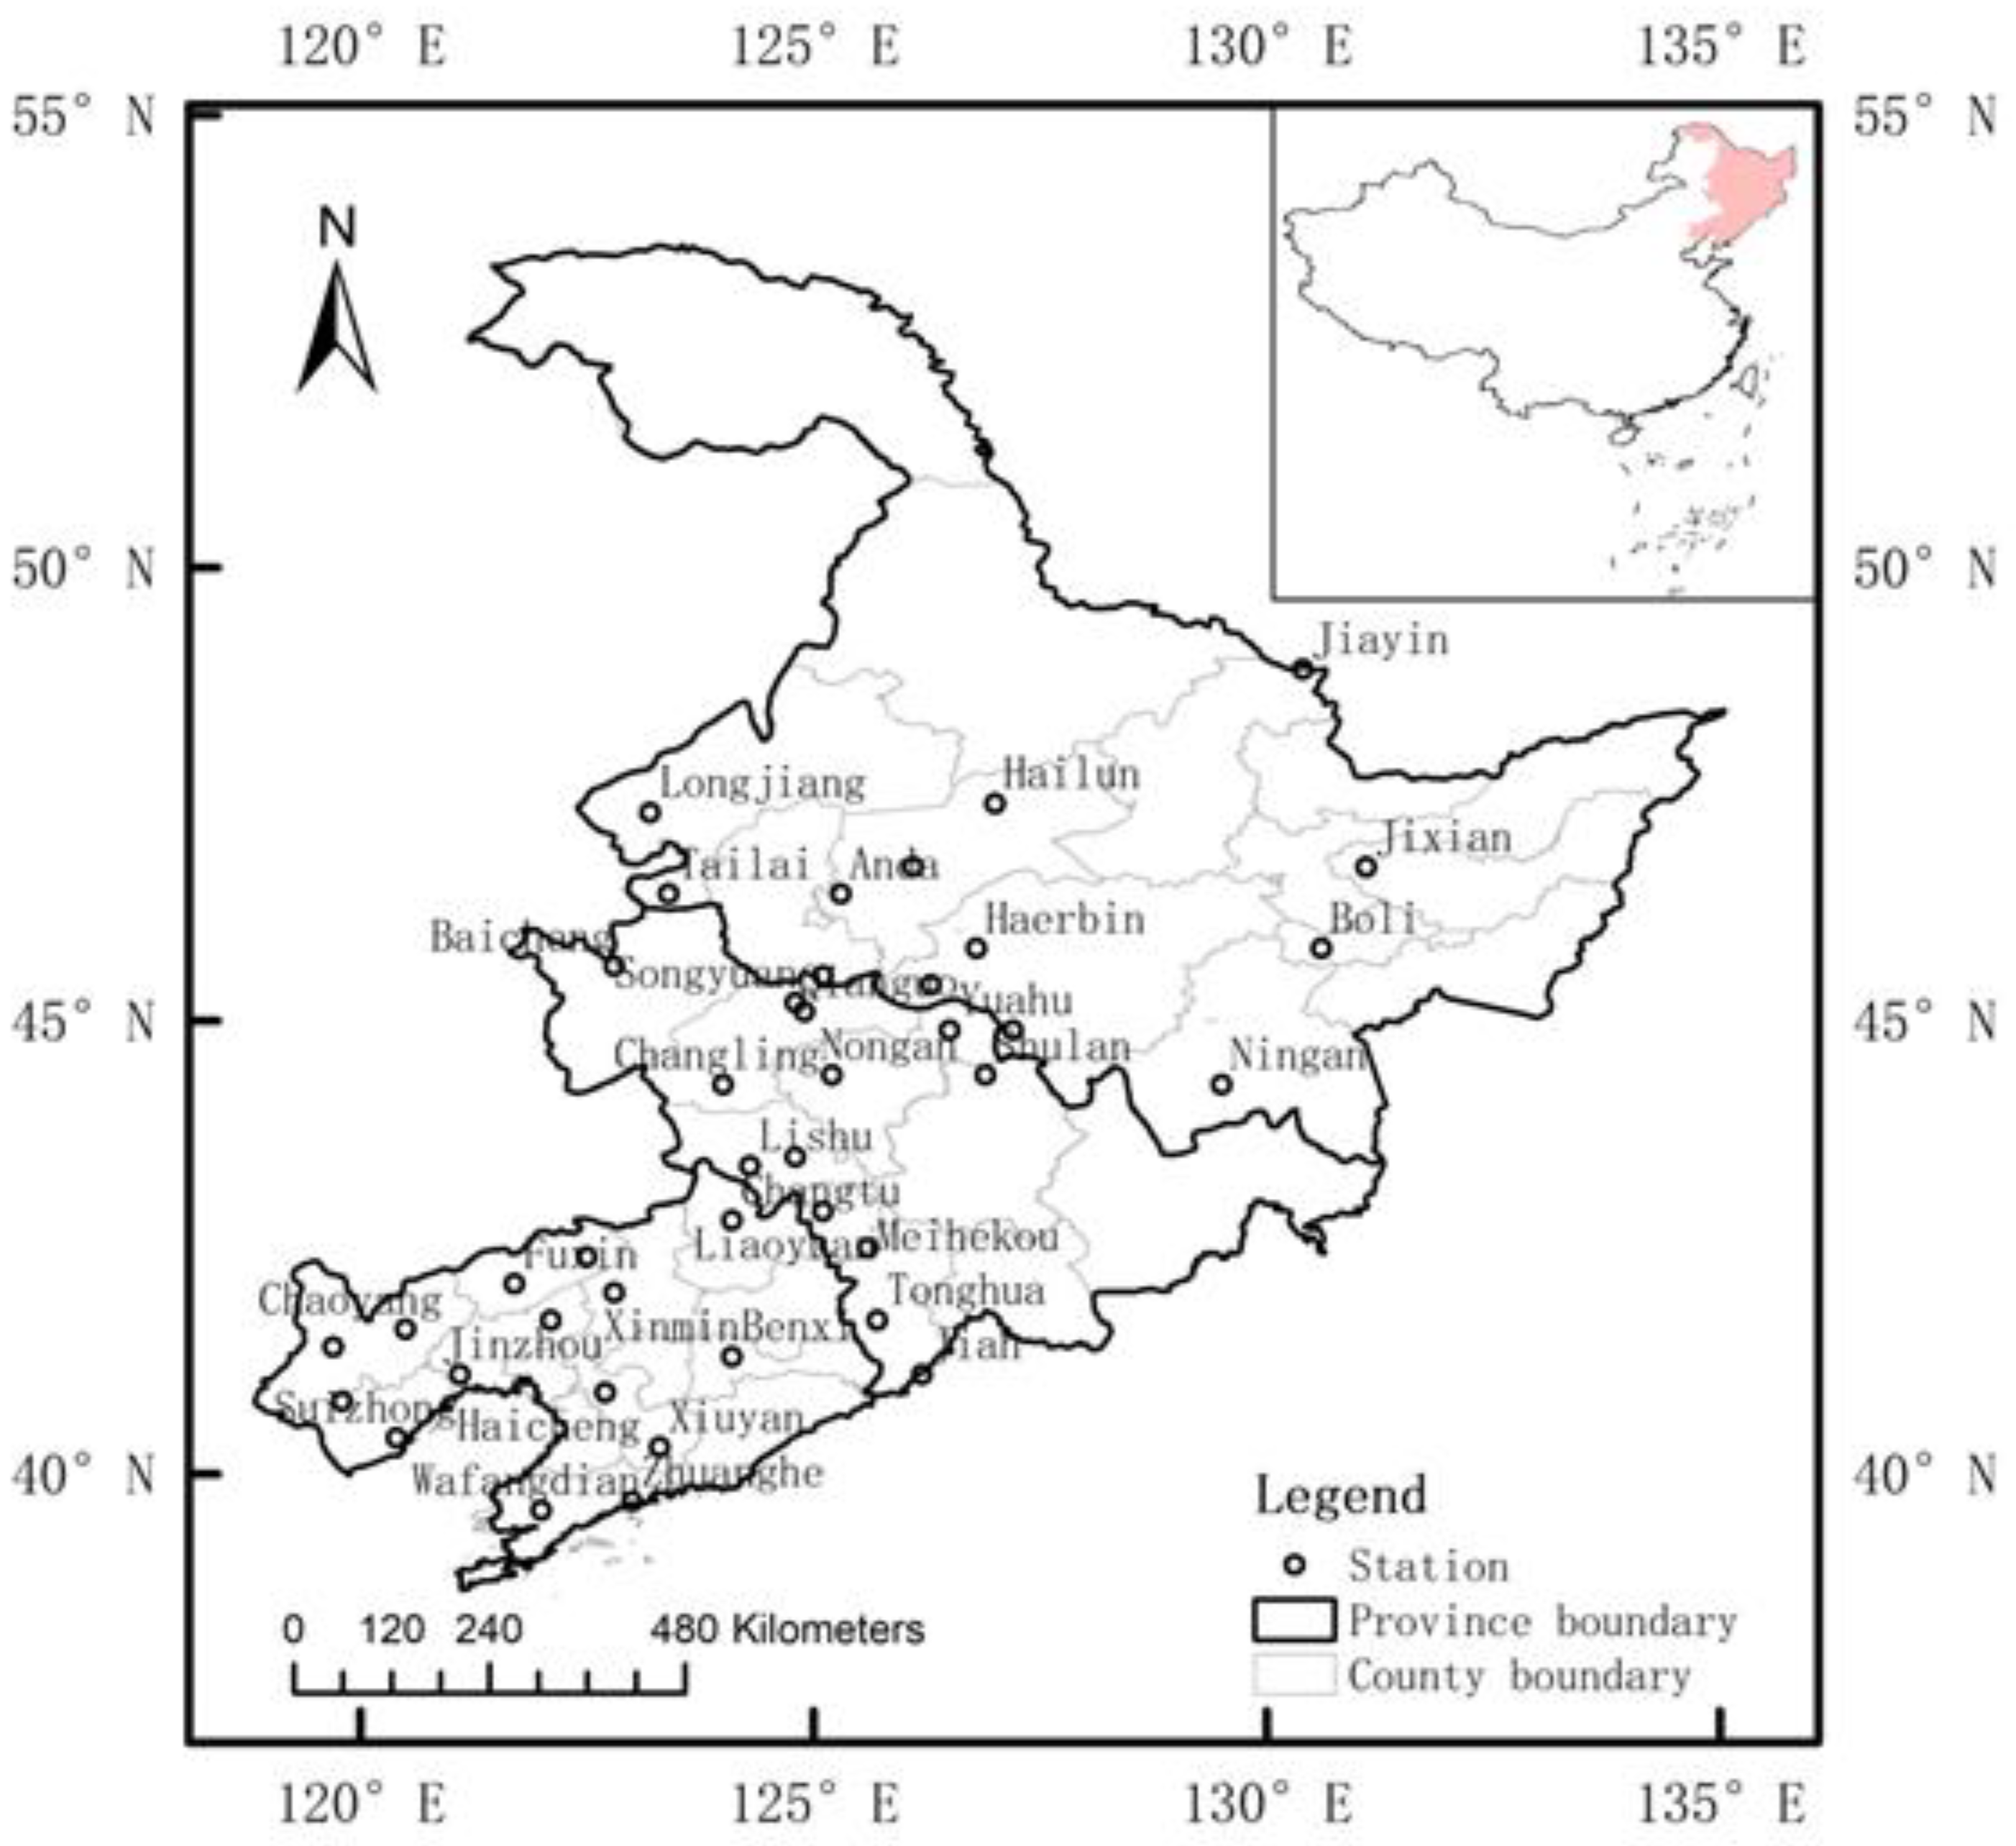
2.1. Study Area

The three provinces used in this study, i.e., Liaoning, Jilin, and Heilongjiang are located in northeastern China and have a temperate continental monsoon climate with four distinct seasons, rain and heat in the same season, and an annual average temperature range of −4 °C to 11 °C. The annual precipitation is 371–1084 mm, and around 80% of the total precipitation occurs in July-August. The annual sunshine hours range from 2219 h to 2952 h, and the heat conditions are suitable for one crop a year. The area is an important commercial grain production base in China and the land is mainly used to grow maize, rice, soybean, and spring wheat. Although the rain and heat in this area occur in the same season, the spatial and temporal distributions for precipitation are uneven and the evapotranspiration rate is high. Seasonal droughts, such as spring drought and spring and summer drought, often occur in the maize growing season, and there are clear regional droughts, which are, mainly distributed in the western part of northeast China [32,33]. Figure 1 shows the spatial distribution of agro-meteorological observation stations in northern China.

2.2. Data Description

The data used in this study were the daily average temperature, daily maximum temperature, daily minimum temperature, daily precipitation, daily sunshine hours, daily water vapor pressure, and daily average wind speed data from 172 meteorological observation stations in northeast China from 1981 to 2020, In addition, crop yield, and soil moisture content were measured every 10 days during the maize developmental phase and the growing season from 55 agro-meteorological observation stations. National 1:250,000 500 m × 500 m DEM geographic information data were used in this study [34].

2.3. Study Methods

2.3.1. Improving the Calculation Method for CWDI

CWDI is used to evaluate drought level by China’s National Standard Agricultural Drought Standard Grades, but the simulation accuracy of the CWDI needs to improve. Therefore, one of the aims of this study was to increase the accuracy of the CWDI model by improving the water supply and demand item data, such as the available soil water at emergence data, and by considering the effectiveness of precipitation, and change the ten-day crop coefficient to daily crop coefficient. This new method fully considers the cumulative effect of the crop water deficit on maize growth and yield. The improved crop water deficit index (CWDIwp) [35] calculation method is shown in Equations (1)–(5).
C W D I w p i = { 1 W e + P e i + I i E T c i 0 E T c i W e + P e i + I i E T c i < W e + P e i + I i
E T c i = i = 1 M ( K c i E T 0 i )
W e = 0.1 h ρ ( W W c )
where, CWDIwpi is the improved crop water deficit index, We is the soil effective water content to a soil depth of 20 cm at the time of crop emergence (mm), Pei is the sum of the daily effective precipitation from the start of emergence (mm), E T c i is the sum of the daily water demand volume from the start of emergence (mm), and Ii is the sum of the daily irrigation amount (mm) since crop emergence. The northeast China area is dominated by rain-fed agriculture, which means that the irrigation amount can be ignored. ET0i is the daily reference evapotranspiration (mm), Kci is the daily crop coefficient for maize, M is the number of days from crop emergence to maturity, h is the thickness of the soil layer (cm), ρ is soil bulk density (g cm−3), W is soil water content by weight (%), and Wc is the wilting moisture point(%). The calculation methods of evapotranspiration and crop coefficient refer to the literature [36].
p e i = u = 1 m P e u
p e u = α u P u
where, Peu is the u-th effective precipitation (mm), Pu is the u-th precipitation amount (mm); αu is the effective utilization coefficient, and m is the number of precipitation events. In general, the value for αu is as follows: when Pu ≤ 5 mm, αu = 0; when 5 mm < Pu ≤ 50 mm, αu = 0.9, and when Pu > 50 mm, αu = 0.75 [17,37].

2.3.2. Identification Method for Agricultural Drought Events

The duration and intensity of agricultural drought events were extracted from the CWDIwp series using run theory. Drought duration and intensity are shown in Figure 2. Drought intensity represents the drought degree of crops, and is the result of both the degree and duration of a crop water deficit. Taking 0 as the interception level, the period when the CWDIwp > 0 is defined as drought duration, and the cumulative CWDIwp during the drought duration is defined as the drought intensity S (Equation (6)).
S i = i = 1 Q C W D I w p i C W D I w p > 0
where Si is the drought intensity over the duration of the drought and Q is the drought duration (days).
The identification method for agricultural drought events during the maize growing season is as follows:
(1)
When CWDIwp is >0, it is preliminarily determined that drought has occurred during this period.
(2)
If drought events have a duration of <5 days and the drought intensity is <0, then it is considered that no drought has occurred.
(3)
For a drought event >5 days, when the duration of two consecutive drought events is <10 days and the CWDIwp value during this period is 0, then the two adjacent drought events are merged into one in terms of drought intensity and duration. Otherwise, two adjacent drought events are considered to be two independent drought events.
Typical drought years were selected for Pearson’s analysis between yield loss, and drought duration and intensity, with correlation coefficients (p < 0.01) of −0.561 and −0.682, respectively. The optimal segmentation method was used to determine the thresholds of the drought duration and intensity two-factor indicator for agricultural drought events (Table 1).

2.3.3. Construction of Marginal Distribution Functions for Drought Duration and Intensity

The γ-distribution, the normal distribution, the lognormal distribution, the Wilson distribution, the Poisson distribution, and the exponential distribution functions were selected to fit the drought duration and intensity. The probability density function of the distribution function is shown in Table 2. The maximum likelihood method and the Kolmogorov Smirnov (K-S) method were used for parameter estimation and the goodness of fit test, respectively, to test whether the empirical distribution function conformed to the selected theoretical distribution.

2.3.4. Conditional Probability

Once the binary drought distribution function based on Copula function is determined, it is easy to obtain the conditional probability distribution of the functional. When considering the probability of a binary distribution function, the most common method is to estimate both the probability distribution of the selected variable when one of other the variables exceeds a certain threshold and the joint transcendence probability that both meet a certain condition at the same time [38]. The following are the conditional probabilities for a given drought duration (Equation (7)), a given drought intensity (Equation (8)), and the joint probability distribution that both satisfy a certain condition at the same time (Equation (9)).
P ( S s | D d ) = P ( D d , S s ) P ( D d )
P ( D d | S s ) = P ( D d , S s ) P ( S s )
P ( D d S s ) = 1 F D ( d ) F S ( s ) + C ( F D ( d ) , F S ( s ) )

2.3.5. Copula Joint Probability Distribution Function

Based the correlation between variables results, the optimal joint distribution func-tion for drought duration and intensity can be determined by the Copula function [39]:
F ( d , s ) = P ( D d , S s ) = C ( F D ( d ) , F S ( s ) )
Table 3 shows the density functions of the five Copulas and the value ranges for the parameters. The squared Euclidean distance between the empirical distribution function and the theoretical distribution function [40], and the Akaike information criterion method [41] (Akaike information criteria, AIC) can be used to estimate the parameters of the Copula function.

2.3.6. Determination of the Recurrence Period

The recurrence period for univariate variables is
T ( d ) = N n [ 1 F ( d ) ]                                 T ( s ) = N n [ 1 F ( s ) ]
where T(d) is the recurrence period of the drought duration, T(s) is the recurrence period of the drought intensity, n is the number of drought events, and N is the length of the drought sequence.
The co-occurrence recurrence period for two variables is:
T ( d , s ) = N n P ( D d S s ) = N n ( 1 F D ( d ) F S ( s ) + C ( F ( d ) , F ( s ) )

2.3.7. Calculation Method for the Yield Reduction Rate

The yield reduction rate is calculated by comparing the actual output with the trend output:
I y = ( 1 Y / Y t ) × 100
where Iy is the yield reduction rate (%), Y is the actual yield (kg hm–2), and Yt is the trend yield (kg hm–2). The trend yield was simulated by the 5-year linear moving average.

3. Results

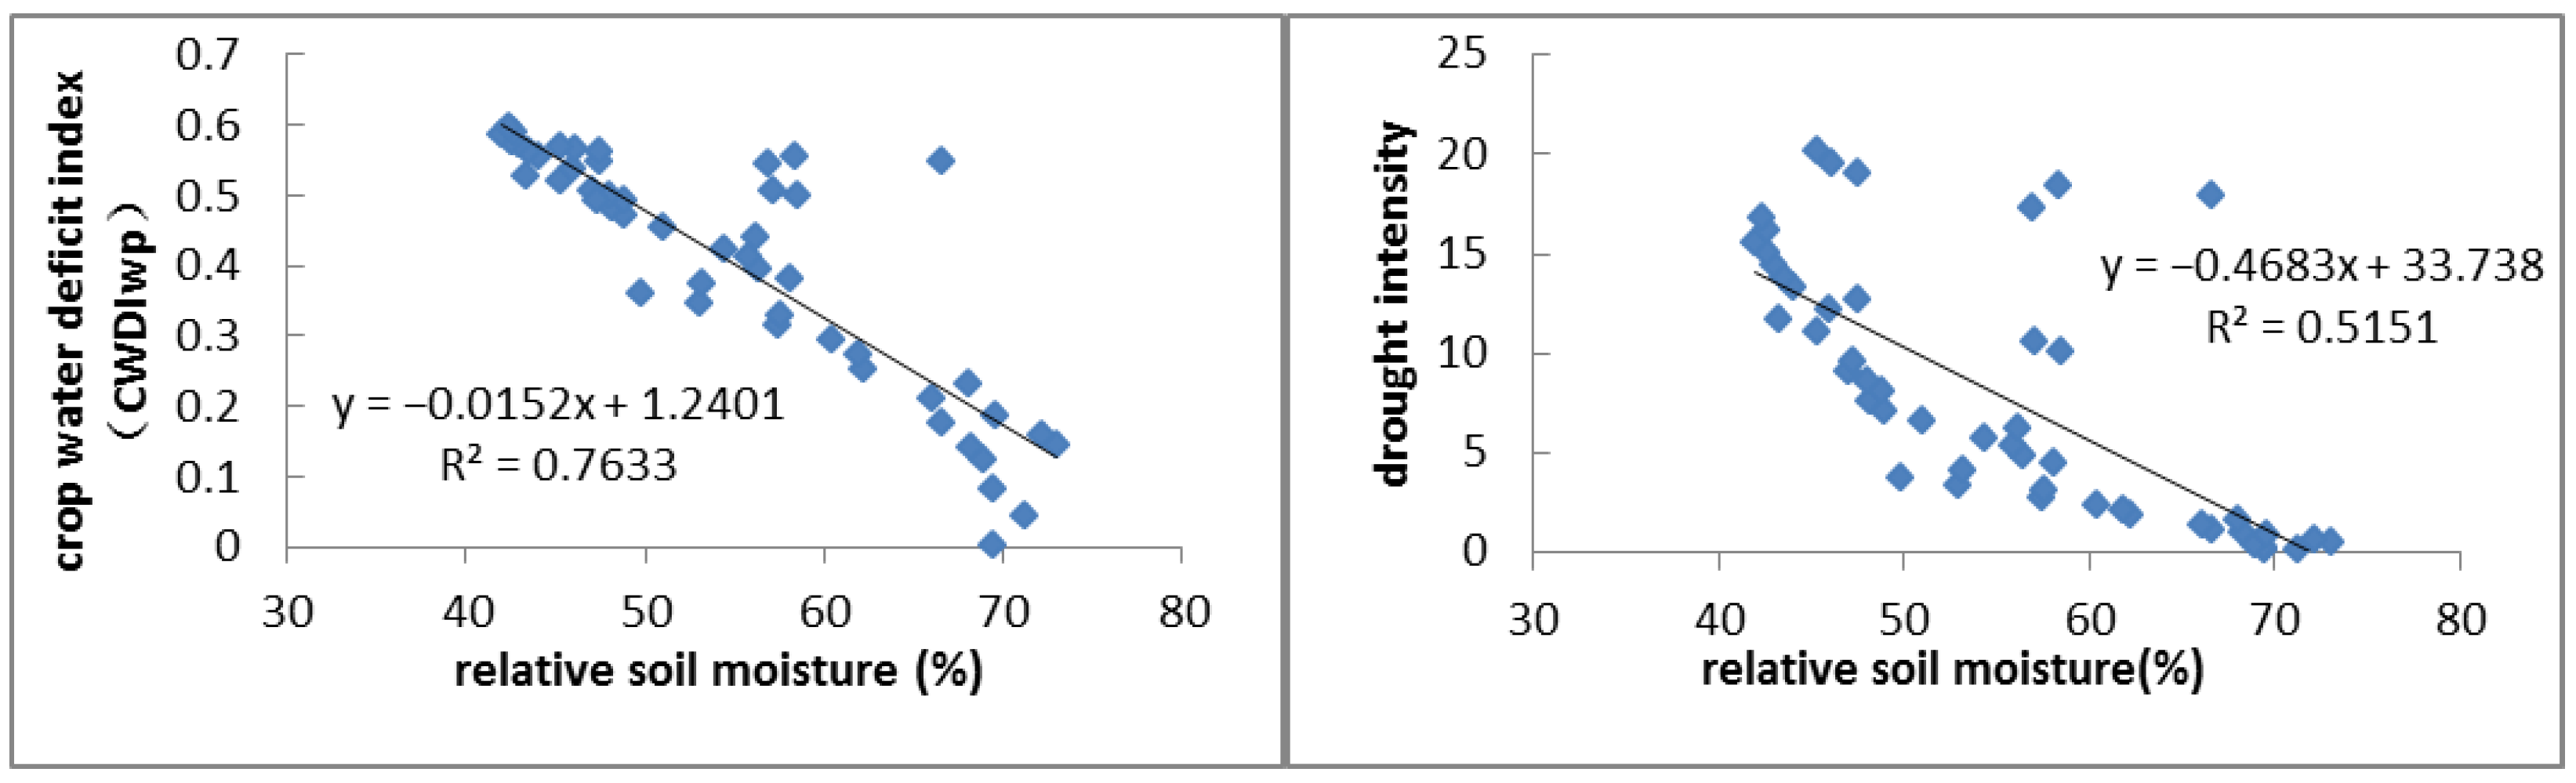
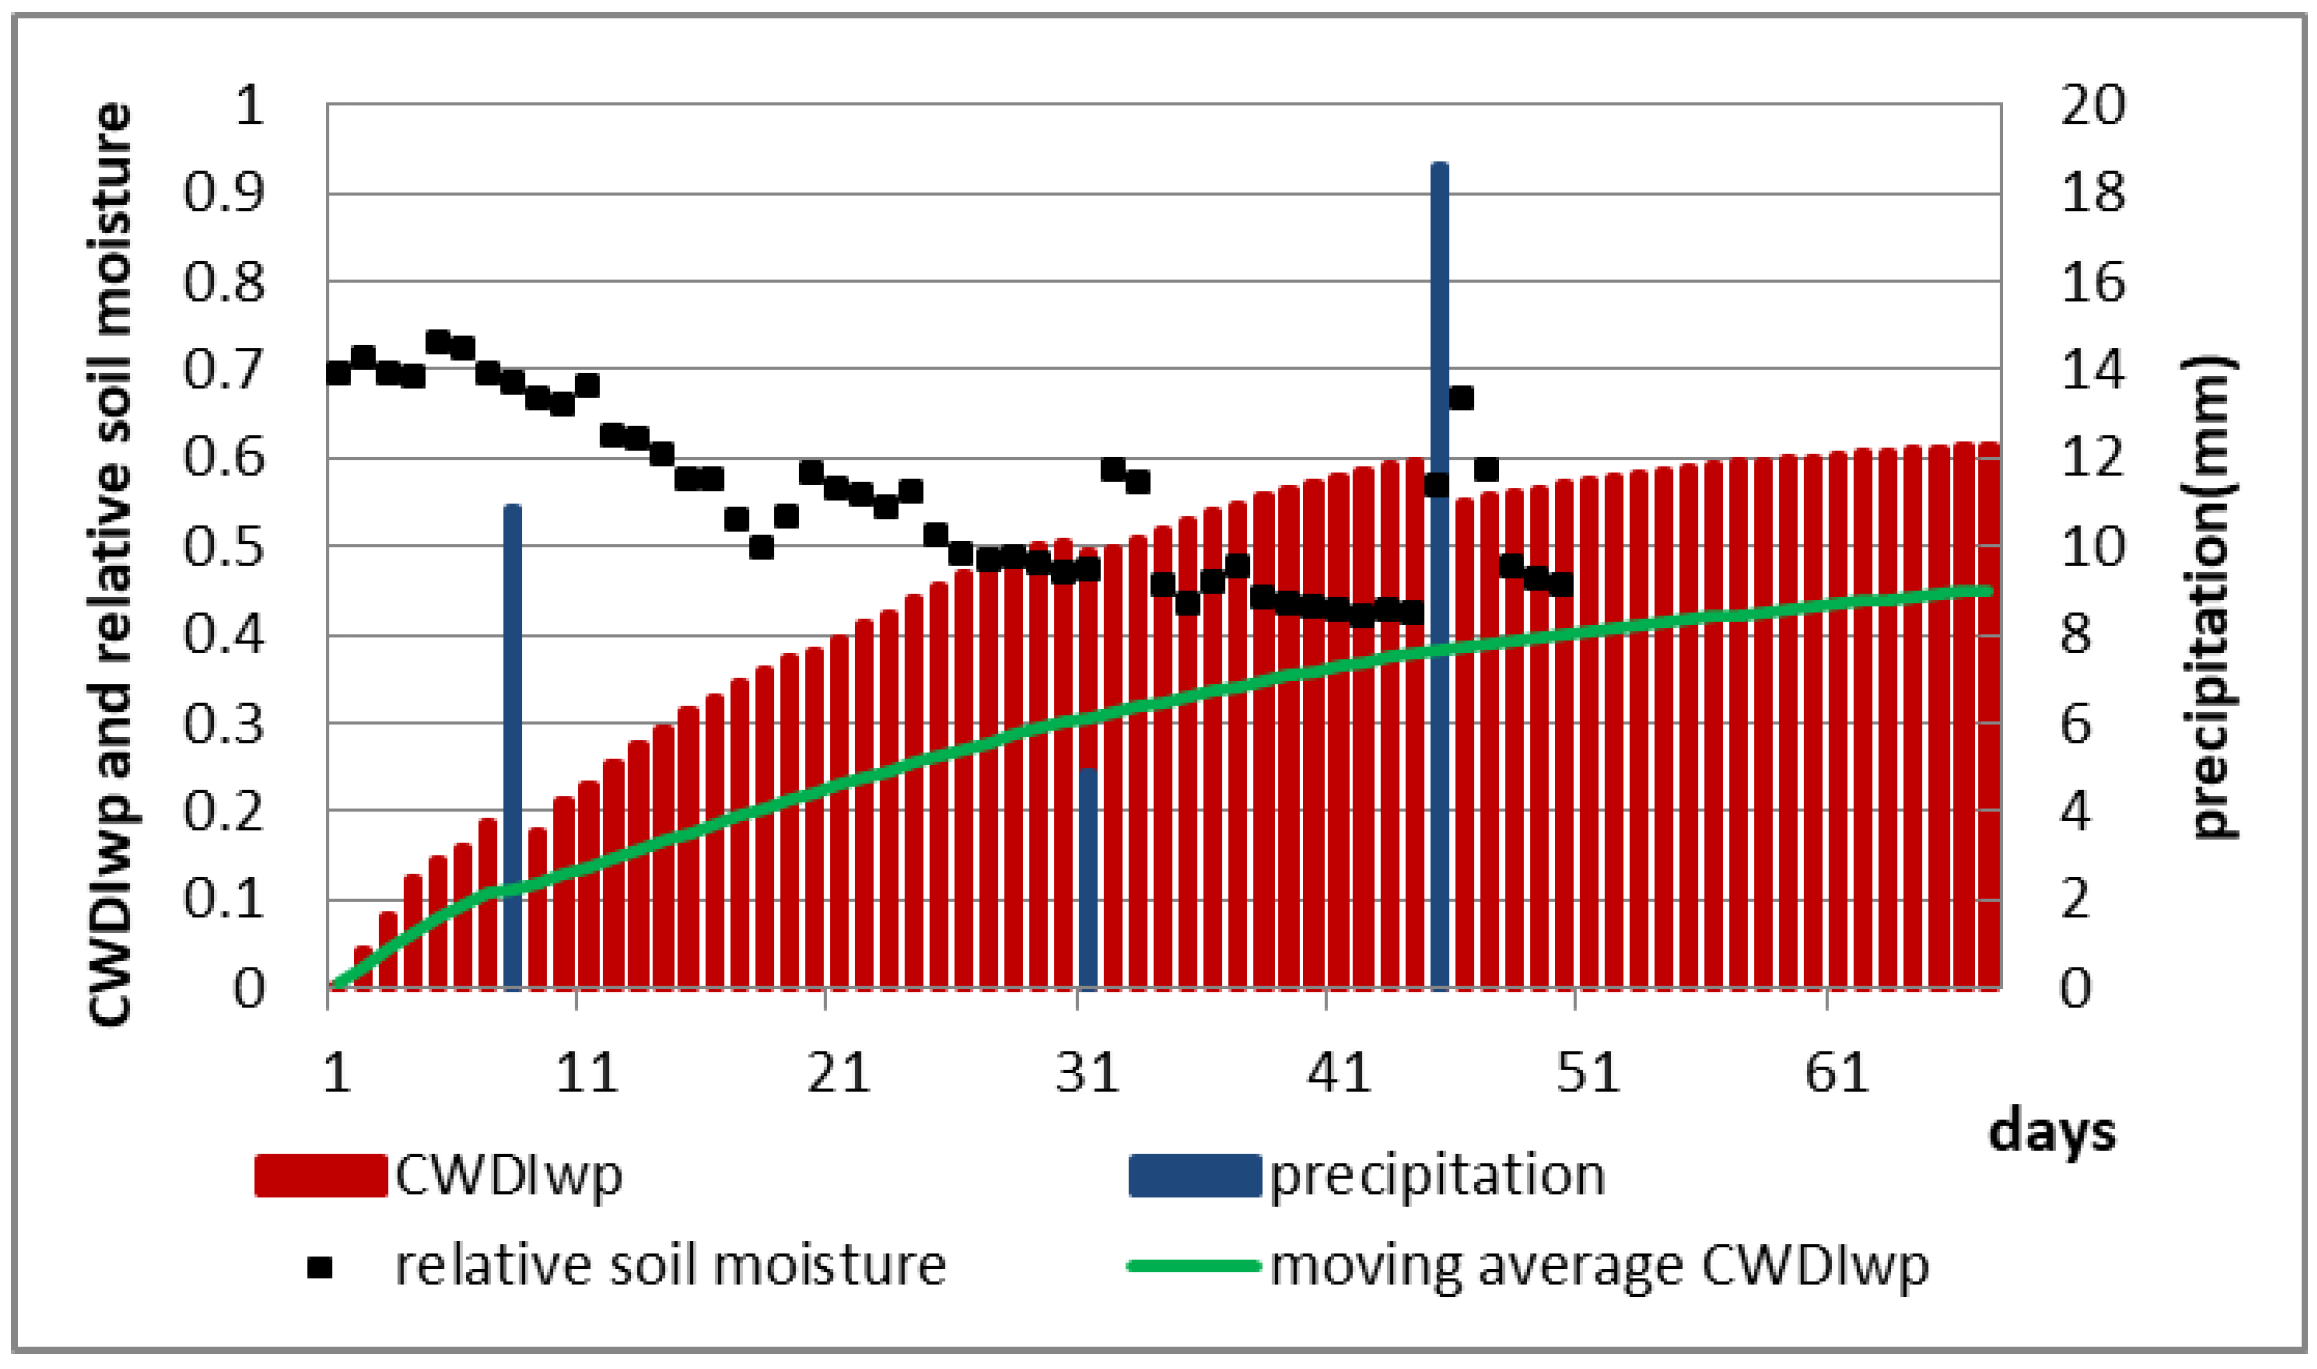
3.1. Identification and Validation of Agricultural Drought Events

The 2006 daily soil moisture observations at Fuxin station were used to verify the applicability of the CWDIwp model.
As can be seen from Figure 3, the CWDIwp, drought intensity, and relative soil moisture content had significant negative correlations. The lower the relative soil moisture content, the more severe the crop water deficit and the stronger the drought severity.
In 2006, Fuxin experienced a continuous drought event during summer and autumn. As shown in Figure 4, the drought began on 13 July. When the CWDIwp reached 0.48, the drought intensity was 7.5, and when the drought event was 27 days old it entered a moderate drought period, during which three precipitation events (34.38 mm in total) were recorded. However, the relative soil moisture content fluctuated between 40 and 50%. When the maize reached maturity, the CWDIwp was 0.61 and the drought intensity was 30.2, which lasted for 67 days and resulted in a yield reduction rate of 23.9%, suggesting a severe drought event.
A typical drought year (2020) in northeast China was selected to validate the CWDIwp index and the two-factor threshold index for agricultural drought events. From late June to late August 2020, a severe drought occurred in the southwest of northeast China that had a severe impact on crop growth and yield formation at a critical stage for crop growth. The results showed that 79 meteorological sites experienced drought in Northeast China. The drought degrees for 76 of the sites were completely consistent with that calculated by the index and the drought degrees for the other three sites were one grade different from the historical record. The anastomosis rate was 96%, indicating that the index accurately reflected the occurrence information for agricultural drought events.

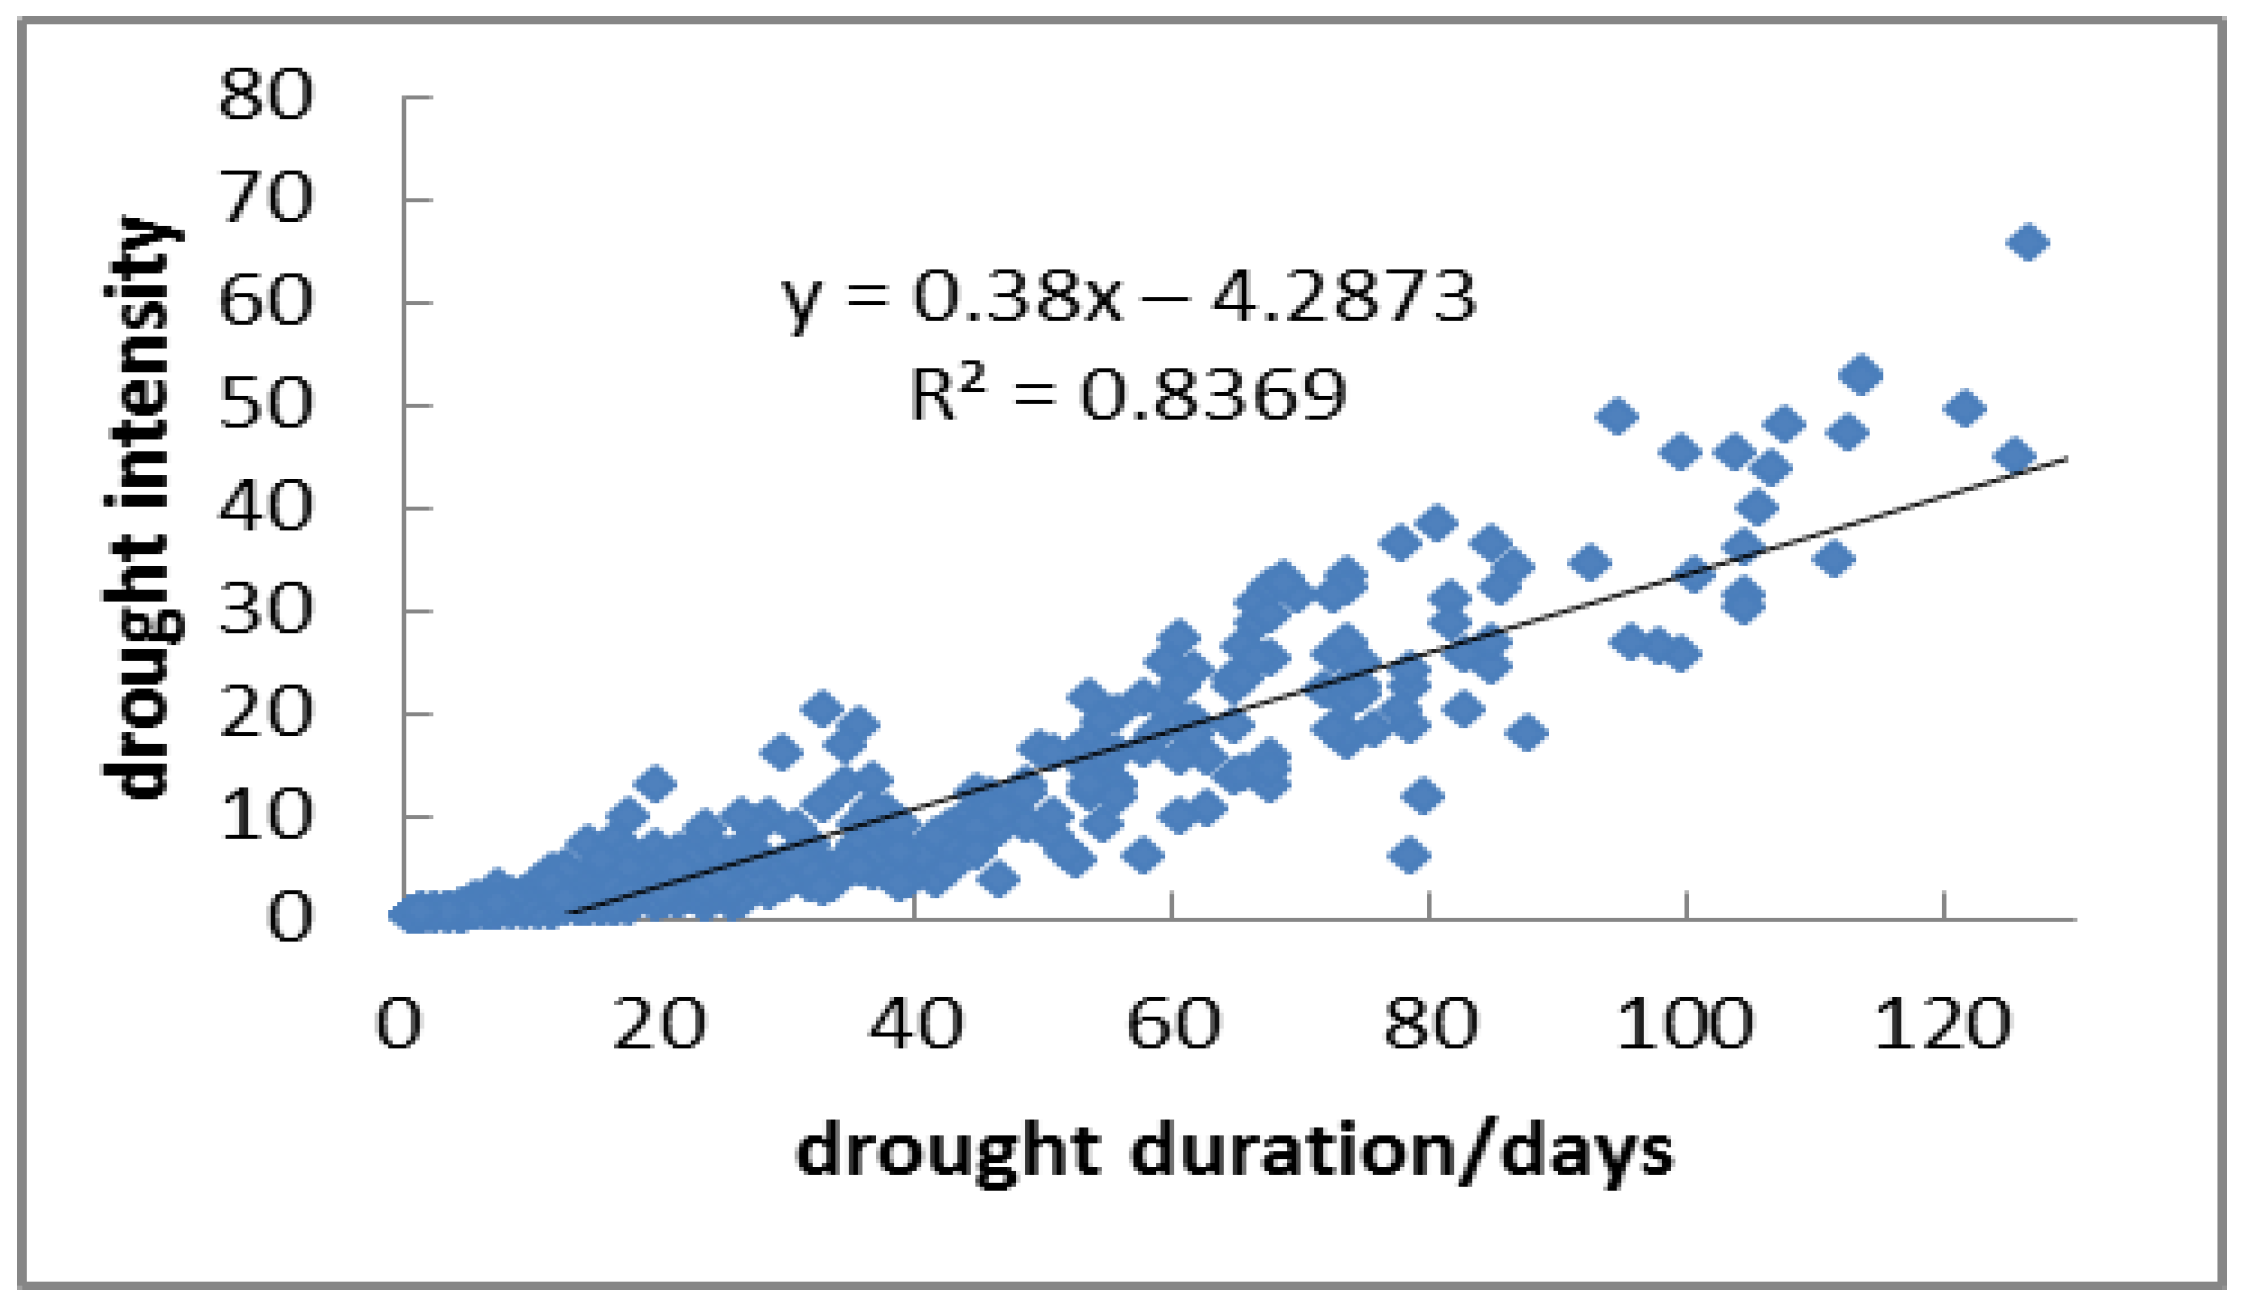
3.2. Correlation between Drought Duration and Drought Intensity

Run theory was used to extract the drought duration and intensity values for agricultural drought events from 1981 to 2020 at 55 meteorological stations in northeast China. The year and start and end dates for the agricultural drought events were also extracted. There was a significant positive correlation between drought duration and drought degree in Northeast China with correlation coefficients between 0.56 and 0.97. Figure 5 shows the correlation relationship between drought duration and drought severity at the 15 sites in Liaoning Province. This significant correlation indicated that a joint distribution of drought variables can be constructed using the Copula function.

3.3. Establishment of the Joint Distribution Function for Agricultural Drought Events Based on the Copula Function

Kendall and Spearman rank tests were performed on the marginal distribution functions for drought duration and drought intensity at 40 meteorological stations in Northeast China (excluding stations without drought) and the results showed that the Kendall rank correlation coefficient was above 0.8 and the Spearman rank correlation coefficient was up to 0.99. The corresponding distribution functions for drought duration and drought intensity were determined based on the goodness of fit and were found to have an exponential distribution and a gamma distribution, respectively. The high correlation between drought duration and intensity meant that a joint distribution function for the two variables could be established. The Clayton function had a minimum AIC of 38 of the 40 stations. Therefore, the Clayton function was chosen as the optimal fitting function.

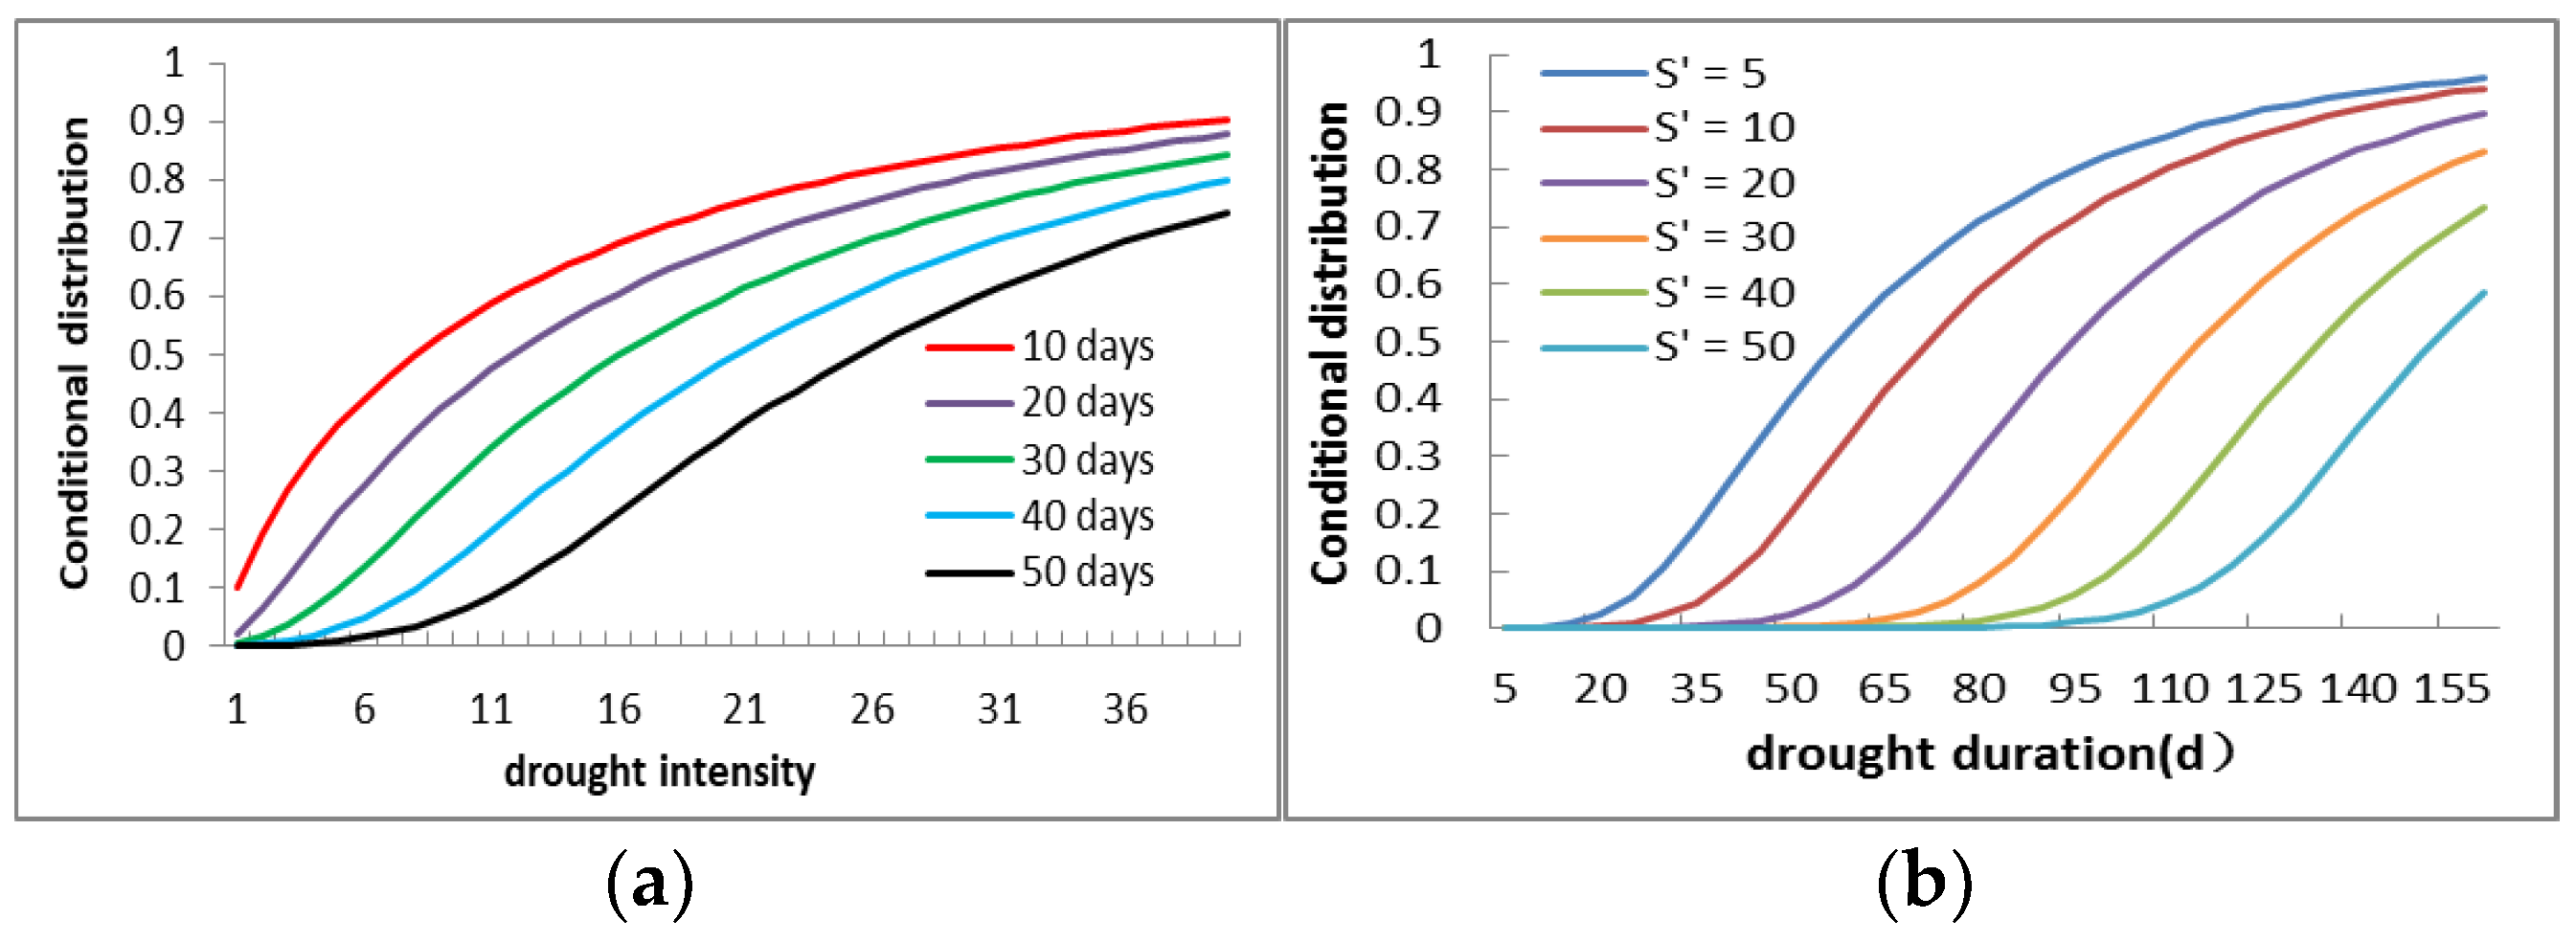
3.4. Conditional Probability Analysis of Agricultural Drought Events

Figure 6a,b shows the conditional probability distribution for different drought intensity and drought duration thresholds at Fuxin Station, respectively. The conditional probability for drought intensity (drought duration) decreased with the increase in drought duration threshold (d’) (drought intensity threshold is represented by s’). When the given drought duration is ≥20 days, the probability of a drought intensity ≤10 is 56% and when the drought duration is ≥30 days, then the probability of a drought intensity ≤10 is 30%. When the given drought intensity is ≥10, the probability that the drought lasted ≤30 days is 2.2%, but when the drought intensity ≥20, the probability that the drought lasted ≤30 days is 0.17%.

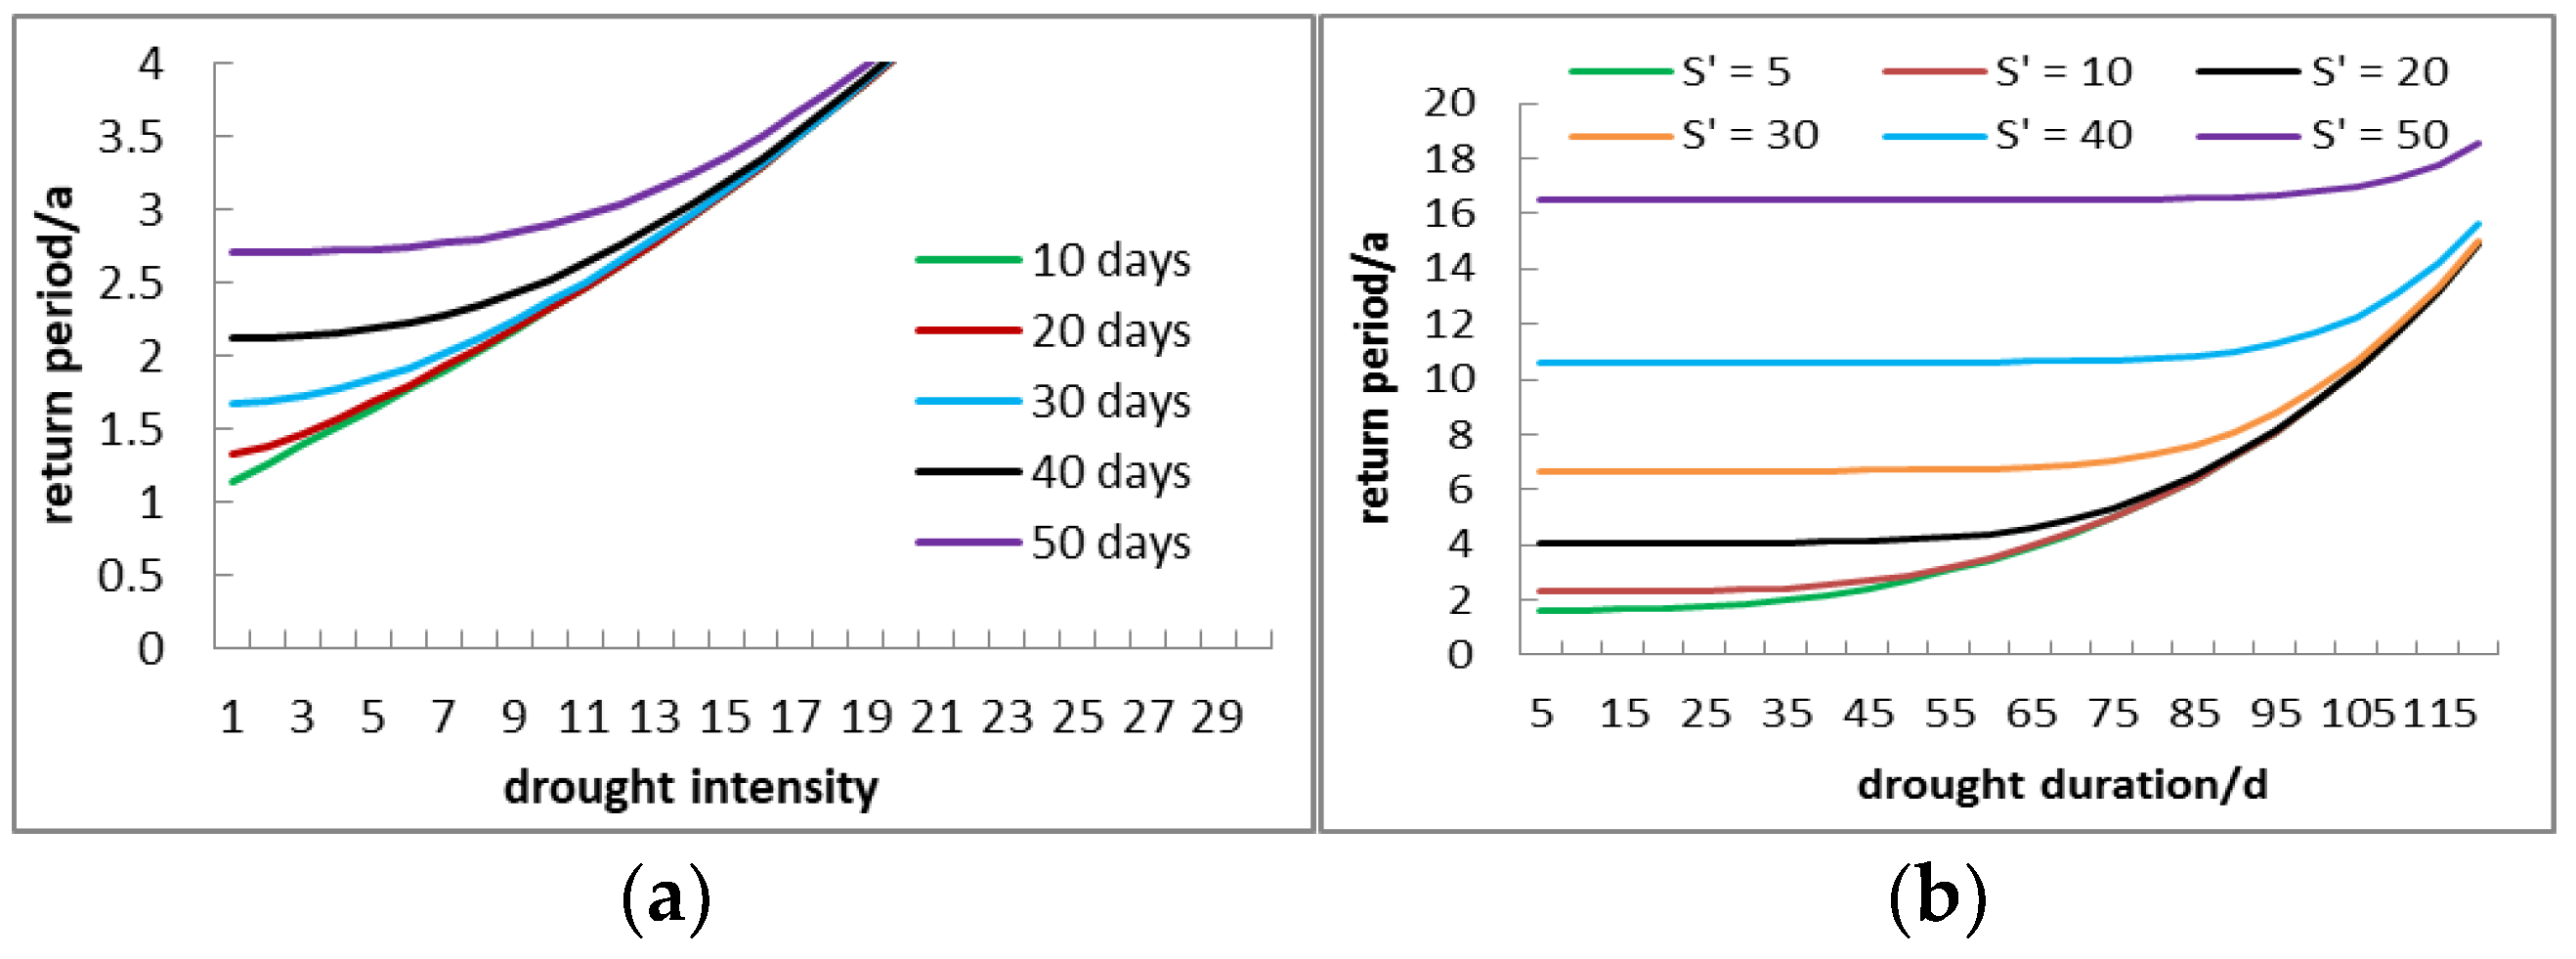
3.5. Joint Recurrence Period Analysis of Agricultural Drought Events

Figure 7a,b shows the recurrence period for a given drought intensity and drought duration thresholds at Fuxin Station, respectively. The recurrence period for drought intensity (drought duration) increases with the increase in drought duration threshold. When the drought duration ≥20 days and the drought intensity is ≥10, then the recurrence period for drought events is 2.3 years and when the drought duration is ≥30 days and the drought intensity is ≥10, then the recurrence period for drought events is 2.4 years. When the drought intensity ≥20 and the drought duration is ≥20 days, then the recurrence period for drought events is 4.07 years, but when the drought intensity ≥30 and the drought duration is ≥20 days, the recurrence period for drought events is 6.68 years.

3.6. Spatial and Temporal Distribution Characteristics of Agricultural Drought Events

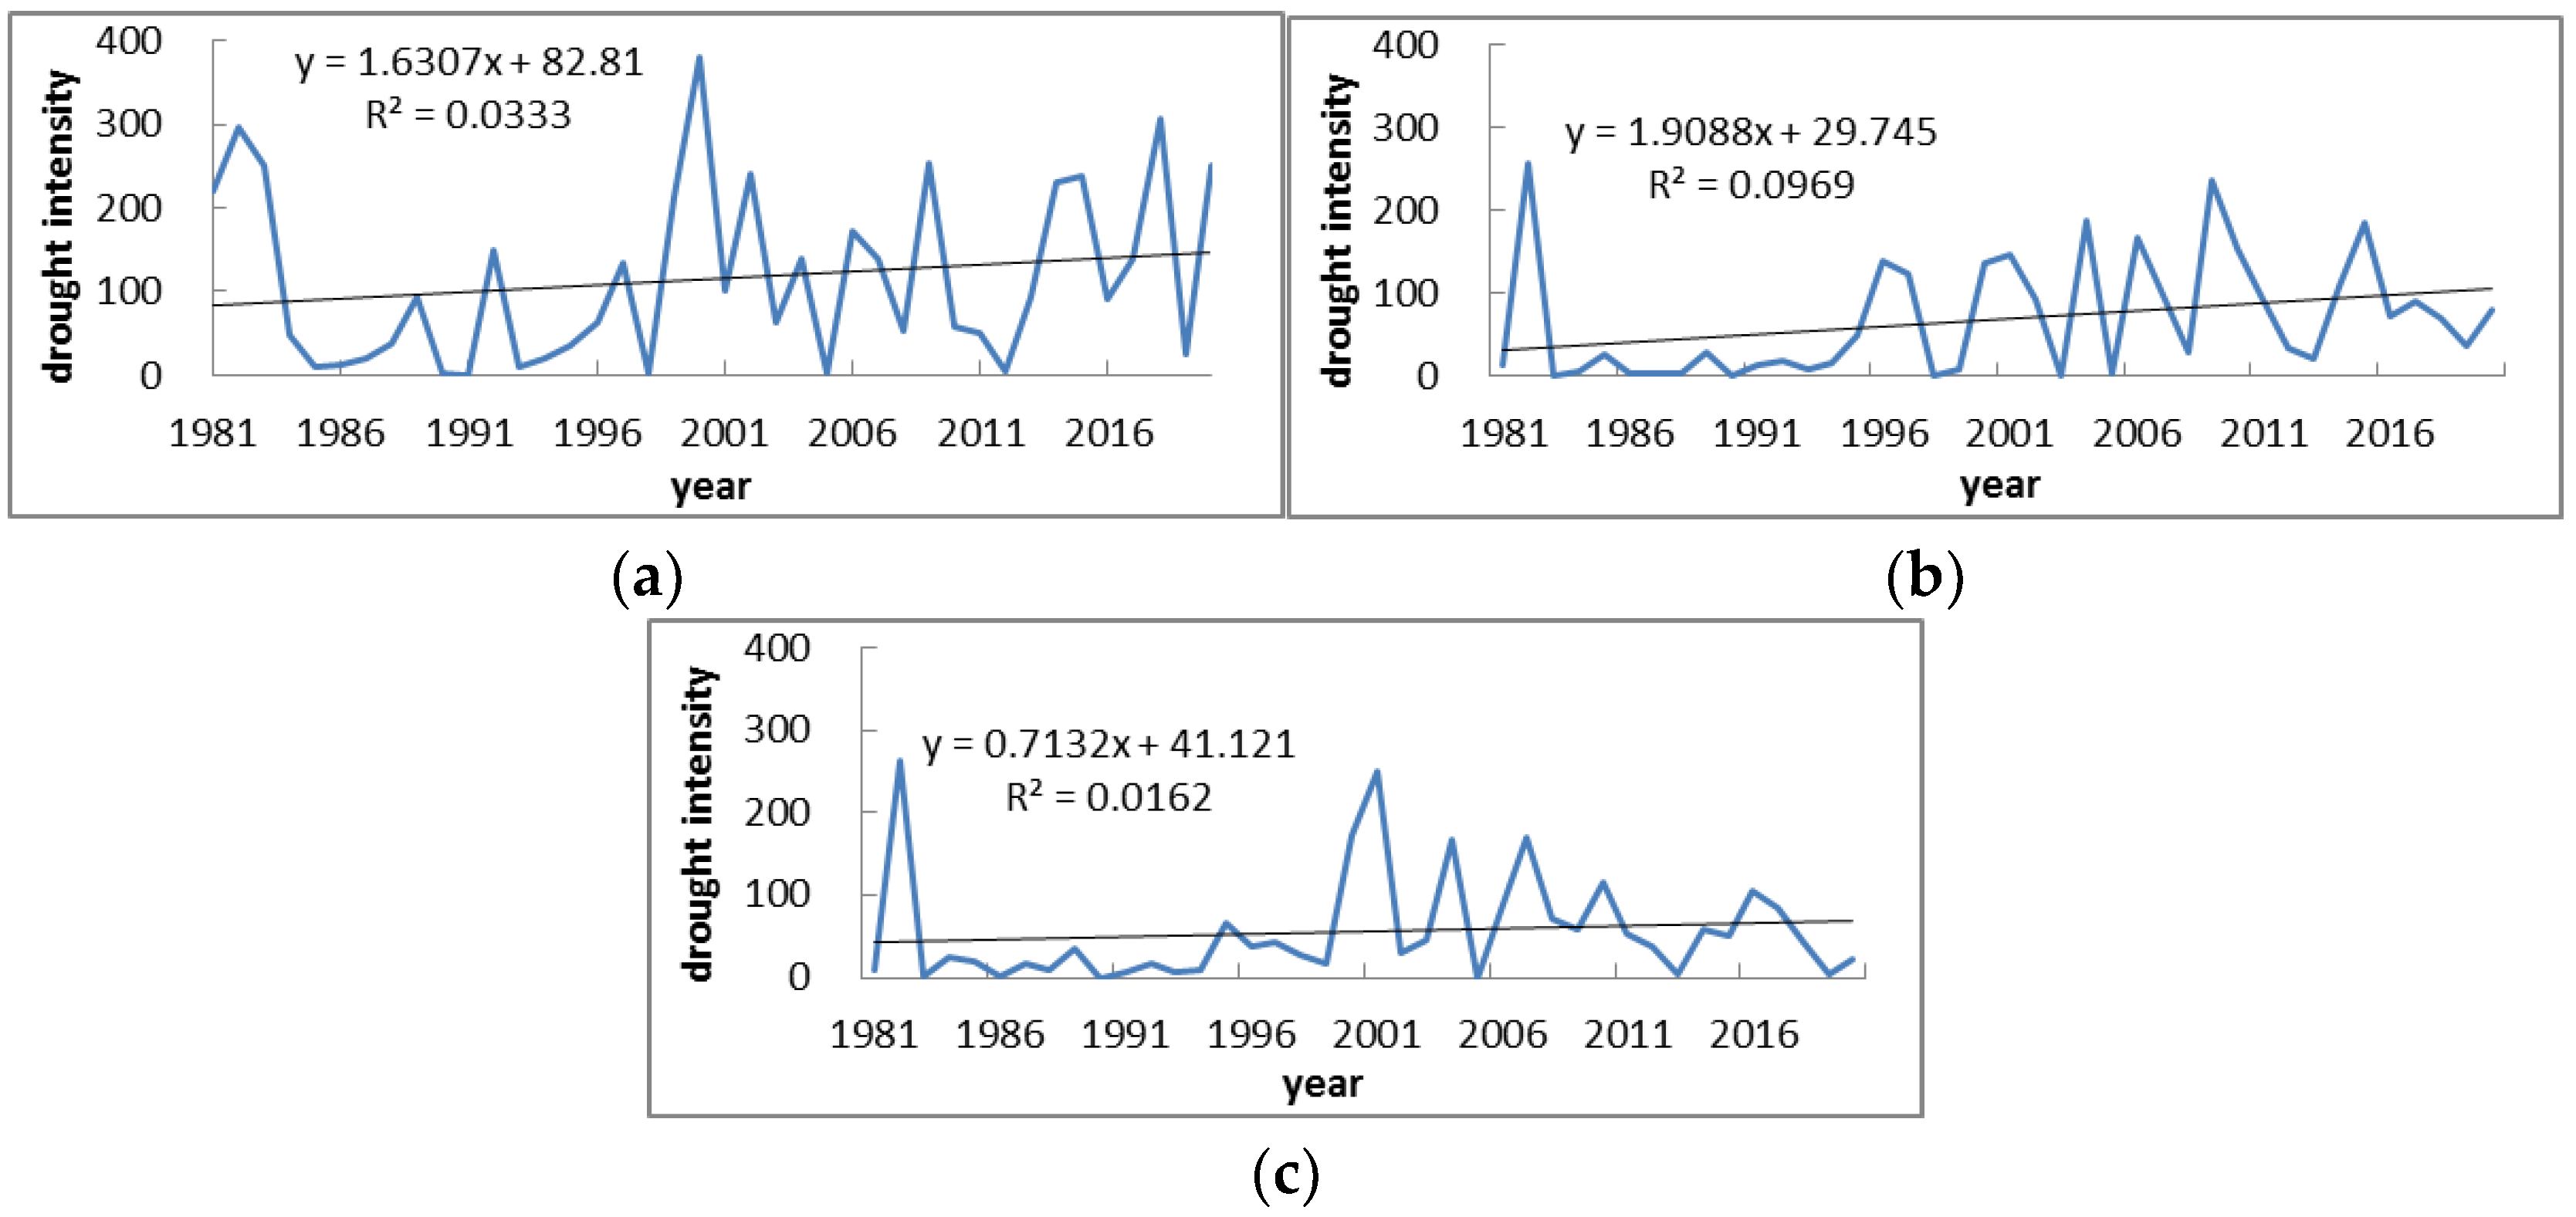
3.6.1. Time Series Analysis of Drought Intensity

Figure 8 shows the temporal trend in drought intensity for each of the three Northeastern provinces. The agricultural droughts in the Northeastern provinces from highest to lowest are Jilin Province > Liaoning Province > Heilongjiang Province. There were more agricultural drought events in the early 1980s, but then there were fewer drought events. In the middle and late 1990s, agricultural drought events showed an increasing trend. Severe drought events occurred in Liaoning Province in 1981–1983, 1989, 1992, 1997, 1999–2002, 2004, 2006–2007, 2009, 2014, 2015, 2018, and 2020; in Jilin Province in 1982, 1996–1997, 2000–2002, 2004, 2006, 2007, 2009–2011, 2014–2015, and 2017; and in Heilongjiang Province in 1982, 2000–2001, 2004, 2007, 2010, and 2016.

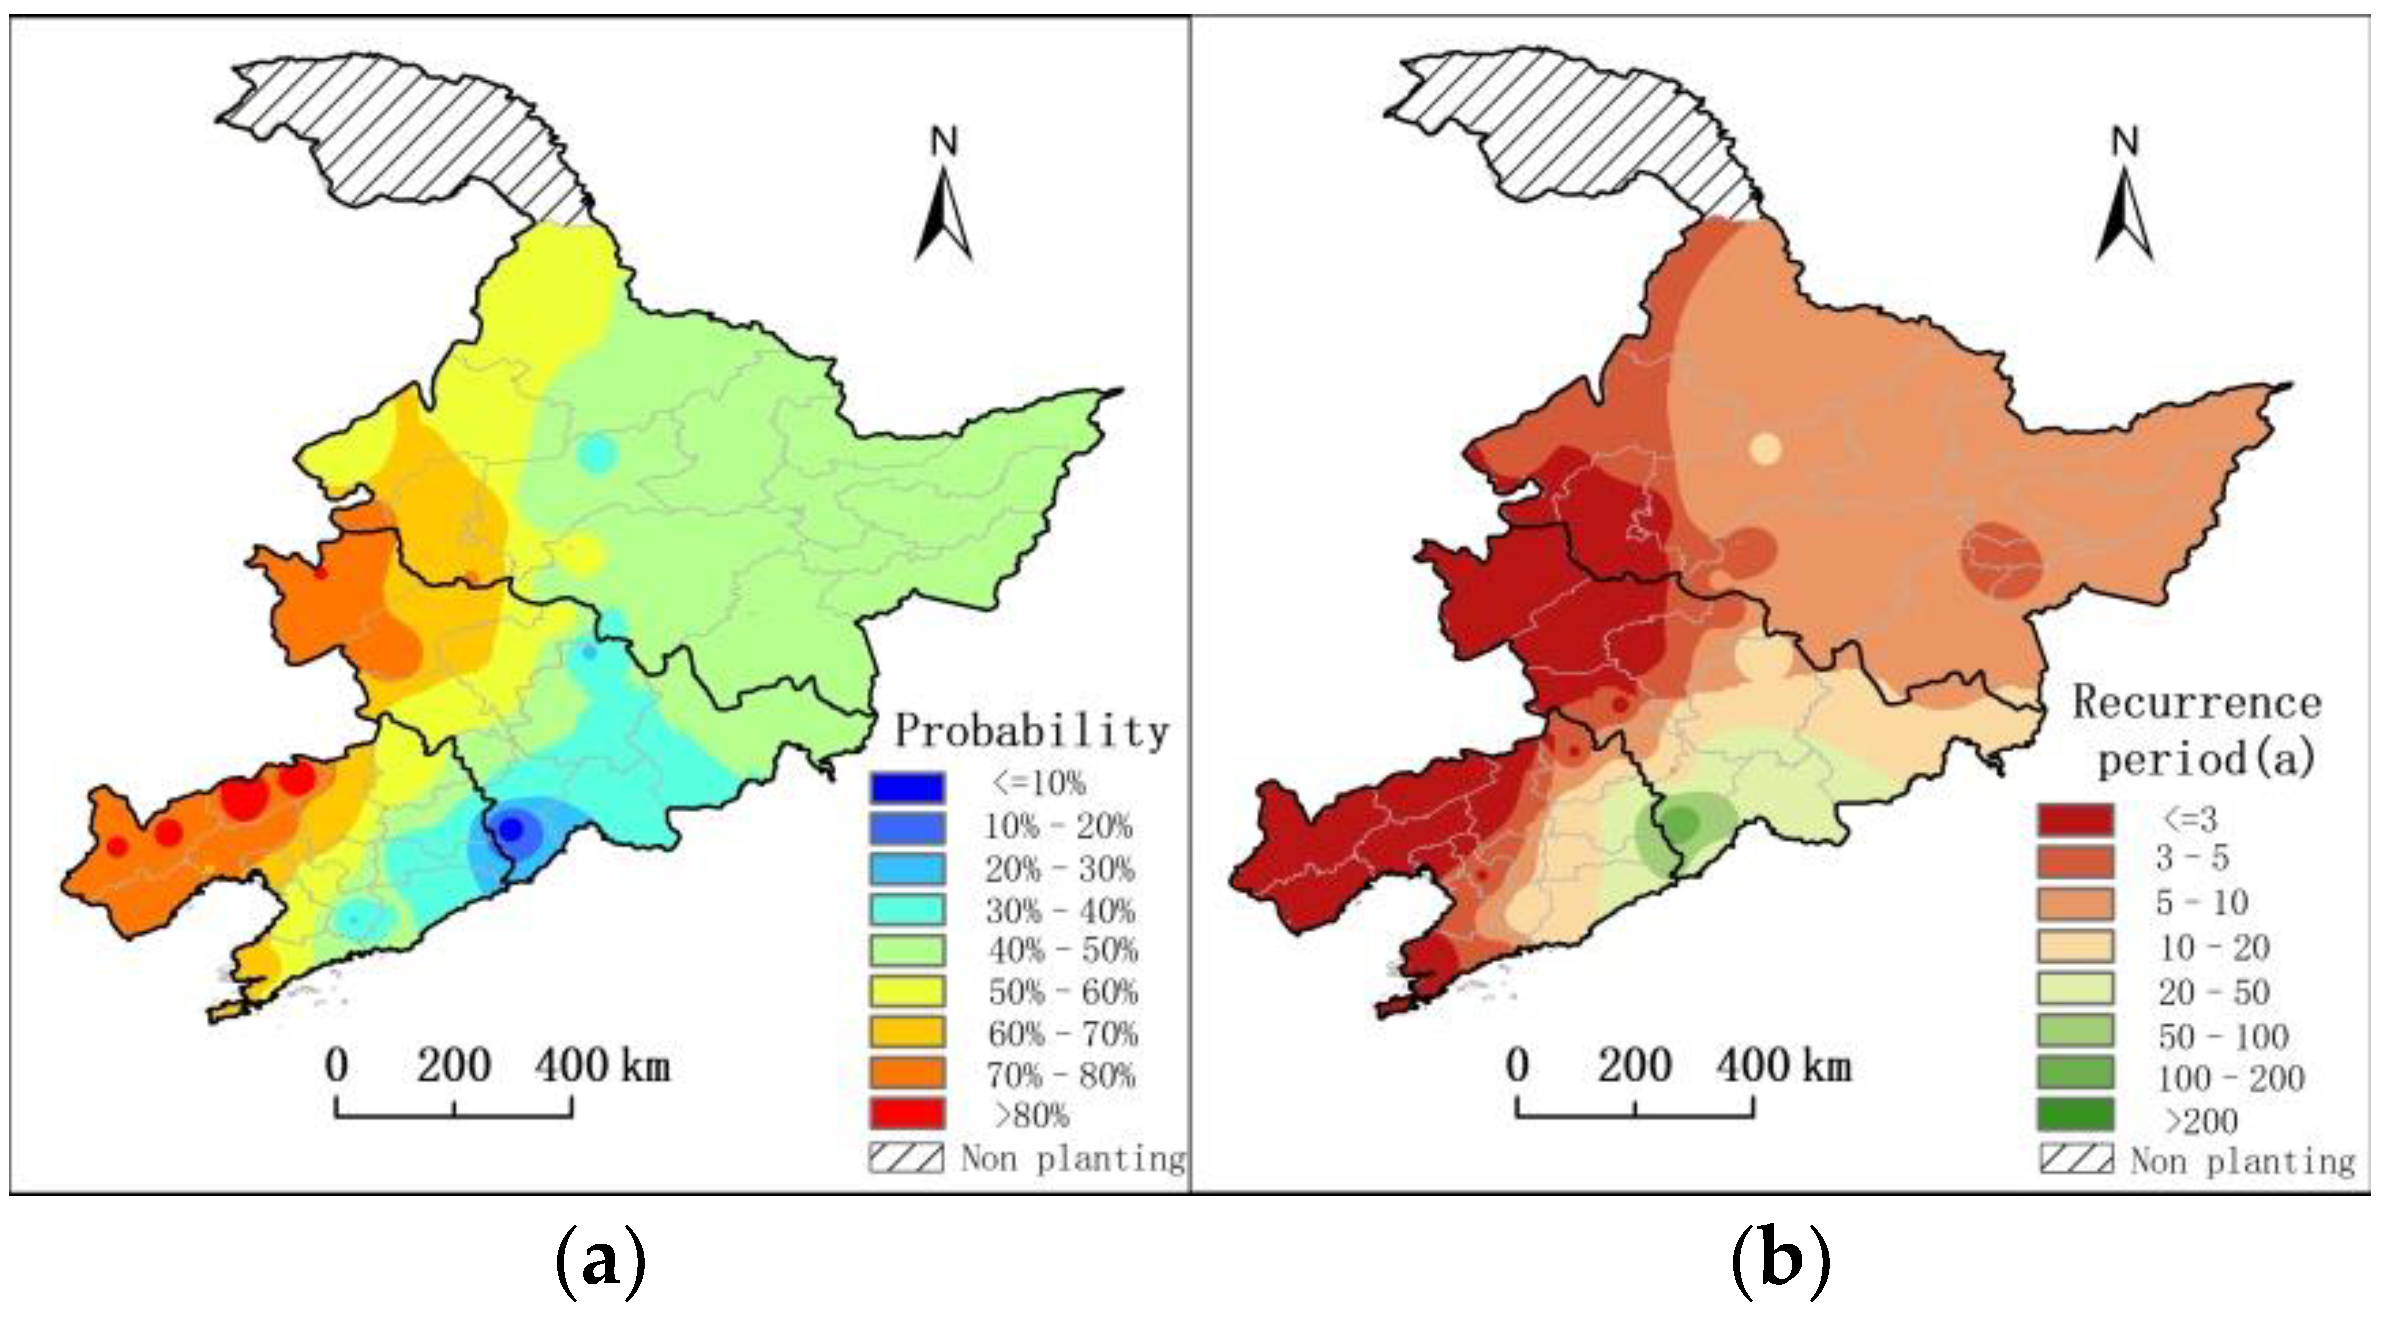
3.6.2. Spatial Distribution Characteristics of the Agricultural Drought Event Joint Probabilities and the Co-Occurrence Recurrence Periods

Figure 9 shows the spatial distributions of the joint probabilities and co-occurrence-recurrence periods for bivariate (drought duration and drought intensity) features of agricultural drought events in Northeast China. The joint probability of an agricultural drought event showed a decreasing trend from west to east. The distribution trend for the co-occurrence-recurrence periods showed an opposite trend, with the high probability area corresponding to the low recurrence period area. This indicated that the joint probability of the occurrence of drought was higher in drought-prone areas. As shown in Figure 9a, the high drought value areas were in western and southern Liaoning, western Jilin, and southwestern Heilongjiang with a range of 50 to 87%. The low-value areas were distributed in the mountainous areas of eastern Liaoning and eastern Jilin with drought occurrence values of below 40%. The remaining areas are between 40 and 50%. Figure 9b shows that the drought high-risk areas are in western and southern Liaoning, western Jilin, and southwestern Heilongjiang, with co-occurrence-recurrence periods of 1–3 years. Specifically, Baicheng and Fuxin have co-occurrence-recurrence periods of just one year.

3.6.3. Probability Spatial Distribution Characteristics of Agricultural Drought Events with Varying Severities

Figure 10 shows the joint probability spatial distributions of the bivariate characteristics associated with agricultural drought events with different grades in Northeast China. As shown in Figure 10, there are large differences in the joint probabilities of drought events with different severities and the order for the different grades is light drought > moderate drought > severe drought > extreme drought. The areas at high risk from light drought are in southern Liaoning, central Jilin, and most of Heilongjiang, with joint probabilities of 50–60%. The low-value areas are in the mountainous areas of eastern Liaoning and eastern Jilin, with joint probabilities of between 20% and 40%, and the joint probabilities for the rest of the region are between 40% and 50%. The moderately arid high-risk areas are in western Liaoning, with joint probabilities of between 20% and 30%. The areas at low-risk from moderate or severe drought are in eastern Liaoning, eastern Jilin, and most of Heilongjiang, with values below 10%. The regions with severe and extreme drought joint probabilities (>10%) are distributed in western Liaoning and western Jilin. The rest of the regions have values of <10%.

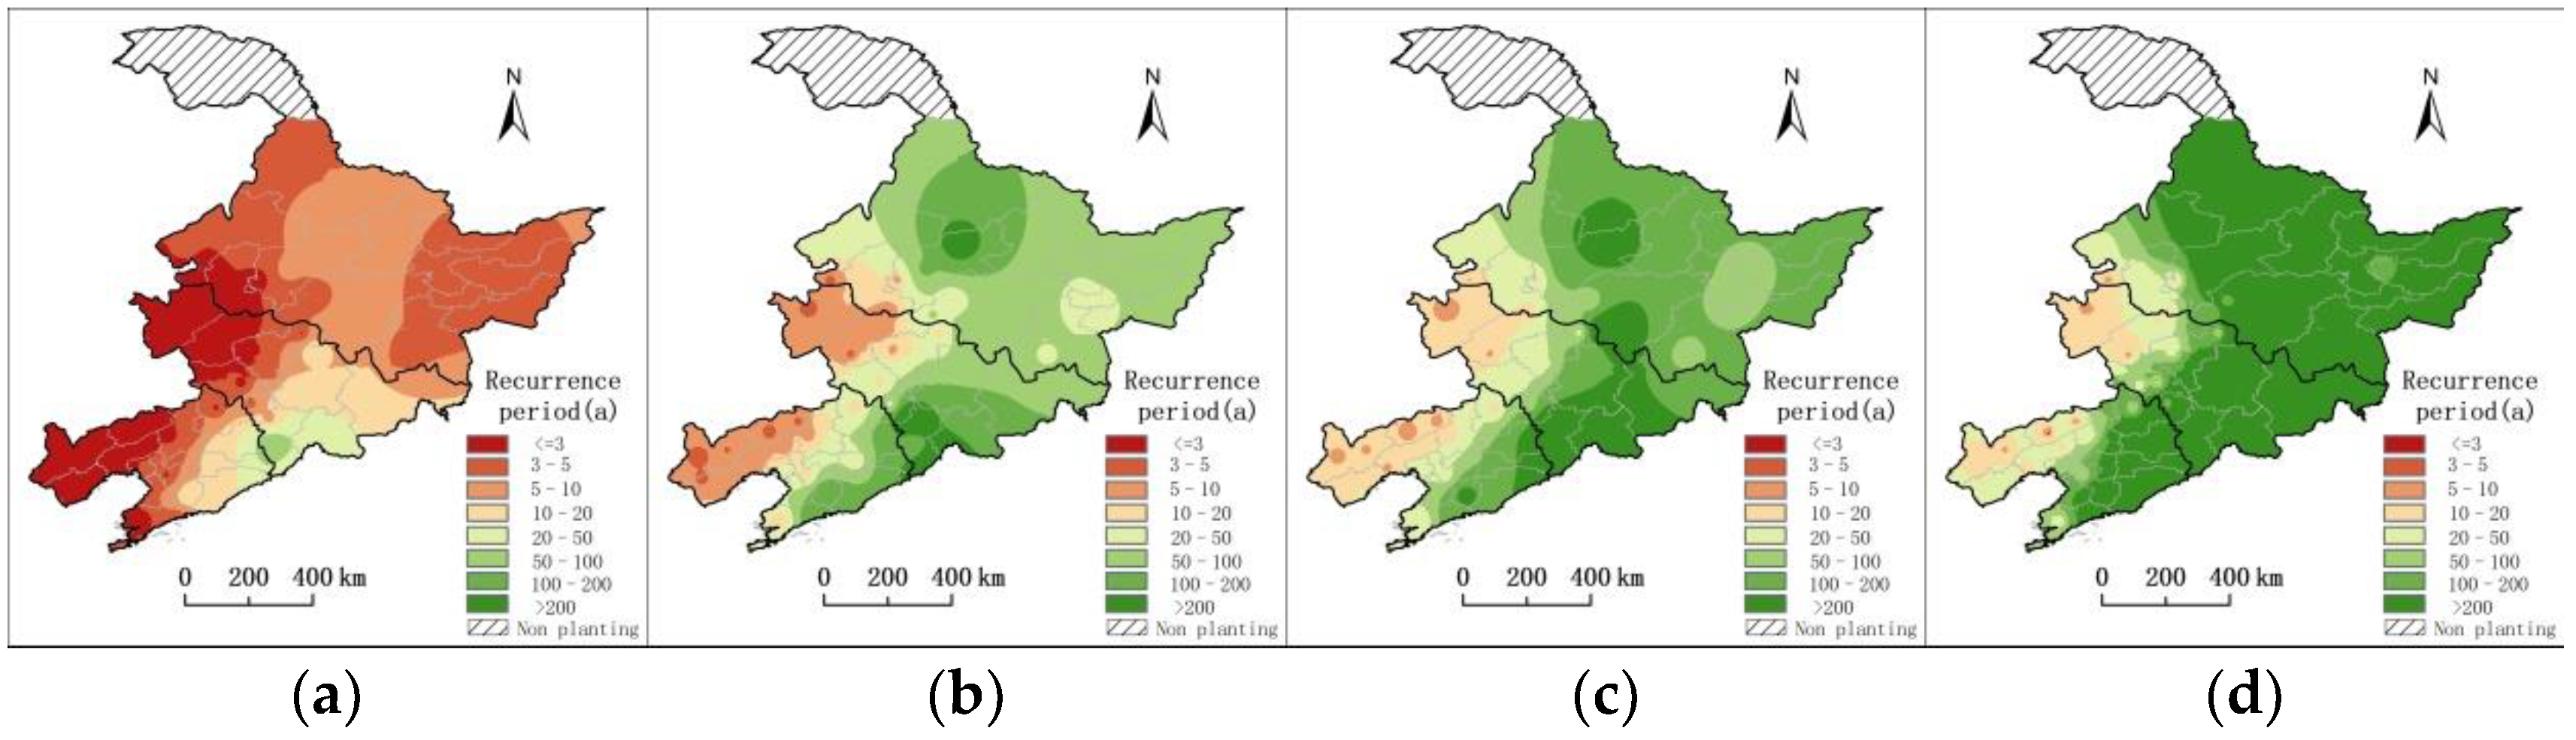
3.6.4. Spatial Distribution of Co-Occurrence-Recurrence Periods for Agricultural Drought Events with Different Grades

Figure 11 shows the spatial distributions of the co-occurrence-recurrence periods for the bivariate characteristics of agricultural drought events of different severity in Northeast China. It can be seen from Figure 11 that the co-occurrence-recurrence periods for agricultural drought events among the grades are quite different and follow the order light drought < moderate drought < severe drought < extreme drought. In addition, there is a gradually increasing trend from west to east. The distribution of regions with similar recurrence periods but suffering from either severe drought or extreme drought is basically the same. The low-value light drought areas are in western Liaoning and western Jilin where drought occurs once every 1–3 years. The high-value areas are in eastern Liaoning and eastern Jilin where drought occurs once in more than twenty to hundreds of years. The low-value moderate drought, areas are in western Liaoning and western Jilin, where drought is expected to occur once every 3.5–10 years. The low-value areas for severe and extreme drought recurrence are in western Liaoning and western Jilin where the recurrence rate is 5.9–20 years.

4. Discussion

Agricultural drought is closely related to weather systems, crop types and soil characteristics. The soil water content is lower than the crop water requirement, which causes a water shortage in the crop and affects its normal growth and development, resulting in reduced yields or total loss of the harvest [42,43,44]. A series of drought indicators have been established to improve agricultural drought identification and assessment. Each indicator has its own advantages and disadvantages depending on its focus. Furthermore, most evaluation indicators are not linked to the physiology, morphology, and function of crops after drought. There are still deficiencies in the identification process for drought assessment indicators. For example, they cannot describe the mechanism and process of drought occurrence and crop development, they do not reflect the cumulative impact of drought on crops as duration increases, and do not reflect the relationship between the drought assessment indicators and yield loss. Currently the widely used drought indicators are based on monthly and above temporal scales, and are less suitable for characterizing short-term droughts. A drought indicator based on daily time scales would be able to describe drought conditions more accurately [45,46,47,48]. In the context of climate change, it is important to supplement and develop agricultural drought indicators that are based on a daily time scale. Therefore, selecting and constructing appropriate daily time scale agricultural drought indicators will help to accurately identify agricultural drought events. From the indicators constructed so far, most of the indicators do not reflect the physical interaction between disaster-causing factors and disaster-affected bodies, although the Standardized Precipitation Evapotranspiration Index (SPEI) and the CWDI do use the 10-day crop coefficients, and the monthly or growth stage in their calculation formulas [49,50]. This study selected the CWDI because it is linked with crop growth and development. The aims were to optimize the crop coefficient, introduce the effective soil water amount at seedling emergence and effective precipitation during the growing period, and integrate crop data, meteorology, and soil moisture conditions. The CWDIwp had a better agronomic and meteorological significance than the other indicators. The occurrence and development of drought were evaluated on a daily basis since crop seedling emergence. The evaluation threshold indicator for a constructed drought event and the new identification method can effectively diagnose whether a drought event will occur. The identification and diagnosis methods of agricultural drought event are carried out from the perspective that crop growth and yield formation are affected by drought, which is essentially different from the evaluation indexes of meteorological and hydrological drought [12,26,27,51,52].
Even though the CWDIwp index value is high, the drought threat to the crops can be small because the drought period has a short duration. In contrast, when the CWDIwp index value is low, the crops can still be under considerable threat from drought because it has a long duration period. In previous studies, only the magnitude of the CWDI was considered, but the effect of duration was ignored; thus, it cannot represent the actual drought process. The dual effects of the CWDI and duration (shaded area in Figure 2) need to be considered together. Therefore, this study emphasized the cumulative effect of crop water deficit. Based on the relationship between yield reduction rate, and drought duration and drought intensity, bivariate threshold indicators for drought duration and the drought intensity of drought events of different severity were determined and drought events were identified based on run theory.
Northeast China is a rain-fed agricultural area in China and agricultural drought events often occur. The characteristics, variation patterns, and causes of drought in Northeast China have been extensively analyzed [32,33], but these studies were biased due to their univariate descriptions of drought characteristics in Northeast China. However, agricultural drought is a multivariate, comprehensive event and there are usually high dependencies between the feature values, such as drought duration and drought intensity. Therefore, just using the probability distribution of univariate characteristics can only give a partial correlation rather than causality [22]. In recent years, run theory has been widely used to evaluate drought events. For example, the multivariate Copula function was gradually introduced into the hydrology field from the financial field [51] and then gradually extended to meteorological drought [13] and agricultural drought event assessment. In this study, five probability density distribution functions were used to test the significance of drought duration and drought intensity. The results show that drought duration and drought intensity conformed to the exponential distribution function and the gamma distribution function, respectively, which is consistent with the research results reported by Zuo et al. [52]. The Copula function was used in this study to construct the joint distribution of agricultural drought events. It was then used to investigate different combinations of drought duration and drought intensity to comprehensively reflect the characteristics of drought events. This method can better reveal the temporal and spatial distribution characteristics of the occurrence frequency and recurrence period for agricultural drought events in different regions and at different levels. The results are consistent with the results reported by previous researchers [6,48]. The new evaluation system can distinguish the drought characteristics of different agricultural regions in Northeast China, supports agricultural drought research, and provides novel insights. Therefore, drought indicator selection, threshold optimization, and Copula multidimensional feature variable analysis will be the research focus in the future.

5. Conclusions

In this study, the CWDI was optimized and improved based on a comprehensive consideration of crops, meteorology, and soil factors. A method for agricultural drought event identification based on run theory was also established. Bivariate threshold indicators were determined that could identify drought duration and the drought intensity of drought events of varying severity. The frequency and intensity were analyzed to reveal the spatio-temporal variations in agricultural drought events across Northeast China. The main conclusions are as follows:
(1)
CWDIwp is an effective index for agricultural drought events monitoring. It can reliably evaluate information about drought onset, duration, and intensity, and can effectively capture the space-time structure of the events.
(2)
In terms of temporal distribution, drought intensity in the three Northeastern provinces showed an increasing trend. Drought events were more frequent in the early 1980s, but then the number of drought events decreased. The drought events began to increase again in the mid-to-late 1990s and remained at a relatively high level from 2000 to 2004. This was probably due to increased heat resources and decreased water resources during the growing season in Northeast China [53,54].
(3)
In terms of spatial distribution, the joint probability showed a decreasing distribution trend from west to east. The areas with high joint probability values matched the low value areas for the joint recurrence period, indicating that the drought joint probability was higher, and the joint recurrence period was lower in the drought-prone areas. There was also a clear region-specific distribution. The drought high-risk areas are in western Liaoning and western Jilin with a joint probability range of 60–87% and a joint recurrence period of 1–3 years. The low-risk drought areas (probability <40%) are distributed in the mountainous areas of eastern Liaoning and eastern Jilin. The joint probabilities and joint recurrence periods for agricultural drought events of varying severity were quite different, with the joint probability order from high to low being light drought > moderate drought > severe drought > extreme drought. The joint recurrence period order was as follows: light drought < moderate drought < severe drought < extreme drought.

Author Contributions

S.Z.; methodology, writing—review and editing; P.W. and D.W.; investigation and data curation, Y.Z. validation, R.J. visualization, F.C. formal analysis. All authors have read and agreed to the published version of the manuscript.

Funding

This research was funded by the Fundamental Scientific Research Business Expenses Of Central-Level Public Welfare Scientific Research Institutes (2020SYIAEHZ1, 2018SYIAEMS1), the Liaoning Provincial Natural Science Foundation Guidance Program (20180551206), the National Key Research and Development Program of Grain High Yield and Efficiency Science and Technology Innovation Key Project (2018YFD0300309-02),the National Nature Science Foundation of China (41775110, 4197050610), the Agricultural Research and Industrialization Project of the Department of Technology (2015210001) and the Key R&D Project of the Department of Science and Technology of Liaoning Province (2019JH2/10200018).

Institutional Review Board Statement

Not applicable.

Informed Consent Statement

Not applicable.

Conflicts of Interest

The authors declare no conflict of interest.

References

  1. Alam, M.R.; Nakasathien, S.; Sarobol, E.; Vichukit, V. Responses of physiological traits of maize to water deficit induced at different phenological stages. Kasetsart J. Nat. Sci. 2014, 48, 183–196. [Google Scholar]
  2. Azizi, F.; Hajibabaei, M. Evaluation of drought stress on irrigation efficiency, yield and yield components in new maize hybrids. Int. J. Agric. Innov. Res. 2014, 3, 579–583. [Google Scholar]
  3. Ma, X.Y.; Zhou, G.S. A method to determine the critical soil moisture of growth indicators of summer maize in seedling stage. Chin. J. Ecol. 2017, 36, 1761–1768. [Google Scholar]
  4. Shi, Z.; Liang, Z.Z.; Yang, Y.Y.; Guo, Y. Status and Prospect of Agricultural Remote Sensing. Trans. Chin. Soc. Agric. Mach. 2015, 46, 247–260. [Google Scholar]
  5. IPCC. Climate Change: Impacts, Adaptation and Vulnerability. Part A: Global and Sectoral Aspects. In Contribution of Working Group II to the Fifth Assessment Report of the Intergovernmental Panel on Climate Change; Cambridge University Press: Cambridge, UK; New York, NY, USA, 2014; p. 1132. [Google Scholar]
  6. Dong, C.Y.; Yang, X.G.; Yang, J.; Xie, W.J.; Ye, Q.; Zhao, J.; Li, K.N. The Temporal Variation Characteristics and Spatial Distribution Laws of Drought of Spring Maize in Northern China. Sci. Agric. Sin. 2013, 46, 4234–4245. [Google Scholar]
  7. Dai, A.G. Increasing drought under global warming in observations and models. Nat. Clim. Change 2013, 3, 52–58. [Google Scholar] [CrossRef]
  8. Ma, X.Y.; Zhou, G.S. Effects of drought on the trade-off growth of leaf traits of summer maize in the seedling stage. Acta Ecol. Sin. 2018, 38, 1758–1769. [Google Scholar]
  9. Trenberth, K.E.; Dai, A.; Gerard, V.D.S.; Jones, P.D.; Barichivich, J.; Briffa, K.R.; Sheffield, J. lobal warming and changes in drought. Nat. Clim. Change 2013, 4, 17–22. [Google Scholar] [CrossRef]
  10. Chen, H.; Wang, J.X.; Huang, J.K. Policy support, social capital, and farmers, adaptation to drought in China. Glob. Environ. Change 2014, 24, 193–202. [Google Scholar] [CrossRef]
  11. Zhang, J.; Becker-Reshef, I.; Justice, C. Evaluating the impacts of drought on crop production from satellite observations: A case study in Kansas. In Proceedings of the 2014 IEEE International Geoscience and Remote Sensing Symposium, Quebec City, QC, Canada, 13–18 July 2014; pp. 2058–2061. [Google Scholar]
  12. Wang, X.F.; Zhang, Y.; Feng, X.M.; Feng, Y.; Xue, Y.Y.; Pan, N.Q. Analysis and application of drought characteristics based on run theory and Copula function. Trans. Chin. Soc. Agric. Eng. 2017, 33, 206–214. [Google Scholar]
  13. Fang, G.H.; Tu, Y.H.; Wen, X.; Yan, M.; Tan, Q.F. Study on the development process and evolution characteristics of meteorological drought in the Huaihe River Basin from 1961 to 2015. J. Hydraul. Eng. 2019, 50, 598–611. [Google Scholar]
  14. Jin, J.L.; Song, Z.Z.; Cui, Y.; Zhou, Y.L.; Jiang, S.M.; He, J. Research progress on the key technologies of drought risk assessment and control. J. Hydraul. Eng. 2016, 47, 398–412. [Google Scholar]
  15. Zhan, C.; Liang, C.; Zhao, L. Temporal and spatial distribution characteristics and causes analysis of seasonal drought in hilly area of central Sichuan. Trans. Chin. Soc. Agric. Eng. 2013, 29, 82–90. [Google Scholar]
  16. Zhao, Z.Y.; Wang, H.R.; Yu, C.; Deng, C.N.; Liu, C.L.; Wu, Y.F.; Yan, J.W.; Wang, C. Changes in spatiotemporal drought characteristics over northeast China from 1960 to 2018 based on the modified nested Copula model. Sci. Total Environ. 2020, 739, 140328. [Google Scholar] [CrossRef] [PubMed]
  17. Wang, C.Y.; Cai, J.J.; Zhang, J.Q. Risk assessment of drought and chilling injury of maize in Northeast China. Trans. Chin. Soc. Agric. Eng. 2015, 31, 238–245. [Google Scholar]
  18. Kao, S.C.; Rao, S.G. A copula-based joint deficit index for droughts. J. Hydrol. 2010, 380, 121–134. [Google Scholar] [CrossRef]
  19. Berg, D. Copula goodness-of-fit testing: An overview and power comparison. Eur. J. Financ. 2009, 15, 675–701. [Google Scholar] [CrossRef]
  20. Brechmann, E.C.; Czado, C. Risk management with high-dimensional vine copulas: An analysis of the Euro Stoxx 50. Stat. Risk Modeling 2013, 30, 307–342. [Google Scholar] [CrossRef]
  21. Chen, Y.D.; Zhang, Q.; Xiao, M.; Singh, V.P. Evaluation of risk of hydrological droughts by the trivariate Plackett copula in the East River basin. Nat. Hazards 2013, 68, 529–547. [Google Scholar] [CrossRef]
  22. Yu, C.; Chen, J.; Wang, H.R.; Chu, Z.F.; Lai, L.W. Application progress of multi-variable Copula function in drought risk analysis. S. N. Water Transf. Water Sci. Technol. 2018, 16, 14–21. [Google Scholar]
  23. Cheng, Y.C.; Yang, C.G.; Hao, Z.C.; Yang, H.Y. Effect of Drought Duration Fitting Methods on Copula-based Drought Analysis. China Rural. Water Hydropower 2019, 8, 93–97. [Google Scholar]
  24. Zhou, Y.L.; Liu, L.; Zhou, P.; Jin, L.J.; Li, J.Q.; Wu, C.G. Identification of drought and frequency analysis of drought characteristics based on palmer drought severity index model. Trans. Chin. Soc. Agric. Eng. 2014, 30, 174–184. [Google Scholar]
  25. Chen, Z.Q.; Hou, W.; Zuo, D.D.; Hu, J.G. Research on Drought Characteristics in China Based on the Revised Copula Function. J. Arid. Meteorol. 2016, 34, 213–222. [Google Scholar]
  26. Xiang, Y.; Wang, Y.; Chen, Y.; Bai, Y.; Zhang, L.; Zhang, Q. Hydrological Drought Risk Assessment Using a Multidimensional Copula Function Approach in Arid Inland Basins, China. Water 2020, 12, 1888. [Google Scholar] [CrossRef]
  27. Wang, J.; Rong, G.; Li, K.; Zhang, J. Analysis of Drought Characteristics in Northern Shaanxi Based on Copula Function. Water 2021, 13, 1445. [Google Scholar] [CrossRef]
  28. Ma, Y.N.; Zhang, J.Q.; Zhao, C.L.; Li, K.W.; Dong, S.N.; Liu, X.P.; Tong, Z.J. Spatiotemporal Variation of Water Supply and Demand Balance under Drought Risk and Its Relationship with Maize Yield: A Case Study in Midwestern Jilin Province, China. Water 2021, 13, 2490. [Google Scholar] [CrossRef]
  29. Liu, Z.J.; Yang, X.G.; Hubbard, K.G.; Lin, X.M. Maize potential yields and yield gaps in the changing climate of northeast China. Glob. Change Biol. 2012, 18, 3441–3454. [Google Scholar] [CrossRef]
  30. Liu, Z.J.; Yang, X.G.; Lin, X.M.; Hubbard, K.G.; Lv, S.; Wang, J. Narrowing the Agronomic Yield Gaps of Maize by Improved Soil, Cultivar, and Agricultural Management Practices in Different Climate Zones of Northeast China. Earth Interact. 2016, 20, 1–18. [Google Scholar] [CrossRef] [Green Version]
  31. Park, S.; Im, J.; Jang, E.; Rhee, J. Drought assessment and monitoring through blending of multi-sensor indices using machine learning approaches for different climate regions. Agric. For. Meteorol. 2016, 216, 157–169. [Google Scholar] [CrossRef]
  32. Zhang, S.J.; Zhang, Y.S.; Ji, R.P.; Cai, F.; Wu, J.W. Analysis of spatio-temporal characteristics of drought for maize in Northeast China. Agric. Res. Arid. Areas 2011, 29, 231–236. [Google Scholar]
  33. Wu, X.; Wang, P.J.; Gong, Y.D.; Yang, J.Y. Analysis of drought identification and spatio-temporal characteristics for summer corn in Huang-Huai-Hai Plain in year of 1961-2015. Trans. Chin. Soc. Agric. Eng. 2019, 35, 189–199. [Google Scholar]
  34. Cai, F.; Ming, H.Q.; Chen, P.S.; Mi, N.; Ji, R.P.; Zhao, X.L.; Zhang, S.J. Spatio-Temporal Trends in Seasonal Precipitation in Northeastern China from1961 to 2004. Resour. Sci. 2008, 30, 1456–1462. [Google Scholar]
  35. Zhang, S.J.; Zhang, Y.S.; Chen, P.S.; Liang, S.E.; Liu, D.M.; Mi, N.; Ji, R.P.; Wang, Y.; Wang, X.Y.; Li, G.X. Identification and dynamic quantitative evaluation of maize drought-induced disaster process based on an improved crop water deficit index. Chin. J. Ecol. 2020, 39, 4241–4252. [Google Scholar]
  36. Zhang, S.J.; Zhou, G.S.; Li, R.P. Daily Crop Coefficient of Spring Maize Using Eddy Covariance Observation and Its Actual Evapotranspiration Simulation. J. Appl. Meteorol. Sci. 2015, 26, 695–704. [Google Scholar]
  37. Kang, S.Z.; Cai, H.J. Agricultural Water Management; China Agriculture Press: Beijing, China, 1996. [Google Scholar]
  38. Liu, X.Y.; Wang, J.S.; Li, Y.H.; Yang, J.H.; Yue, P.; Tian, Q.M.; Yang, Q.H. Characteristics of drought risk in southern China based on the Copula function. Acta Meteorol. Sin. 2015, 73, 1080–1091. [Google Scholar]
  39. Gijbels, I.; Mielniczuk, J. Estimating the density of a copula function. Commun. Stat. Theory Methods 1990, 19, 445–464. [Google Scholar] [CrossRef]
  40. Shiau, J.T. Fitting drought duration and severity with two dimensional copulas. Water Resour. Manag. 2006, 20, 795–815. [Google Scholar] [CrossRef]
  41. Clayton, D.G. A model for association in bivariate life tables and its application in epidemiological studies of familial tendency in chronic disease incidence. Biometrika 1978, 65, 141–151. [Google Scholar] [CrossRef]
  42. Ji, R.P.; Yu, W.Y.; Feng, R.; Wu, J.W.; Zhang, Y.S.; Wang, Q. Advance in the Response Process of Crops and Early Identification Technologies to Drought Stress. J. Catastrophol. 2019, 34, 153–160. [Google Scholar]
  43. Wen, Q.; Li, L.L.; Ma, Y.L.; Fan, Y.D.; Li, S.S. Assessment Technology of Remote Sensing Drought Monitoring -A Case Study on the Drought in the Lower Yangtze Region. J. Catastrophol. 2013, 28, 51–54. [Google Scholar]
  44. Zhang, J.Q.; Yan, D.H.; Wang, C.Y.; Liu, X.P.; Tong, Z.J. A Study on Risk Assessment and Risk Regional ization of Agricultural Drought Disaster in Northwestern Regions of Liaoning Province. J. Disaster Prev. Mitig. Eng. 2012, 32, 300–306. [Google Scholar]
  45. Jia, Y.Q.; Zhang, B. Spatial-temporal Variability characteristics of extreme drought events based on daily SPEI in the southwest china in recent 55 years. Sci. Geogr. Sin. 2018, 38, 474–483. [Google Scholar]
  46. Li, J.; Wang, Z.L.; Wu, X.S.; Zscheischler, J.; Guo, S.L.; Chen, X.H. A standardized index for assessing sub-monthly compound dry and hot conditions with application in China. Hydrol. Earth Syst. Sci. 2021, 25, 1587–1601. [Google Scholar] [CrossRef]
  47. Zhang, X.; Duan, Y.W.; Duan, J.P.; Jian, D.N.; Ma, Z.G. A daily drought index based on evapotranspiration and its application in regional drought analyses. Sci. China Earth Sci. 2022, 65, 317–336. [Google Scholar] [CrossRef]
  48. Zhang, S.Z.; Zhu, X.F.; Liu, T.T.; Xu, K.; Guo, R. Drought characteristics and risk hazard in China based on multidimensional Copula model. Arid. Land Geogr. 2022, 45, 333–345. [Google Scholar]
  49. Liu, B.C.; Liu, Y.; Yang, F.; Yang, X.J.; Bai, W. Estimating crop water deficit during maize potential growth period and climatic sensitivity analysis in Northeast China, 1961–2010. J. Agric. Sci. 2016, 155, 394–406. [Google Scholar] [CrossRef]
  50. Qiu, M.J.; Guo, C.M.; Wang, D.N.; Yuan, F.X.; Wang, M.Y.; Mu, J.; Wang, Q. Analysis of characteristic no drought in different developmental times of maize based no crop water deficit index in Jilin province. J. Catastrophol. 2018, 33, 89–98. [Google Scholar]
  51. Zhou, P.; Zhou, Y.L.; Jin, J.L.; Jiang, S.M.; Wu, C.G. Understanding of hydrological bivariate return periods and its application to drought analysis. Adv. Water Sci. 2019, 30, 382–391. [Google Scholar]
  52. Zuo, D.D.; Hou, W.; Yan, P.C.; Feng, T.C. Research on drought in southwest China based on the theory of run and two-dimensional joint distribution theory. Acta Phys. Sin. 2014, 63, 1–12. [Google Scholar]
  53. Zhang, L.M.; Zhang, S.J.; Guo, H.; Wang, P.; Wang, D.N.; Li, J. Variations and Effects of Agricultural Climatic Resources in Suitable Growth Period of Spring Maize in Northeast China. Acta Agric. Jiangxi 2018, 30, 93–99. [Google Scholar]
  54. Zhang, S.J.; Hou, Y. Impact and Assessment of Climate Change on Maize Productivity Potential in Northeast China; Liaoning Science and Technology Press: Shen Yang, China, 2019. [Google Scholar]
Figure 1. Spatial distribution of agro-meteorological observation stations in northern China.
Atmosphere 13 01234 g001
Figure 2. Schematic diagram of the run theory.
Atmosphere 13 01234 g002
Figure 3. Relationships between and relative soil moisture content and drought intensity and CWDIwp.
Atmosphere 13 01234 g003
Figure 4. Development of a maize drought disaster at Fuxin station in 2006.
Atmosphere 13 01234 g004
Figure 5. Relationship between drought duration and drought intensity at the 15 meteorological stations in Liaoning Province, China.
Atmosphere 13 01234 g005
Figure 6. Conditional distribution of drought intensity when the drought duration exceeded d′ (a) and the conditional distribution of drought duration when the drought intensity exceeded s′ (b) at the Fuxin station.
Atmosphere 13 01234 g006
Figure 7. Conditional recurrence period for a drought intensity with a duration exceeding d′ (a) and the conditional recurrence period of a drought duration with a severity exceeding s′ (b) at the Fuxin station.
Atmosphere 13 01234 g007
Figure 8. Temporal variations in drought intensity in Liaoning (a), Jilin (b), and Heilongjiang (c) from 1981 to 2020.
Atmosphere 13 01234 g008
Figure 9. Spatial distributions of the agricultural drought event joint probabilities and the co-occurrence recurrence periods in Northeast China from 1981 to 2020. (a) Probability; (b):recurrence period.
Atmosphere 13 01234 g009
Figure 10. Spatial distributions of the joint probabilities for agricultural drought events with different drought grades in Northeast China from 1981 to 2020. (a) Light drought; (b) moderate drought; (c) Severe drought; (d) Extreme drought.
Atmosphere 13 01234 g010
Figure 11. Spatial distribution of the co-occurrence-recurrence periods for agricultural drought events of different severity in Northeast China from 1981 to 2020. (a)Light drought; (b) moderate drought; (c) severe drought; (d) extreme drought).
Atmosphere 13 01234 g011
Table 1. Threshold indicator of agricultural drought event.
Drought SeverityD * ≤ 55 < D ≤ 30D > 30
No droughtS ≤ 0.1
Light droughtS > 0.10 < S ≤ 7.5
Moderate drought S > 7.50 < S ≤ 15
Severe drought 15 < S ≤ 30
Extreme drought S > 30
* Notes: D is drought duration days.
Table 2. Probability density function and parameters of different probability distributions.
Marginal DistributionProbability Density FunctionParameter
γ-distribution f ( x ) = 1 β α Γ ( a ) x a 1 e x / β ( x > 0 )
Where   Γ ( a ) = 0 y a 1 e y d y
α : S h a p e   p a r a m e t e r   ( α > 0 )
β : S c a l e   p a r a m e t e r   ( β > 0 )
Lognormal distribution f ( x ) = 1 x σ 2 π e ( l n x μ ) 2 2 σ 2 ( x > 0 ) μ : M e a n   l n   X ( < μ < )
σ : S t a n d a r d   d e v i a t i o n   l n   X   ( σ > 0 )
Wilson distribution f ( x ) = b a b x b 1 e ( x a ) b ( x 0 ) α : S h a p e   p a r a m e t e r   ( α > 0 )
β : S c a l e   p a r a m e t e r   ( β > 0 )
Exponential distribution f ( x ) = λ e λ x ( x > 0 ) λ : R a t i o   p a r a m e t e r   ( λ > 0 )
Normal distribution F ( x ) = x 1 2 π σ e ( x μ ) 2 2 σ 2 d x μ , sample mean values
σ , sample mean errors
Table 3. Descriptions of the properties associated with the five selected Copula functions.
Copula FunctionCopula Distribution FunctionParameter Ranges
Clayton max   ( μ θ + ν θ 1 ) 1 / θ θ 0
Frank 1 θ l n [ 1 + ( e θ μ 1 ) ( e θ ν 1 ) ( e θ 1 ) ] θ 0
Galambos μ ν e [ ( l n μ ) θ + ( l n ν ) θ ] 1 / θ θ 0
Gumbel-Hougaard e [ ( l n μ ) θ + ( l n ν ) θ ] 1 / θ θ 1
Plackett 1 2 1 θ 1 { 1 + ( θ 1 ) ( μ + ν ) [ ( 1 + ( θ 1 ) ( μ + ν ) ) 2 4 θ ( θ 1 ) μ ν ] 1 / 2 } θ 0
Publisher’s Note: MDPI stays neutral with regard to jurisdictional claims in published maps and institutional affiliations.

