Article

Accelerated Glacier Mass Loss over Svalbard Derived from ICESat-2 in 2019–2021

Chinese Antarctic Center of Surveying and Mapping, Wuhan University, Wuhan 430079, China
*
Author to whom correspondence should be addressed.
Atmosphere 2022, 13(8), 1255; https://doi.org/10.3390/atmos13081255
Submission received: 29 June 2022 / Revised: 3 August 2022 / Accepted: 4 August 2022 / Published: 8 August 2022

Abstract

:
The glaciers in Arctic Archipelago of Svalbard, located in the hotspot of global warming, are sensitive to climate change. The assessment of glacier mass balance in Svalbard is one of the hotspots in Arctic research. In this study, we use the laser altimetry ICESat-2 data to investigate the elevation and mass change of Svalbard from 2019 to 2021 by a hypsometric approach. It is shown that the Svalbard-wide elevation change rate is −0.775 ± 0.225 m yr−1 in 2019–2021, corresponding to the mass change of −14.843 ± 4.024 Gt yr−1. All regions exhibit a negative mass balance, and the highest mass loss rates are observed at Northwestern Spitsbergen. Compared with ICESat/ICESat-2 (2003–2008 to 2019) and Cryosat-2 (2011–2017) periods, the elevation change from 2019 to 2021 has accelerated, with an increase by 158.3% and 31.5%, respectively, leading to equilibrium line altitude increasing to 750 m. Among the seven subregions, four are accelerated. It is shown that the overall accelerated glacier mass loss in Svalbard is expected to be caused by increasing surge events and temperature rise.

1. Introduction

Glaciers are one of the great climate change indicators and play an important role in the hydrosphere and cryosphere water cycle [1]. Melting land ice masses release fresh water back to the hydrosphere to contribute to sea-level rise (SLR), which has been recognized as among the most important impacts of climate change on the global environment [2]. The mean SLR rate has been estimated as 3.1 mm yr−1 over the last 20 years, and the cryosphere input contributes about half of the current total annual sea-level change, largely due to increased ice melt [3]. About 60% of the ice loss is from glaciers and ice caps [3]. It is predicted that the “small” ice bodies will remain the important SLR contributors throughout the 21st century. Therefore, quantifying glacier changes is necessary to estimate glacial sea level contribution under climatic change [4].
As a result of Arctic Amplification, in which Arctic warming over the last two decades was twice the global average, Svalbard glaciers experience among the fastest warming on Earth [5,6]. The Arctic Archipelago of Svalbard is a significant repository of terrestrial ice in the Arctic, with 60% of the area covered by a large number of small glaciers and ice caps [7,8], which is approximately 6% of the worldwide glacier cover, except for Greenland and Antarctica [9]. Those glaciers are sufficient to raise the global sea level by 17 ± 5 mm if totally melted [10]. Most glaciers in Svalbard are polythermal glaciers, consisting of cold and temperate ice, which respond rapidly to climate change [7]. Studies have shown that the glaciers in Svalbard have been retreating since the Little Ice Age (LIA), and the glacier thinning rates in the twenty-first century are predicted to be more than double those from 1936 to 2010 [11].
The assessment of glacier mass balance in Svalbard is one of the hotspots in Arctic research. Traditional glaciology and geodesy methods are widely employed for glacier mass balance. For example, it is found that a cumulative mass balance of Austre Grønfjordbreen from 2006 to 2020 is 21.62 m w.e., which is estimated by glaciological, geodetic and modeling approaches [12]. Another study used topographic maps and digital elevation models (DEM) to evaluate the mass balance of Dickson Land from 1990 to 2009/2011, and found the rapid glacier-wide thinning over the entire region at a mean rate of −0.71 ± 0.05 m a−1 (−0.64 ± 0.05 m w.e. a−1) [13]. In situ measurement provides high-precision data, but these data have low spatial coverage (covering only a single glacier or a small region) and it is difficult to estimate the long-term mass balance of Svalbard. However, repeated satellite altimetry provides an independent approach for mass balance estimation [4].
Satellite altimetry has been used to measure elevation change in Greenland and Antarctica since the late 1970s [14,15,16]. The data with high resolution and high accuracy from new satellite altimetry, such as Cryosat-2, ICESat (The Ice, Cloud, and Land Elevation Satellite), and ICESat-2, makes it possible to monitor high latitude mountain glaciers [4,17,18]. The mass change of Svalbard was estimated as −3.40 ± 1.60 Gt yr−1 from 2003 to 2008, using ICESat [9], and accelerated to −16.00 ± 3.00 Gt yr−1 between 2011 and 2017 from Cryosat-2 [19]. ICESat-2, launched in 2018, was equipped with an improved laser altimetry system. The validation results demonstrate that the elevation accuracy of ICESat-2 is about 1.5–2.5 cm in this East Antarctic region, which shows its potential for the cryosphere applications [20,21]. Meanwhile, the successful application of ICESat-2 in High Mountain Asia Region has explored the feasibility of ICESat-2 in the mountain glacier change research [17,18]. On the other hand, with the wide application of satellite altimetry in the glacier mass balance research, various methods for obtaining elevation changes have been developed, such as crossovers (XO) method, repeat tracks (RTs) method and so on [9]. Of which, the RTs has excellent performance for satellites with fixed orbits. This method makes full use of the measured data. However, for the near repeated tracks, a least-squares regression technique can also be used to derive the elevation change, considering the effect of terrain [9].
The existing studies on Svalbard glaciers mainly focus on the dynamic characteristics of a single glacier [8], or the assessment at the global scale with less detailed information [22,23]. Nevertheless, there are rare results on mass change of Svalbard from ICESat-2 data. Moreover, the mean annual air temperature of Svalbard has risen at a rate of 1.7 °C per decade since 1991, which is about seven times the global average over the same period [11,24]. It is necessary and urgent to monitor the mass change of Svalbard glaciers and its response to climate change. In this paper, we apply ICESat-2 data to monitor the glaciers of Svalbard. The elevation changes and corresponding mass balances are firstly estimated from 2019 to 2021 over the entire Svalbard and its seven subregions. Then, winter and summer elevation changes are compared. Finally, combined with the in situ meteorological data, we preliminarily analyzed the reasons of Svalbard glacier mass change.

2. Study Area

Svalbard is an Arctic Archipelago (74–81° N; 10–35° E) situated at the north of Norway between Greenland and Novaya Zemlya (Figure 1a). It consists of four main islands: Spitsbergen, Nordaustlandet, Barentsøya, Edgeøya and other 150 smaller islands [25]. The total area of Svalbard is ~60,000 km2 and about 34,000 km2 is covered by glaciers. The climate of Svalbard is polar maritime, with both rain and snowfall possible in all months of the year. The highest temperature occurs in Jul./Aug., up to 10 °C, and the lowest temperature occurs in Jan./Feb., below −30 °C. At the main settlement, Longyearbyen, the mean annual air temperature for the normal period is −6.7 °C [26]. Svalbard glaciers have relatively low elevations. The highest elevation on Svalbard is ~1700 m above sea level (a.s.l.), but glacier hypsometry (area-elevation distribution) peaks only at ~450 m a.s.l [5]. While the western side of the archipelago is characterized by alpine topography, the eastern side has less rugged topography and many low-altitude ice caps.
Surging glaciers are common in Svalbard, and more than 700 individual glaciers have been documented to exhibit surge behavior [27]. However, how many surge-type glaciers are actually on the archipelago is uncertain. Published estimates of the frequency of these glaciers in Svalbard range from 13% to 90% of all glaciers.
In this study, Svalbard is divided into seven major subregions according to [4,21]: Northwestern Spitsbergen (NW), Northeastern Spitsbergen (NE), Southern Spitsbergen (SS), Barentsøya and Edgeøya (BE), Vestfonna ice cap (VF), Austfonna ice cap (AF) and Kvitøya (KV). This division derives from natural climatic conditions [21]. At the same time, more convenient comparison with previous studies is also considered.

3. Materials and Methods

3.1. Data

3.1.1. ICESat-2 Laser Altimetry

ICESat-2, designed to measure the height of the Earth, was launched on 15 September 2018. Similar to ICESat, the orbit of ICESat-2 is 500 km altitude, 92-degree inclination and 91-day repeat cycle. Carrying the Advanced Topographic Laser Altimetry System (ATLAS) instrument, the primary goal of the mission is to estimate mass-balance over the ice sheets and glaciers. ICESat-2 makes repeat measurements over a set of 1387 reference ground tracks (RGTs) distributed between +/−88° latitudes with a narrow footprint of ~14.5 m and 0.03 m vertical precision. ICESat-2′s ATLAS instrument employs a split-beam design, where each laser pulse is divided into six separate beams. The six beams are grouped into three pairs, with about 90 m distance within the pair, 0.7 m distance between two nearby points along the track and a 3.3 km offset between two nearby pairs [28].
The ICESat-2 mission has published 22 products ATL0-ATL21, which are divided into 5 levels (level 0, level 1, level 2, level 3A, and level 3B). In this study, the Version 4 dataset of ATLAS/ICESat-2 L3B Annual Land Ice Height ATL11, which spans the time from 29 March 2019 to 23 June 2021 (nine cycles, cycle 3 to cycle 11), was used. The data structure of ATL11 includes basic parameters such as longitude of reference pair tracks (RPT) (“/longitude/”), latitude of RPT (“/latitude/”), cycle number (“/cycle number/”), sampling time (“/delta_time/”), mean corrected height (“/h_corr/”), corrected height error (“/h_corr_sigma/”), quality summary (“/quality_summary/”), etc. [28]. The dataset and more information could be learned about from NSIDC (https://nsidc.org/ (accessed on 6 August 2022)).

3.1.2. Auxiliary Data

A Digital Elevation Model (DEM) of Svalbard with 20 m resolution was used to project ICESat-2 repeat-tracks at the same locations and to extrapolate data to uncovered areas [9]. The DEM named ‘S0_DTM20_NP-ArcticDEM-Mosaic’ was derived from the Norwegian Polar Institute (NPI) [29]. In order to clip DEM and altimetry data to glacier regions, a glacier inventory is necessary [21], where the inventory of glacier outlines of Svalbard is used from the Randolph Glacier Inventory (RGI). RGI version 6.0 was released in July 2017 and can be downloaded from http://www.glims.org/RGI/randolph60.html (accessed on 6 August 2022). [30]. Moreover, there are 7 weather stations around Svalbard, and the precipitation and temperature data since 2000 are from the Norwegian Center for Climate Services (https://seklima.met.no/ (accessed on 6 August 2022)). Of these 7 weather stations, there are only 3 sites with precipitation data.

3.2. Methods

3.2.1. Elevation Change Calculation

Several methods have been developed for the detection of elevation changes from satellite altimetry, such as repeat tracks (RTs), crossovers (XOs), overlapping footprints (OFPs), and triangulated irregular networks (TINs) [31]. The crossover data is used with XOs, OFPs, and TINs, leading to sparse coverage. Hence, the RTs method is employed to obtain the elevation change rate (dh/dt). Data were filtered as follows [32]:
  • Data outside the Svalbard glacier range were eliminated;
  • Data flagged by the on-product quality summary (“quality_summary is 0”) were deleted;
  • Data with high along-track height variability (adjacent segment height differences >6 m) were removed;
  • Data, where the corrected height was >10,000 m due to atmospheric scattering, were removed;
  • Segments where the value of corrected height was NaN for more than four cycles and the standard deviation greater than 10 m were excluded.
The heights of ATL11 were corrected for the offsets between the reference tracks and the location of the ATLAS measurements [28], so we directly used the data to derive the elevation change rate. The least-square linear fitting method was used to obtain dh/dt of each ATL11 RPT point:
d h / d t = i = 1 n t i h i n t ¯ h ¯ i = 1 n t i 2 n t ¯ 2
where n is the number of points, h i is the corrected height of the i th point, h ¯ is the average value of all h i , t i is the observed time epoch of the i th point (unit: year), t ¯ is the average value of all t i . In total, 424068 RPT points were used to calculate.
We also investigated summer and winter elevation changes ( d h s and d h w ). First, the glacier seasons were defined by 3-month periods of spring (from March to May), summer (from June to August), autumn (from September to November), and winter (from December to February) [33]. Then, the mean elevations of the summer and spring were calculated, and then their difference was taken as d h s . Similarly, d h w was obtained from the average elevation difference between autumn and winter.
We further investigated the mean elevation time series of Svalbard glaciers. The elevation mean of each cycle is calculated as follows:
h ¯ c y c l e _ k = i = 1 n ( h i c o s β i ) i = 1 n c o s β i
where h ¯ c y c l e _ k is the glaciers elevation mean of k th cycle, h i is the corrected height of the i th point, β i is the latitude of the i th point.
Limited by the spatial coverage of ICESat-2 data, we used a hypsometric approach to extrapolate the total Svalbard regions to estimate Svalbard-wide elevation change [4,9,17,18,21]. The data is processed as follows:
  • The bin was defined by 50 m elevation bands according to the altitudes from the DEM. For example, the 50–100 m bin was defined as the locations with the altitude between 50 and 100 m. Meanwhile, the areas of each bin were calculated;
  • There were n points in a certain bin, and the dh/dt of each point was firstly calculated. Then, all dh/dt values were averaged. Hence, we formed a dh/dt data series varying with elevation. To fill the data gap of bins due to lack of points, a fourth order polynomial curve was used to fit data series;
  • To calculate the dh/dt over a certain region, a weighted average was used where the area was taken as weight.

3.2.2. Mass Balance Estimate

Using the dh/dt, the volume change rate (dV/dt) for a certain region was finally calculated from the following equation:
d V / d t = i = 1 n ( d h i / d t ) · A i
where n is the number of bins, dh i / d t is the average elevation change rate of the i th bin, and A i is the corresponding area of the th bin.
In order to estimate mass balance of Svalbard from 2019 to 2021, three density conversion schemes were calculated and compared:
  • dM1/dt: using the ice density of 917 kg m−3 [34];
  • dM2/dt: a firn density is applied with 510 kg m−3 [4].
  • dM3/dt: the change is divided into three parts, the uppermost 1/3 elevation from firn and the lowermost 1/3 from ice, and the rest with a linearly increasing density from firn to ice [9].

3.2.3. Error Assessment

Over non-glaciated areas, such as rocky and solid ground, the surface elevations may have slight change over a short time (Figure 1b). Hence, we ignored the elevation change of ice-free ground to estimate the satellite measurement error σ M E A [21], which was calculated from the following:
σ M E A = i = 1 n ( d h i / d t ) 2 n
where n is the number of points over ice-free ground, and d h i / d t is the elevation change rate of the i th point.
On the other hand, an additional error source arises from extrapolation σ E X T of a limited number of dh/dt points to the entire glaciated surface [21]. We followed [21] and used the standard deviation of glacial dh/dt within each 50 m elevation bin as an approximation for the extrapolation error σ E X T . Both σ M E A and σ E X T are random. Therefore, the total elevation change σ was calculated from the following:
σ = σ M E A 2 + σ E X T 2
We further calculated error of mass balance from the density schemes and σ .

4. Results

4.1. Elevation Change of Svalbard

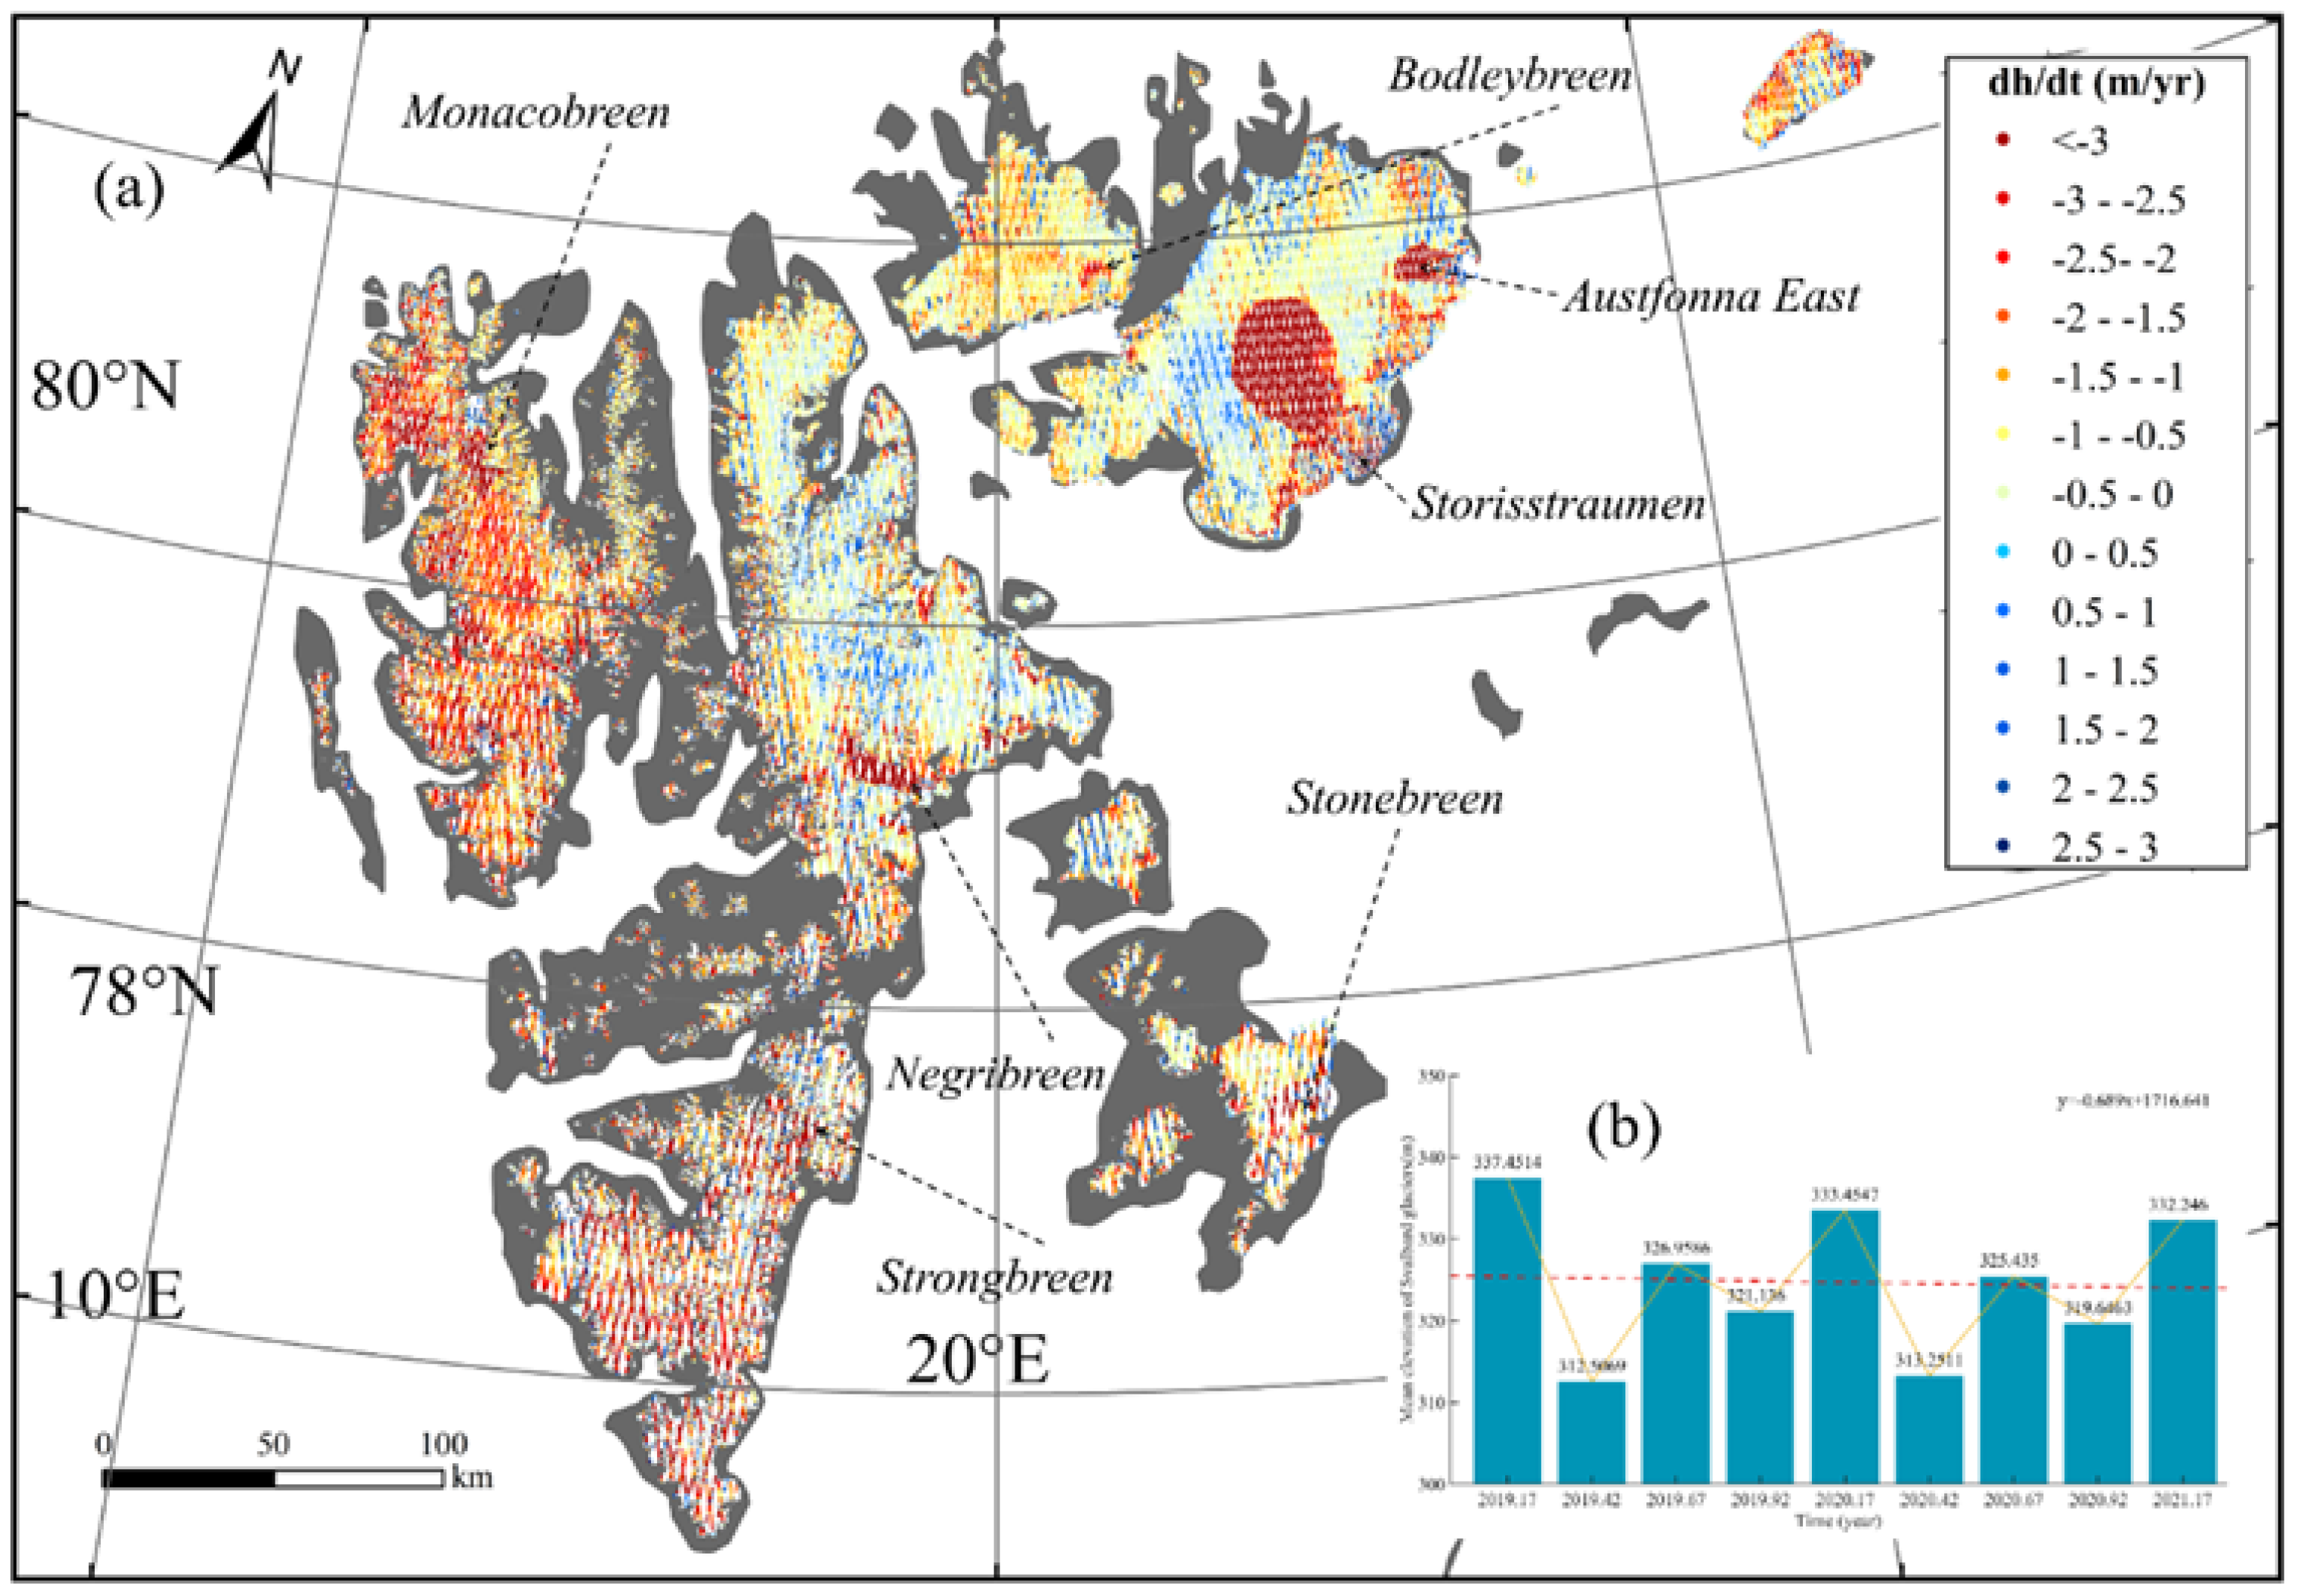
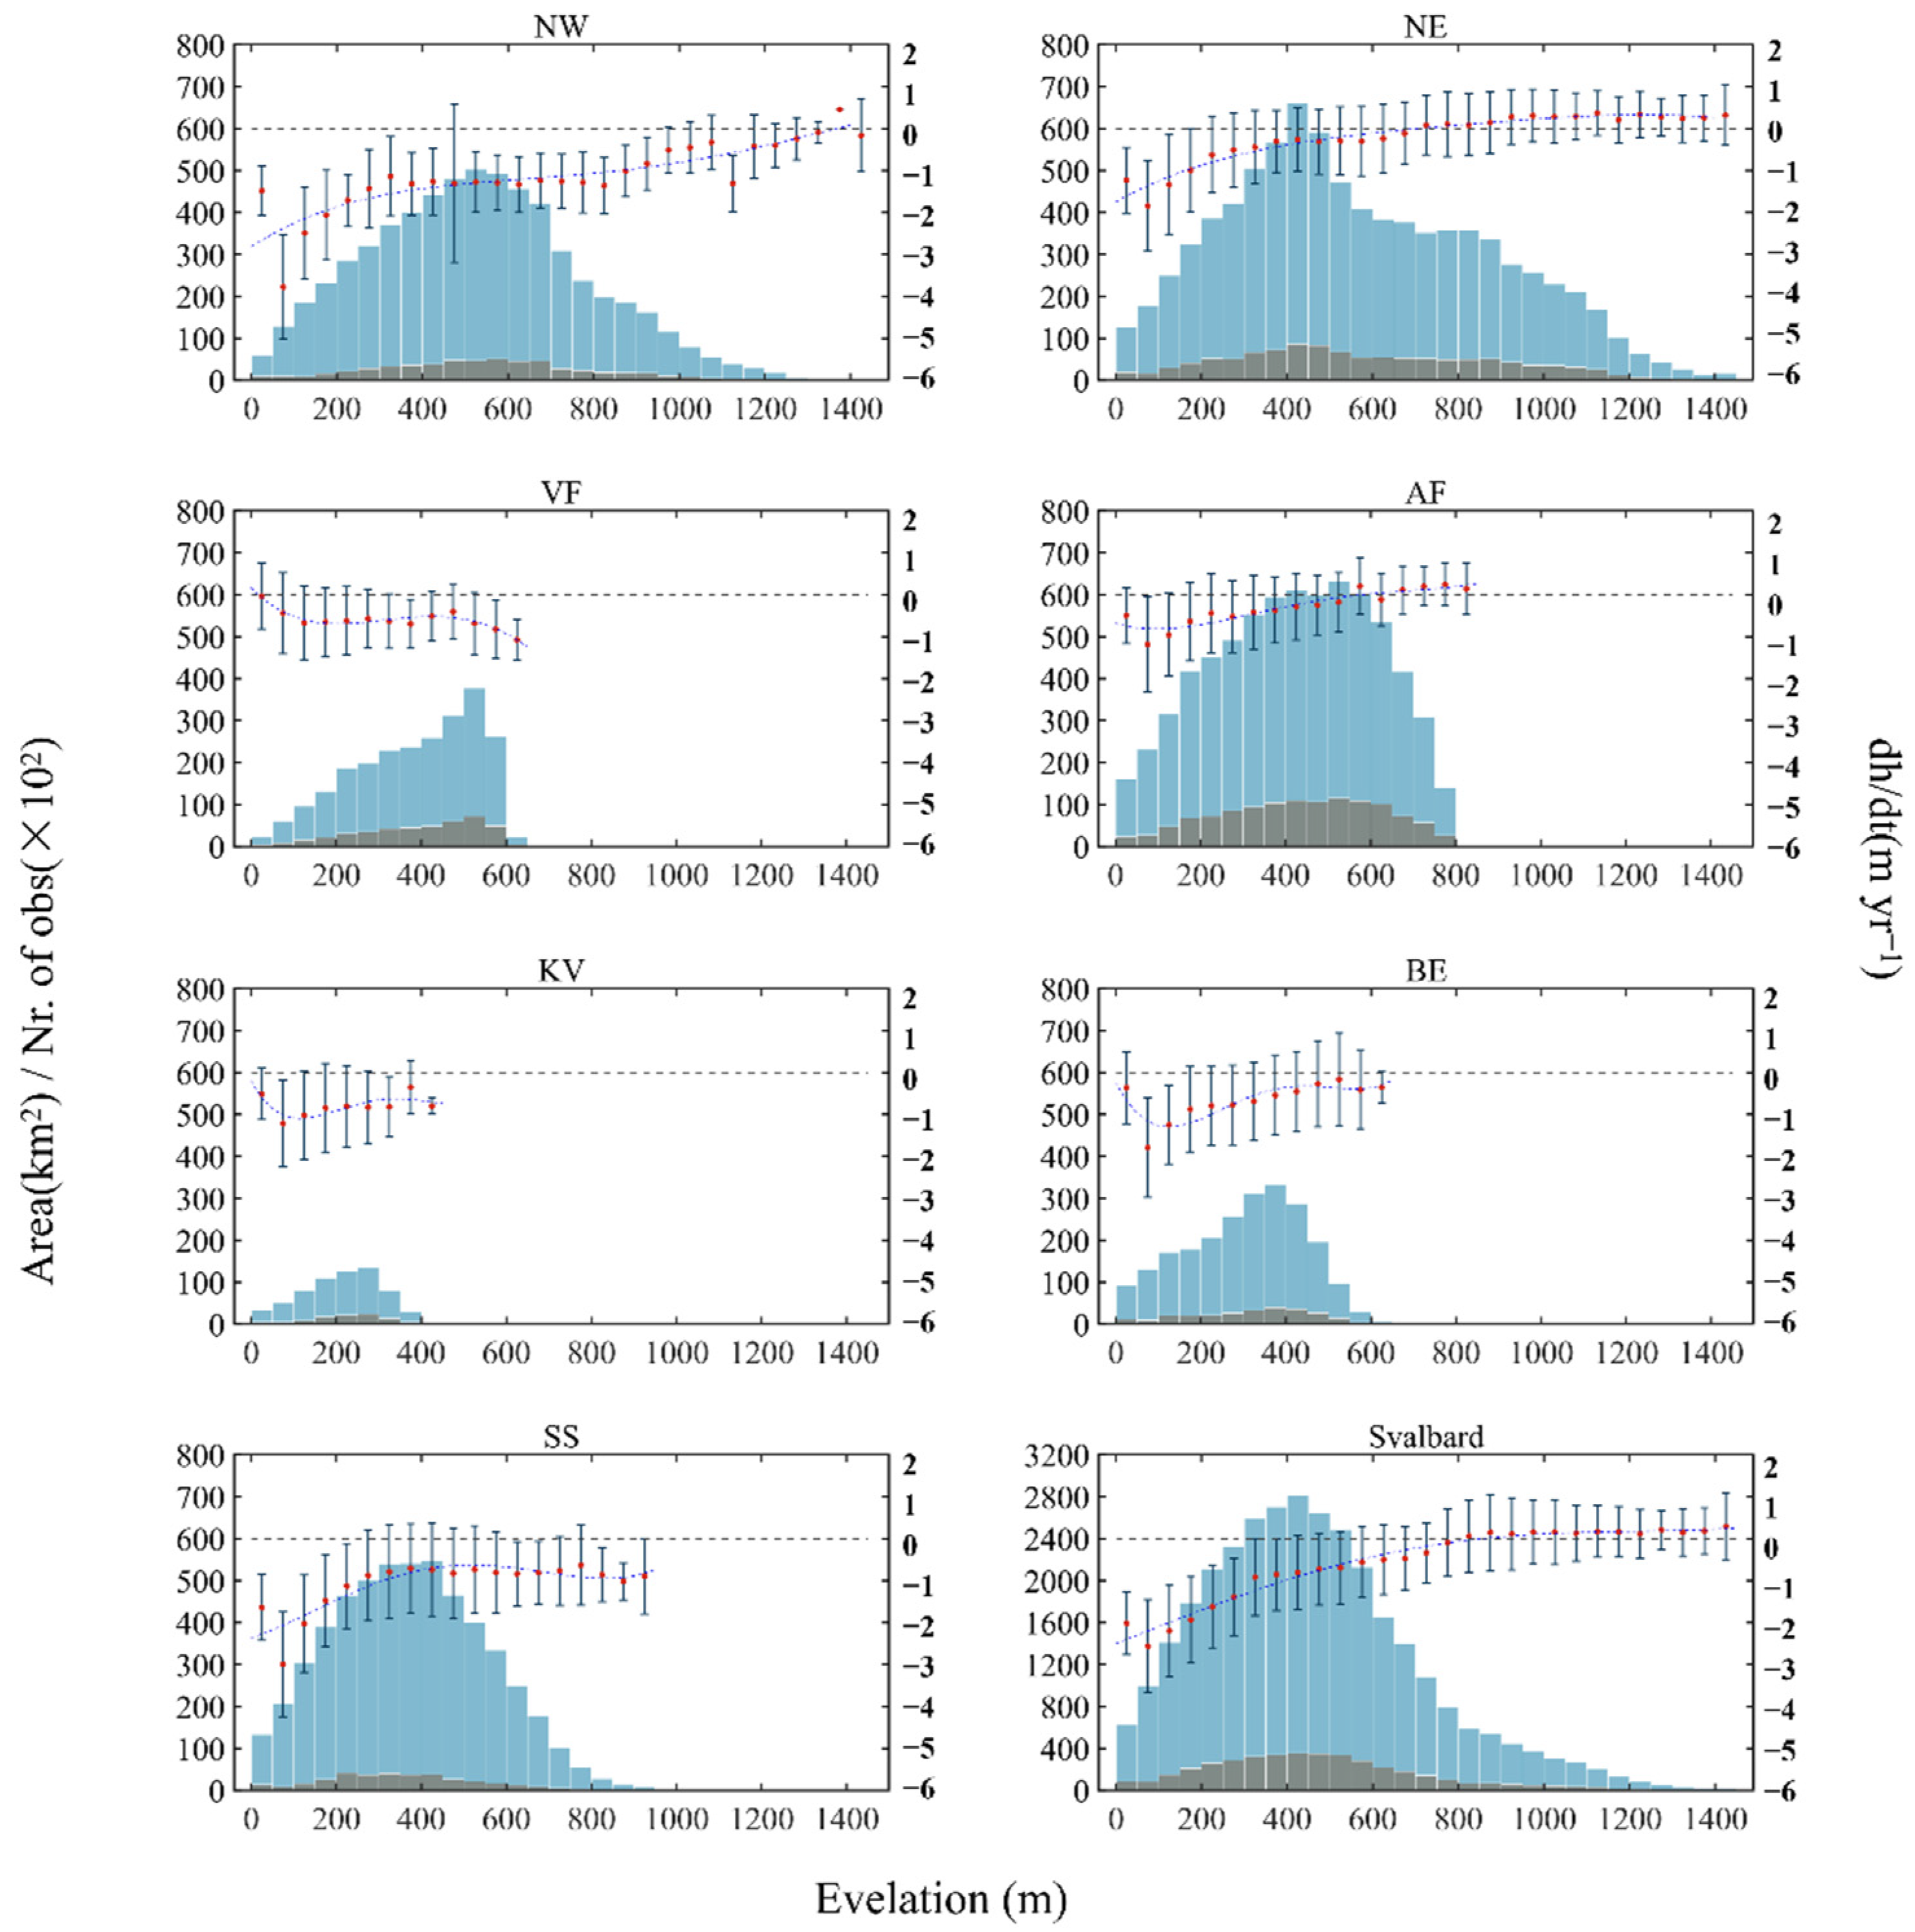
The elevation change was calculated and shown in Figure 2a. The elevation thinning is a general pattern at low and middle altitudes, and slight thickening at high altitudes. For Svalbard, the significant thinning rate of ~−2.5 m yr−1 occurs at low altitudes (<150 m), and the slight thickening <0.3 m yr−1 is observed at high altitudes (>750 m). The elevation thinning gradient from southwest to northeast is visible, which is consistent with the ICESat [9] and Cryosat-2 period [4].
For subregions, severe elevation decrease is observed at NW and SS, including an elevation decrease of up to ~−3 m yr−1 at low altitudes (<150 m). Compared with ICESat results in 2003–2008, slight thickening at high altitude has almost disappeared (Figure 3). The obvious glacier thinning is also present in BE, KV and VF. The negative elevation changes are observed at all altitudes below 700 m (Figure 3), while it is more modest with ~−1 m yr−1 at NE and AF. The increasing trend is evident with ~0.5 m yr−1 at high altitudes (>700 m) in the central (Figure 2).
It is noted that the extreme thinning is significant at Storisstraumen in AF, which is up to −13.4 m yr−1 due to surging event. This is higher than ICESat period (up to −10 m yr−1), but lower than Cryosat-2 period (up to −20 m yr−1). To avoid abnormal evaluation of AF elevation change caused by Storisstraumen, all values of Storisstraumen were listed separately in this paper. Overall, compared with ICESat and Cryosat-2 periods, the elevation thinning at the low and middle altitude is accelerating, and the area of slight thickening at the high altitudes is decreasing.
We further calculated the regional elevation change, which is presented in Table 1. The dh/dt of Svalbard is −0.775 ± 0.225 m yr−1, which is about 6.5 times that of the ICESat period (−0.12 m yr−1) [9] and 1.4 times that of the Cryosat-2 period (−0.54 m yr−1) [21], showing an accelerated thinning trend. Meanwhile, the mean elevation time series of Svalbard glaciers in 2019–2021 is shown in Figure 2b. The largest mean elevation of glaciers in 2019–2021 is 337.451 m, and the smallest is 312.507 m. The mean elevations change with seasons and show a thinning trend. The elevation thinning rate is −0.69 m yr−1, which is similar to the result of extrapolation method (−0.775 ± 0.225 m yr−1).
However, the spatial distribution varies with location. For example, the most severe elevation decrease is observed in NW, with the value −1.264 ± 0.254 m yr−1, followed by the SS with −0.844 ± 0.193 m yr−1. Compared with the southwest, the elevation of the northeast decreases much slower. The smallest thinning rate is observed in AF with −0.338 ± 0.182 m yr−1. Furthermore, the elevation change rate of Storisstrumen is about −2.703 ± 0.182 m yr−1, which is a similar to −2.35 ± 0.09 m yr−1 from 2003–2008 to 2019 [21].
We also investigated the seasonal elevation change in 2019–2021, which reflects the process of glacier mass accumulation and ablation. They are −1.006 ± 0.205 m and 0.393 ± 0.178 m, respectively. All subregions experience summer decrease and winter increase except Storisstrumen, while it is ablated all year round (Table 1). The largest d h s of subregions is shown at NW up to −1.688 ± 0.035 m, and the lowest −0.715 ± 0.053 m at KV. For d h w , the largest value is observed at SS with 0.631 ± 0.304 m, and the lowest 0.078 ± 0.136 m at KV.

4.2. Volume Change and Mass Balance

We further calculated the volume change rate for the entire Svalbard and its seven parts shown in Table 2. The volume change rate of Svalbard between 2019 and 2021 is −24.759 ± 7.598 km3 yr−1. All the subregions have experienced volume losses. Among the seven regions, NW is the largest contributor with −7.869 ± 1.580 km3 yr−1, while KV contributes the smallest with only −0.498 ± 0.070 km3 yr−1.
We further estimated the mass change from volume change with different density conversion schemes (Table 2). As the largest density difference between scheme 1 and 2, their mass difference between dM1/dt and dM2/dt is obvious. The two results can be viewed as the boundary, varying between −12.627 ± 3.875 and −22.704 ± 6.968 Gt yr−1. This corresponds to the contribution to a global sea level rise about 0.035–0.062 mm yr−1. Moreover, the result of dM3/dt is used in this paper. Similar to volume change, NW experiences the highest mass loss, followed by SS. The two regions contribute more than 50% mass loss of Svalbard, while KV has the least mass loss with −0.273 ± 0.041 Gt yr−1.

5. Discussion

5.1. Acceleration of Elevation and Mass Change

The elevation changes of glaciers in the Svalbard and subregions decrease with the increase of altitude, and their rates show a high southwest–low northeast gradient. These characteristics have been confirmed in previous studies [9,21]. In addition, the thinning at higher altitudes leads to the retreat of the equilibrium line altitude (ELA). The mean ELA of Svalbard in ICESat period is located in ~500 m a.s.l, which has retreated to ~750 m a.s.l between 2019 and 2021 (Figure 3). However, whether this retreat is temporary or permanent needs more observation. Moreover, the thinning rates at the lowest altitude (<50 m) is smaller than that at 50–100 m elevation bin (Figure 3), which is also occurs in 2003–2008 ICESat periods [21]. One possible conjecture is that this is related to the mass loss caused by the front disintegration of glaciers. The front disintegration of glaciers leads to the terminal retreat [21], and the elevation of the exposed land will no longer change.
We investigated the elevation change and mass loss of Svalbard since 1965 shown in Table 3. Since 1965, Svalbard has experienced accelerating glacier thinning and mass loss. Compared with the results obtained by ICESat in 2003–2008, the Svalbard-wide elevation change rate has increased more than 6.5 times (−0.12 ± 0.04 m yr−1). Additionally, there are also 158.3% and 43.5% increase compared with 2003–2008 to 2019 (−0.3 ± 0.15 m yr−1) and 2011–2017 (−0.54 ± 0.10 m yr−1), separately. For the subregions, the elevation change rates of four regions (NW, NE, VF and AF) have increased in nonlinear fashion since 2003. In particular, the mass loss in NW has been increasing since 1965, which makes this the region with the highest dM/dt in 2019–2021. Moreover, the elevation change rates of the other three regions (KV, SS, and BE) are relatively constant. Additionally, the elevation change of Storisstraumen is still extremely large.
The mass loss of Svalbard also shows an accelerating trend. Nevertheless, the mass loss rate of ICESat-2 in 2019–2021 is slightly smaller than the value derived by CryoSat-2 in 2011–2017. The reason is that a larger density conversion scheme (850 kg m−3) was adopted and got a larger estimated mass loss rate [21]. If the same scheme is used, the current mass loss rate has increased by 31.5% compared with CryoSat-2 period. Therefore, the comparison of elevation change may be more direct and reasonable than mass change because the influence of different density conversion schemes is excluded. Overall, the mass loss of Svalbard is accelerating, and the mass changes in subregions are complex and diverse.

5.2. Contribution of Surge Events

The surge behavior driven by internal ice dynamics is one important reason for the ice mass loss [25]. The most striking surge occurred at Storisstraumen in AF. The surge was firstly observed in 2012 [35], when its contribution to mass loss is 19.9%. While the proportion decreased to 14.4% during the ICESat-2 period (Table 2), due to accelerating mass losses in other regions. Moreover, the surge events lead to the obvious larger elevation thinning than nearby zone. During ICESat and CryoSat-2 periods, this is observed in the typical surge-type glaciers Monacobreen, Negribreen and Stonebreen. The surge of Monacobreen, Negribreen and Stonebreen was initiated in 2017/2018, 2016 and 2012 [36,37,38], respectively. Furthermore, the abnormal elevation changes are also observed at the front of the other glaciers, such as Bodleybreen, Austfonna East and Strongbreen shown in Figure 2a. Therefore, based on the increased surge events found in this study and the surging glaciers confirmed by previous studies, we speculate that Svalbard possibly has entered the active surge phase, leading to the acceleration of Svalbard mass loss. However, the contribution of surge events to glacier mass loss needs more research and analysis.

5.3. Links to Climate Change

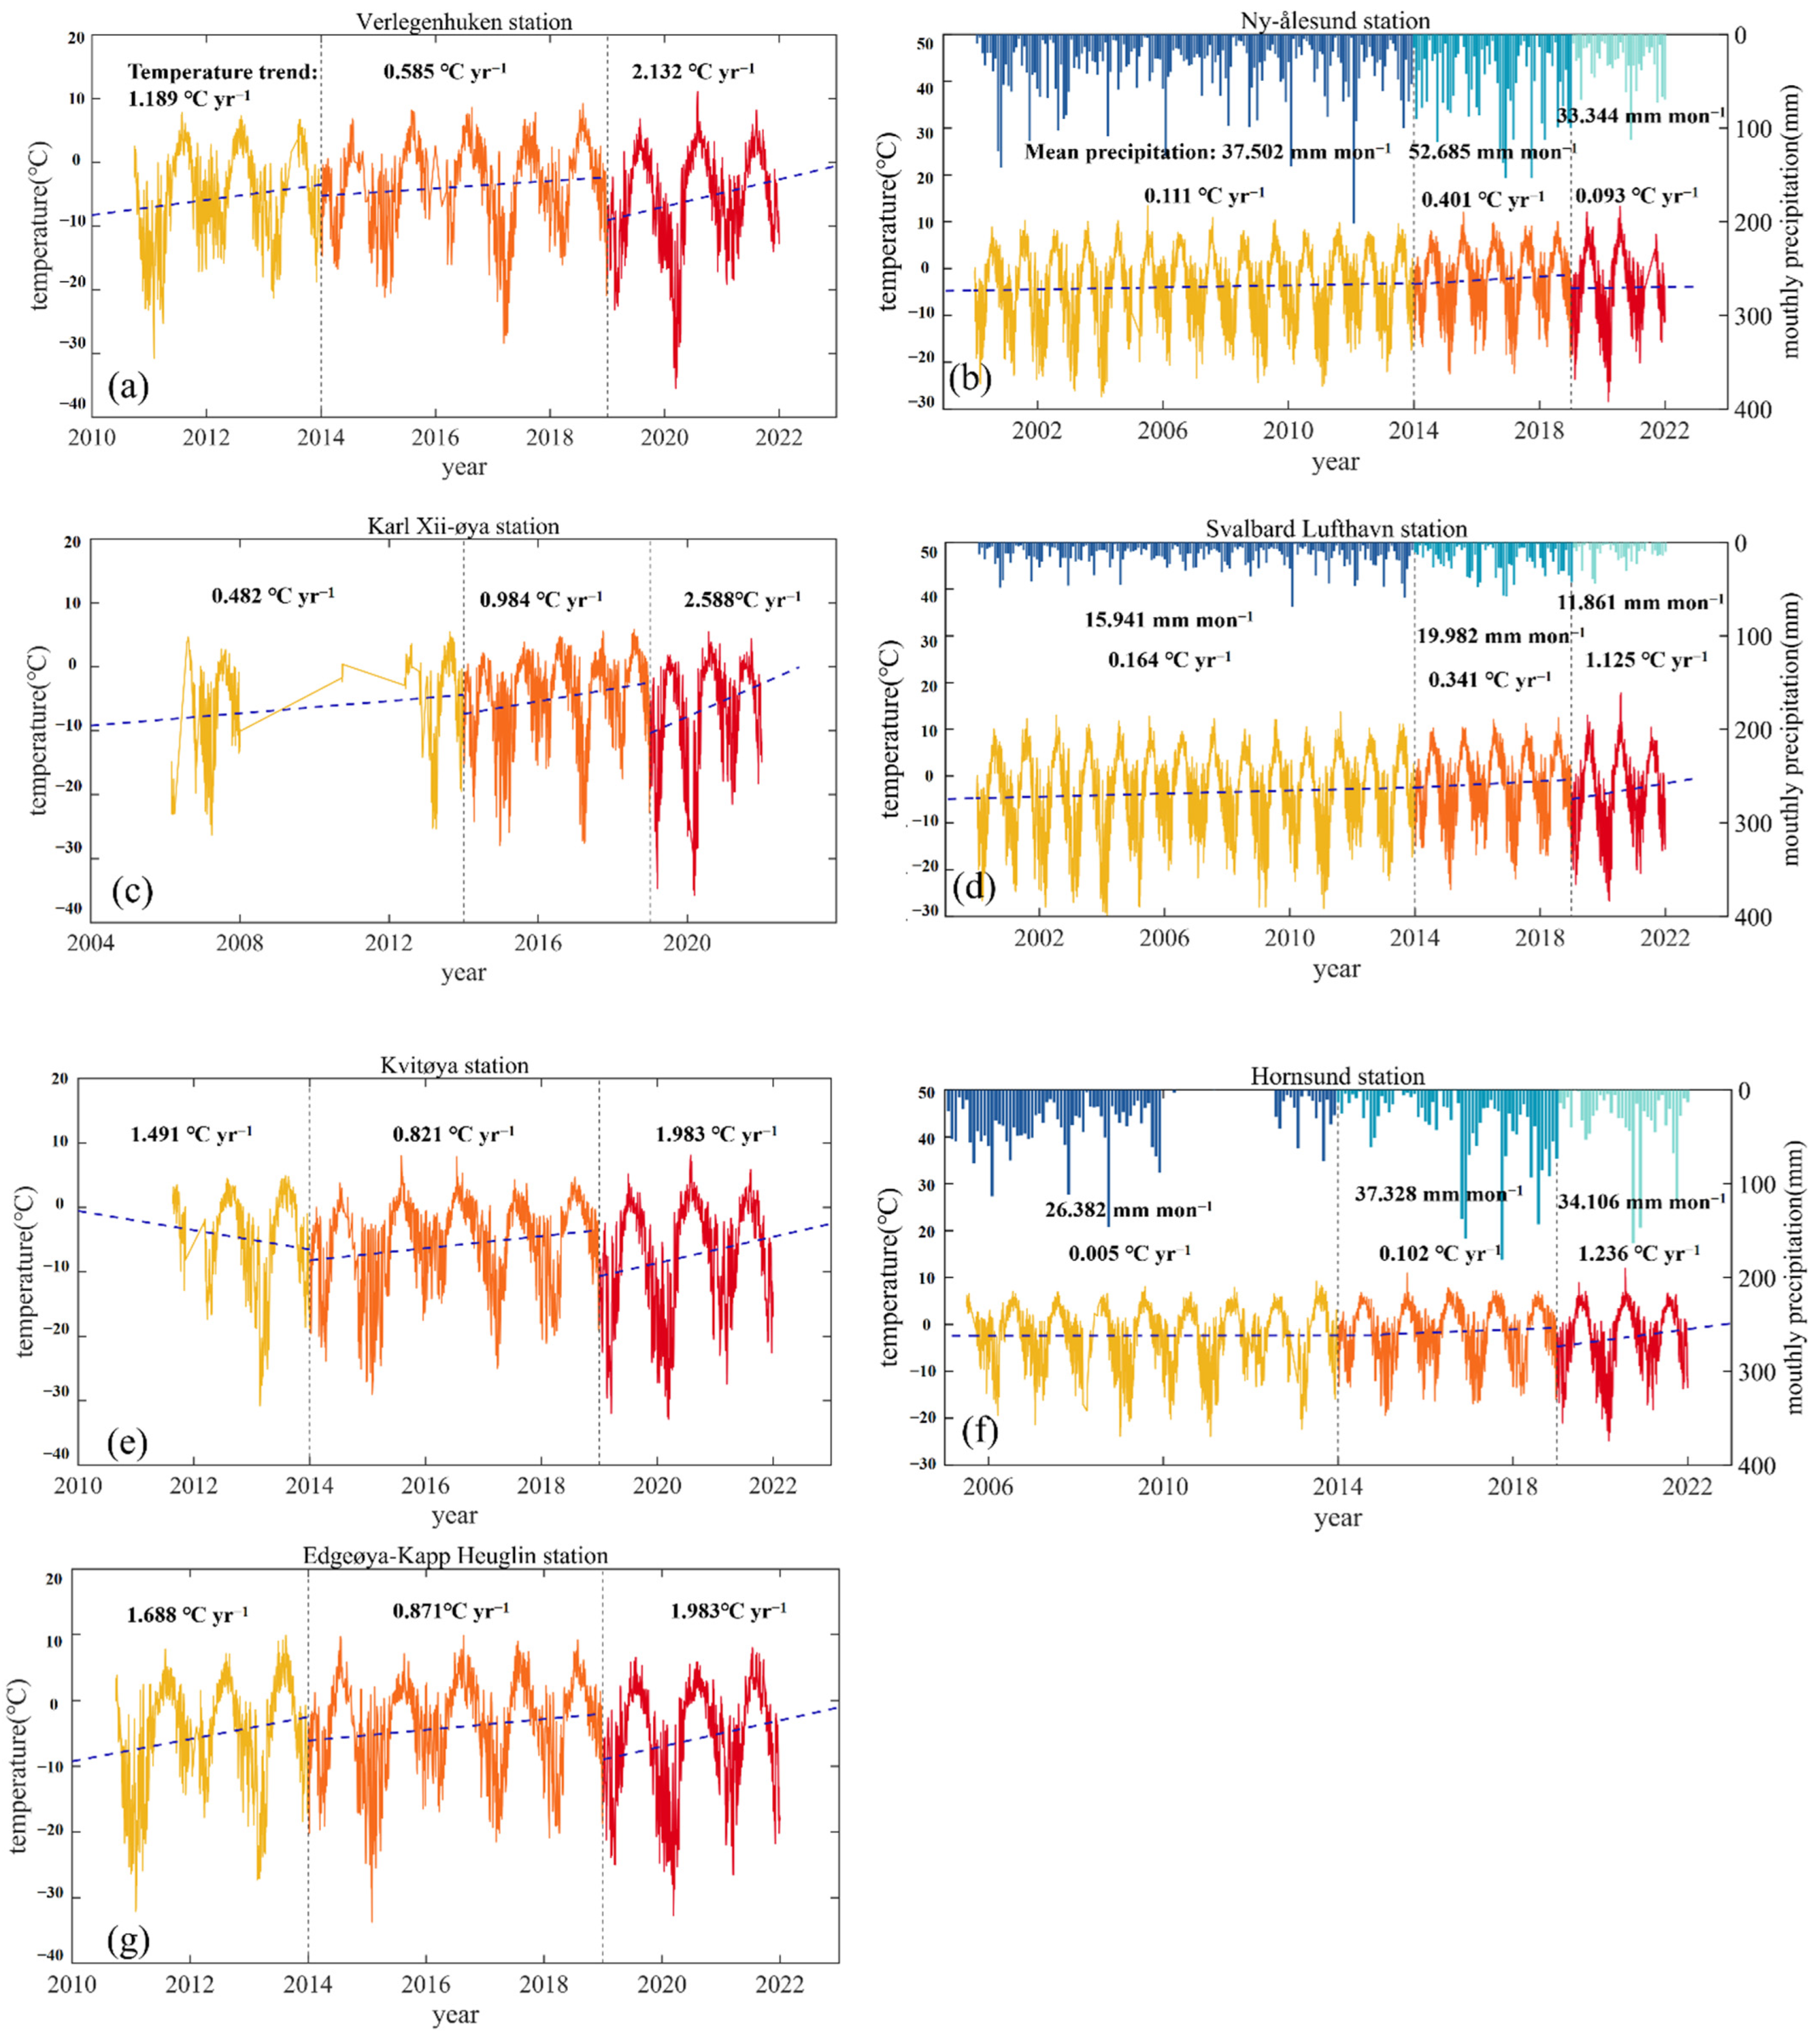
We also investigated the relationship between mass loss and climate parameters. The available temperature data from seven weather stations in Svalbard has been collected since 2000, only three stations include precipitation data. The station locations are shown in Figure 1a. All stations show an increasing rate of temperature (Figure 4). The increasing temperature leads to the accelerated melting and weakens the refreeze capacity of polythermal glaciers [39], resulting in accelerated mass loss. Moreover, the average precipitation from 2019 to 2021 is almost the same as in 2000–2014, but slightly lower than that of 2014–2019. Additionally, the stations are mainly located in the west and south of Svalbard, and the data in the east are missing. Therefore, the contribution of precipitation to mass loss is uncertain, and more data are needed. However, with climate warming, large precipitation amounts can fall as rain [40], which also play a similar role as meltwater and further weaken the firn-refreezing capacity of glaciers. Overall, one of the important drivers of mass loss of Svalbard during 2019–2021 is temperature, and the significant increase in temperature leads to the acceleration of the glacier mass loss.
In addition, atmospheric circulation and ocean temperature are also important parameters affecting the glacier mass balance. Research has shown that the atmospheric circulation was a northwesterly flow over Svalbard from 1979 to 2005, which has reduced the mass loss caused by Arctic climate warming [41]. However, since 2013, the circulation over Svalbard has changed into a warm south–southwesterly flow, which has accelerated the glacier melting [41]. This may also be one of the reasons why the mass loss in ICESat-2 period (2019–2021) is much greater than that in ICESat period (2003–2008). On the other hand, ocean temperature also affects the mass balance. From 2011 to 2017, the ocean temperature on the western coast of Svalbard was significantly higher than that on the eastern coast, about 1–2 °C [20]. This is consistent with the trend of mass loss. In general, the impact of climate change on glacier mass balance is complex and the remote sensing technology and modeling approach will be used in the further research.

6. Conclusions

In this study, the latest ICESat-2 data is used to investigate the elevation, volume, and mass change of Svalbard glaciers from 2019 to 2021. Using the repeat tracks method, elevation change rates are obtained from 424068 points. To fill the data gap, a hypsometric approach is adopted to obtain regional results. It is shown that the elevation change rate of Svalbard is −0.775 ± 0.225 m yr−1, corresponding to mass change of −14.843 ± 4.024 Gt yr−1. All regions exhibit negative mass balance during 2019–2021, including the highest thinning rates at the southwest regions (NW, SS) and less elevation decrease rates at the northwest regions (NE, VF, AF). Slight thickening is only limited to the interior parts of AF and NS. Compared with ICESat/ICESat-2 period (2003–2008 to 2019) and Cryosat-2 period (2011–2017), the mass loss rate of Svalbard has increased by 158.3% and 31.5%, respectively, showing significant acceleration.
Derived rates of elevation change show Svalbard has possibly entered the active surge phase. Storisstraumen is the most striking region, accounting for 14.4% mass loss of Svalbard in 2019–2021. The surge-type glaciers lead to the obvious larger elevation thinning than nearby zone, which is one important reason for the ice mass loss. Meanwhile, another important driver of accelerated mass loss is temperature. Based on the in situ data around Svalbard since 2000, it is found that temperature has been increasing, which leads to the accelerated melting and weakens the refreeze capacity of glaciers. Atmospheric circulation and ocean temperature are also important parameters affecting the glacier mass balance. In total, the overall accelerated glacier mass loss in Svalbard is expected to be caused by increasing surge events and temperature rise.

Author Contributions

Methodology, J.W.; validation, J.W. and L.L.; formal analysis, J.W.; resources, J.W., Y.Y. and L.L.; data curation, J.W.; writing—original draft preparation, J.W.; writing—review and editing, C.W.; supervision, Y.Y.; funding acquisition, Y.Y. All authors have read and agreed to the published version of the manuscript.

Funding

This research was funded by the National Natural Science Foundation of China (NSFC), grant number 42076234, 41876227.

Acknowledgments

We are highly obliged to the National Snow and Ice Data Center (NSIDC), Norwegian Polar Institute (NPI) and Norwegian Center for Climate Services for providing the required data. We thank anonymous reviewers for raising constructive comments that led to a substantially improved manuscript.

Conflicts of Interest

The authors declare no conflict of interest.

References

  1. Bojinski, S.; Verstraete, M.; Peterson, T.C.; Richter, C.; Simmons, A.; Zemp, M. The Concept of Essential Climate Variables in Support of Climate Research, Applications, and Policy. Bull. Am. Meteorol. Soc. 2014, 95, 1431–1443. [Google Scholar] [CrossRef]
  2. Małecki, J. Elevation and volume changes of seven Dickson Land glaciers, Svalbard, 1960–1990–2009. Polar Res. 2013, 32, 18400. [Google Scholar] [CrossRef]
  3. Meier, M.F.; Dyurgerov, M.B.; Rick, U.K.; O’Neel, S.; Pfeffer, W.T.; Anderson, R.S.; Anderson, S.P.; Glazovsky, A.F. Glaciers Dominate Eustatic Sea-Level Rise in the 21st Century. Science 2007, 317, 1064–1067. [Google Scholar] [CrossRef] [PubMed] [Green Version]
  4. Nuth, C.; Moholdt, G.; Kohler, J.; Hagen, J.O.; Kaab, A. Svalbard glacier elevation changes and contribution to sea level rise. J. Geophys. Res. Earth Surf. 2010, 115, F01008. [Google Scholar] [CrossRef] [Green Version]
  5. Noel, B.; Jakobs, C.L.; van Pelt, W.J.J.; Lhermitte, S.; Wouters, B.; Kohler, J.; Hagen, J.O.; Luks, B.; Reijmer, C.H.; van de Berg, W.J.; et al. Low elevation of Svalbard glaciers drives high mass loss variability. Nat. Commun. 2021, 11, 4597. [Google Scholar] [CrossRef] [PubMed]
  6. Wang, Z.M.; Yan, B.Y.; Ai, S.T.; Holmen, K.; An, J.C.; Ma, H.M. Quantitative analysis of Arctic ice flow acceleration with increasing temperature. Acta Oceanal. Sin. 2021, 40, 22–32. [Google Scholar] [CrossRef]
  7. Ai, S.; Ding, X.; Tolle, F.; Wang, Z.; Zhao, X. Latest Geodetic Changes of Austre Lovénbreen and Pedersenbreen, Svalbard. Remote Sens. 2019, 11, 2890. [Google Scholar] [CrossRef] [Green Version]
  8. Ai, S.; Wang, Z.E.D.; Holmén, K.; Tan, Z.; Zhou, C.; Sun, W. Topography, ice thickness and ice volume of the glacier Pedersenbreen in Svalbard, using GPR and GPS. Polar Res. 2014, 33, 18533. [Google Scholar] [CrossRef] [Green Version]
  9. Moholdt, G.; Nuth, C.; Hagen, J.O.; Kohler, J. Recent elevation changes of Svalbard glaciers derived from ICESat laser altimetry. Remote Sens. Environ. 2010, 114, 2756–2767. [Google Scholar] [CrossRef]
  10. Farinotti, D.; Huss, M.; Furst, J.J.; Landmann, J.; Machguth, H.; Maussion, F.; Pandit, A. A consensus estimate for the ice thickness distribution of all glaciers on Earth. Nat. Geosci. 2019, 12, 168–173. [Google Scholar] [CrossRef] [Green Version]
  11. Geyman, E.C.; van Pelt, W.J.J.; Maloof, A.C.; Aas, H.F.; Kohler, J. Historical glacier change on Svalbard predicts doubling of mass loss by 2100. Nature 2022, 601, 374–379. [Google Scholar] [CrossRef] [PubMed]
  12. Elagina, N.; Kutuzov, S.; Rets, E.; Smirnov, A.; Chernov, R.; Lavrentiev, I.; Mavlyudov, B. Mass Balance of Austre Grønfjordbreen, Svalbard, 2006–2020, Estimated by Glaciological, Geodetic and Modeling Aproaches. Geosciences 2021, 11, 78. [Google Scholar] [CrossRef]
  13. Małecki, J. Accelerating retreat and high-elevation thinning of glaciers in central Spitsbergen. Cryophere 2016, 10, 1317–1329. [Google Scholar] [CrossRef] [Green Version]
  14. Brenner, A.C.; DiMarzio, J.R.; Zwally, H.J. Precision and Accuracy of Satellite Radar and Laser Altimeter Data Over the Continental Ice Sheets. IEEE Trans. Geosci. Remote Sens. 2007, 45, 321–331. [Google Scholar] [CrossRef]
  15. Zwally, H.J.; Brenner, A.C.; Major, J.A.; Bindschadler, R.A.; Marsh, J.G. Growth of Greenland Ice Sheet: Measurement. Science 1989, 246, 1587–1589. [Google Scholar] [CrossRef]
  16. Wingham, D.J.; Ridout, A.J.; Scharroo, R.; Arthern, R.J.; Shum, C.K. Antarctic Elevation Change from 1992 to 1996. Science 1998, 282, 456–458. [Google Scholar] [CrossRef]
  17. Wang, Q.; Yi, S.; Sun, W. Continuous Estimates of Glacier Mass Balance in High Mountain Asia Based on ICESat-1, 2 and GRACE/GRACE Follow-On Data. Geophys. Res. Lett. 2021, 48, e2020GL090954. [Google Scholar] [CrossRef]
  18. Shen, C.; Jia, L.; Ren, S. Inter-and Intra-Annual Glacier Elevation Change in High Mountain Asia Region Based on ICESat-l&2 Data Using Elevation-Aspect Bin Analysis Method. Remote Sens. 2022, 14, 1630. [Google Scholar] [CrossRef]
  19. Morris, A.; Moholdt, G.; Gray, L. Spread of Svalbard Glacier Mass Loss to Barents Sea Margins Revealed by CryoSat-2. J. Geophys. Res. Earth Surf. 2020, 125, e2019JF005357. [Google Scholar] [CrossRef]
  20. Li, R.X.; Li, H.W.; Hao, T.; Qiao, G.; Cui, H.T.; He, Y.Q.; Hai, G.; Xie, H.; Cheng, Y.; Li, B.F. Assessment of ICESat-2 ice surface elevations over the Chinese Antarctic Research Expedition (CHINARE) route, East Antarctica, based on coordinated multi-sensor observations. Cryosphere 2021, 15, 3083–3099. [Google Scholar] [CrossRef]
  21. Sochor, L.; Seehaus, T.; Braun, M.H. Increased Ice Thinning over Svalbard Measured by ICESat/ICESat-2 Laser Altimetry. Remote Sens. 2021, 13, 2089. [Google Scholar] [CrossRef]
  22. Millan, R.; Mouginot, J.; Rabatel, A.; Morlighem, M. Ice velocity and thickness of the world’s glaciers. Nat. Geosci. 2022, 15, 124–129. [Google Scholar] [CrossRef]
  23. Hugonnet, R.; McNabb, R.; Berthier, E.; Menounos, B.; Nuth, C.; Girod, L.; Farinotti, D.; Huss, M.; Dussaillant, I.; Brun, F.; et al. Accelerated global glacier mass loss in the early twenty-first century. Nature 2021, 592, 726–731. [Google Scholar] [CrossRef] [PubMed]
  24. Nordli, O.; Wyszynski, P.; Gjelten, H.M.; Isaksen, K.; Lupikasza, E.; Niedzwiedz, T.; Przybylak, R. Revisiting the extended Svalbard Airport monthly temperature series, and the compiled corresponding daily series 1898–2018. Polar Res. 2020, 39, 3614. [Google Scholar] [CrossRef]
  25. Blaszczyk, M.; Jania, J.A.; Hagen, J.O. Tidewater glaciers of Svalbard: Recent changes and estimates of calving fluxes. Pol. Polar Res. 2009, 30, 85–142. [Google Scholar]
  26. Ostby, T.I.; Schuler, T.V.; Hagen, J.O.; Hock, R.; Kohler, J.; Reijmer, C.H. Diagnosing the decline in climatic mass balance of glaciers in Svalbard over 1957–2014. Cryosphere 2017, 11, 191–215. [Google Scholar] [CrossRef] [Green Version]
  27. Farnsworth, W.R.; Ingolfsson, O.; Retelle, M.; Schomacker, A. Over 400 previously undocumented Svalbard surge-type glaciers identified. Geomorphology 2016, 264, 52–60. [Google Scholar] [CrossRef]
  28. NASA. Algorithm Theoretical Basis Document (ATBD) For Land-Ice Along-Track Products Part 2: Land-Ice H(t)/ATL11. Maryland, USA. 2021. Available online: https://icesatiimis.gsfc.nasa.gov/ (accessed on 6 August 2022).
  29. Aas, H.F.; Moholdt, G. Merged NPI-ArcticDEM Svalbard Digital Elevation Model; Norwegian Polar Institute: Tromsø, Norway, 2020. [Google Scholar] [CrossRef]
  30. RGI Consortium. Randolph Glacier Inventory—A Dataset of Global Glacier Outlines: Version 6.0: Technical Report, Global Land Ice Measurements from Space. Colorado, USA. 2017. Available online: http://www.glims.org/RGI/randolph60.html (accessed on 6 August 2022).
  31. Felikson, D.; Urban, T.J.; Gunter, B.C.; Pie, N.; Pritchard, H.D.; Harpold, R.; Schutz, B.E. Comparison of Elevation Change Detection Methods from ICESat Altimetry Over the Greenland Ice Sheet. IEEE Trans. Geosci. Remote Sens. 2017, 55, 5494–5505. [Google Scholar] [CrossRef]
  32. Smith, B.; Fricker, H.A.; Gardner, A.S.; Medley, B.; Nilsson, J.; Paolo, F.S.; Holschuh, N.; Adusumilli, S.; Brunt, K.; Csatho, B.; et al. Pervasive ice sheet mass loss reflects competing ocean and atmosphere processes. Science 2020, 368, 1239–1248. [Google Scholar] [CrossRef]
  33. Taubenberger, C.J.; Felikson, D.; Neumann, T. Brief communication: Preliminary ICESat-2 (Ice, Cloud and land Elevation Satellite-2) measurements of outlet glaciers reveal heterogeneous patterns of seasonal dynamic thickness change. Cryosphere 2022, 16, 1341–1348. [Google Scholar] [CrossRef]
  34. Huss, M. Density assumptions for converting geodetic glacier volume change to mass change. Cryosphere 2013, 7, 877–887. [Google Scholar] [CrossRef] [Green Version]
  35. Morris, A.; Moholdt, G.; Gray, L.; Schuler, T.V.; Eiken, T. CryoSat-2 interferometric mode calibration and validation: A case study from the Austfonna ice cap, Svalbard. Remote Sens. Environ. 2022, 269, 112805. [Google Scholar] [CrossRef]
  36. Banerjee, D.; Garg, V.; Thakur, P.K. Geospatial investigation on transitional (quiescence to surge initiation) phase dynamics of Monacobreen tidewater glacier, Svalbard. Adv. Space Res. 2022, 69, 1813–1839. [Google Scholar] [CrossRef]
  37. Haga, O.N.; McNabb, R.; Nuth, C.; Altena, B.; Schellenberger, T.; Kaab, A. From high friction zone to frontal collapse: Dynamics of an ongoing tidewater glacier surge, Negribreen, Svalbard. J. Glaciol. 2020, 66, 742–754. [Google Scholar] [CrossRef]
  38. Strozzi, T.; Kaab, A.; Schellenberger, T. Frontal destabilization of Stonebreen, Edgeøya, Svalbard. Cryosphere 2017, 11, 553–566. [Google Scholar] [CrossRef] [Green Version]
  39. Schuler, T.V.; Kohler, J.; Elagina, N.; Hagen, J.O.M.; Hodson, A.J.; Jania, J.A.; Kaab, A.M.; Luks, B.; Malecki, J.; Moholdt, G.; et al. Reconciling Svalbard Glacier Mass Balance. Front. Earth Sci. 2020, 8, 156. [Google Scholar] [CrossRef]
  40. Dobler, A.; Lutz, J.; Landgren, O.; Haugen, J.E. Circulation Specific Precipitation Patterns over Svalbard and Projected Future Changes. Atmosphere 2021, 11, 1378. [Google Scholar] [CrossRef]
  41. Lang, C.; Fettweis, X.; Erpicum, M. Stable climate and surface mass balance in Svalbard over 1979–2013 despite the Arctic warming. Cryophere 2015, 9, 83–101. [Google Scholar] [CrossRef] [Green Version]
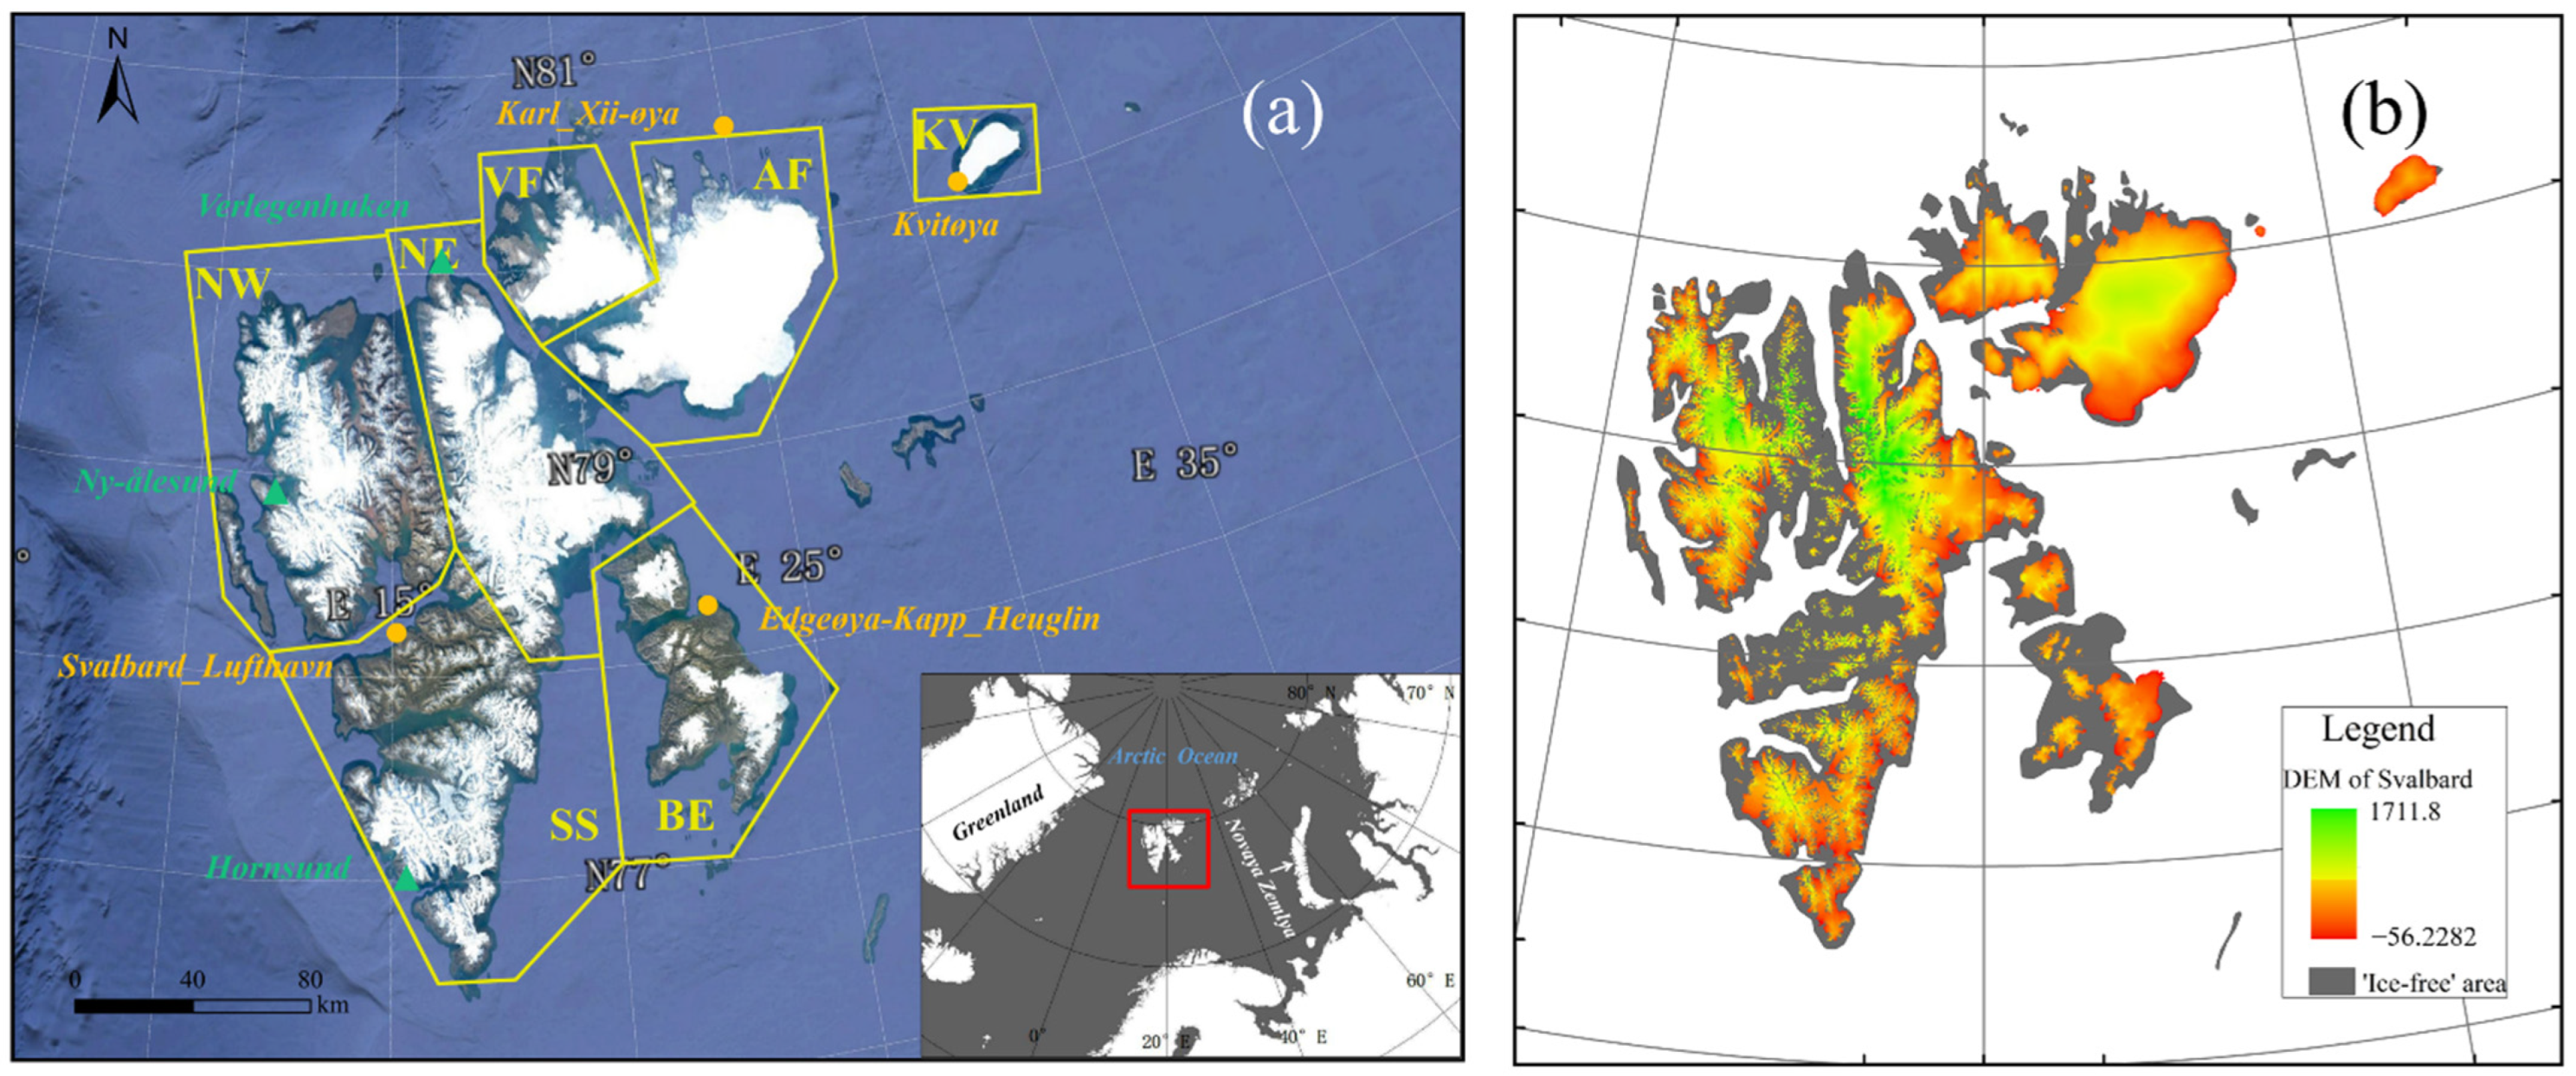
Figure 1. (a)The location of Svalbard Archipelago and seven subregions division. The orange circle and the green triangle represent the location of the temperature weather station and temperature and precipitation meteorological station. (b) The DEM of Svalbard glaciers and the range of ‘ice-free’ area (grey region).
Atmosphere 13 01255 g001
Figure 2. (a) Average glacier elevation change rates (dh/dt) across the Svalbard archipelago in 2019–2021. (b) Mean elevation time series of Svalbard glaciers in 2019–2021. Blue bar is the mean elevation, red dashed line is the trend line.
Atmosphere 13 01255 g002
Figure 3. Hypsometries for each subregions (Figure 1) and for the whole Svalbard. The red points indicate the mean dh/dt values, the error bars are the standard deviation of dh/dt values, the blue dashed line indicates fourth-order fitting trend line for all mean dh/dt values. The blue bars are the Glacier area and the gray bars represent the number of dh/dt observations per elevation bin.
Atmosphere 13 01255 g003
Figure 4. The temperature and precipitation data collected by the gauge stations. (a) Verlegenhuken station. (b) Ny-ålesund station. (c) Karl Xii-øya station. (d) Svalbard Lufthavn station. (e) Kvitøya station. (f) Hornsund station. (g) Edgeøya-Kapp Heuglin station.
Atmosphere 13 01255 g004
Table 1. Glacier area, number of the points, annual elevation change rates (dh/dt), summer elevation changes ( d h s ) and winter elevation changes ( d h w ) for each subregion and the entire region of Svalbard.
RegionArea (km2)dh/dt (m yr−1) d h s (m) d h w (m)
NW6223−1.264 ± 0.254−1.688 ± 0.0350.319 ± 0.154
NE8462−0.358 ± 0.219−0.948 ± 0.1840.430 ± 0.148
VF2393−0.676 ± 0.147−0.931 ± 0.2970.287 ± 0.200
AF 17062−0.338 ± 0.182−0.876 ± 0.1240.355 ± 0.145
Storisstraumen1226−2.703 ± 0.182−2.597 ± 0.124−0.374 ± 0.145
KV646−0.769 ± 0.108−0.715 ± 0.0530.078 ± 0.136
SS5465−0.844 ± 0.193−1.574 ± 0.1270.631 ± 0.304
BE2294−0.622 ± 0.212−1.103 ± 0.4460.625 ± 0.149
Svalbard33771−0.775 ± 0.225−1.006 ± 0.2050.393 ± 0.178
1 Notes that all values for AF are without Storisstraumen throughout this study and Storisstraumen is a special area of extreme elevation change belonging to AF, not a subregion.
Table 2. Volume (dV/dt), and mass change (dM1/dt, dM2/dt and dM3/dt) rates for each subregion and the whole of Svalbard.
RegiondV/dt (km3 yr−1)dM1/dt (Gt yr−1)dM2/dt (Gt yr−1)dM3/dt (Gt yr−1)
NW−7.869 ± 1.580−7.216 ± 1.449−4.013 ± 0.945−5.032 ± 1.214
NE−3.037 ± 1.853−2.785 ± 1.699−1.549 ± 0.945−1.916 ± 1.439
VF−1.618 ± 0.352−1.484 ± 0.323−0.825 ± 0.180−0.885 ± 0.217
AF−2.387 ± 1.285−2.189 ± 1.178−1.217 ± 0.655−1.347 ± 0.743
Storisstraumen−3.314 ± 0.223−3.041 ± 0.204−1.690 ± 0.114−2.141 ± 0.149
KV−0.498 ± 0.070−0.456 ± 0.064−0.254 ± 0.036−0.273 ± 0.041
SS−4.610 ± 1.055−4.228 ± 0.967−2.351 ± 0.538−2.535 ± 0.655
BE−1.426 ± 0.486−1.308 ± 0.446−0.727 ± 0.248−0.733 ± 0.308
Svalbard−24.759 ± 7.598−22.704 ± 6.968−12.627 ± 3.875−14.843 ± 4.024
Table 3. Temporal elevation change of Svalbard and subregions and mass change for Svalbard, all elevation change values are in m yr−1, and mass change values are in Gt yr−1.
RegionNuth et al., 2010 [4]Moholdt et al., 2010 [9]Sochor et al., 2021 [21]Morris et al., 2020 [20]This Study
periodDEM&ICESat, 1965–1990 to 2005ICESat,
2003–2008
ICESat/ICESat-2, 2003–2008 to 2019CryoSat-2, 2011–2017ICESat-2, 2019–2021
NW−0.41 ± 0.02−0.54 ± 0.10−0.63 ± 0.21−0.56−1.264 ± 0.237
NE−0.25 ± 0.060.06 ± 0.06−0.07 ± 0.16−0.15−0.358 ± 0.193
VF0.05 ± 0.15−0.16 ± 0.08−0.09 ± 0.12−0.23−0.676 ± 0.108
AF−0.19 ± 0.060.11 ± 0.04−0.07 ± 0.09−0.62−0.338 ± 0.110
Storisstraumen−2.35 ± 0.09−2.44−2.703 ± 0.110
KV−0.46 ± 0.11−0.74 ± 0.09−0.769 ± 0.081
SS−0.55 ± 0.03−0.15 ± 0.16−0.80 ± 0.18−0.96−0.844 ± 0.177
BE−0.50 ± 0.05−0.17 ± 0.11−0.54 ± 0.13−1.14−0.622 ± 0.132
Elevation change of Svalbard (dh/dt)−0.36 ± 0.02−0.12 ± 0.04−0.3 ± 0.15−0.54 ± 0.10−0.775 ± 0.197
Mass change of Svalbard (dM/dt)−3.40 ± 1.60−12.21 ± 4.28−16.00 ± 3.00−14.843 ± 4.024
Publisher’s Note: MDPI stays neutral with regard to jurisdictional claims in published maps and institutional affiliations.