Abstract
Bushfire management which incorporates fire potential indices is still in its infancy in Jamaica and the Caribbean. In this study three bushfire potential indices—Keetch–Byram Drought Index (KBDI), Vapour Pressure Deficit (VPD) and Water Potential (Ψw)—are calculated for south-central Jamaica where bushfire frequencies are highest. The skills of the indices are evaluated using their representation of the normalised bushfire climatology, monthly and seasonal (December–March/DJFM; April–June/AMJ; July–August/JA and September–November/SON) fire variability for the periods 2013–2017, 2010–2019 and 2001–2019. Fire data are obtained from the MODIS C6 Archive and Jamaica Fire Brigade (JFB). The relationship between the fire indices and large-scale oceanic and atmospheric features are also examined. The results suggest that Ψw exhibits strong correlations with the MODIS and JFB climatologies and represents well the maxima in March and July and the local minima in May–June and October. Ψw and VPDI also show good hit rates for moderate and high-risk categories in south-central Jamaica (though with relatively high false alarm rates). Regression models premised on Ψw and VPD respectively show good skill in representing AMJ (R2 = 57–58%), SON (R2 = 57–58%) and JA (R2 = 57–60%) fire variability. Variability during DJFM is poorly captured by any fire index. Although the KBDI represents the normalised climatology reasonably well its peaks occur one month later, that is, in April and August. KBDI exhibits strong and statistically significant correlations with JFB and MODIS climatologies, but seasonal models premised on KBDI do not perform as well as for the other two indices except in JA. All indices had a statistically significant relationship on both monthly and 1 month lag time scales for NINO3 and TNA-NINO3 large-scale climate indices. The indices, and in particular Ψw, show good prospects for producing seasonal bushfire outlooks for south-central Jamaica and Jamaica in general. These results also suggest the usefulness of monitoring large-scale oceanic patterns as part of the monitoring framework for bushfires in the island.
Keywords:
KBDI; water potential; bushfire potential; vapour pressure deficit; Caribbean; Jamaica; SIDS 1. Introduction
Bushfire characterisation and management for Caribbean small island developing states (SIDS) is a new frontier. Cochrane [1] observed that there was little published information on the forest fire situation in the Caribbean and indicated that between 1984 and 1998 there was an average of 325 fires per year which burned an average of 4878 ha. Average fire sizes ranged from 10 to 30 ha. Rodriguez and Rodriguez [2] observed 7727 fires in Cuba, Dominica, Dominican Republic and Trinidad and Tobago, and an area burned in wildland fires of about 150,000 ha over 1995 to 2003. They noted that wildfire triggers were 59% human activity (arson, negligence), 36% were unknown, and 5% of confirmed natural causes. Robbins [3] noted that forest fires in the insular Caribbean occur mainly in dry forests with risk increasing for lowland high forests and for mountain forests during exceptionally dry years. Charlton et al. [4] characterised bushfire variability for Jamaica and indicated peaks in frequency in March and July, coinciding with the dry seasons for the country. A statistically significant positive linear trend was observed for July–August over 2001–2019 and 3.5- and 5-year periodicities in April–June and September–November, respectively. Bushfire management approaches are being implemented in the Caribbean consistent with global efforts and include monitoring, early warning, fire prevention, fire preparedness, fire suppression and restoration [1,5].
This study focuses on early warning potential and investigates the skill of three bushfire potential indicators for representing fire frequencies in Jamaica. Jamaica recorded an increase in the number of bushfires from 3716 to 5838 for 2016–2019 [4]. In 2019 and 2020, the country introduced community education programmes in an effort to contain bushfire outbreaks [6]. The indices examined are the Keetch–Byram Drought Index (KBDI), Vapour Pressure Deficit (VPD) and Water Potential (Ψw). Table 1 indicates the inputs and equations for the indicators including their characteristics. These indices have been applied globally e.g., KBDI has been used in the United States, Northern Eurasia, Hawaii, Australia, Russia, Mediterranean regions and Southeast Asia with some modifications applied for differences in climates, soils, and hydrology [7]. Some other fire potential indices include Ångström index, Nesterov index and Lang precipitation factor, e.g., [8]. However, these are not explored in the current study. Tosic et al. [9] notes that some indices are very simple algorithms combining temperature and humidity; while others are sophisticated tools estimating probability of a fire, rate of spread and severity. Each has conceptual assumptions regarding precipitation interception, run-off, transpiration from the canopy and evaporation from the soil [10].
Jamaica is a tropical island that has microclimates by virtue of its central mountainous terrain and varying landscape and their interaction with easterly trade winds from the Atlantic. The island’s fourteen parishes cover four rainfall zones: (1) Interior; (2) East; (3) West and the (4) North and South Coasts determined from cluster analyses applied to station rainfall data (Figure 1) [11]. Zones 1, 3 and 4 show bimodal patterns with an early season peaking in May and late season peaking in September and with a mid-summer minimum in July. This annual rainfall distribution is very similar to the double peak pattern noted across islands in the main Caribbean [12,13,14]. The zones are, however, differentiated by their seasonal and annual totals. In contrast, Zone 2 in the east shows its highest rainfall in November and a secondary peak in April–May and has the highest rainfall totals of all zones. Parishes in the island that were not previously affected by dryness and fires (e.g., those in Zone 2 in the northeast) are experiencing increased fire occurrences possibly due to climate change and urbanisation. The growing frequency of these fires also triggers a concern in relation to an increased carbon footprint for the island. The southern Zone 4 is of particular interest given its climatological dryness and therefore its higher susceptibility to bushfires. This zone shows the greatest fire frequencies for 2001–2019 than other parts of the island [4]. Given the substantial impact of bushfires on human activities and ecosystems, it is necessary to investigate the skill of different fire danger indices. South-central Jamaica is used as a case study to determine lessons that may be important for Jamaica and other Caribbean territories.
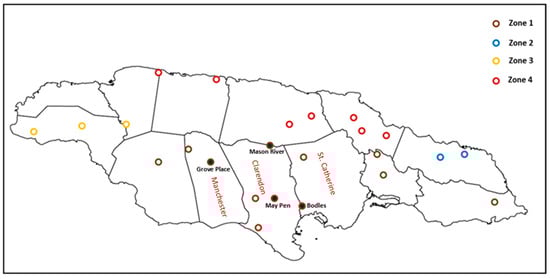
Figure 1.
Map of Jamaica differentiating rainfall zones using all-island station locations. The four stations used in the study are highlighted by filling. The three south-central parishes in which they are located are labelled.
Section 2 presents data and methodology. Section 3 provides results on the representativeness of the fire potential indices, their predictive skill, and their associations with large-scale modes respectively. Section 4 will present a discussion on lessons for Jamaica and the Caribbean.

Table 1.
Summary of fire potential indices used in this study including the meteorological variables and equations used for their calculations.
Table 1.
Summary of fire potential indices used in this study including the meteorological variables and equations used for their calculations.
| Indices | Meteorological Variables | Equations | Comments |
|---|---|---|---|
| Keetch–Byram Drought Index (KBDI) e.g., [7,15] | Daily rainfall (mm), Daily maximum air temperature (°C), average annual rainfall (mm) | is given by: where Q is the current KBDI, T the daily maximum temperature, and M the mean annual rainfall. |
|
| Vapour Pressure Deficit (VPD) e.g., [16,17] | Daily maximum air temperature (°C), relative humidity (%), Saturated Vapour Pressure (kPa) | With SVP in kPa, VPD in kPa |
|
| Water Potential (Ψw) e.g., [18,19] | Daily maximum air temperature (K), relative humidity (%) | As a function of relative humidity in MPa |
|
2. Materials and Methods
2.1. Study Area
The study focuses on the south-central parishes of Jamaica: Manchester, Clarendon and St Catherine (see Figure 1). The parishes are characterised by two rainfall zones: the interior (Zone 1) and south coast (Zone 4) that exhibit similar bimodal climatologies [4,11,20]. Temperatures in Manchester, St Catherine and Clarendon are varied, with topography and location having an impact. For example, for 2020 the average monthly temperature range for stations in Clarendon was 22.0–27.9 °C, a difference of 5.9 °C. However, stations in Manchester exhibited an average monthly temperature range of 23.4–27.2 °C, a difference of 3.2 °C. Furthermore, within Clarendon the two weather stations used for observed data are in different microclimates, that is, an urban area on the plain with hotter and drier conditions (May Pen), and a hilly rural area (Mason River).
2.2. Data
Fire occurrence data are obtained from the Jamaica Fire Brigade (JFB) observations for 2010–2019 and NASA MODIS C6 (MODIS) fire archives for 2001–2019. The fire data include both human-induced and natural fires across the rainfall zones since the records provided no differentiation. The JFB data is a monthly dataset that comprises bushfire occurrences that were reported to the JFB and that required their response (even if no intervention) and records their location to the nearest street [4]. The MODIS active fire archive [21] is a global dataset that has a spatial resolution of 1 km and daily data over Jamaica are extracted. For more on MODIS see Giglio et al. [22], Robbins et al. [3] and Charlton et al. [4]. In this study, the JFB data are primarily utilised, however MODIS is used for seasonal analyses because of its longer time span. The representativeness of MODIS for Jamaica was established by [4]. For both datasets, time series of aggregated fire occurrences are extracted for the entire country to create an all-island index, and for the parishes of Manchester, Clarendon, and St Catherine to create a south-central Jamaica index.
To calculate the fire potential indices, relative humidity (RH, %), and maximum air temperature (T, °C) recorded at noon daily as well as daily rainfall and average annual rainfall from meteorological stations in south-central Jamaica were obtained from the Meteorological Service Jamaica. Of the available stations, only four (see Figure 1) with complete records spanning the period 2013–2017 were deemed suitable for use. The short data span poses limitations for some of the statistical analyses to be performed. Consequently, ERA5 Reanalysis 0.5 × 0.5 degrees gridded daily data covering the period 2001–2019 (Figure 2) were also obtained [23]. ERA5 data included rainfall (mm), maximum air temperature (T, °C), dry bulb temperature (°C), wet bulb temperature (°C), and Pressure (hPa). The latter three are used to calculate Relative humidity (RH, %). Data from nine ERA5 grid boxes over Jamaica and two over southern Jamaica are used (Figure 2).
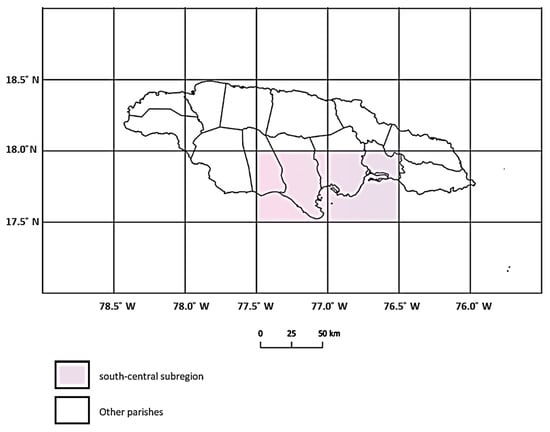
Figure 2.
Map of Jamaica showing ERA5 Reanalysis Grids with highlighted subregion.
Data are aggregated monthly, and seasonally, to represent December to March (DJFM), April to June (AMJ), July to August (JA) and September to November (SON), similar to seasons used by Climate Studies Group, Mona (CSGM) [20]. Seasons are chosen to coincide with Jamaica’s wet seasons (AMJ and SON) and dry seasons (DJFM and JA).
Relationships with known atmospheric and oceanic modes influencing Caribbean climate are investigated using the NINO3 sea surface temperature anomalies (SSTA) (https://www.cpc.ncep.noaa.gov/data/indices/ersst5.nino.mth.81-10.ascii, accessed on 10 February 2020), North Atlantic Oscillation (NAO) (https://www.cpc.ncep.noaa.gov/data/teledoc/nao.shtml, accessed on 10 February 2020), Tropical Southern Atlantic Index (TSA) SSTA (https://psl.noaa.gov/data/correlation/tsa.data, accessed on 10 February 2020), and indices of tropical North Atlantic (TNA) SSTA (https://psl.noaa.gov/data/correlation/tna.data, accessed on 10 February 2020) for the period examined. The domains used for the calculation of the indices are consistent with those used in Charlton et al. [4]. Monthly timeseries of the global indices are used in the study.
2.3. Methods
2.3.1. Calculating Fire Indices
Monthly time series for the three bushfire potential indices for Jamaica (all-island) and south-central Jamaica are first created. The calculation is done for 2001–2019 using the ERA5 data and 2013–2017 using the station data. As previously indicated, the indices are the Keetch–Byram Drought Index (KBDI), Vapour Pressure Deficit (VPD) and Water Potential (Ψw) (see again Table 1). KBDI is defined as an amount indicating the net effect of evapotranspiration and precipitation in generating cumulative moisture deficiency in deep duff or upper soil layers [24]. The Vapour Pressure Deficit (VPD) is the difference between the vapour pressure inside the leaf compared to the vapour pressure of the air [18]. If VPD is high, i.e., the pressure inside the leaf is higher than outside, then more water vapour escapes. Ψw and VPD are useful factors in determining the degree of stress on the fuel source during droughts or normal dryness. VPD is used as an indicator of the ability of the atmosphere to extract moisture from the land surface [16] and exerts considerable influence on the ignition, initial rate of spread, daily burned area and end of fire [17].
The KBDI incorporates daily rainfall (millimeters), maximum air temperature (°C) and mean annual rainfall (millimeters) inputs using equation (1) in Table 1. VPD incorporates daily maximum air temperature (°C), relative humidity (%), and saturated vapour pressure (kPa) using Equations (3) and (4), while Ψw incorporates daily relative humidity (%) and maximum air temperature (K) using Equation (5). When ERA5 data are being utilised, relative humidity is calculated from the ERA5 dry bulb temperature (°C), wet bulb temperature (°C), and Pressure (hPa) based on the equation below [25]:
where U = Relative Humidity (%), T = Dry Bulb Temperature (°C), Tw = Wet Bulb Temperature (°C), P = Pressure (hPa).
As for the fire data, the calculated bushfire potential indices are aggregated monthly and seasonally (DJFM, AMJ, JA and SON).
2.3.2. Analysis
Several statistical analyses are undertaken. Firstly, the climatologies of the fire occurrence (JFB and MODIS) and bushfire potential indices (KBDI, VPD and Ψw) are calculated from the monthly timeseries using data for 2010–2019 (i.e., the period of overlap of JFB, MODIS and ERA5-derived fire potential indices) and 2013–2017 (i.e., the period of overlap of JFB, MODIS and the station data-derived fire potential indices). The climatologies are normalised with respect to their respective maximum values. Plots of the normalised climatologies and the monthly timeseries are visually analyzed to determine representativeness of the fire potential indices. Pearson correlation coefficients are also determined. The significance of the correlations is assessed at the 95% confidence level using ANOVA with 60–240 data points.
To assess categorical skill, the station data-derived bushfire potential indices are used to create a fire potential risk profile for Jamaica using the risk categories shown in Table 2. While the threshold bands of KBDI are standard, the threshold bands for VPD and Ψw are defined in this study using values specific to Jamaica along with guidance from the literature (see for example, [17]). For example, the thresholds defining the risk classes for Ψw were calculated using Jamaica’s mean annual maximum temperature (30.1 °C) with the lower and upper limits of the daily relative humidity range (59–80%) [20,26] in Equation (5). This yielded values of Ψw of −74 MPa and −31 MPa which are used, with minor adjustments, to characterise the limits for low (0 to −35 MPa) and extremely high (<−75 MPa) risk and bands for moderate (−36 to −54 MPa) and high (−55 to −74 MPa). Similar values of Ψw (−71 and −30 MPa) were obtained in relation to Jamaica’s mean annual minimum temperature (19.7 °C). VPD was more sensitive to temperatures. Using the mean annual maximum temperature with relative humidity values of 59 and 80%, VPD values of 1.84 kPa and 0.898 kPa were obtained respectively. These were used to quantify low risk (0–0.90), moderate risk (0.91–1.36), high risk (1.37–1.83) and extremely high risk (>1.84). The JFB monthly data for the four stations and averaged over south-central Jamaica are also divided into quartiles to represent low, moderate, high, and extremely high events. Hit rates and false alarm rates are then used to assess the categorical skill of the bushfire potential indices. Hit rate (HR) is taken as the number of times the indices correctly identified the risk category of a specific month compared to the observed (JFB) fire risk. The false alarm rate (FAR) shows how much of the indices overall risk assessment was not correct when compared to itself.
Table 2.
Risk classes for the bushfire potential indices. KBDI thresholds are as used in Taufik, Setiawan, & van Lanen [7]. Estimated VPD and Ψw thresholds (see Section 2.3.2) are also provided.
Ordinary linear regression is used to investigate the usefulness of the three fire potential indices as predictors of bushfire occurrence. The all-Jamaica MODIS timeseries is predicted separately by each of the ERA5-derived bushfire potential indices for the period 2001–2019. The longer period (and hence the use of the MODIS dataset) maximises the number of datapoints used in each model’s creation and in the seasonal models which are also created. To see if the same indices emerge as best predictors for south-central Jamaica, the regression models are recreated for 2013–2017 using, however, the station-data derived bushfire potential indices. Skill scores used to assess the performance of the models are the coefficient of determination (R2), and standard error.
Finally, correlations between the bushfire potential indices for south-central Jamaica and large-scale modes such as ENSO, NAO and TNA are calculated, and their statistical significance determined, to ascertain possible associations with large-scale atmospheric and oceanic features. The analysis is done for 2013–2017 using the monthly time series of the station-derived bushfire potential indices, given that Jamaica displays sub-regional variations with respect to large-scale teleconnections [20].
3. Results
3.1. Representativeness of KBDI, VPD and Ψw of the Monthly and Climatological Variability of Bushfire Occurrences
Figure 3 shows the JFB average annual fire frequency (range: 135–1306 occurrences) and the ERA5 average annual rainfall total (range: 657–1336 mm) by parish across Jamaica for 2010–2019. The parishes with higher average annual fire frequencies are those with lower average annual rainfall and vice versa. The south-central parishes have high fire frequencies, with Clarendon having the highest of all parishes, justifying their being the focus of this study. North-eastern and western parishes exhibit lower bushfire frequencies and higher rainfall amounts.
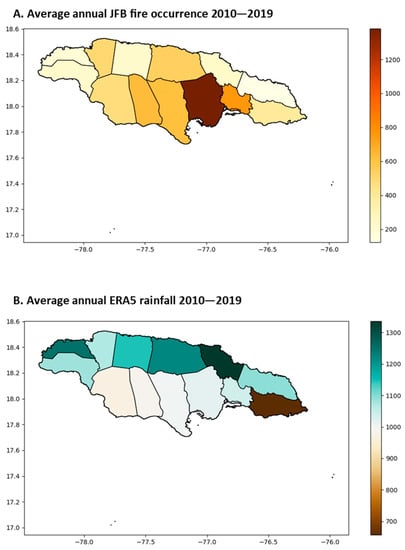
Figure 3.
(A) Average annual number of fire occurrences (JFB) and (B) ERA5 average rainfall total (mm) over Jamaica for 2010–2019.
Figure 4 illustrates the normalised climatologies for the three bushfire potential indices, and for the MODIS and JFB fire occurrence data for south-central Jamaica (left panel). Climatologies are determined using the period 2010–2019 and for bushfire indices calculated using ERA5 data. (Equivalent maps were created for 2013–2017 using station data-derived indices but are not shown given their general similarity to Figure 4 left panel). For comparison, climatologies for the entire island are also shown (right panel). MODIS reasonably captures the climatological variation of bushfire occurrences in south-central Jamaica suggesting its further usefulness for analysing sub-regional in addition to all-island variability. Both JFB and MODIS exhibit peaks in March and July for south-central Jamaica and the entire country. These peaks in bushfire occurrence coincide with the climatological dry seasons (December–March and July–August). Minima in bushfires are observed in May/June and October/November overlapping with the mean rainfall seasons (April–June and September-November).
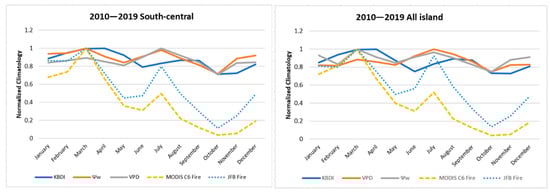
Figure 4.
(Left panel) Normalised climatologies of VPD, KBDI, Ψw, MODIS and JFB for south-central Jamaica (Manchester, Clarendon & St Catherine). (Right panel) As for the left panel but for the entire island. Base period is 2010–2019. Bushfire potential indices derived using ERA5 data.
Figure 4 also shows the representativeness of the fire indices in relation to the annual cycle of bushfires in south-central Jamaica. VPD and Ψw capture the peaks in bushfire occurrence in March and July (Figure 4 left panel), though for VPD the earlier peak is the secondary one. Local minima in May and October are also captured by Ψw and VPD. For south-central Jamaica, KBDI exhibits a primary peak in April and a secondary peak in August with minima in June and October–November (Figure 4 left panel). KBDI therefore represents the peak in fire potential one month after the recorded climatological peaks in occurrence while representing well the local minima indicated by the JFB data. All three fire indices had normalised values that exceeded the normalised MODIS values. This suggests that the relative magnitude of each index to its maximum value is larger for the fire indices in comparison to the relative magnitudes noted using the MODIS data.
Figure 5A shows the monthly variation of MODIS and JFB over 2010–2019 for south-central Jamaica. Though MODIS underestimates the magnitude of outbreaks it captures well the monthly frequency of occurrence. This accounts for the similarity in normalised climatologies between the two variables seen in Figure 4. Figure 5B–D show JFB versus the ERA5-derived fire potential indices, also for south-central Jamaica. In general, all three fire indices display coherence with the JFB timeseries. However, whereas for KBDI and VPD there is generally a correlation between peaks (and minima), for Ψw an inverse relationship is suggested i.e., a coincidence of fire occurrence peaks and minima in Ψw and vice versa.
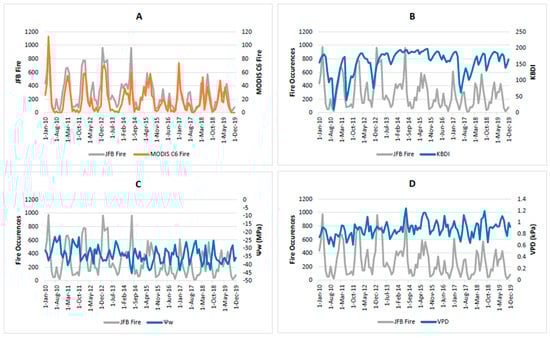
Figure 5.
Monthly variation of VPD, KBDI, Ψw, MODIS and JFB observations for 2010–2019: (A) MODIS vs JFB, (B) JFB vs KBDI, (C) JFB vs Ψw and (D) JFB vs VPD. Bushfire potential indices are derived using ERA5 data.
Table 3 shows correlations between VPD, KBDI, Ψw and the MODIS and JFB datasets for south-central Jamaica. Correlations are shown for the monthly timeseries (i.e., those depicted in Figure 5B–D but also including correlations with MODIS) and also for the normalised climatologies (i.e., those depicted in Figure 4 left panel). For comparison, correlations are also presented for the period 2013–2017 where the timeseries and normalised climatologies of the bushfire potential indices were calculated using station data. The latter allows an exploration of the representativeness of ERA5 versus station derived fire indices.
Table 3.
Correlation between monthly variations and normalised climatologies of KBDI, VPD, Ψw and fire occurrence derived from MODIS and JFB for south-central Jamaica. For 2010–2019, KBDI, VPD and Ψw are derived using ERA5, while for 2013–2017 they are derived using station data. Correlations in bold are statistically significant at the 95% confidence level.
Some things to note are:
- The magnitude and significance of the correlations are generally comparable whether the MODIS or JFB datasets are used. This again suggests the usefulness of the MODIS data for sub-regional analysis especially where observational data may be scarce.
- There is general consistency in terms of magnitude and sign for corresponding correlation values for the two time periods examined (e.g., KBDI-MODIS is +0.36 for 2010–2019 and +0.38 for 2013–2017). This suggests that ERA5-derived fire potential indices are reasonably capturing the nature of the associations evident between the station data-derived fire potential indices and the fire occurrence datasets. There is, however, a difference in the significance of the correlations, with none of the monthly timeseries correlations for 2013–2107 being significant in comparison to all being significant for 2010–2019. In the absence of long time series of station data, however, the ERA5-derived bushfire potential indices seem a reasonably proxy.
- The correlations are negative for the monthly variations of Ψw as would be anticipated from the inverse relationship captured in Figure 5C.
Amongst the three bushfire potential indices, it is noted that correlations with the fire occurrence data (whether JFB or MODIS) are always largest for Ψw. This is true for both monthly variations and normalised climatologies and irrespective of period being analysed. The only exception is for the MODIS normalised climatology data over the longer period. The highest correlation values for Ψw are for the normalised climatologies i.e., 0.73 (MODIS) and 0.87 (JFB) for 2010–2019 and 0.70 (MODIS) and 0.89 (JFB) for 2013–2017. The strong correlation exhibited by Ψw index suggests that relative humidity and temperature are good indicators of variability for south-central Jamaica. Of the remaining two indices, KBDI correlations are larger than those for VPD for the normalised climatology calculations irrespective of time period, while the reverse is true for correlations between the monthly time series.
3.2. Categorical Skill of KBDI, VPD and Ψw for Capturing Bushfire Occurrences in South-Central Jamaica
Table 4 indicates the categorical skill of the KBDI, VPD and Ψw. Results are shown for each of the four meteorological stations as well as for south-central Jamaica. The results show a relatively low HR for KBDI except for the low-risk categories for Mason River (100%), Grove Place (64%) and the south-central Jamaica average (60%). The false alarm rates are high (50–100%) and suggest that KBDI may not be suited for categorical forecasts on a sub-island scale unless some additional processing or modelling is implemented ahead of use. VPD shows large hit rate for high or extremely high events for Bodles (high—87%), May Pen (extremely high—67%) and south-central Jamaica (high—80%). False alarm rates are high for most categories except for extremely high in Bodles (25%) and high for south-central Jamaica (17%). Ψw exhibits good HR in the moderate and high skill categories for 3 of the 4 stations and for the south-central area (32–80%) and for the extremely high category for May Pen (47%). As with the other indices, FARs are generally high.
Table 4.
Categorical skill of KBDI, VPD, Ψw in representing the risk category’s monthly frequency deduced from JFB for 2013–2017 using station data.
3.3. Linear Regression Models
Table 5 shows regression models premised on each of the bushfire potential indices and their skill scores. All models predict MODIS. Models Columns 2–4 show monthly and seasonal models created for all-Jamaica using the period 2001–2019 and ERA5-derived indices. When the monthly timeseries are used (Table 5a) the all-island models exhibit R2 values of 9–13% suggesting relatively low model skill. Of the three indices, the KBDI model has highest skill (13%). A 1-month lag where the fire indices lead the fire occurrences (Table 5b) decreases model skill. All island model skill improves, however, for three of four seasons for the models premised on VPD and Ψw. JA (Table 5e) has the highest explained variability (58% for both Ψw and VPD) followed by SON (37% for Ψw and 39% for VPD) (Table 5f) and then AMJ (21% for Ψw and 23% for VPD) (Table 5d). Standard errors are lower for VPD than for Ψw for all seasons. Models for DJFM show poor skill irrespective of bushfire potential index used. Seasonal models premised on KBDI also perform poorly compared to equivalent models based on Ψw and VPD, with lowest explained variability and highest standard errors.
Table 5.
Linear regression models for (a) monthly (b) monthly with 1-month lag (c–f) seasonal fire variability from MODIS based on KBDI, VPD and Ψw. Columns 2–4 show all-island models using ERA5-derived bushfire potential indices. Columns 5–7 show models for south-central Jamaica. For south-central Jamaica, the monthly models are derived using station data-derived bushfire potential indices for 2013–2017 while the seasonal models are based on ERA5-derived bushfire potential indices for 2010–2019. The correlation coefficient (R), coefficient of determination (R2); and standard error are also shown. Correlations in bold are statistically significant at the 95% confidence level.
Columns 5–7 show equivalent monthly and seasonal models created for south-central Jamaica. For south-central Jamaica, the monthly timeseries models (Table 5a,b) are created for the period 2013–2017 using station-data derived fire potential indices. Model skill is slightly higher (R2 values of 13–29%) than for the equivalent all-island models but still poor and not improved by introducing a 1-month lag. However, unlike for the all-island models, it is Ψw that has highest skill (29%). For the south-central seasonal models, ERA5-derived indices for the period 2010–2019 were used to increase the amount of data available for model creation. As for the entire island, skill improves in three of four seasons for the models created using VPD and Ψw. The VPD and Ψw models for these seasons (AMJ, JA, and SON) (Table 5c–f) have comparable explained variability ranging from 57–60%. Standard errors are again lower for VPD than for Ψw for all seasons. Models for DJFM still show little skill irrespective of bushfire potential index used and seasonal models premised on KBDI continue to perform poorest with highest standard errors.
3.4. Relationship between KBDI, VPD and Ψw and Large-Scale Atmospheric and Oceanic Features
Correlations between the monthly KBDI, VPD and Ψw timeseries for south-central Jamaica and those representing large-scale patterns are shown in Table 6. The various timeseries are also plotted in Figure 6. All three bushfire potential indices had statistically significant correlations with TNA, NINO 3 and TNA-NINO 3 even at 1-month lag. VPD also had significant correlations with the NAO. This is not surprising since Jamaican rainfall also shows correlations with these global indices [20]. Highest correlations were −0.52 for KBDI (with concurrent TNA-NINO 3), −0.55 for VPD (when TNA leads by 1 month) and 0.58 for Ψw (when TNA leads by 1 month). The fact that the correlations remain robust and significant with 1 month lag suggests the potential for global indices to be utilised as predictors of the bushfire potential indices. This in turn holds promise for community preparedness. The signs on the correlations are consistent with the expected physics in that anomalous warm SSTs over the tropical Atlantic would be linked to increased rainfall over Jamaica and the Caribbean and therefore decreased bushfire frequencies.
Table 6.
Correlations between bushfire potential indices (KBDI, VPD and Ψw) for south-central Jamaica and indices representing large-scale atmospheric and oceanic patterns. Correlations calculated for monthly timeseries over 2013–2017 with zero and 1-month lag.
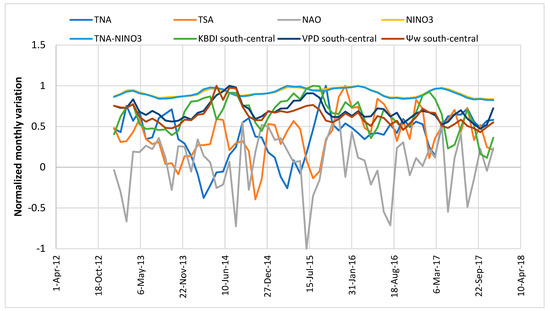
Figure 6.
Normalised monthly variation of south-central VPD, KBDI, Ψw, and large-scale climate indices TNA, TSA, NAO, NINO3 and TNA—NINO3 time series for 2013–2017.
4. Discussion
This study evaluates the usefulness of three indices, namely the Keetch–Byram Drought Index (KBDI), Vapour Pressure Deficit (VPD) and Water Potential (Ψw), for determining bushfire potential in south-central Jamaica through comparison with the JFB and MODIS C6 Fire datasets. The bushfire indices can be calculated from routinely measured meteorological variables which makes them attractive for use as monitoring tools to enhance decision making and preparedness. Bushfire occurrences have been increasing in Jamaica since 2000 [4].
The work suggests that for south-central Jamaica (and also true for the island as a whole) all three indices reasonably capture the climatology of observed bushfires which is characterised by peaks in March and July coinciding with the island’s dry seasons, and minima in May and October during the wet seasons. KBDI, however, has peaks one month later than observed. KBDI also exhibits the smallest correlations of the three indices with monthly fire occurrence timeseries constructed for south-central Jamaica using JFB and MODIS data. This was true whether the bushfire potential indices were derived using station data or ERA5 gridded data (the latter used to extend the period of analysis). In comparison, Ψw displayed the highest correlations.
Of the three indices, Ψw, emerges as a potentially useful measure of bushfire potential in south-central Jamaica. Ψw shows strong statistical correlation with climatologies deduced from JFB and MODIS; has good hit rates for moderate and high risk categories for three of four stations in the south-central area and for the extremely high category for the fourth station (though, as with all indices, also generally having high false alarm rates); exhibits reasonable skill as a predictor of fire occurrences in JA when bushfires peak (R2 greater than 50%); and is strongly correlated with tropical north Atlantic SST anomalies even with 1 month lag thereby offering the possibility of forecasting. VPD also displays reasonable usefulness. It has good hit rates for high or extremely high risk for two stations and for south-central Jamaica; comparable predictive skill to Ψw in JA; and statistically significant correlations with monthly and climatological timeseries of MODIS and JFB, and also with some of the atmospheric and oceanic indices. Similarities in performance of both Ψw and VPDI may lie in the fact that they both employ temperature and relative humidity in their construction. The inclusion of either index in a bushfire monitoring framework would, therefore, likely add value e.g., via the creation of seasonal fire outlooks for monitoring the high fire risk category for south-central Jamaica.
It is interesting that KBDI in this study is seemingly ‘less representative’ than the other bushfire potential indices for south-central Jamaica, for example, the regression models premised on KBDI did not generally perform well and the index also had low hit rates for the moderate to high-risk categories for the stations examined. We, however, highlight the fact that KBDI is the only index premised on rainfall and between 2013 and 2016, Jamaica and the entire region experienced its most severe and prolonged droughts since 1950 [27]. This likely meant that calculated KBDI was continuously high during this period (see again Figure 5B). In this kind of extreme and prolonged dry state, it is possible that other factors better captured by the other two indices emerge as better determinants of bushfire potential. This requires further investigation. It also suggests that care should be exercised if KBDI is to be utilised as a sole measure of bushfire potential for Jamaica or parts of Jamaica, notwithstanding that it reasonably captures the climatology of occurrence.
Linear regression models premised on monthly timeseries of the three bushfire potential indices displayed low skill (as measured using the R2 statistic) for Jamaica as a whole but slightly better skill for south-central Jamaica. However, seasonal models created using VPD and Ψw showed significantly improved skill for both all-island and south-central fire occurrences. For example, for south-central Jamaica, AMJ and SON have explained variability of 57–58% using models premised on VPD or Ψw. Models for JA which coincides with the midsummer dry season and the second peak in bushfire occurrence also showed good skill across all indices: KBDI—40%, VPD—57% and Ψw—60%. This augurs well for forecasting seasonal bushfire potential if the indices used in model creation can themselves be predicted in advance. The latter possibility is in fact suggested by strong concurrent and lagged correlations with global atmospheric and oceanic patterns. This implies that, while models incorporating the fire indices are being explored in this study using hindcasts, the potential exists to either apply (1) seasonal outlooks for rainfall, temperature and relative humidity, or (2) equivalent seasonal outlooks of the global indices, to the models developed, to produce outlooks for seasonal bushfire incidence. This would be beneficial to initiatives currently underway in Jamaica including the continued development of a Jamaica Bushfire Warning Index and Management System launched in March 2022 [28]. The index forecasts the potential or risk of bushfire outbreaks in Jamaica and is currently circulated bi-weekly via email but in the future will be available through the Meteorological Service Jamaica’s website. The possibility of utilising the bushfire potential indices to augment decision-making being done using the Bushfire Warning Index will be further investigated in future studies. It is noted, however, that models for DJFM show poor skill irrespective of bushfire potential index used or period investigated. Initial investigations suggest that defining a new season limited to February and March (FM) as opposed to utilising the traditional dry season of DJFM may yield marginally better skill. This also requires further investigation to be undertaken in a future study.
Finally, this study highlights the limitations posed by inadequate data and reinforces the need for the prioritisation of data capture and monitoring at the subregional and station levels. In the absence of longer timeseries of especially climate data but also bushfire occurrence data, proxy data had to be employed e.g., using coarser ERA5 climate data to calculate the bushfire potential indices. This limits the robustness of some conclusions that could be drawn. Notwithstanding, the study also shows the potential usefulness of the bushfire potential indices, even when constructed with proxy data, especially for creating sub-regional (as opposed to all-island) outlooks.
Other future research includes ascertaining future bushfire potential using climate outputs from regional climate models. The expectation is that under climate change, an increase in fire incidence is likely due to projections of warmer and drier conditions for Jamaica [20]. Quantifying the increase will be integral to adaptation and mitigation planning for very vulnerable small island developing countries like Jamaica.
Author Contributions
Conceptualisation, C.C. and T.S.; methodology, C.C.; validation, C.C.; formal analysis, C.C.; investigation, C.C.; resources, C.C. and J.C; data curation, C.C. and J.C.; writing—original draft preparation, C.C. and T.S; writing—review and editing, T.S. and M.A.T.; visualisation, C.C.; supervision, T.S. and M.A.T.; project administration, T.S. and M.A.T. All authors have read and agreed to the published version of the manuscript.
Funding
This research was funded by The University of the West Indies, Mona.
Institutional Review Board Statement
Not applicable.
Informed Consent Statement
Not applicable.
Data Availability Statement
Sources for Climate Indices used in the research: https://psl.noaa.gov/data/correlation/tna.data (10 February 2020); https://psl.noaa.gov/data/correlation/tsa.data (10 February 2020); https://www.cpc.ncep.noaa.gov/data/indices/ersst5.nino.mth.81-10.ascii (10 February 2020); Source for MODIS dataset: https://firms.modaps.eosdis.nasa.gov/download/ (29 January 2020). Source for ERA5 Reanalysis data: https://climexp.knmi.nl/start.cgi (29 June 2022).
Acknowledgments
For their support the authors would like to acknowledge the Jamaica Fire Brigade (JFB) for their willingness to provide access to their bushfire data. The authors would also like to acknowledge the Meteorological Service Jamaica (MSJ), especially Jacqueline Spence-Hemmings and the data acquisition section as well as Teddy Allen from the Caribbean Institute for Meteorology and Hydrology for initial direction on the Keetch–Byram Drought Index (KBDI).
Conflicts of Interest
The authors declare no conflict of interest.
References
- Cochrane, M. Spreading Like Wildfire-Tropical Forest Fires in Latin America and the Caribbean: Prevention, Assessment and Early Warning; UNEP, Regional Office for Latin America and the Caribbean: Mexico City, Mexico, 2002. [Google Scholar]
- Rodríguez, M.P.R.; Rodríguez, R.G. Wildfires in the Caribbean. Crisis Response 2010, 6, 62–63. [Google Scholar]
- Robbins, A.; Eckelmann, C.; Quinones, M. Forest fires in the insular Caribbean. Ambio 2008, 37, 528–534. [Google Scholar] [CrossRef] [PubMed]
- Charlton, C.S.; Stephenson, T.S.; Taylor, M.A.; Douglas, C.A. Characterizing bushfire occurrences over Jamaica using the MODIS C6 fire archive 2001–2019. Atmosphere 2021, 12, 390. [Google Scholar] [CrossRef]
- Heikkilä, T.; Grönqvist, R.; Jurvelius, M. Wildland Fire Management Handbook for Trainers; FAO: Rome, Italy, 2010. [Google Scholar]
- Jamaica Fire Brigade Reporting an Increase in The Number of Bush Fires. Jamaica Information System, 18 April 2020. Available online: https://jis.gov.jm/jamaica-fire-brigade-reporting-an-increase-in-the-number-of-bush-fires/ (accessed on 24 July 2022).
- Taufik, M.; Setiawan, B.I.; van Lanen, H.A. Modification of a fire drought index for tropical wetland ecosystems by including water table depth. Agric. For. Meteorol. 2015, 203, 1–10. [Google Scholar] [CrossRef] [Green Version]
- Živanović, S.; Ivanović, R.; Nikolić, M.; Đokić, M.; Tošić, I. Influence of air temperature and precipitation on the risk of forest fires in Serbia. Meteorol. Atmos. Phys. 2020, 132, 869–883. [Google Scholar] [CrossRef]
- Tošić, I.; Mladjan, D.; Gavrilov, M.B.; Živanović, S.; Radaković, M.G.; Putniković, S.; Petrović, P.; Mistridželović, I.K.; Marković, S.B. Potential influence of meteorological variables on forest fire risk in Serbia during the period 2000–2017. Open Geosci. 2019, 11, 414–425. [Google Scholar] [CrossRef] [Green Version]
- Holgate, C.M.; van Dijk, A.I.J.M.; Cary, G.J.; Yebra, M. Using alternative soil moisture estimates in the McArthur Forest Fire Danger Index. Int. J. Wildland Fire 2017, 26, 806–819. [Google Scholar] [CrossRef]
- Walters, R. Examining Drought in Jamaica and the Caribbean. Unpublished Master’s Thesis, University of the West Indies Mona, Kingston, Jamaica, 2016. [Google Scholar]
- Chen, A.; Roy, A.; McTavish, J.; Taylor, M.; Marx, L. Using sea surface temperature anomalies to predict flood and drought conditions for the Caribbean. COLA Rep. 1997, 49, 1997. [Google Scholar]
- Taylor, M.A.; Enfield, D.B.; Chen, A.A. Influence of the tropical Atlantic versus the tropical Pacific on Caribbean rainfall. J. Geophys. Res. 2002, 107, 10.1–10.4. [Google Scholar] [CrossRef] [Green Version]
- Douglas, C.; Stephenson, T.; Taylor, M.; Brown, A.; Campbell, J.; Stennett-Brown, R.; Walters, R. Investigating decadal variability in Jamaica’s Rainfall: A case study for the Caribbean. In Pilot Programme for Climate Resilience; University of the West Indies Mona: Kingston, Jamaica, 2021. [Google Scholar]
- Keetch, J.J.; Byram, G.M. A Drought Index for Forest Fire Control; Research Paper 35; U.S. Department of Agriculture, Forest Service, Southeastern Forest Experiment Station: Asheville, NC, USA, 1968.
- Seager, R.; Hooks, A.; Park-Williams, A.; Cook, B.; Nakumura, J.; Henderson, N. Climatology, variability, and trends in the U.S. vapor pressure deficit, an important fire-related meteorological quantity. J. Appl. Meteorol. Climatol. 2015, 54, 1121–1141. [Google Scholar] [CrossRef]
- Sedano, F.; Randerson, J. Multiscale influence of vapor pressure deficit on fire ignition and spread in boreal forest ecosystems. Biogeosciences 2014, 11, 3739–3755. [Google Scholar] [CrossRef] [Green Version]
- Hopkins, W.; Huner, N. Introduction to Plant Physiology, 4th ed.; Wiley: New York, NY, USA, 2008. [Google Scholar]
- Xanthopoulos, G.; Georgios, M.; Vassiliki, G.; Markos, G. Is the Keetch-Byram drought index (KBDI) directly related to plant stress? In Proceedings of the V International Conference on Forest Fire Research, Coimbra, Portugal, 27–30 November 2006. [Google Scholar]
- Climate Studies Group, Mona (CSGM). The State of the Jamaican Climate 2015: Information for Resilience Building; The Planning Institute of Jamaica (PIOJ): Kingston, Jamaica, 2017. [Google Scholar]
- Justice, C.; Gigliob, L.; Korontzia, S.; Owens, J.; Morisette, J.; Roy, D.; Descloitres, J.; Alleaume, S.; Petitcolin, F.; Kaufman, Y. The MODIS fire product. Remote Sens. Environ. 2002, 83, 244–262. [Google Scholar] [CrossRef]
- Giglio, L.; Descloitres, J.; Justice, C.O.; Kaufman, Y.J. An enhanced contextual fire detection algorithm for MODIS. Remote Sens. Environ. 2003, 87, 273–282. [Google Scholar] [CrossRef]
- Hersbach, H.; Bill, B.; Paul, B.; Shoji, H.; András, H.; Joaquín, M.-S.; Nicolas, J.; Peubey, C.; Radu, R.; Schepers, D.; et al. The ERA5 global reanalysis. Q. J. R. Meteorol. Soci. 2020, 146, 1999–2049. [Google Scholar] [CrossRef]
- Dolling, K.; Chu, P.S.; Fujioka, F. A climatological study of the Keetch/Byram drough index and fire activity in the Hawaiian Islands. Agric. For. Meteorol. 2005, 133, 17–27. [Google Scholar] [CrossRef] [Green Version]
- Abbott, F.P.; Tabony, C.R. The estimation of humidity parameters. Met. Mag. 1985, 114, 49–56. [Google Scholar]
- Climate Studies Group, Mona (CSGM). The State of the Jamaican Climate: Information for Resilience Building; The Planning Institute of Jamaica (PIOJ): Kingston, Jamaica, 2012. [Google Scholar]
- Herrera, D.; Ault, T. Insight from a new high-resolution drought atlas for the Caribbean spanning 1950–2016. J. Clim. 2017, 30, 7801–7825. [Google Scholar] [CrossRef]
- Jamaica Now Has a Bush Fire Warning Index and Management System. Jamaica Information Service, 2 April 2022. Available online: https://jis.gov.jm/jamaica-now-has-a-bush-fire-warning-index-and-management-system/ (accessed on 27 July 2022).
Publisher’s Note: MDPI stays neutral with regard to jurisdictional claims in published maps and institutional affiliations. |
© 2022 by the authors. Licensee MDPI, Basel, Switzerland. This article is an open access article distributed under the terms and conditions of the Creative Commons Attribution (CC BY) license (https://creativecommons.org/licenses/by/4.0/).