
Characterization of Propane Fueled Flames: A Significant Source of Brown Carbon

 ,
,  , ,
, ,
Abstract
:1. Introduction
2. Experimental
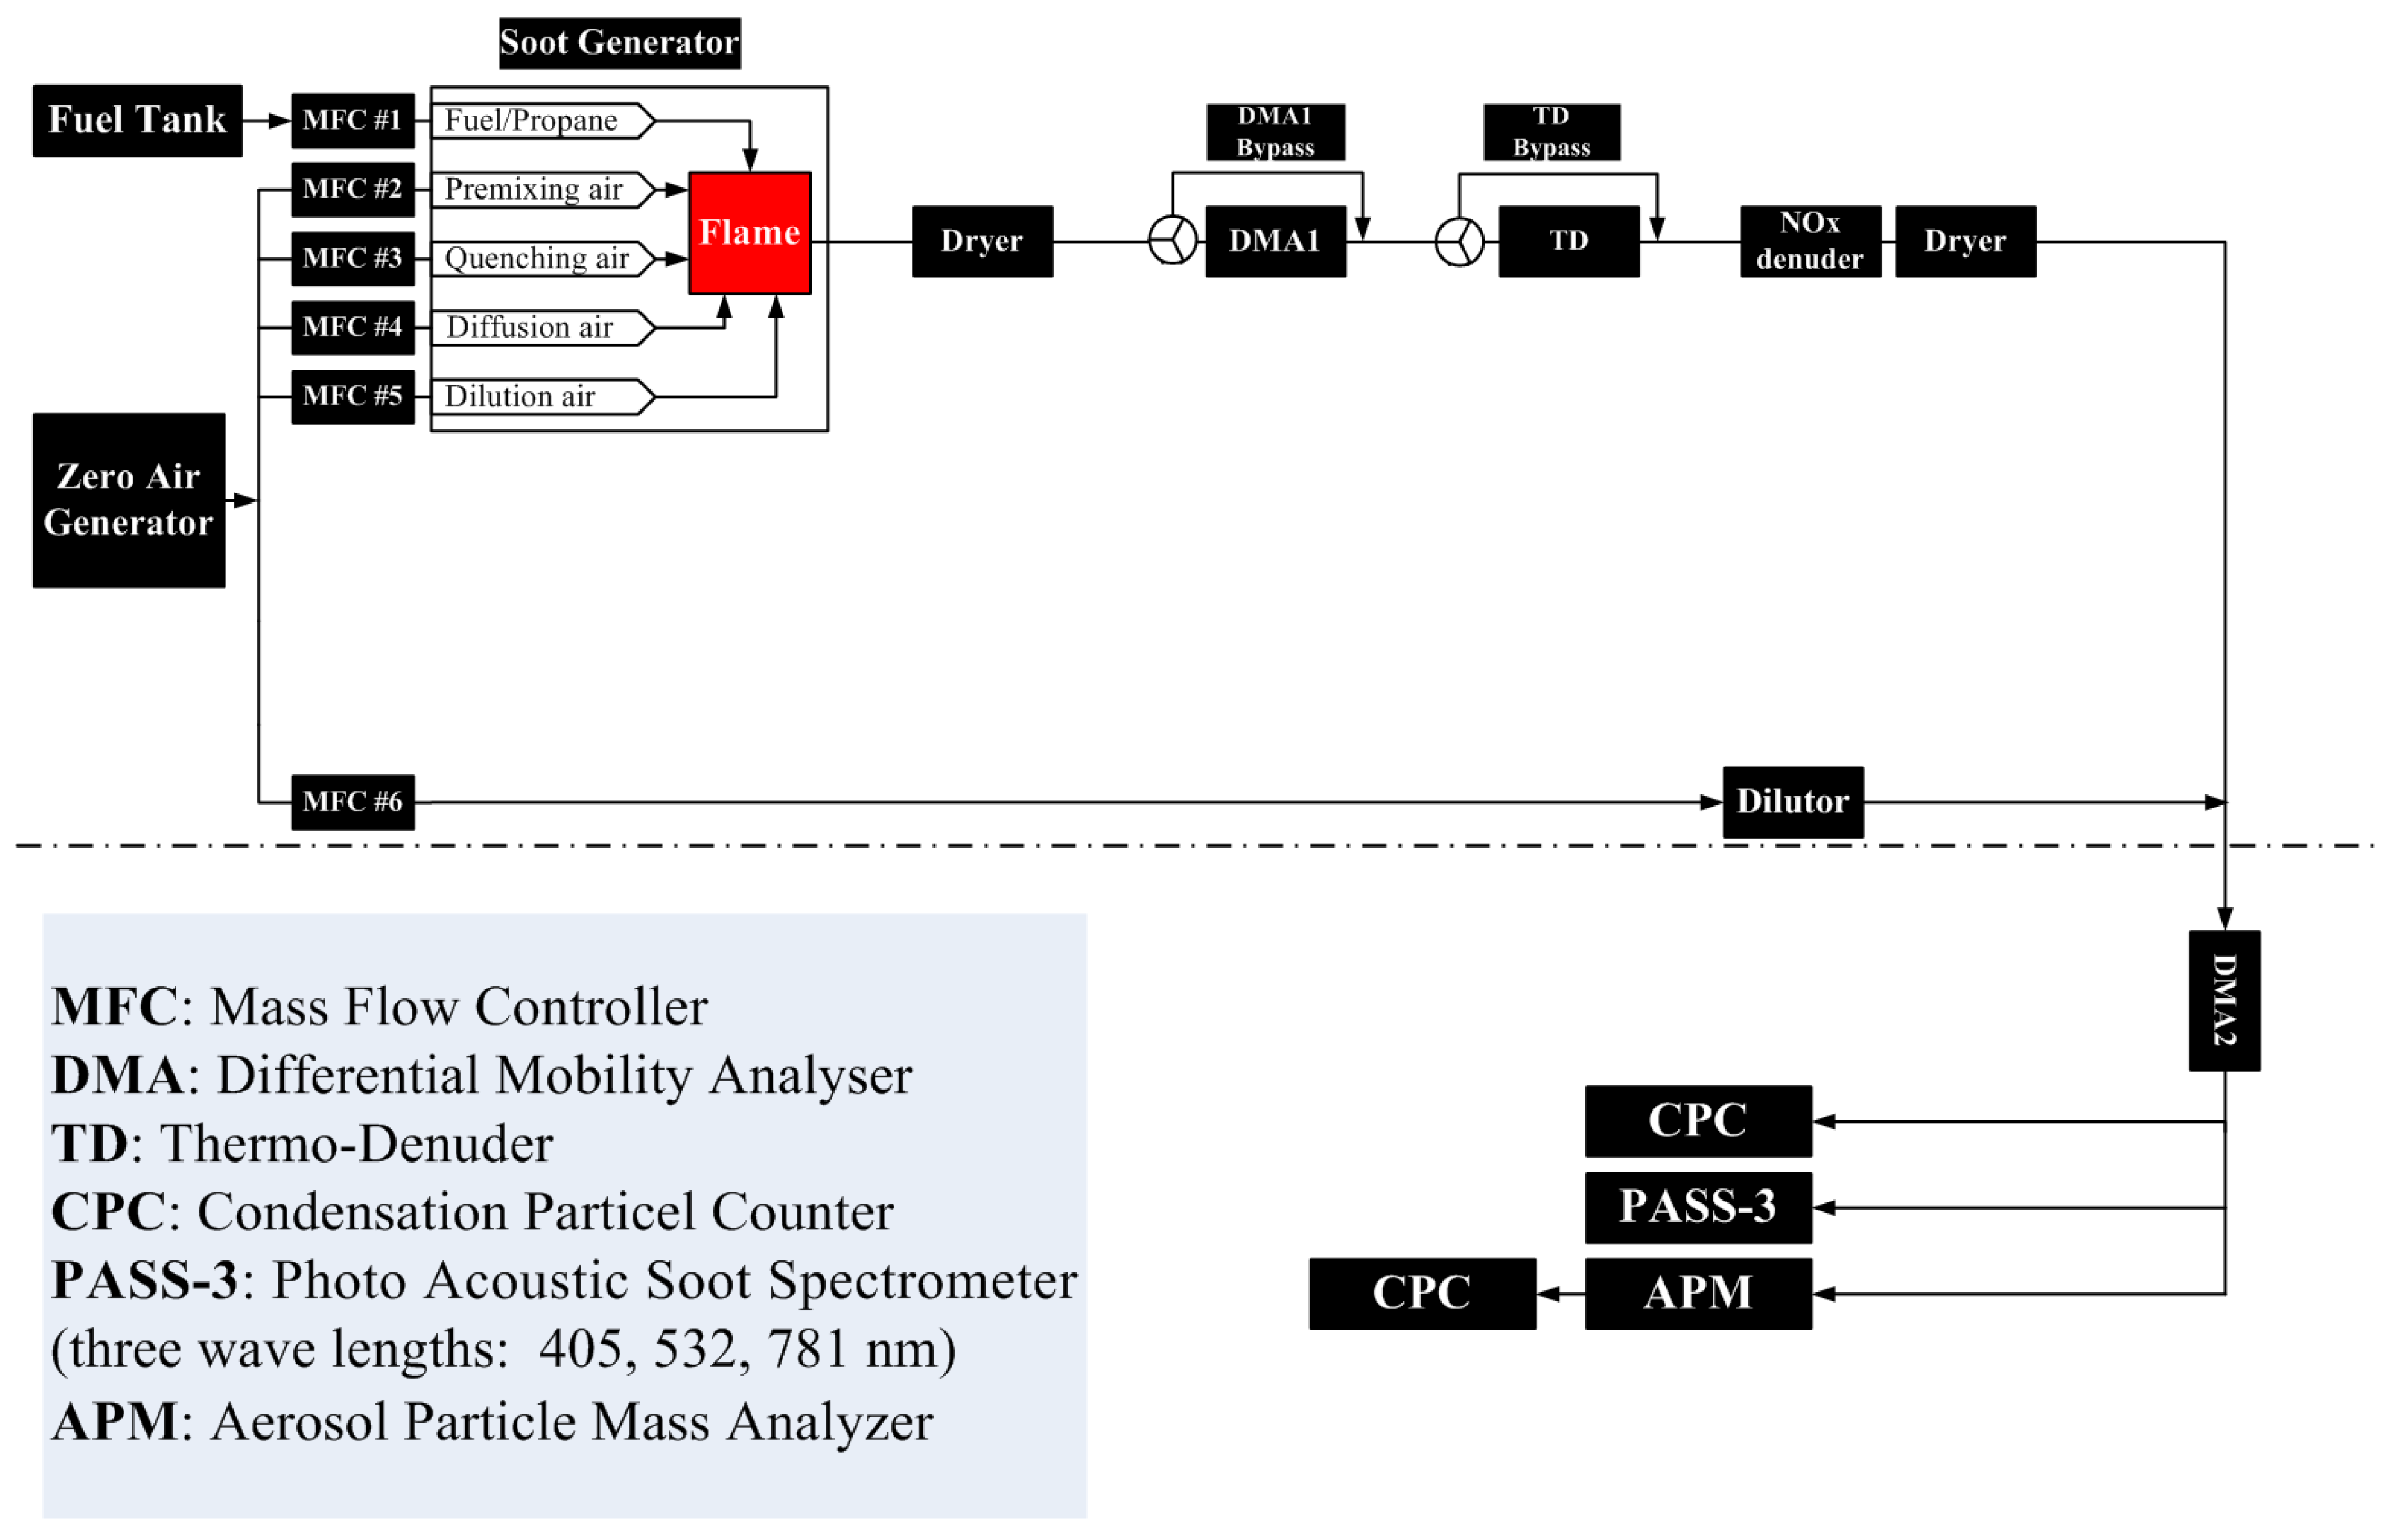
2.1. Design of Burner
2.2. Experimental Setup
2.3. Instruments
2.3.1. Size Distribution with DMA + CPC
2.3.2. Particle Mass Mobility Relationship Using a DMA-APM System
2.3.3. Absorption Measurements with PASS-3
2.4. Flame Settings
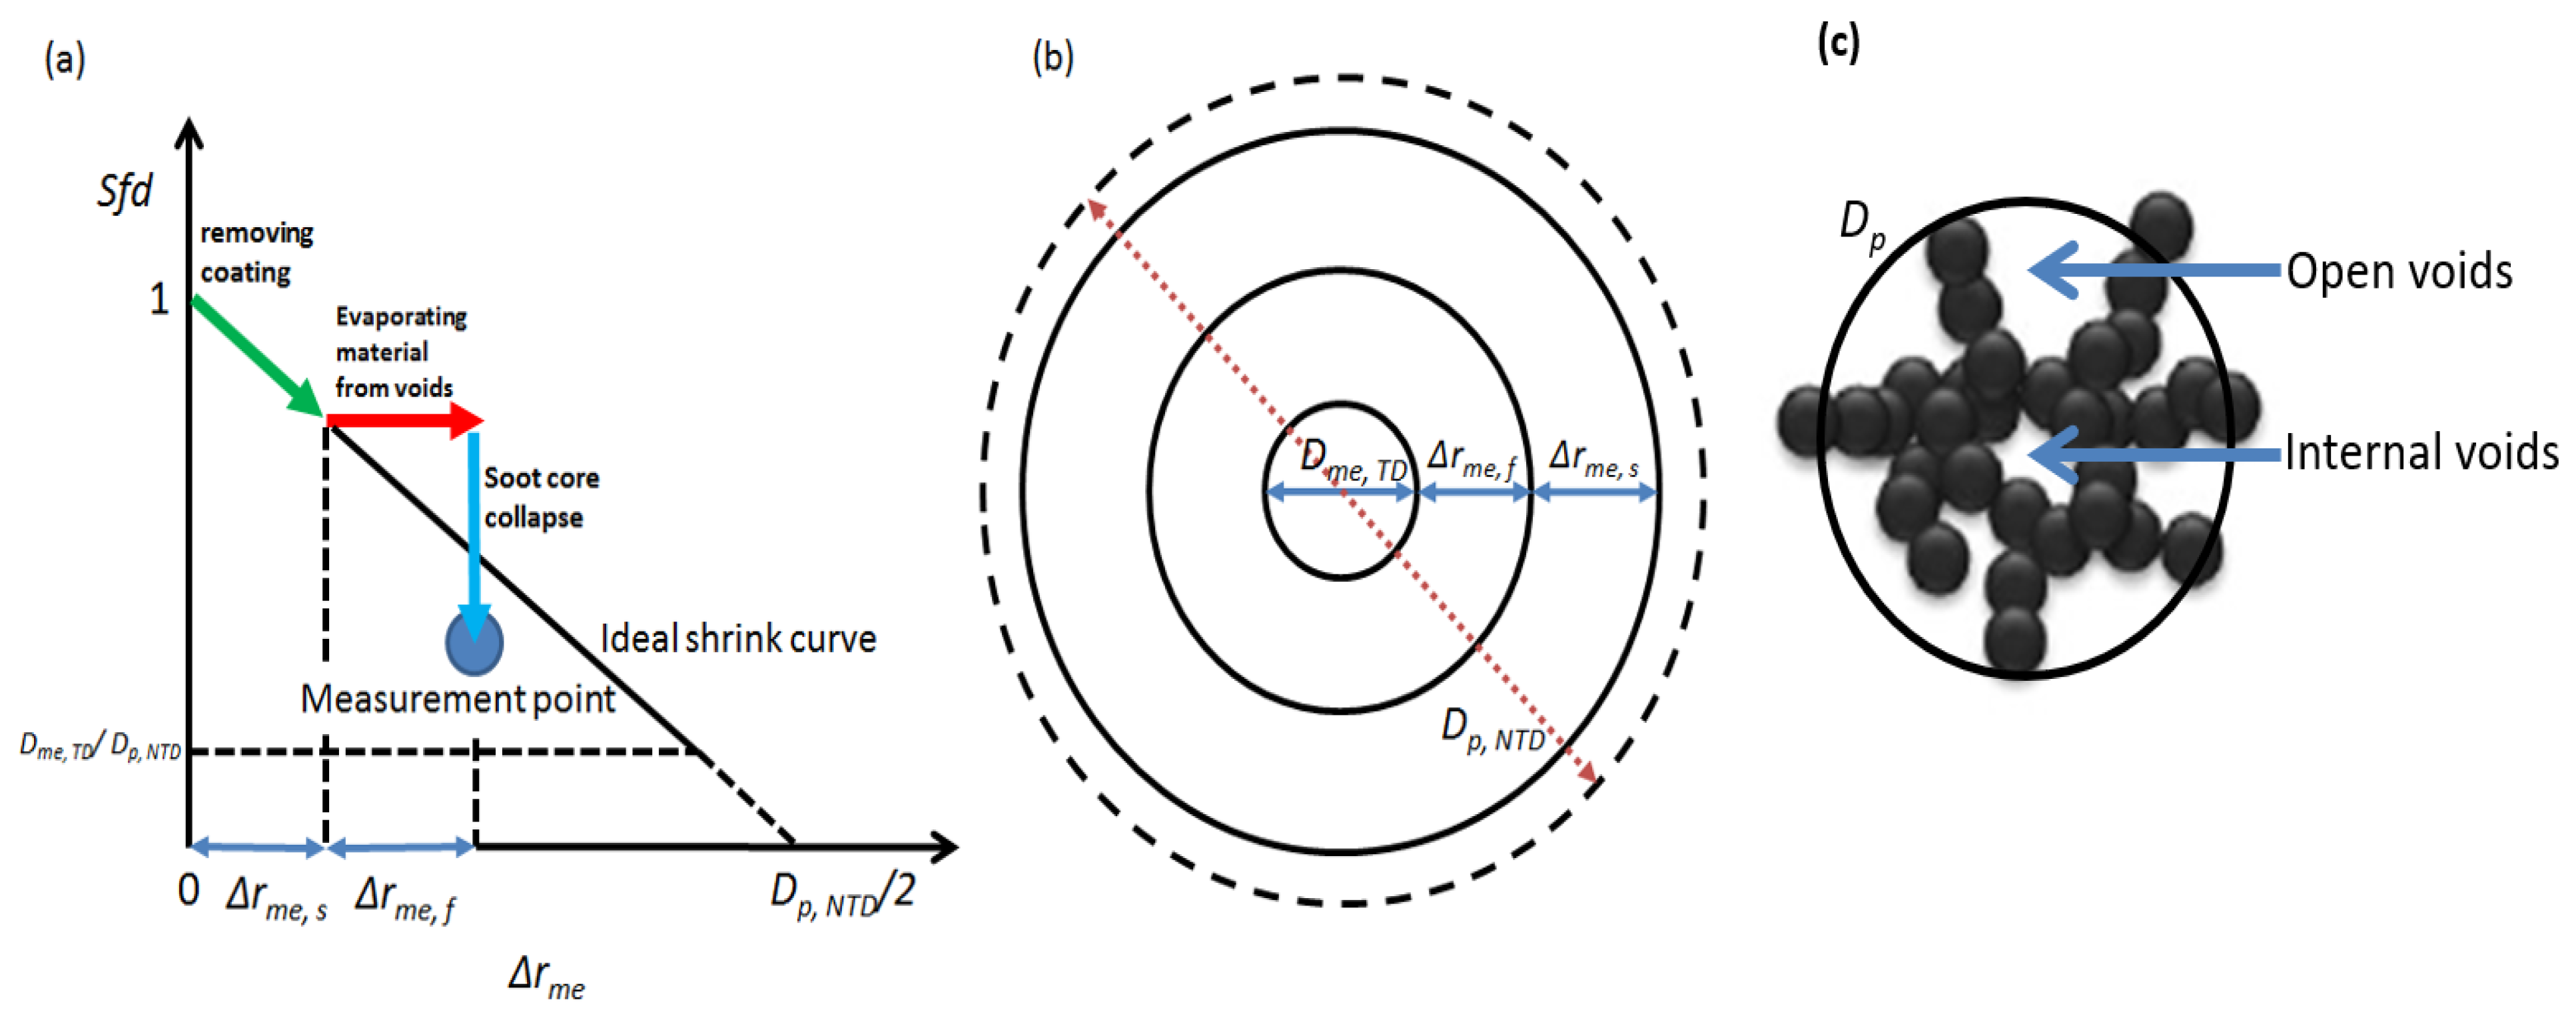
2.5. Data Analysis
Morphology and Mixing State
3. Results and Discussion
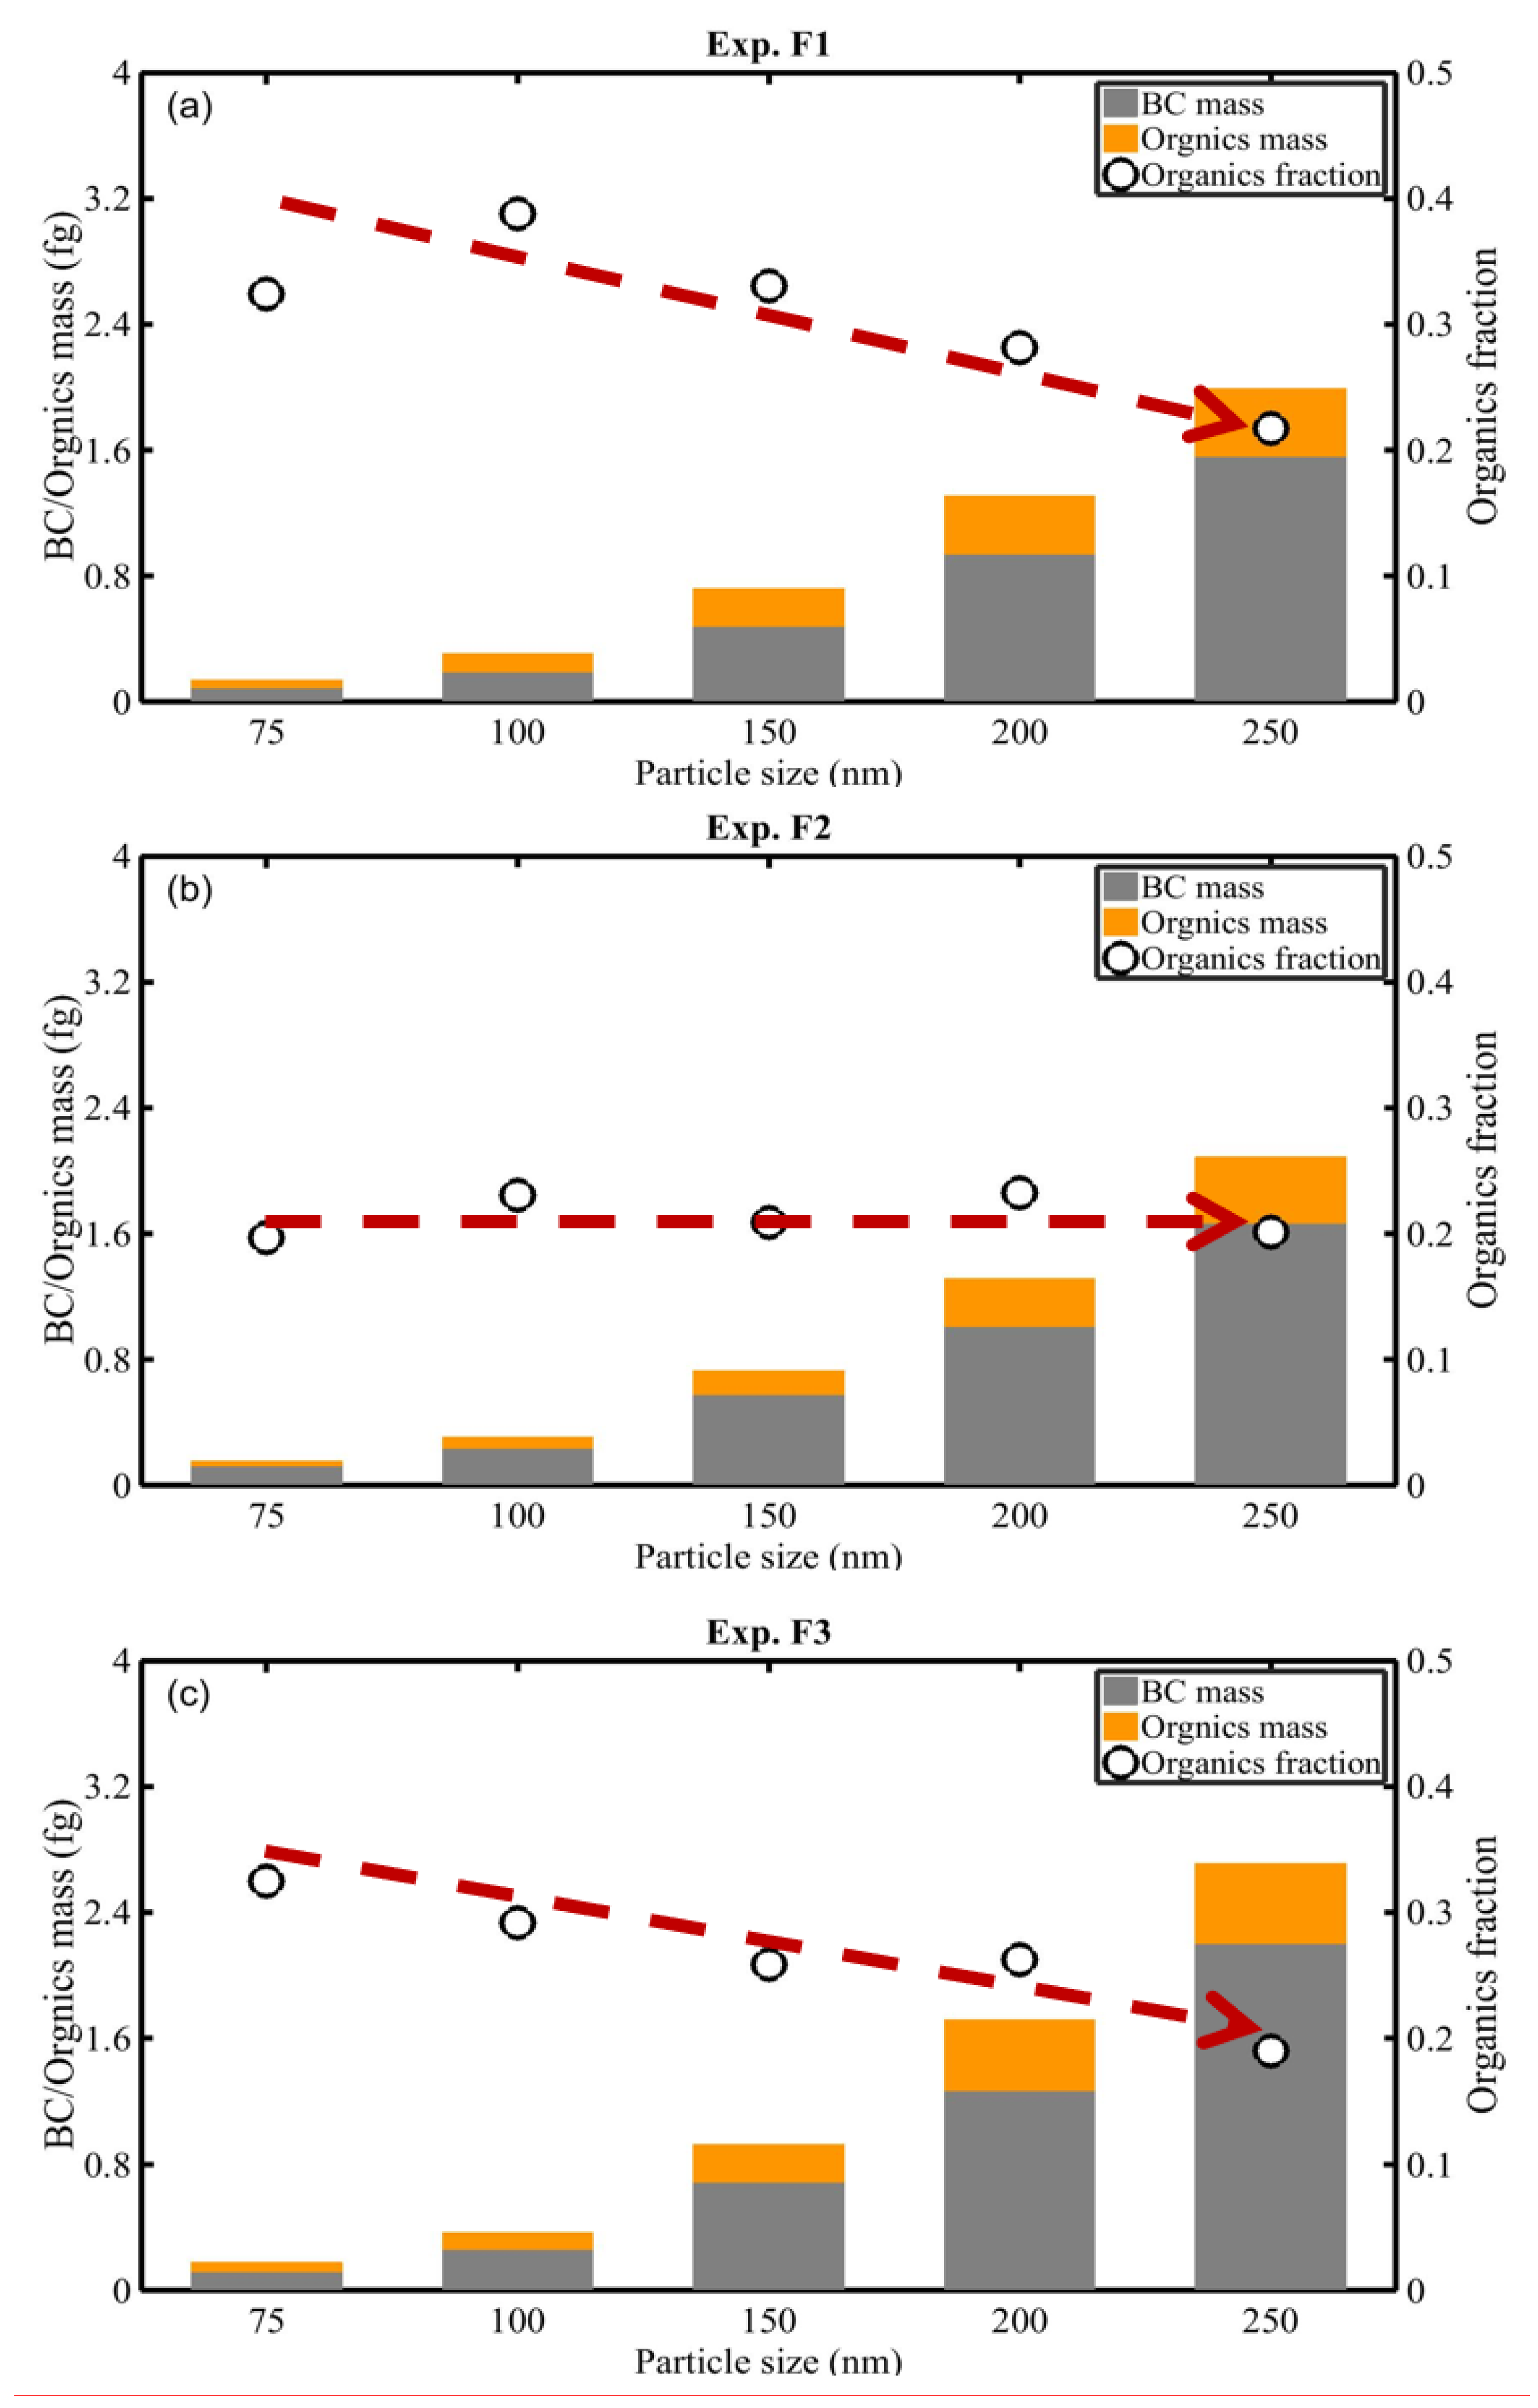
3.1. Composition of Soot
3.2. Constitution of the BC Particles
3.3. Mixing State
3.3.1. Size Distribution and Size-Resolved Mixing State
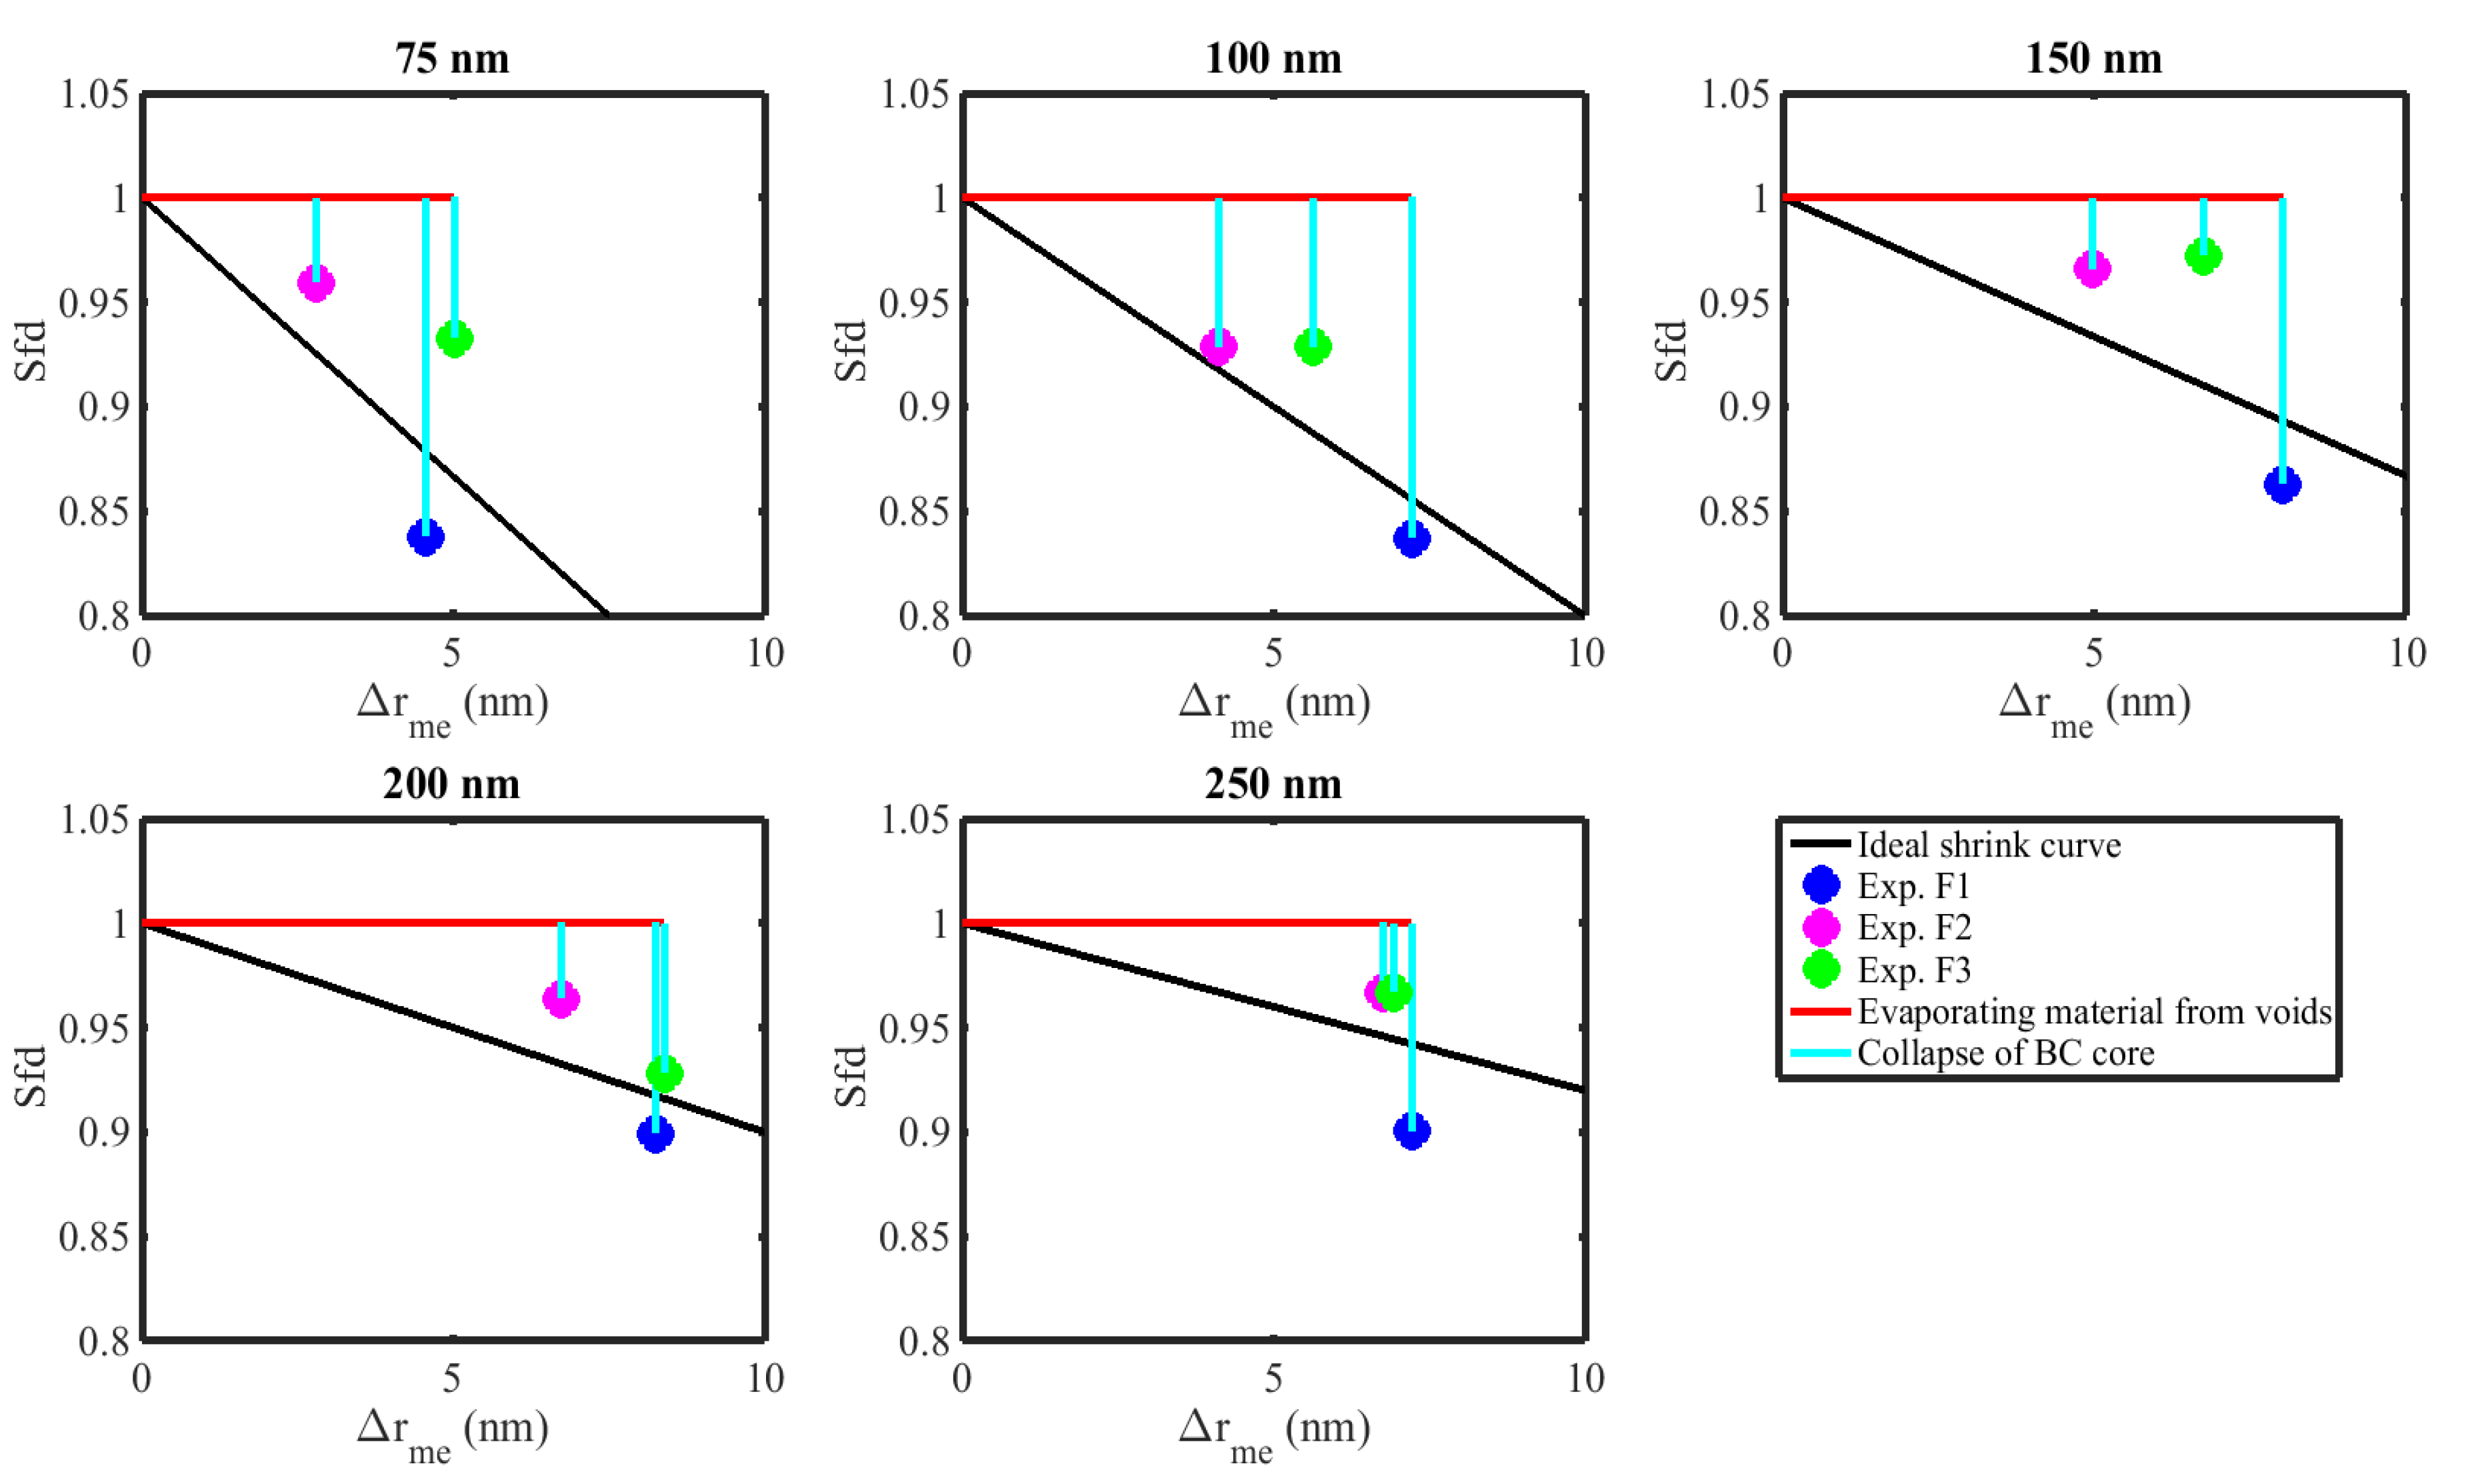
3.3.2. Morphological Transformation
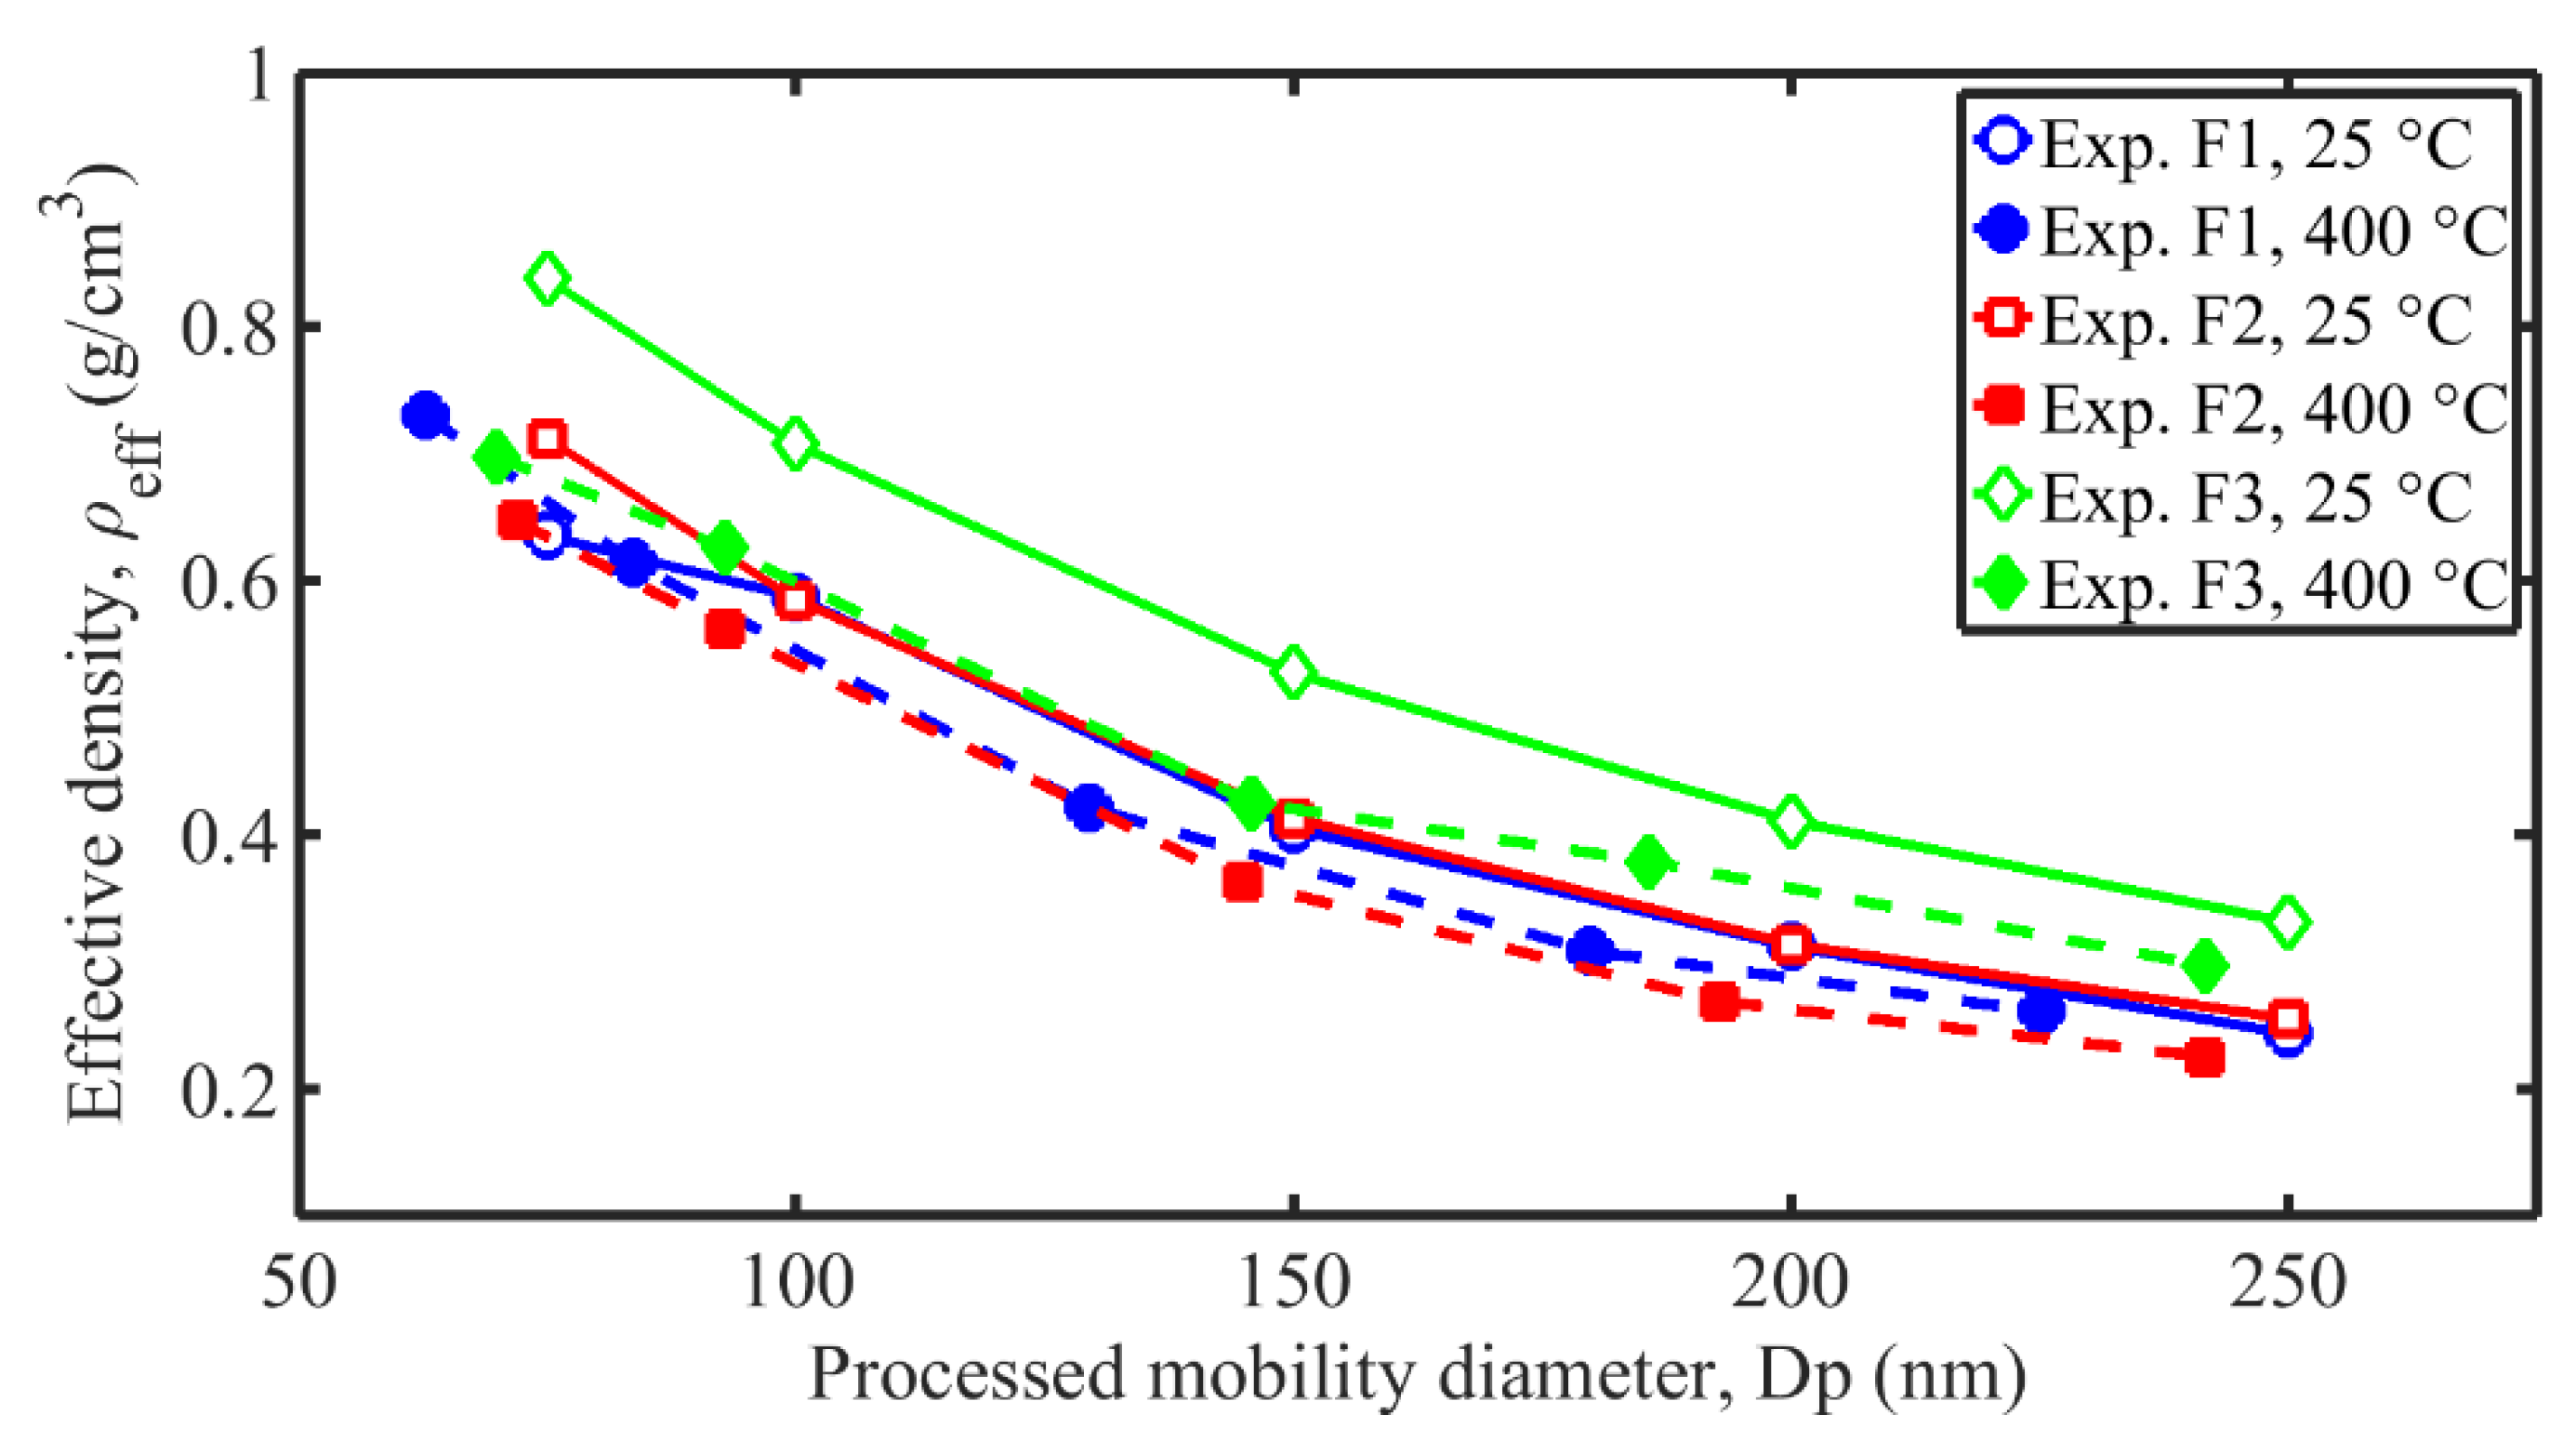
3.4. Effective Density
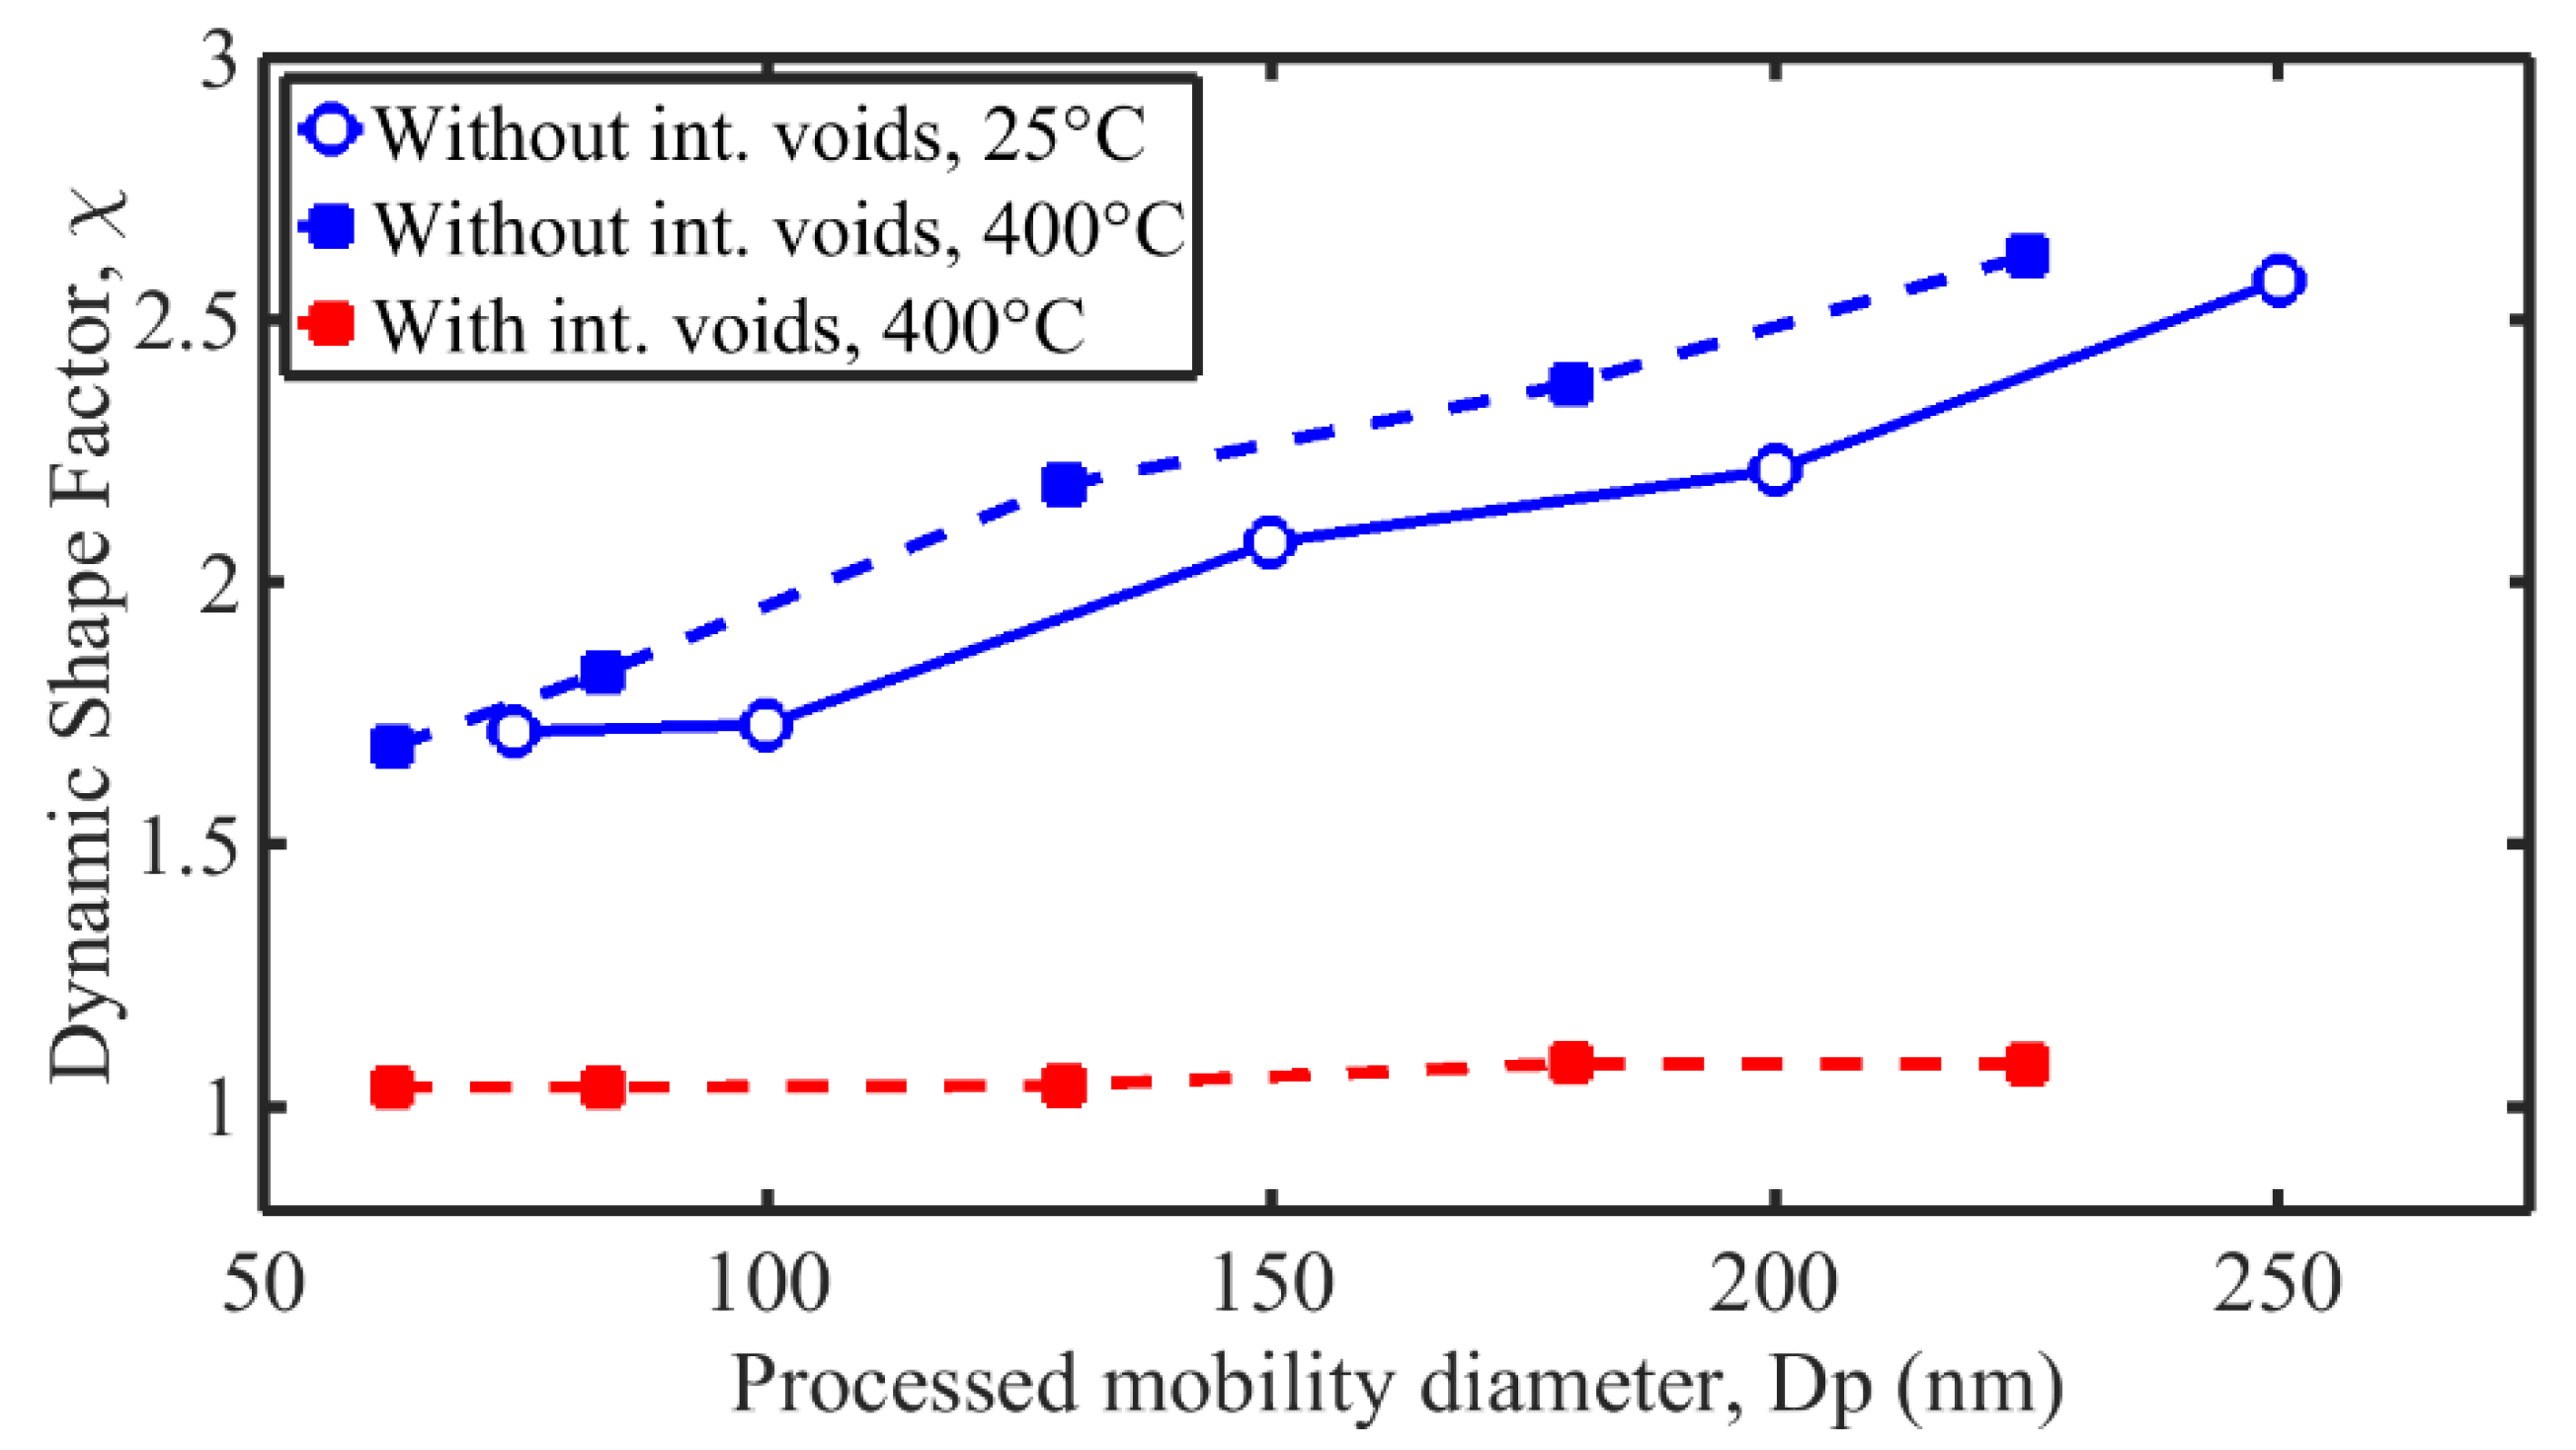
3.5. Dynamic Shape Factor
3.6. Optical Properties
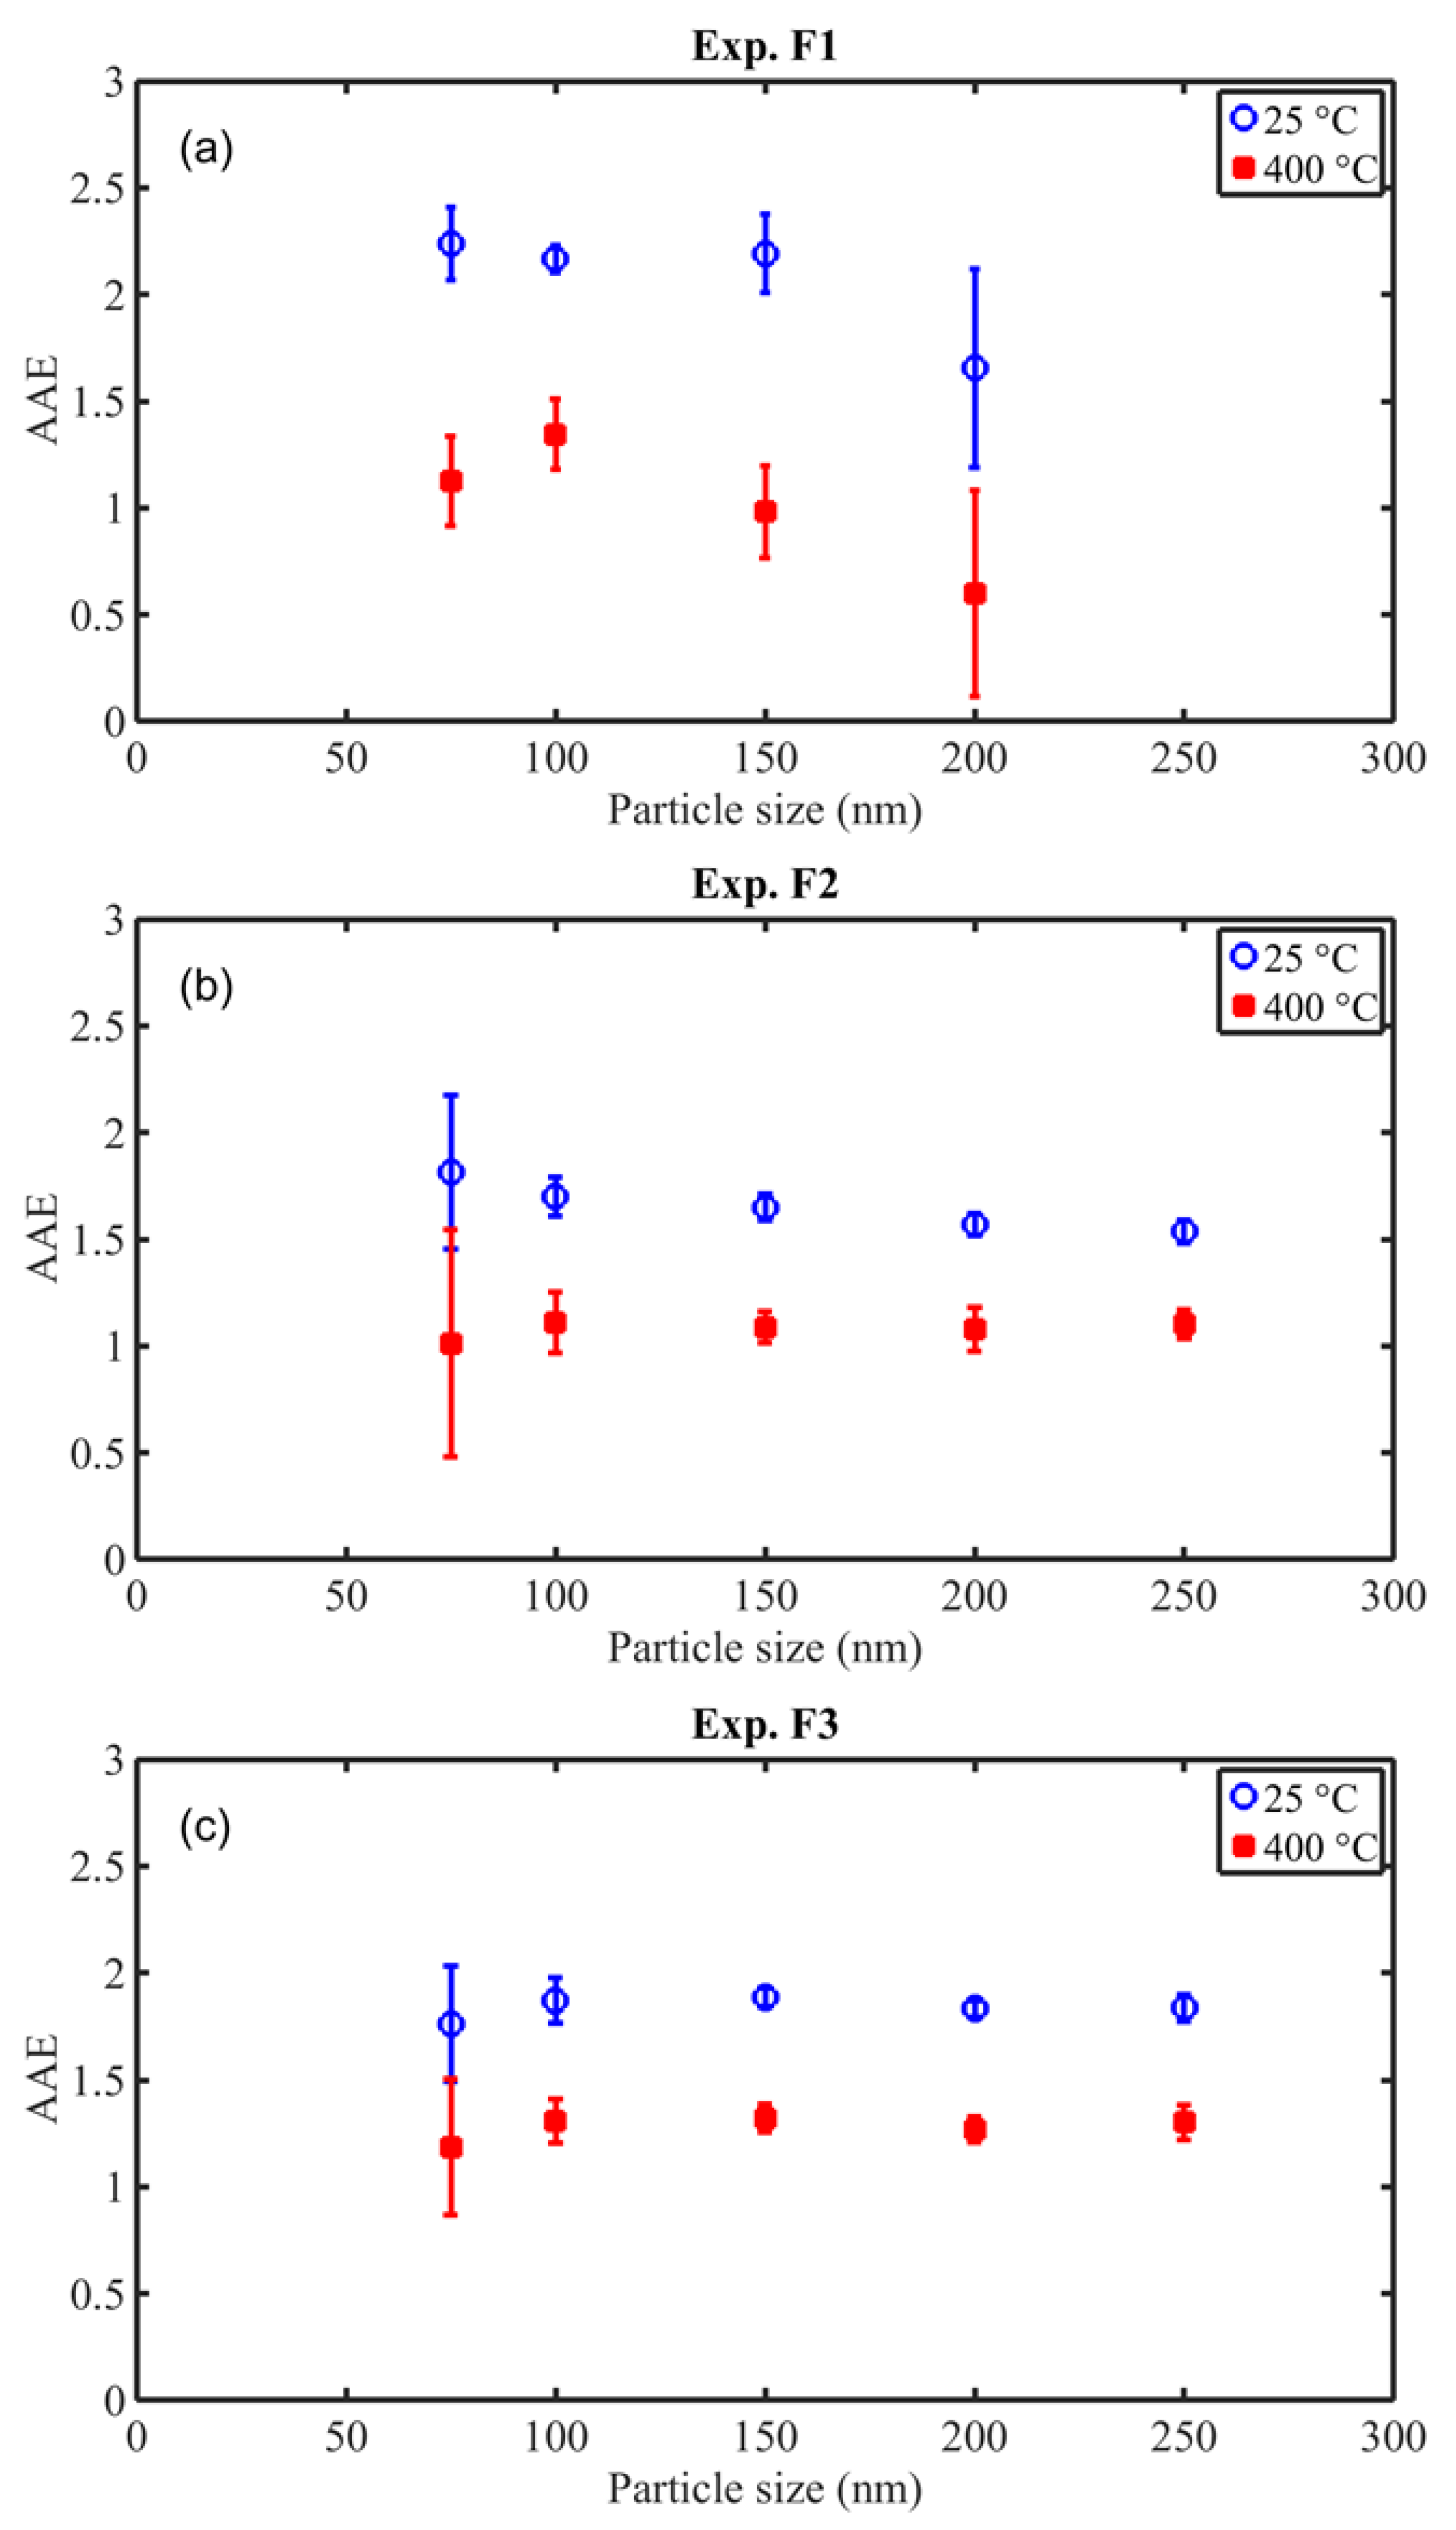
3.6.1. Size-Resolved Differential Light Absorption of BC and POA at Various Wavelengths
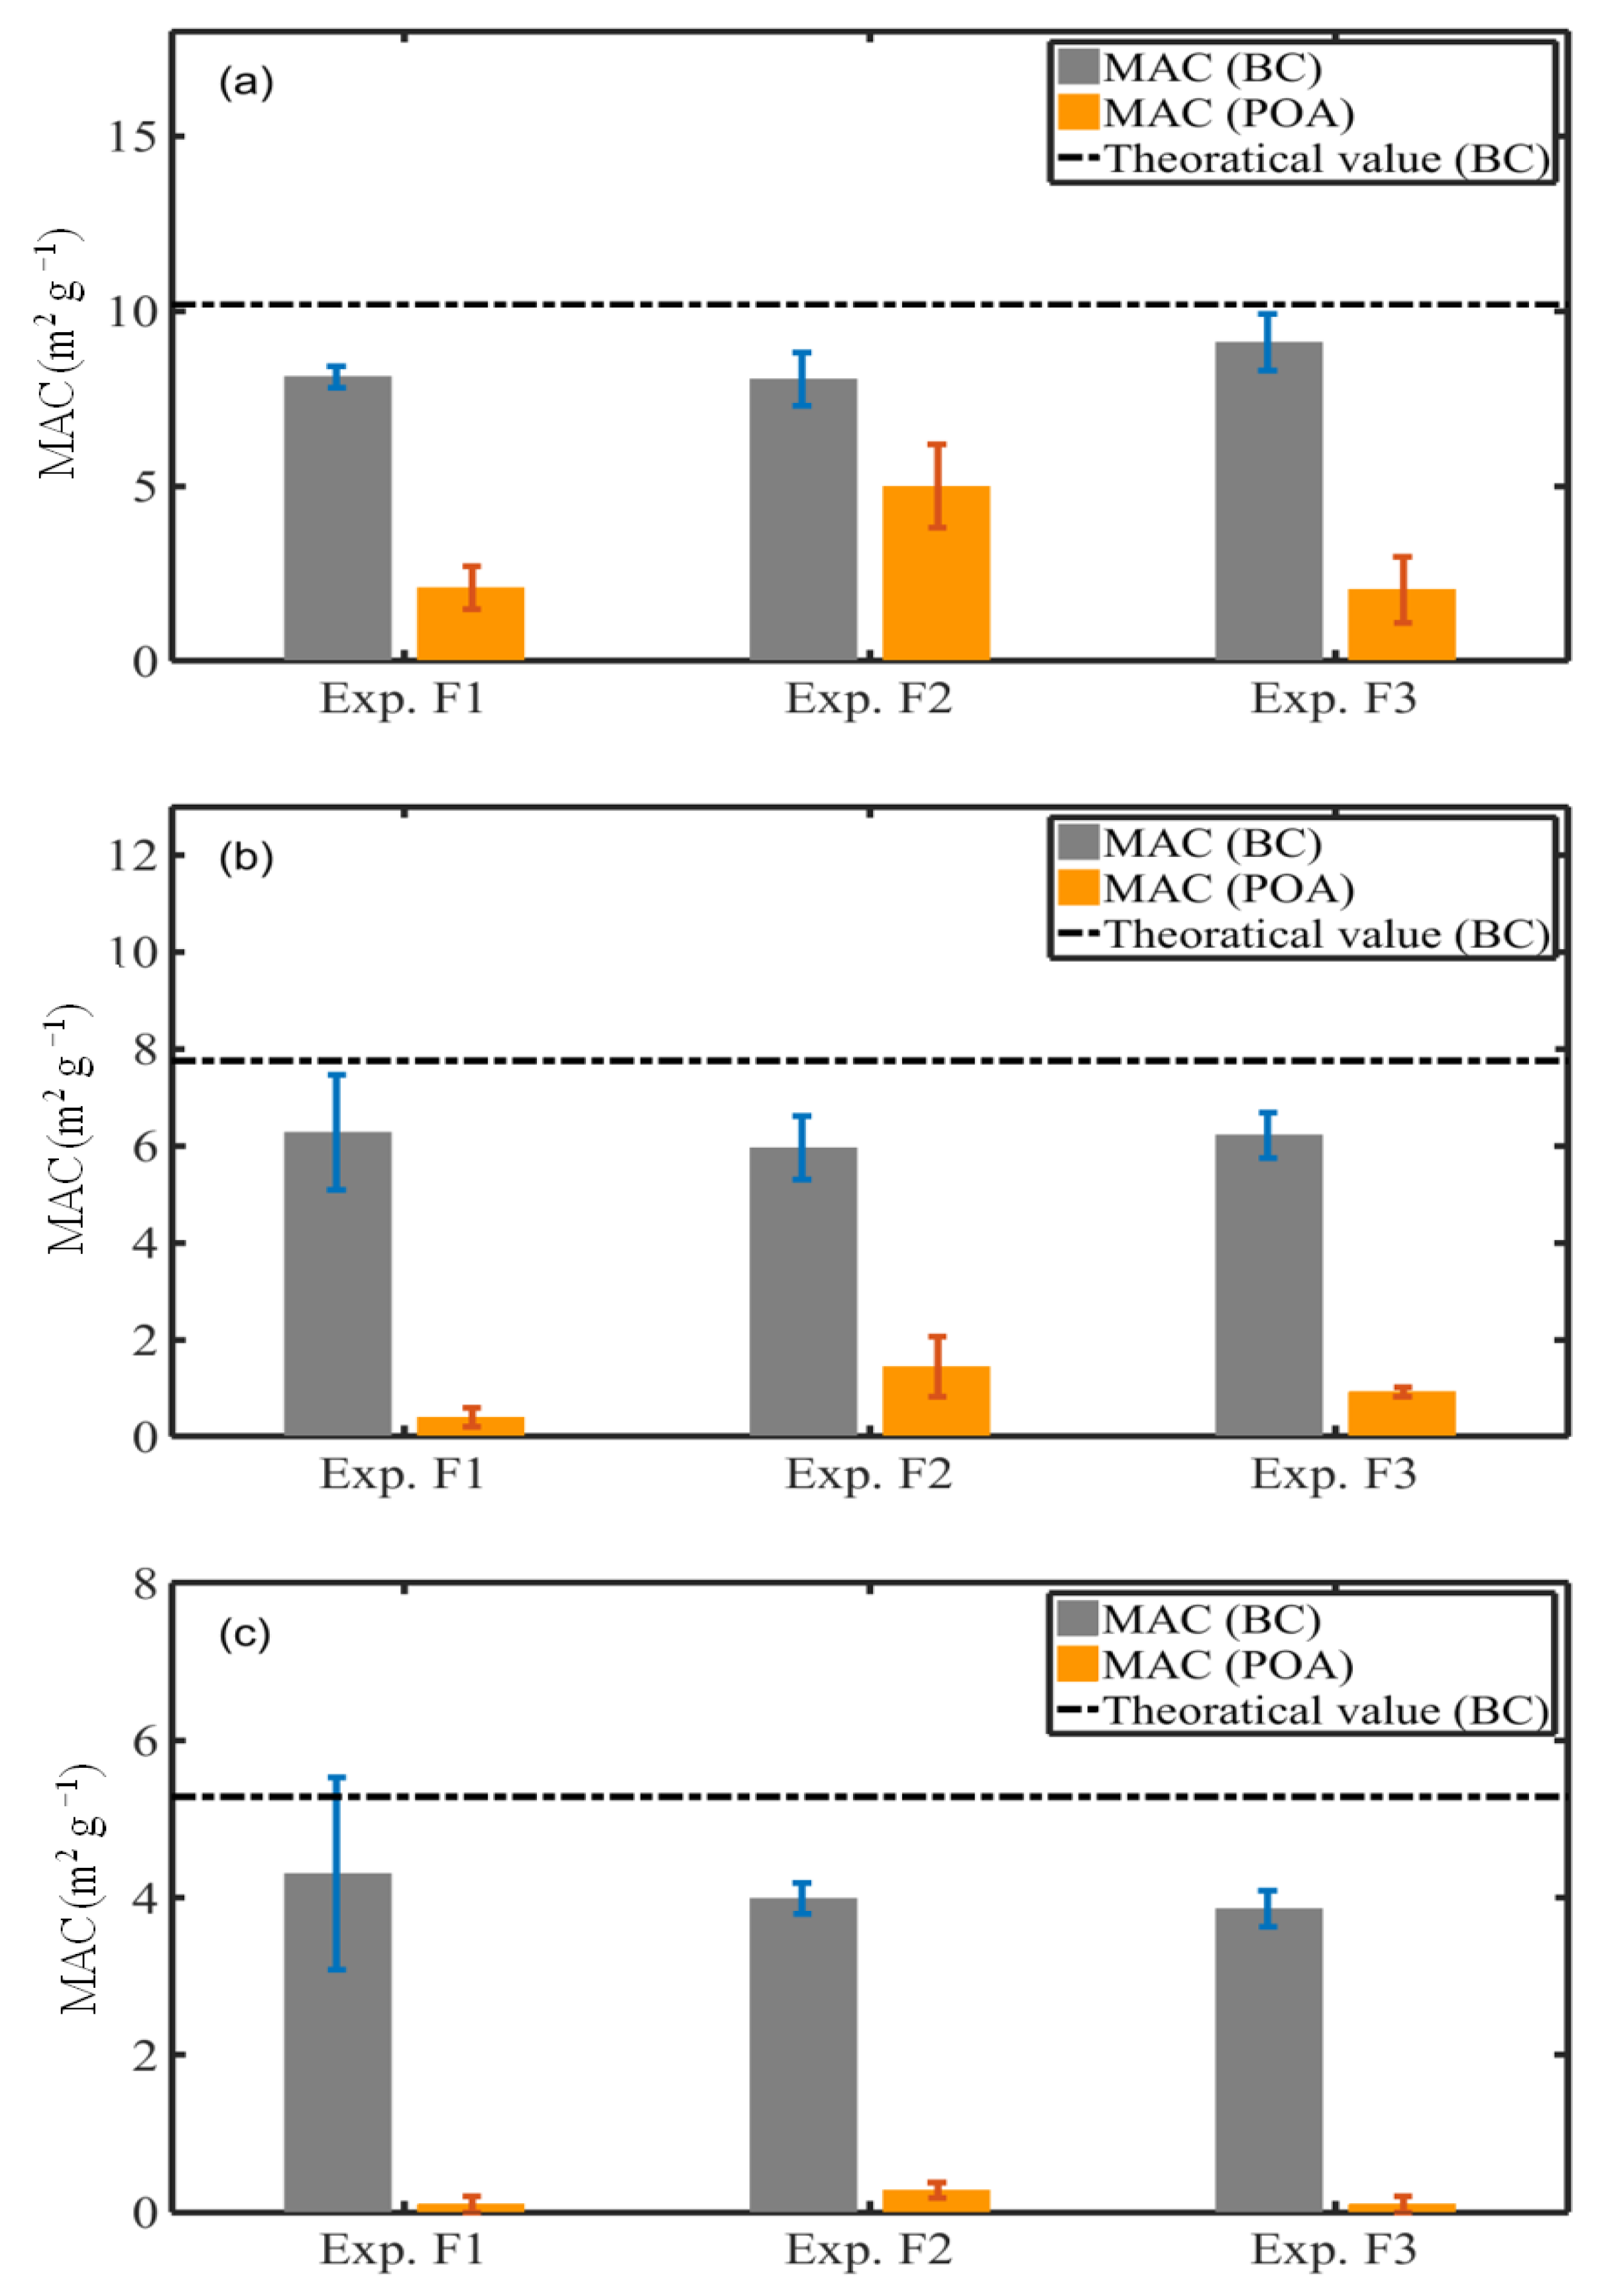
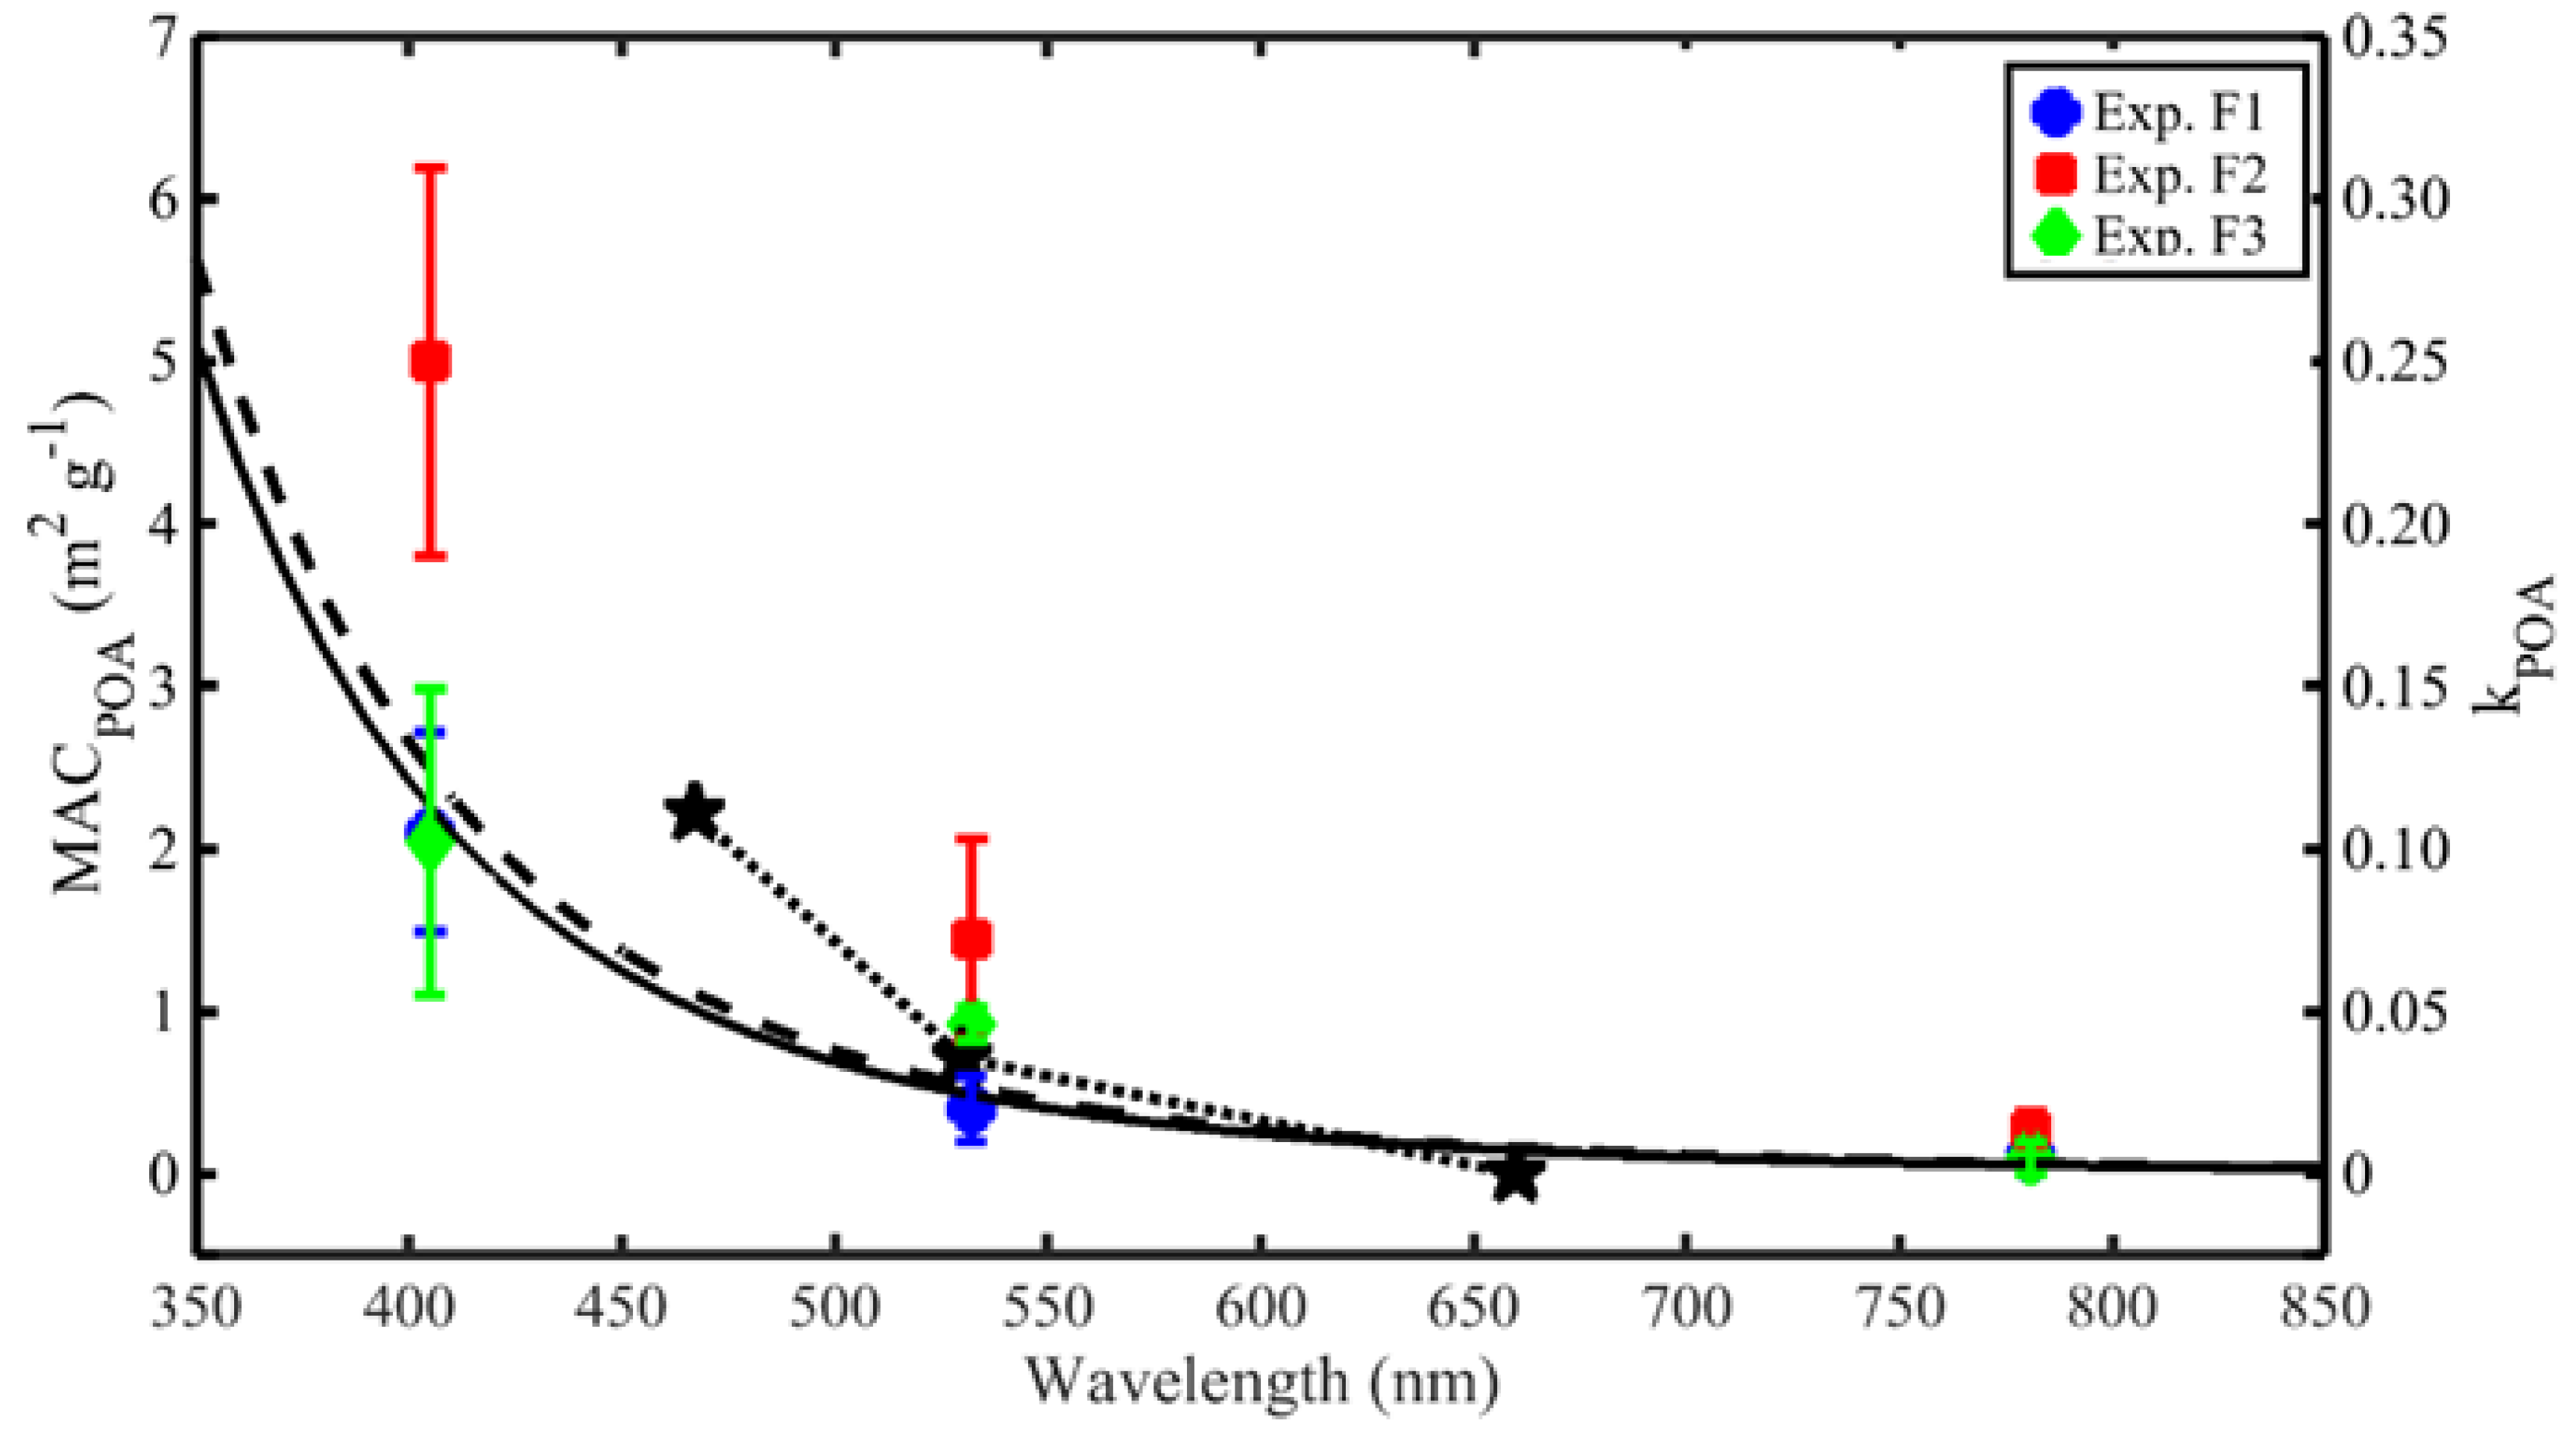
3.6.2. MAC of BC and POA
3.6.3. Contribution of BrC to Absorption
4. Conclusions
Supplementary Materials
Author Contributions
Funding
Institutional Review Board Statement
Informed Consent Statement
Data Availability Statement
Acknowledgments
Conflicts of Interest
References
- Bond, T.C.; Doherty, S.J.; Fahey, D.W.; Forster, P.M.; Berntsen, T.; Deangelo, B.J.; Flanner, M.G.; Ghan, S.; Kärcher, B.; Koch, D.; et al. Bounding the role of black carbon in the climate system: A scientific assessment. J. Geophys. Res. Atmos. 2013, 118, 5380–5552. [Google Scholar] [CrossRef]
- UNEP; WMO. Integrated Assessment of Black Carbon and Tropospheric Ozone; Publishing Services Section at the United Nations Office at Nairobi (UNON): Nairobi, Kenya, 2011. [Google Scholar]
- IPCC. Climate Change 2021: The Physical Science Basis. Working Group I Contribution to the IPCC Sixth Assessment Report; IPCC: Geneva, Switzerland, 2021; p. 3949. [Google Scholar] [CrossRef]
- Bond, T.C.; Bergstrom, R.W. Light Absorption by Carbonaceous Particles: An Investigative Review. Aerosol Sci. Technol. 2006, 40, 27–67. [Google Scholar] [CrossRef]
- Kirchstetter, T.W.; Novakov, T.; Hobbs, P.V. Evidence that the spectral dependence of light absorption by aerosols is affected by organic carbon. J. Geophys. Res. D Atmos. 2004, 109, 1–12. [Google Scholar] [CrossRef] [Green Version]
- Laskin, A.; Laskin, J.; Nizkorodov, S.A. Chemistry of Atmospheric Brown Carbon. Chem. Rev. 2015, 115, 4335–4382. [Google Scholar] [CrossRef] [Green Version]
- Schnaiter, M.; Gimmler, M.; Llamas, I.; Linke, C.; Jäger, C.; Mutschke, H. Strong spectral dependence of light absorption by organic carbon particles formed by propane combustion. Atmos. Chem. Phys. 2006, 6, 2981–2990. [Google Scholar] [CrossRef] [Green Version]
- China, S.; Mazzoleni, C.; Gorkowski, K.; Aiken, A.C.; Dubey, M.K. Morphology and mixing state of individual freshly emitted wildfire carbonaceous particles. Nat. Commun. 2013, 4, 2122. [Google Scholar] [CrossRef] [Green Version]
- Stephens, M.; Turner, N.; Sandberg, J. Particle identification by laser-induced incandescence in a solid-state laser cavity. Appl. Opt. 2003, 42, 3726. [Google Scholar] [CrossRef]
- Lee, A.K.Y.; Willis, M.D.; Healy, R.M.; Onasch, T.B.; Abbatt, J.P.D. Mixing state of carbonaceous aerosol in an urban environment: Single particle characterization using the soot particle aerosol mass spectrometer (SP-AMS). Atmos. Chem. Phys. 2015, 15, 1823–1841. [Google Scholar] [CrossRef] [Green Version]
- Onasch, T.B.; Trimborn, A.; Fortner, E.C.; Jayne, J.T.; Kok, G.L.; Williams, L.R.; Davidovits, P.; Worsnop, D.R. Soot particle aerosol mass spectrometer: Development, validation, and initial application. Aerosol Sci. Technol. 2012, 46, 804–817. [Google Scholar] [CrossRef]
- Khalizov, A.F.; Hogan, B.; Qiu, C.; Petersen, E.L.; Zhang, R. Characterization of soot aerosol produced from combustion of propane in a shock tube. Aerosol Sci. Technol. 2012, 46, 925–936. [Google Scholar] [CrossRef]
- Ghazi, R.; Tjong, H.; Soewono, A.; Rogak, S.N.; Olfert, J.S. Mass, mobility, volatility, and morphology of soot particles generated by a mckenna and inverted burner. Aerosol Sci. Technol. 2013, 47, 395–405. [Google Scholar] [CrossRef]
- Graves, B.; Olfert, J.; Patychuk, B.; Dastanpour, R.; Rogak, S. Characterization of Particulate Matter Morphology and Volatility from a Compression-Ignition Natural-Gas Direct-Injection Engine. Aerosol Sci. Technol. 2015, 49, 589–598. [Google Scholar] [CrossRef]
- Momenimovahed, A.; Olfert, J.S. Effective Density and Volatility of Particles Emitted from Gasoline Direct Injection Vehicles and Implications for Particle Mass Measurement. Aerosol Sci. Technol. 2015, 49, 1051–1062. [Google Scholar] [CrossRef]
- Sakurai, H.; Park, K.; McMurry, P.H.; Zarling, D.D.; Kittelson, D.B.; Ziemann, P.J. Size-Dependent Mixing Characteristics of Volatile and Nonvolatile Components in Diesel Exhaust Aerosols. Environ. Sci. Technol. 2003, 37, 5487–5495. [Google Scholar] [CrossRef] [PubMed]
- Lin, P.; Aiona, P.K.; Li, Y.; Shiraiwa, M.; Laskin, J.; Nizkorodov, S.A.; Laskin, A. Molecular Characterization of Brown Carbon in Biomass Burning Aerosol Particles. Environ. Sci. Technol. 2016, 50, 11815–11824. [Google Scholar] [CrossRef] [PubMed]
- Liu, C.; Chung, C.E.; Zhang, F.; Yin, Y. The colors of biomass burning aerosols in the atmosphere. Sci. Rep. 2016, 6, 28267. [Google Scholar] [CrossRef]
- Saleh, R.; Robinson, E.S.; Tkacik, D.S.; Ahern, A.T.; Liu, S.; Aiken, A.C.; Sullivan, R.C.; Presto, A.A.; Dubey, M.K.; Yokelson, R.J.; et al. Brownness of organics in aerosols from biomass burning linked to their black carbon content. Nat. Geosci. 2014, 7, 647–650. [Google Scholar] [CrossRef]
- Liu, J.; Bergin, M.; Guo, H.; King, L.; Kotra, N.; Edgerton, E.; Weber, R.J. Size-resolved measurements of brown carbon in water and methanol extracts and estimates of their contribution to ambient fine-particle light absorption. Atmos. Chem. Phys. 2013, 13, 12389–12404. [Google Scholar] [CrossRef] [Green Version]
- Olson, M.R.; Garcia, M.V.; Robinson, M.A.; Van Rooy, P.; Dietenberger, M.A.; Bergin, M.; Schauer, J.J. Investigation of black and brown carbon multiple-wavelength- dependent light absorption from biomass and fossil fuel combustion source emissions. J. Geophys. Res. Atmos. 2015, 6682–6697. [Google Scholar] [CrossRef]
- Chakrabarty, R.K.; Moosmüller, H.; Chen, L.W.A.; Lewis, K.; Arnott, W.P.; Mazzoleni, C.; Dubey, M.K.; Wold, C.E.; Hao, W.M.; Kreidenweis, S.M. Brown carbon in tar balls from smoldering biomass combustion. Atmos. Chem. Phys. 2010, 10, 6363–6370. [Google Scholar] [CrossRef] [Green Version]
- Graber, E.R.; Rudich, Y. Atmospheric HULIS: How humic-like are they? A comprehensive and critical review. Atmos. Chem. Phys. 2006, 6, 729–753. [Google Scholar] [CrossRef] [Green Version]
- Laskin, J.; Laskin, A.; Nizkorodov, S.A.; Roach, P.; Eckert, P.; Gilles, M.K.; Wang, B.; Lee, H.J.; Hu, Q. Molecular selectivity of brown carbon chromophores. Environ. Sci. Technol. 2014, 48, 12047–12055. [Google Scholar] [CrossRef] [PubMed]
- Schnaiter, M.; Horvath, H.; Möhler, O.; Naumann, K.H.; Saathoff, H.; Schöck, O.W. UV-VIS-NIR spectral optical properties of soot and soot-containing aerosols. J. Aerosol Sci. 2003, 34, 1421–1444. [Google Scholar] [CrossRef]
- Moise, T.; Flores, J.M.; Rudich, Y. Optical Properties of Secondary Organic Aerosols and Their Changes by Chemical Processes. Chem. Rev. 2015, 115, 4400–4439. [Google Scholar] [CrossRef]
- Lu, Z.; Streets, D.G.; Winijkul, E.; Yan, F.; Chen, Y.; Bond, T.C.; Feng, Y.; Dubey, M.K.; Liu, S.; Pinto, J.P.; et al. Light Absorption Properties and Radiative Effects of Primary Organic Aerosol Emissions. Environ. Sci. Technol. 2015, 49, 4868–4877. [Google Scholar] [CrossRef] [PubMed] [Green Version]
- Feng, Y.; Ramanathan, V.; Kotamarthi, V.R. Brown carbon: A significant atmospheric absorber of solar radiation. Atmos. Chem. Phys. 2013, 13, 8607–8621. [Google Scholar] [CrossRef] [Green Version]
- Liu, J.; Scheuer, E.; Dibb, J.; Ziemba, L.D.; Thornhill, K.L.; Anderson, B.E.; Wisthaler, A.; Mikoviny, T.; Devi, J.J.; Bergin, M.; et al. Brown carbon in the continental troposphere. Geophys. Res. Lett. 2014, 41, 2191–2195. [Google Scholar] [CrossRef] [Green Version]
- Park, R.J.; Kim, M.J.; Jeong, J.I.; Youn, D.; Kim, S. A contribution of brown carbon aerosol to the aerosol light absorption and its radiative forcing in East Asia. Atmos. Environ. 2010, 44, 1414–1421. [Google Scholar] [CrossRef]
- Jing, L. Standard Combustion Aerosol Generator (SCAG) for Calibration Purposes. Atmos. Environ. 1999, 27, 1271–1275. [Google Scholar]
- Huffman, J.A.; Ziemann, P.J.; Jayne, J.T.; Worsnop, D.R.; Jimenez, J.L. Development and characterization of a fast-stepping/scanning thermodenuder for chemically-resolved aerosol volatility measurements. Aerosol Sci. Technol. 2008, 42, 395–407. [Google Scholar] [CrossRef]
- Takhar, M.; Stroud, C.A.; Chan, A.W.H. Volatility Distribution and Evaporation Rates of Organic Aerosol from Cooking Oils and their Evolution upon Heterogeneous Oxidation. ACS Earth Space Chem. 2019, 3, 1717–1728. [Google Scholar] [CrossRef]
- Kolesar, K.R.; Li, Z.; Wilson, K.R.; Cappa, C.D. Heating-Induced Evaporation of Nine Different Secondary Organic Aerosol Types. Environ. Sci. Technol. 2015, 49, 12242–12252. [Google Scholar] [CrossRef]
- Gkatzelis, G.I.; Papanastasiou, D.K.; Florou, K.; Kaltsonoudis, C.; Louvaris, E.; Pandis, S.N. Measurement of nonvolatile particle number size distribution. Atmos. Meas. Tech. 2016, 9, 103–114. [Google Scholar] [CrossRef] [Green Version]
- Burtscher, H.; Baltensperger, U.; Bukowiecki, N.; Cohn, P.; Hüglin, C.; Mohr, M.; Matter, U.; Nyeki, S.; Schmatloch, V.; Streit, N.; et al. Separation of volatile and non-volatile aerosol fractions by thermodesorption: Instrumental development and applications. J. Aerosol Sci. 2001, 32, 427–442. [Google Scholar] [CrossRef]
- McMurry, P.H.; Wang, X.; Park, K.; Ehara, K. The relationship between mass and mobility for atmospheric particles: A new technique for measuring particle density. Aerosol Sci. Technol. 2002, 36, 227–238. [Google Scholar] [CrossRef]
- Rissler, J.; Messing, M.E.; Malik, A.I.; Nilsson, P.T.; Nordin, E.Z.; Bohgard, M.; Sanati, M.; Pagels, J.H. Effective density characterization of soot agglomerates from various sources and comparison to aggregation theory. Aerosol Sci. Technol. 2013, 47, 792–805. [Google Scholar] [CrossRef] [Green Version]
- Arnott, W.P.; Moosmüller, H.; Rogers, C.F.; Jin, T.; Bruch, R. Photoacoustic spectrometer for measuring light absorption by aerosol: Instrument description. Atmos. Environ. 1999, 33, 2845–2852. [Google Scholar] [CrossRef]
- Lall, A.A.; Rong, W.; Mädler, L.; Friedlander, S.K. Nanoparticle aggregate volume determination by electrical mobility analysis: Test of idealized aggregate theory using aerosol particle mass analyzer measurements. J. Aerosol Sci. 2008, 39, 403–417. [Google Scholar] [CrossRef]
- Schmidt-Ott, A.; Baltensperger, U.; Gäggeler, H.W.; Jost, D.T. Scaling behaviour of physical parameters describing agglomerates. J. Aerosol Sci. 1990, 21, 711–717. [Google Scholar] [CrossRef]
- Sorensen, C.M. The mobility of fractal aggregates: A review. Aerosol Sci. Technol. 2011, 45, 765–779. [Google Scholar] [CrossRef]
- Pagels, J.; Khalizov, A.F.; McMurry, P.H.; Zhang, R.Y. Processing of soot by controlled sulphuric acid and water condensation mass and mobility relationship. Aerosol Sci. Technol. 2009, 43, 629–640. [Google Scholar] [CrossRef]
- Park, K.; Cao, F.; Kittelson, D.B.; McMurry, P.H. Relationship between particle mass and mobility for diesel exhaust particles. Environ. Sci. Technol. 2003, 37, 577–583. [Google Scholar] [CrossRef]
- Moore, R.H.; Ziemba, L.D.; Dutcher, D.; Beyersdorf, A.J.; Chan, K.; Crumeyrolle, S.; Raymond, T.M.; Thornhill, K.L.; Winstead, E.L.; Anderson, B.E. Mapping the operation of the miniature combustion aerosol standard (Mini-CAST) soot generator. Aerosol Sci. Technol. 2014, 48, 467–479. [Google Scholar] [CrossRef]
- Maricq, M.M. Examining the relationship between black carbon and soot in flames and engine exhaust. Aerosol Sci. Technol. 2014, 48, 620–629. [Google Scholar] [CrossRef]
- Sgro, L.A.; Borghese, A.; Speranza, L.; Barone, A.C.; Minutolo, P.; Bruno, A.; D’Anna, A.; D’Alessio, A. Measurements of nanoparticles of organic carbon and soot in flames and vehicle exhausts. Environ. Sci. Technol. 2008, 42, 859–863. [Google Scholar] [CrossRef]
- Pei, X.; Hallquist, M.; Eriksson, A.C.; Pagels, J.; Donahue, N.M.; Mentel, T.; Svenningsson, B.; Brune, W.; Pathak, R.K. Morphological transformation of soot: Investigation of microphysical processes during the condensation of sulfuric acid and limonene ozonolysis product vapors. Atmos. Chem. Phys. 2018, 18, 9845–9860. [Google Scholar] [CrossRef] [Green Version]
- Violi, A.; Voth, G.A.; Sarofim, A.F. A time-scale problem for the formation of soot precursors in premixed flames. ACS Div. Fuel Chem. Prepr. 2003, 48, 545–547. [Google Scholar]
- DeCarlo, P.F.; Slowik, J.G.; Worsnop, D.R.; Davidovits, P.; Jimenez, J.L. Particle morphology and density characterization by combined mobility and aerodynamic diameter measurements. Part 1: Theory. Aerosol Sci. Technol. 2004, 38, 1185–1205. [Google Scholar] [CrossRef] [Green Version]
- Kim, J.; Bauer, H.; Dobovičnik, T.; Hitzenberger, R.; Lottin, D.; Ferry, D.; Petzold, A. Assessing optical properties and refractive index of combustion aerosol particles through combined experimental and modeling studies. Aerosol Sci. Technol. 2015, 49, 340–350. [Google Scholar] [CrossRef]
- Sun, H.; Biedermann, L.; Bond, T.C. Color of brown carbon: A model for ultraviolet and visible light absorption by organic carbon aerosol. Geophys. Res. Lett. 2007, 34, 1–5. [Google Scholar] [CrossRef]
- Andreae, M.O.; Gelencsér, A. Black carbon or brown carbon? the nature of light-absorbing carbonaceous aerosols. Atmos. Chem. Phys. 2006, 6, 3131–3148. [Google Scholar] [CrossRef] [Green Version]


| Parameter | Exp. F1 | Exp. F2 | Exp. F3 | |
|---|---|---|---|---|
| # 1 | Propane (mL min−1) | 56 | 56 | 56 |
| # 2 | Premixing air (mL min−1) | 82 | 57 | 57 |
| # 3 | Diffusion air (mL min−1) | 1134 | 1134 | 888 |
| # 4 | Quenching air (mL min−1) | 503 | 503 | 503 |
| # 5 | Dilution air (mL min−1) | 0 | 0 | 0 |
| C/O | 0.33 | 0.34 | 0.42 | |
| d/p | 13.8 | 19.9 | 15.6 | |
| Φ § (Fuel–Air Equivalence Ratio) | 1.10 | 1.12 | 1.41 | |
| Flame Condition | K (×10−5) | Dfm |
|---|---|---|
| Exp. F1, 25 °C | 0.96 | 2.25 |
| Exp. F1, 400 °C | 0.97 | 2.23 |
| Exp. F2, 25 °C | 1.4 | 2.18 |
| Exp. F2, 400 °C | 1.5 | 2.13 |
| Exp. F3, 25 °C | 1.1 | 2.27 |
| Exp. F3, 400 °C | 0.65 | 2.34 |
| Initial Dp (nm) and Conditions | Dp (nm) | dpp (nm) | Npp |
|---|---|---|---|
| Exp. F1, 75 nm, modeled | 63 | 21.4 | 10 |
| Exp. F1, 100 nm, modeled | 84 | 23.0 | 17 |
| Exp. F1, 150 nm, modeled | 129 | 23.0 | 42 |
| Exp. F1, 200 nm, modeled | 180 | 21.7 | 100 |
| Exp. F1, 250 nm, modeled | 225 | 22.2 | 153 |
| Exp. F2, 75 nm, modeled | 72 | 21.3 | 14 |
| Exp. F2, 100 nm, modeled | 93 | 23.1 | 21 |
| Exp. F2, 150 nm, modeled | 145 | 21.2 | 65 |
| Exp. F2, 200 nm, modeled | 193 | 19.7 | 143 |
| Exp. F2, 250 nm, modeled | 242 | 19.9 | 229 |
| Exp. F3, 75 nm, modeled | 70 | 22.6 | 12 |
| Exp. F3, 100 nm, modeled | 93 | 26.3 | 16 |
| Exp. F3, 150 nm, modeled | 146 | 25.9 | 43 |
| Exp. F3, 200 nm, modeled | 186 | 28.6 | 58 |
| Exp. F3, 250 nm, modeled | 242 | 27.8 | 111 |
| Exp. No. | Dme,TD (nm) | Fvs,NTD (%) | Fvs,TD (%) | Sfd | Number Fraction (%) | Mass Fraction (%) | |||||||||
|---|---|---|---|---|---|---|---|---|---|---|---|---|---|---|---|
| Internally Mixed BC/POA | Externally Mixed POA | Internally Mixed BC | Internally Mixed POA | Externally Mixed POA | |||||||||||
| F1 | 75 | 63 | 0.14 | 0.09 | 55.9 | 46.8 | 59 | 57 | 4.6 | 0.84 | 96 | 4 | 63 | 30 | 7 |
| 100 | 84 | 0.31 | 0.19 | 73.2 | 58.8 | 61 | 63 | 7.2 | 0.84 | 97 | 3 | 58 | 37 | 5 | |
| 150 | 129 | 0.72 | 0.48 | 96.3 | 80.3 | 74 | 74 | 8.0 | 0.86 | 98 | 2 | 64 | 31 | 5 | |
| 200 | 180 | 1.31 | 0.94 | 117.0 | 100.5 | 80 | 79 | 8.3 | 0.90 | 99 | 1 | 70 | 28 | 2 | |
| 250 | 225 | 1.99 | 1.56 | 133.4 | 118.9 | 85 | 84 | 7.2 | 0.90 | 99 | 1 | 76 | 21 | 3 | |
| F2 | 75 | 72 | 0.16 | 0.13 | 57.0 | 51.5 | 56 | 62 | 2.8 | 0.96 | 99 | 1 | 79 | 19 | 2 |
| 100 | 93 | 0.31 | 0.24 | 71.6 | 63.4 | 63 | 66 | 4.1 | 0.93 | 97 | 3 | 73 | 22 | 5 | |
| 150 | 145 | 0.73 | 0.58 | 95.4 | 85.4 | 74 | 78 | 5.0 | 0.97 | 99 | 1 | 76 | 20 | 4 | |
| 200 | 193 | 1.32 | 1.01 | 116.4 | 102.9 | 80 | 84 | 6.7 | 0.96 | 99 | 1 | 75 | 23 | 2 | |
| 250 | 242 | 2.09 | 1.67 | 135.1 | 121.6 | 84 | 86 | 6.8 | 0.97 | 100 | 0 | 80 | 20 | 0 | |
| F3 | 75 | 70 | 0.19 | 0.12 | 61.3 | 51.3 | 45 | 59 | 5.0 | 0.93 | 99 | 1 | 67 | 32 | 1 |
| 100 | 93 | 0.37 | 0.26 | 76.9 | 65.7 | 54 | 62 | 5.6 | 0.93 | 98 | 2 | 69 | 28 | 3 | |
| 150 | 146 | 0.93 | 0.69 | 104.1 | 90.7 | 67 | 73 | 6.7 | 0.97 | 97 | 3 | 70 | 24 | 6 | |
| 200 | 186 | 1.72 | 1.27 | 127.9 | 111.1 | 74 | 77 | 8.4 | 0.93 | 99 | 1 | 72 | 25 | 3 | |
| 250 | 242 | 2.71 | 2.20 | 147.2 | 133.3 | 80 | 81 | 6.9 | 0.97 | 99 | 1 | 77 | 18 | 5 | |
Publisher’s Note: MDPI stays neutral with regard to jurisdictional claims in published maps and institutional affiliations. |
© 2022 by the authors. Licensee MDPI, Basel, Switzerland. This article is an open access article distributed under the terms and conditions of the Creative Commons Attribution (CC BY) license (https://creativecommons.org/licenses/by/4.0/).
Share and Cite
Prakash, J.; Mitra, K.; Mishra, H.R.; Pei, X.; Ljungström, E.; Pathak, R.K. Characterization of Propane Fueled Flames: A Significant Source of Brown Carbon. Atmosphere 2022, 13, 1270. https://doi.org/10.3390/atmos13081270
Prakash J, Mitra K, Mishra HR, Pei X, Ljungström E, Pathak RK. Characterization of Propane Fueled Flames: A Significant Source of Brown Carbon. Atmosphere. 2022; 13(8):1270. https://doi.org/10.3390/atmos13081270
Chicago/Turabian StylePrakash, Jai, Kalyan Mitra, Harsh Raj Mishra, Xiangyu Pei, Evert Ljungström, and Ravi Kant Pathak. 2022. "Characterization of Propane Fueled Flames: A Significant Source of Brown Carbon" Atmosphere 13, no. 8: 1270. https://doi.org/10.3390/atmos13081270