Article

Temporal and Spatial Variation of Land Surface Temperature in Recent 20 Years and Analysis of the Effect of Land Use in Jiangxi Province, China

1
Faculty of Geomatics, East China University of Technology, Nanchang 330013, China
2
The Key Laboratory of Landscape and Environment, Jiangxi Agricultural University, Nanchang 330045, China
3
School of Tourism and Urban Management, Jiangxi University of Finance and Economics, Nanchang 330013, China
4
College of Land Resources and Environment, Jiangxi Agricultural University, Nanchang 330045, China
*
Author to whom correspondence should be addressed.
Atmosphere 2022, 13(8), 1278; https://doi.org/10.3390/atmos13081278
Submission received: 6 June 2022 / Revised: 1 August 2022 / Accepted: 4 August 2022 / Published: 11 August 2022
(This article belongs to the Section Climatology)

Abstract

:
Under the background of global warming, it is of great significance to study the temporal and spatial evolution of land surface temperature (LST) on long-time scale and the impacts of land use in the fields of urban thermal environment and regional climate change. Based on MODIS LST long time series remote sensing data, the temporal and spatial evolution characteristics of pixel-wise LST in Jiangxi Province, the middle inland province of China from 2000 to 2020 were analyzed by using Theil-Sen + Mann-Kendall, coefficient of variation and Hurst index, and the response of LST to land use was identified by combining the contribution and diversity index. The results showed as follows: (1) LST was generally distributed as "high in Middle-East-West-South and low in North-northwest-southeast direction". LST showed an overall downward trend, indicating a weakening of the warming trend. The dynamic trend of LST was characterized by more descending than ascending tendency. The dynamic stability showed a coexistence of high and low fluctuation tendency, with a higher proportion of medium and low fluctuation areas having obvious spatial differences. The overall dynamic sustainability was characterized by uncertainty of future change trend. (2) The LST were strongly affected by land use in the past 20 years. Firstly, the areas of high LST were mostly located in construction land and unused land, while the areas of low LST were mostly in water area and forest land. However, forest land and water area of high temperature were gradually turned to construction land later on. Secondly, the land use structure and pattern had an strong effects on LST. With the increase of the area proportion of different land use, the LST showed significant differences. The more complex the spatial pattern of land use, the more obvious its impact on LST. The research results will provide some reference for the regions with the same characteristics as Jiangxi Province to deal with LST under the background of global climate change.

1. Introduction

It is well known that with the advancement of urbanization, the composition and spatial configuration of land use/land cover (LULC) have undergone tremendous changes, which have had a serious impact on human health, production activities and living environment [1,2,3,4]. In the process of urbanization, natural features such as vegetation and water are gradually replaced by impervious surfaces such as buildings, roads and squares [5] and the land surface temperature (LST) increases, which will lead to the continuous deterioration of urban thermal environment quality [6,7]. LST and its changes are an important part of global climate change research [8]. It is a key parameter in surface physical processes [9] such as surface radiation energy balance, material cycle, atmospheric cycle, and water cycle, and has a complex relationship with the LULC [10,11,12,13,14]. Therefore, accurately grasping the spatial and temporal variation of LST and the impact of the LULC has become a hot topic in many disciplines such as geography [15], ecology [16] and climatology [17]. It even has important guiding significance for agricultural information monitoring [18], urban thermal environment research [19] and climate change research [20].
Compared with traditional meteorological observation methods, LST remote sensing monitoring has the advantages of wide observation range and strong spatial continuity [21,22]. Moreover, remote sensing monitoring data provide a good visual effect for the extraction of LST [5,23]. Various studies have been carried out on the extraction of LST through different remote sensing satellites [24,25]. For instance, Landsat TM, ETM and OLI thermal infrared (TIR) data with spatial resolutions of 120 m, 60 m and 30 m, respectively, have been usually used for LST analysis in local-scale studies [26,27]. MODIS has been used for high temporal resolution on local or global scale [28,29]. However, numerous observational studies have mainly considered the temporal and spatial distribution characteristics of short-term LST [30,31], lacking long-term coherent researches on the variation trend of pixel-wise LST. Some studies have shown that from a pixel-wise trend analysis of a series of LST observations over time, it is more important to understand whether the temperature is rising, falling, or not changing at all [12,32,33]. In addition, statistical trend analysis techniques are often used for the variation trend of pixel-wise LST. For example, the Mann-Kendall test and Sen’s slope estimator can detect the past trend, change and variability of the time series LST [34,35]. Therefore, based on LST remote sensing data, the pixel-wise LST trend analysis is more meaningful and will further reveal the intensity of impacting factors.
Since LST is a dynamic parameter, its changes are affected by various factors such as elevation [36], some relevant indices [37], and LULC [38,39]. It was found that the normalized difference vegetation index (NDVI) [40,41], artificial impervious surface [42] and green space [43] are closely related to the change of LST. Hu et al. analyzed the relationship between LST and LULC in the urban zones of the Pearl River Delta, and the results showed that the different LULC types and structures had various effects on LST [44]. At the same time, the variation trend of LST has also depended on the differentiation characteristics of landscape patterns, such as the composition and spatial allocation of LULC [39,45]. Shukla et al. determined and analyzed how changing landscape patterns and dynamics affect the LST in Lucknow city, India, and the results from macro pattern analysis showed a significantly strong correlation between mean LST, impervious surface density (positive) and green space density (negative) along the rural-urban gradients [46]. However, previous studies have mainly focused on short-term LST responses to LULC [5,40,47], thus the lack of in-depth research on the composition and spatial configuration of LULC in long-term continuous periods.
Jiangxi Province is the central inland province of China, mainly covered with cultivated land and forest. With the rapid urbanization process, it witnessed the thermal environment changes as other regions did in China [48,49,50,51]. Taking Jiangxi Province as a case and based on the MODIS LST remote sensing data from 2000 to 2020, this paper firstly analyzed the spatiotemporal evolution characteristics of pixel-wise LST in recent 20 years. Then, combined with the contribution index and diversity index, the relationship between LST and LULC was discovered from the three aspects of land use type, structure and diversity. The research results will provide some reference for the regions with the same characteristics as Jiangxi Province to deal with LST under the background of global climate change.

2. Materials and Methods
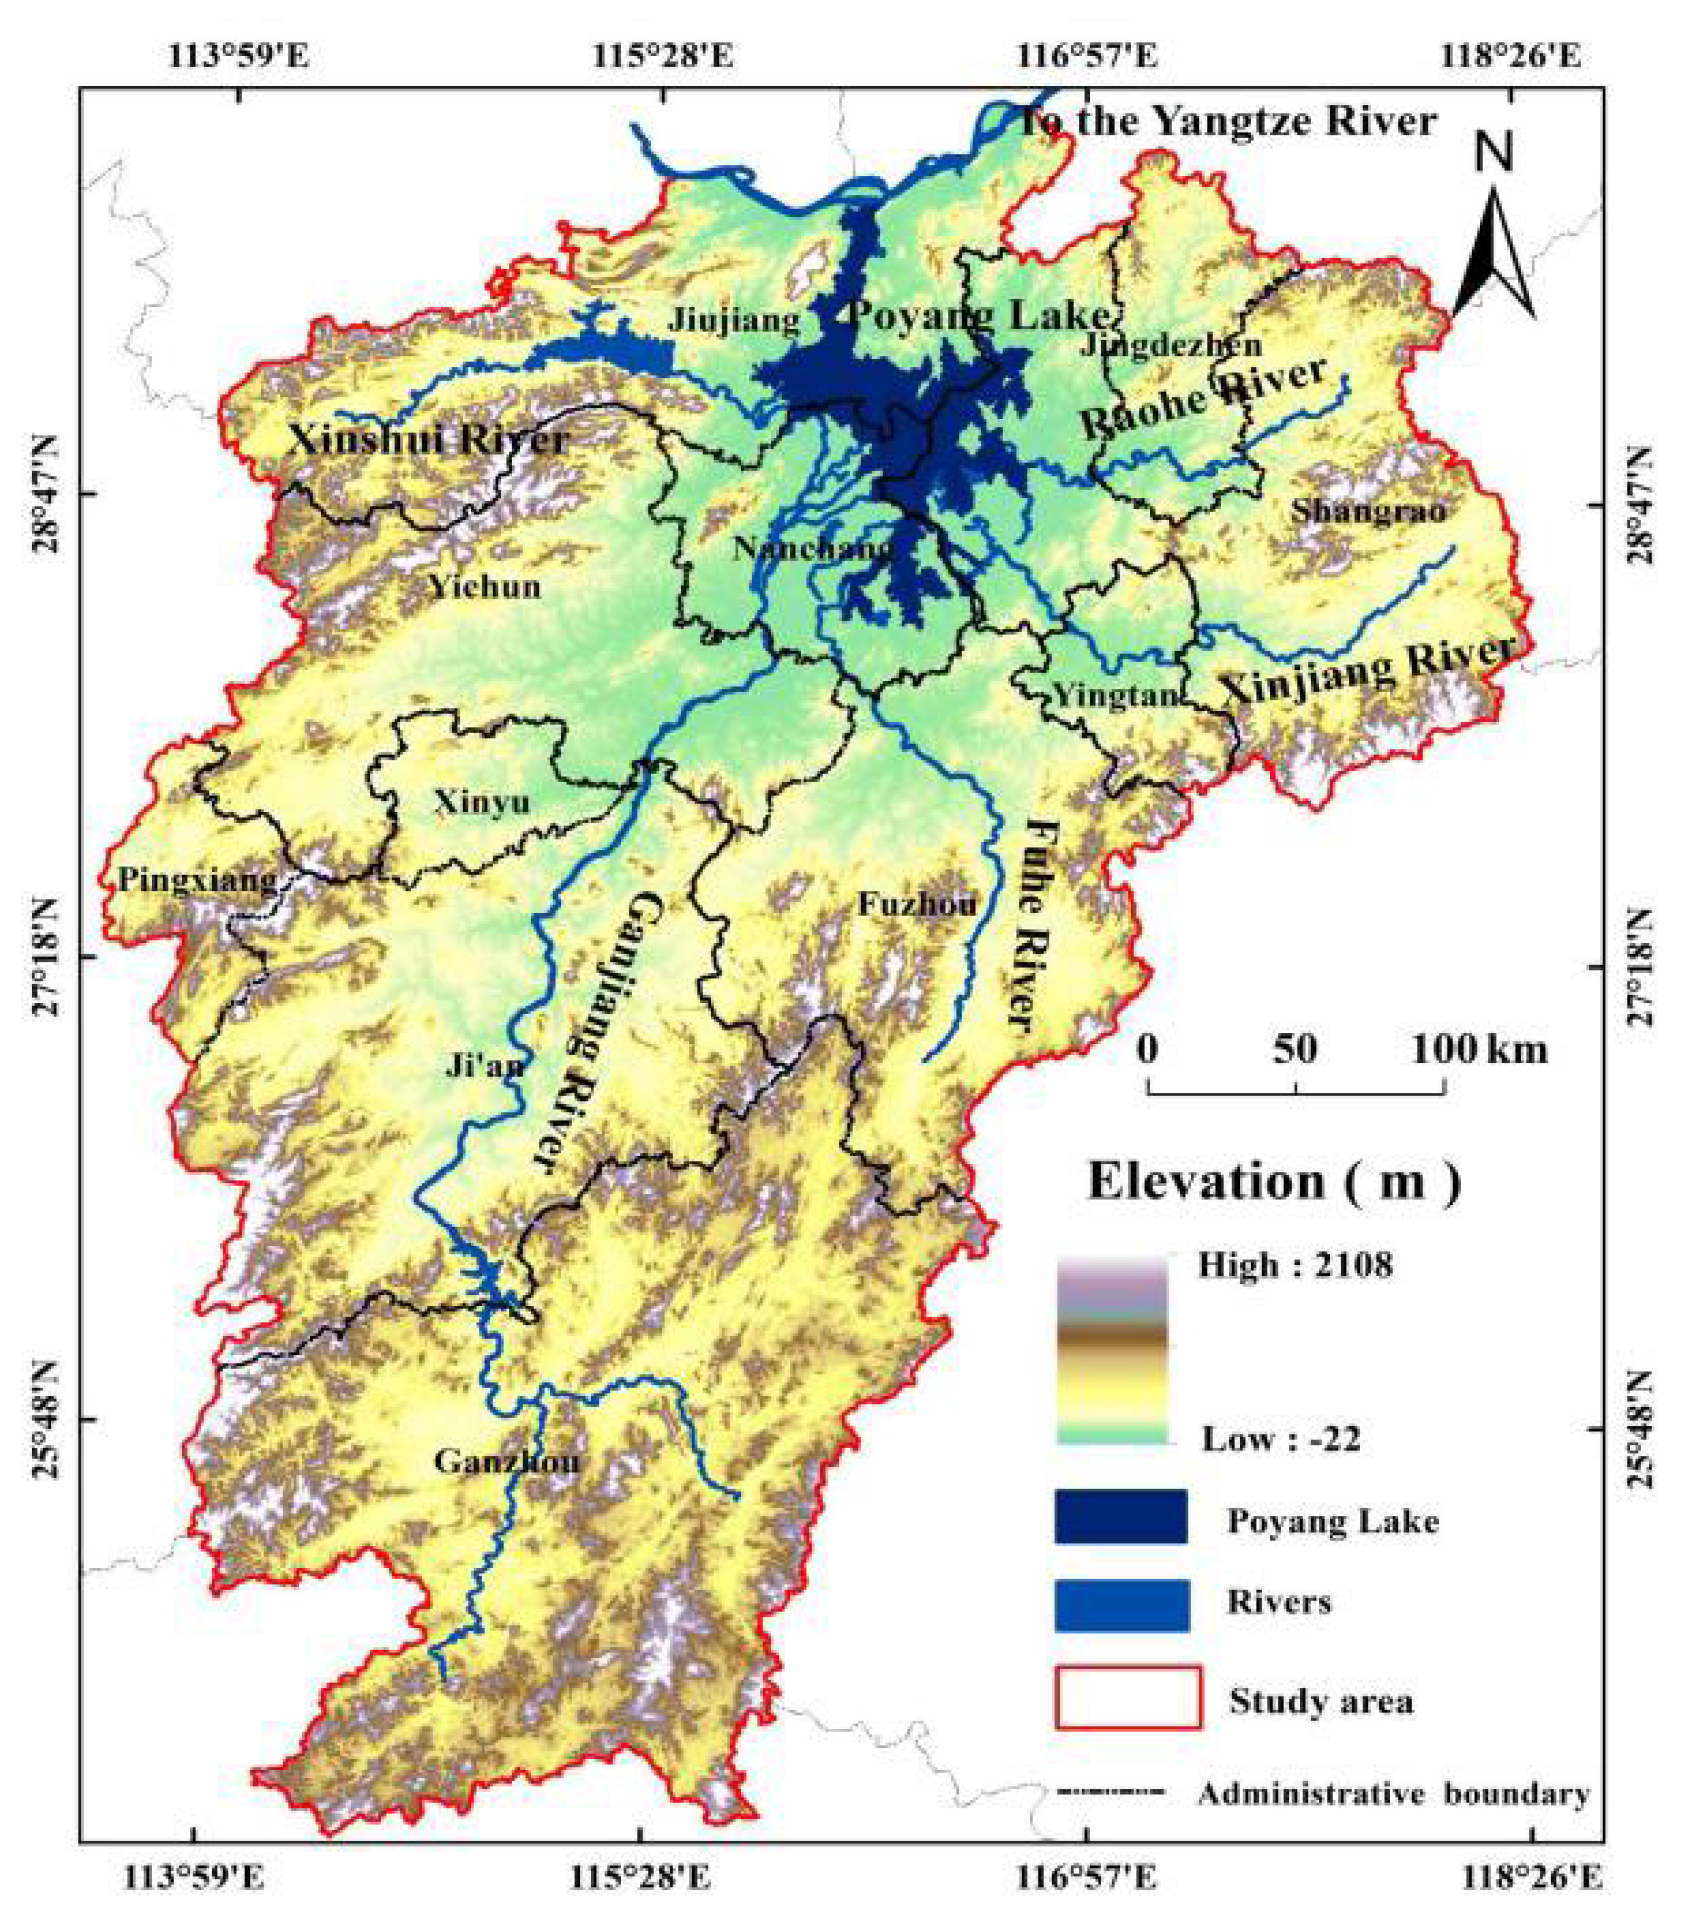
2.1. Research Area

Jiangxi Province (24°29′~30°04′ N, 113°34′~118°28′ E) is located in Central China, and on the southern bank of the junction of the middle and lower reaches of the Yangtze River, covering an area of about 167,000 km2, with 11 prefecture-level cities (Figure 1). It is surrounded by hills and mountains in the east, west and south, while the north part is the basins and valleys centered on the Poyang Lake, the largest freshwater lake of China. The five major rivers, i.e., Ganjiang, Fuhe, Xinjiang, Raohe and Xiushui, flow into Poyang Lake from the east, south and west, and then into the Yangtze River after adjustment and storage of Poyang Lake. It is subtropical monsoon-type climate with wet summer and dry autumn. The annual precipitation is 1341–1943 mm, and the annual average temperature is about 16.3–19.5 °C. By 2020, the GDP was 2.57 trillion yuan, and the population was 0.45 billion with a urbanization rate of about 60%. With the increase of population and the advancement of urbanization, the LULC in Jiangxi Province, like the other fast development region, has undergone dramatic changes, resulting in changes in the LST, and thus the regional thermal environment [48,51].

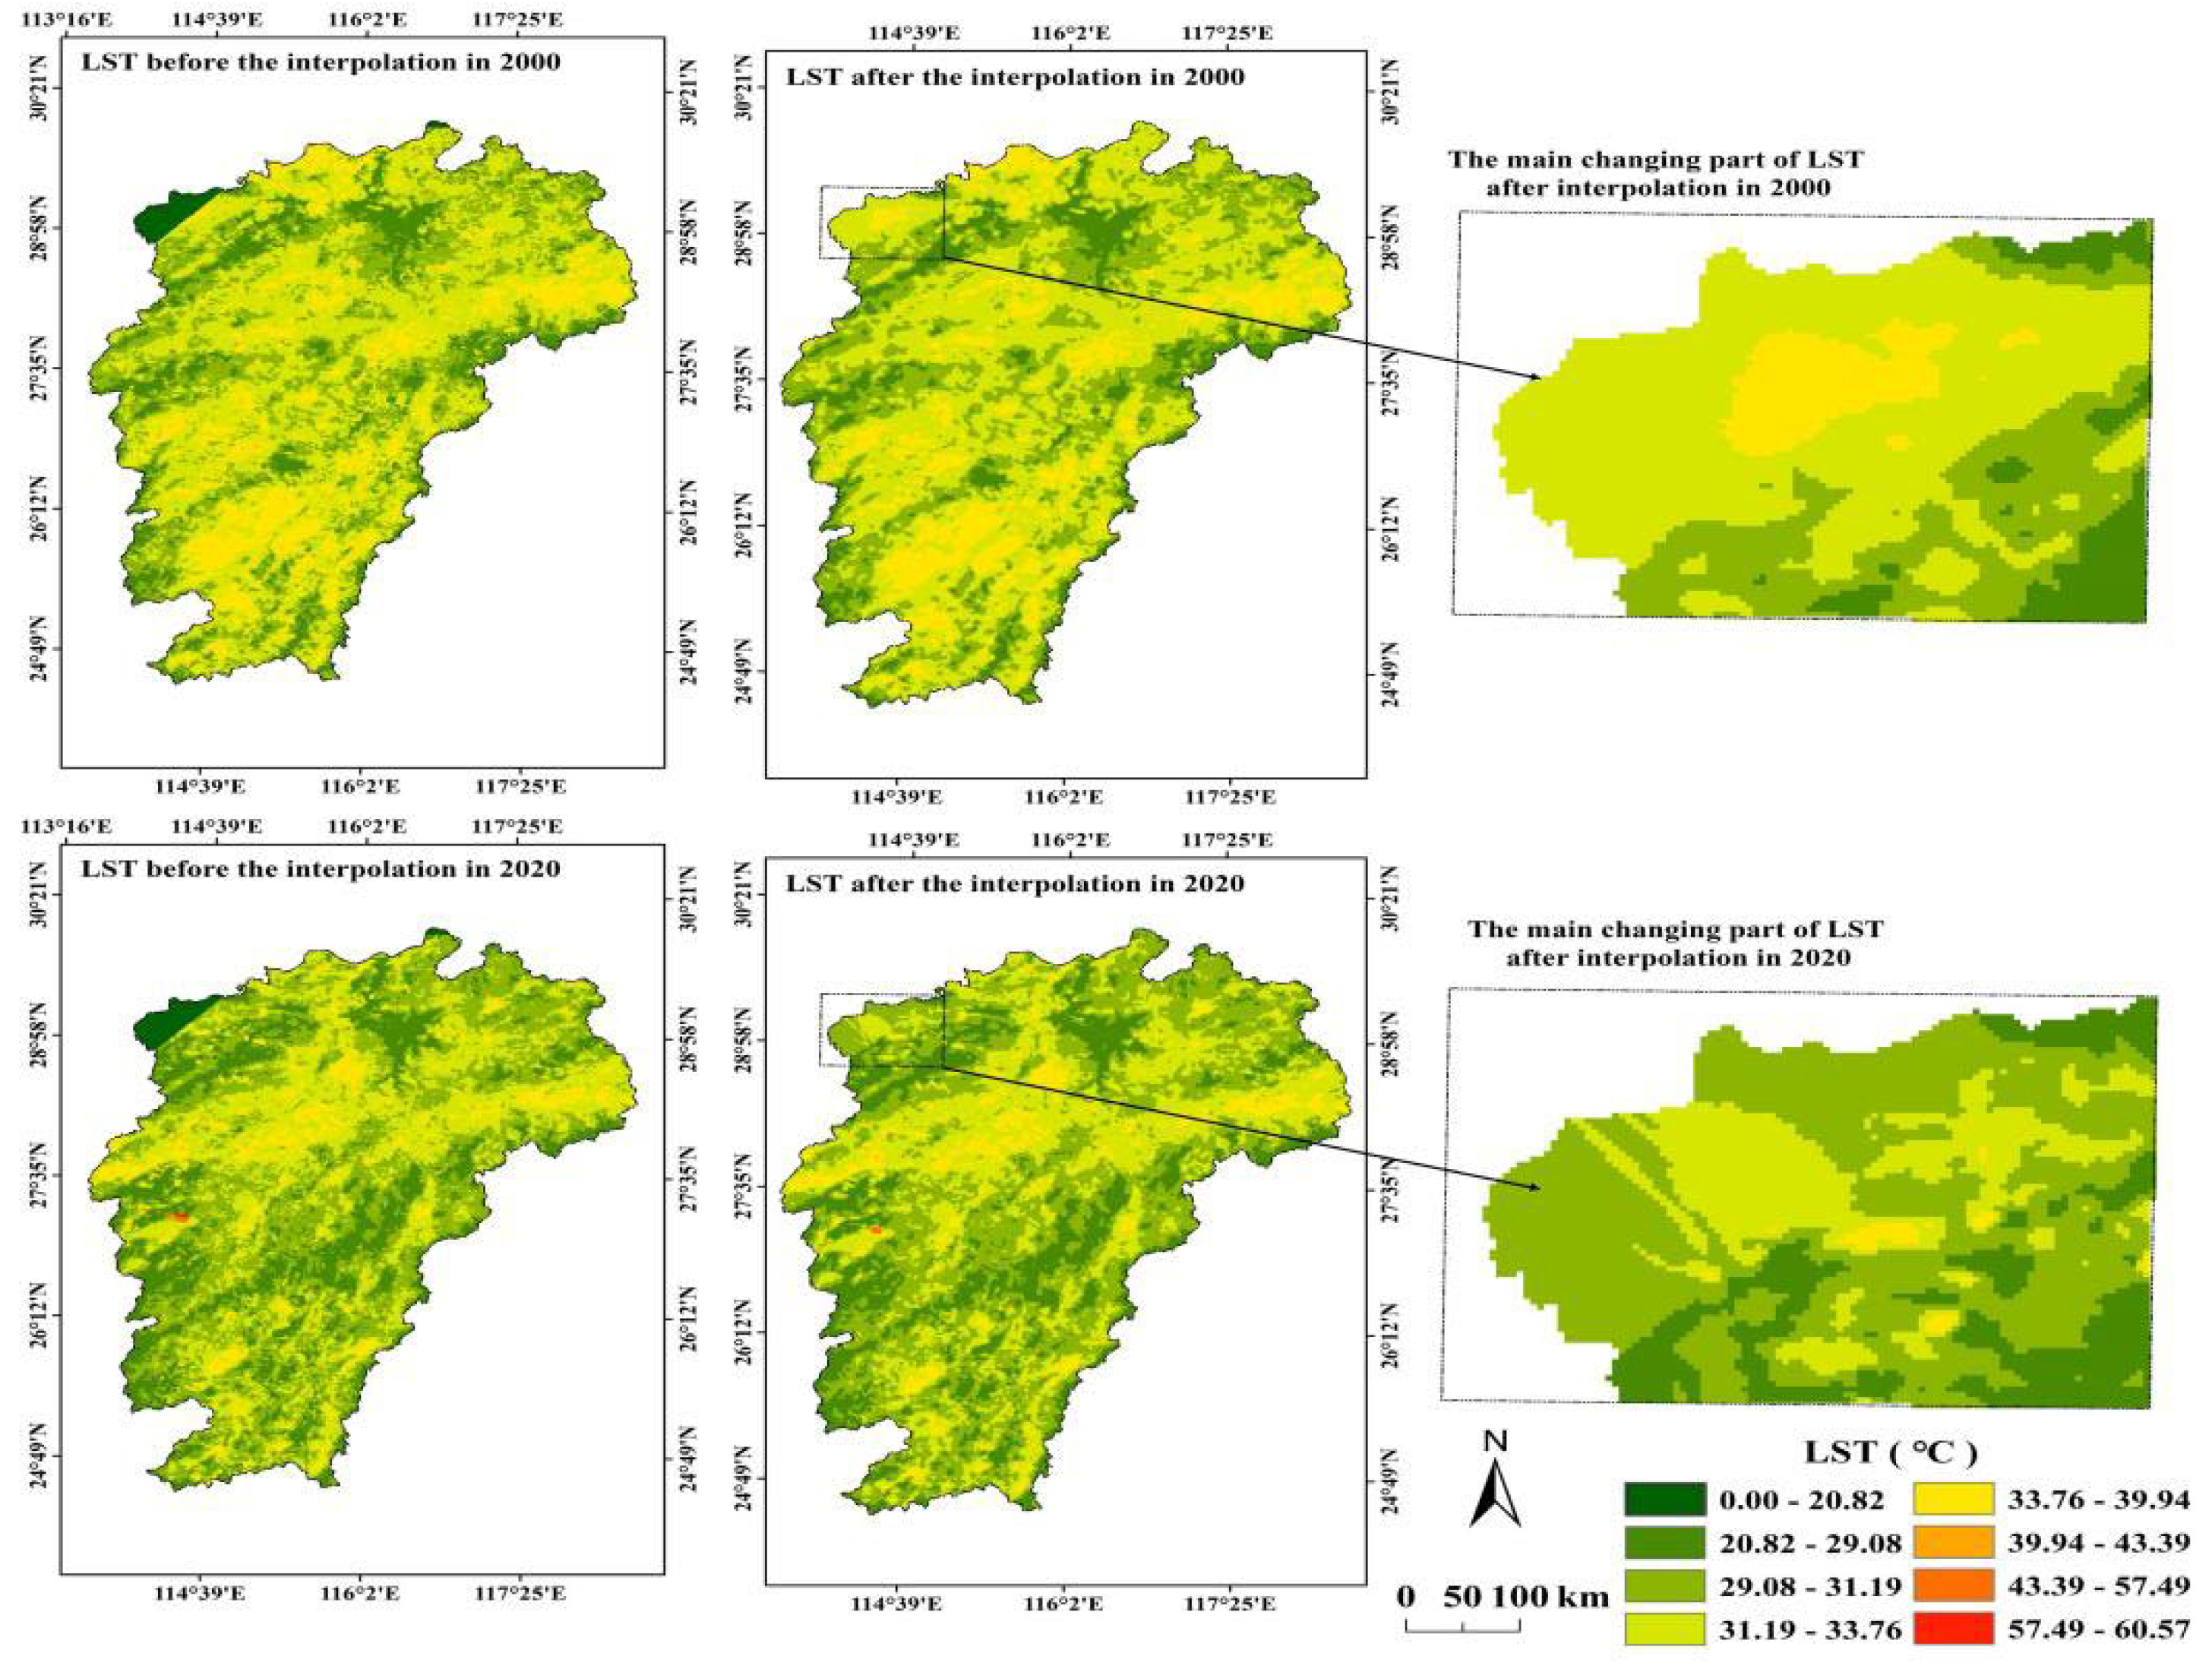
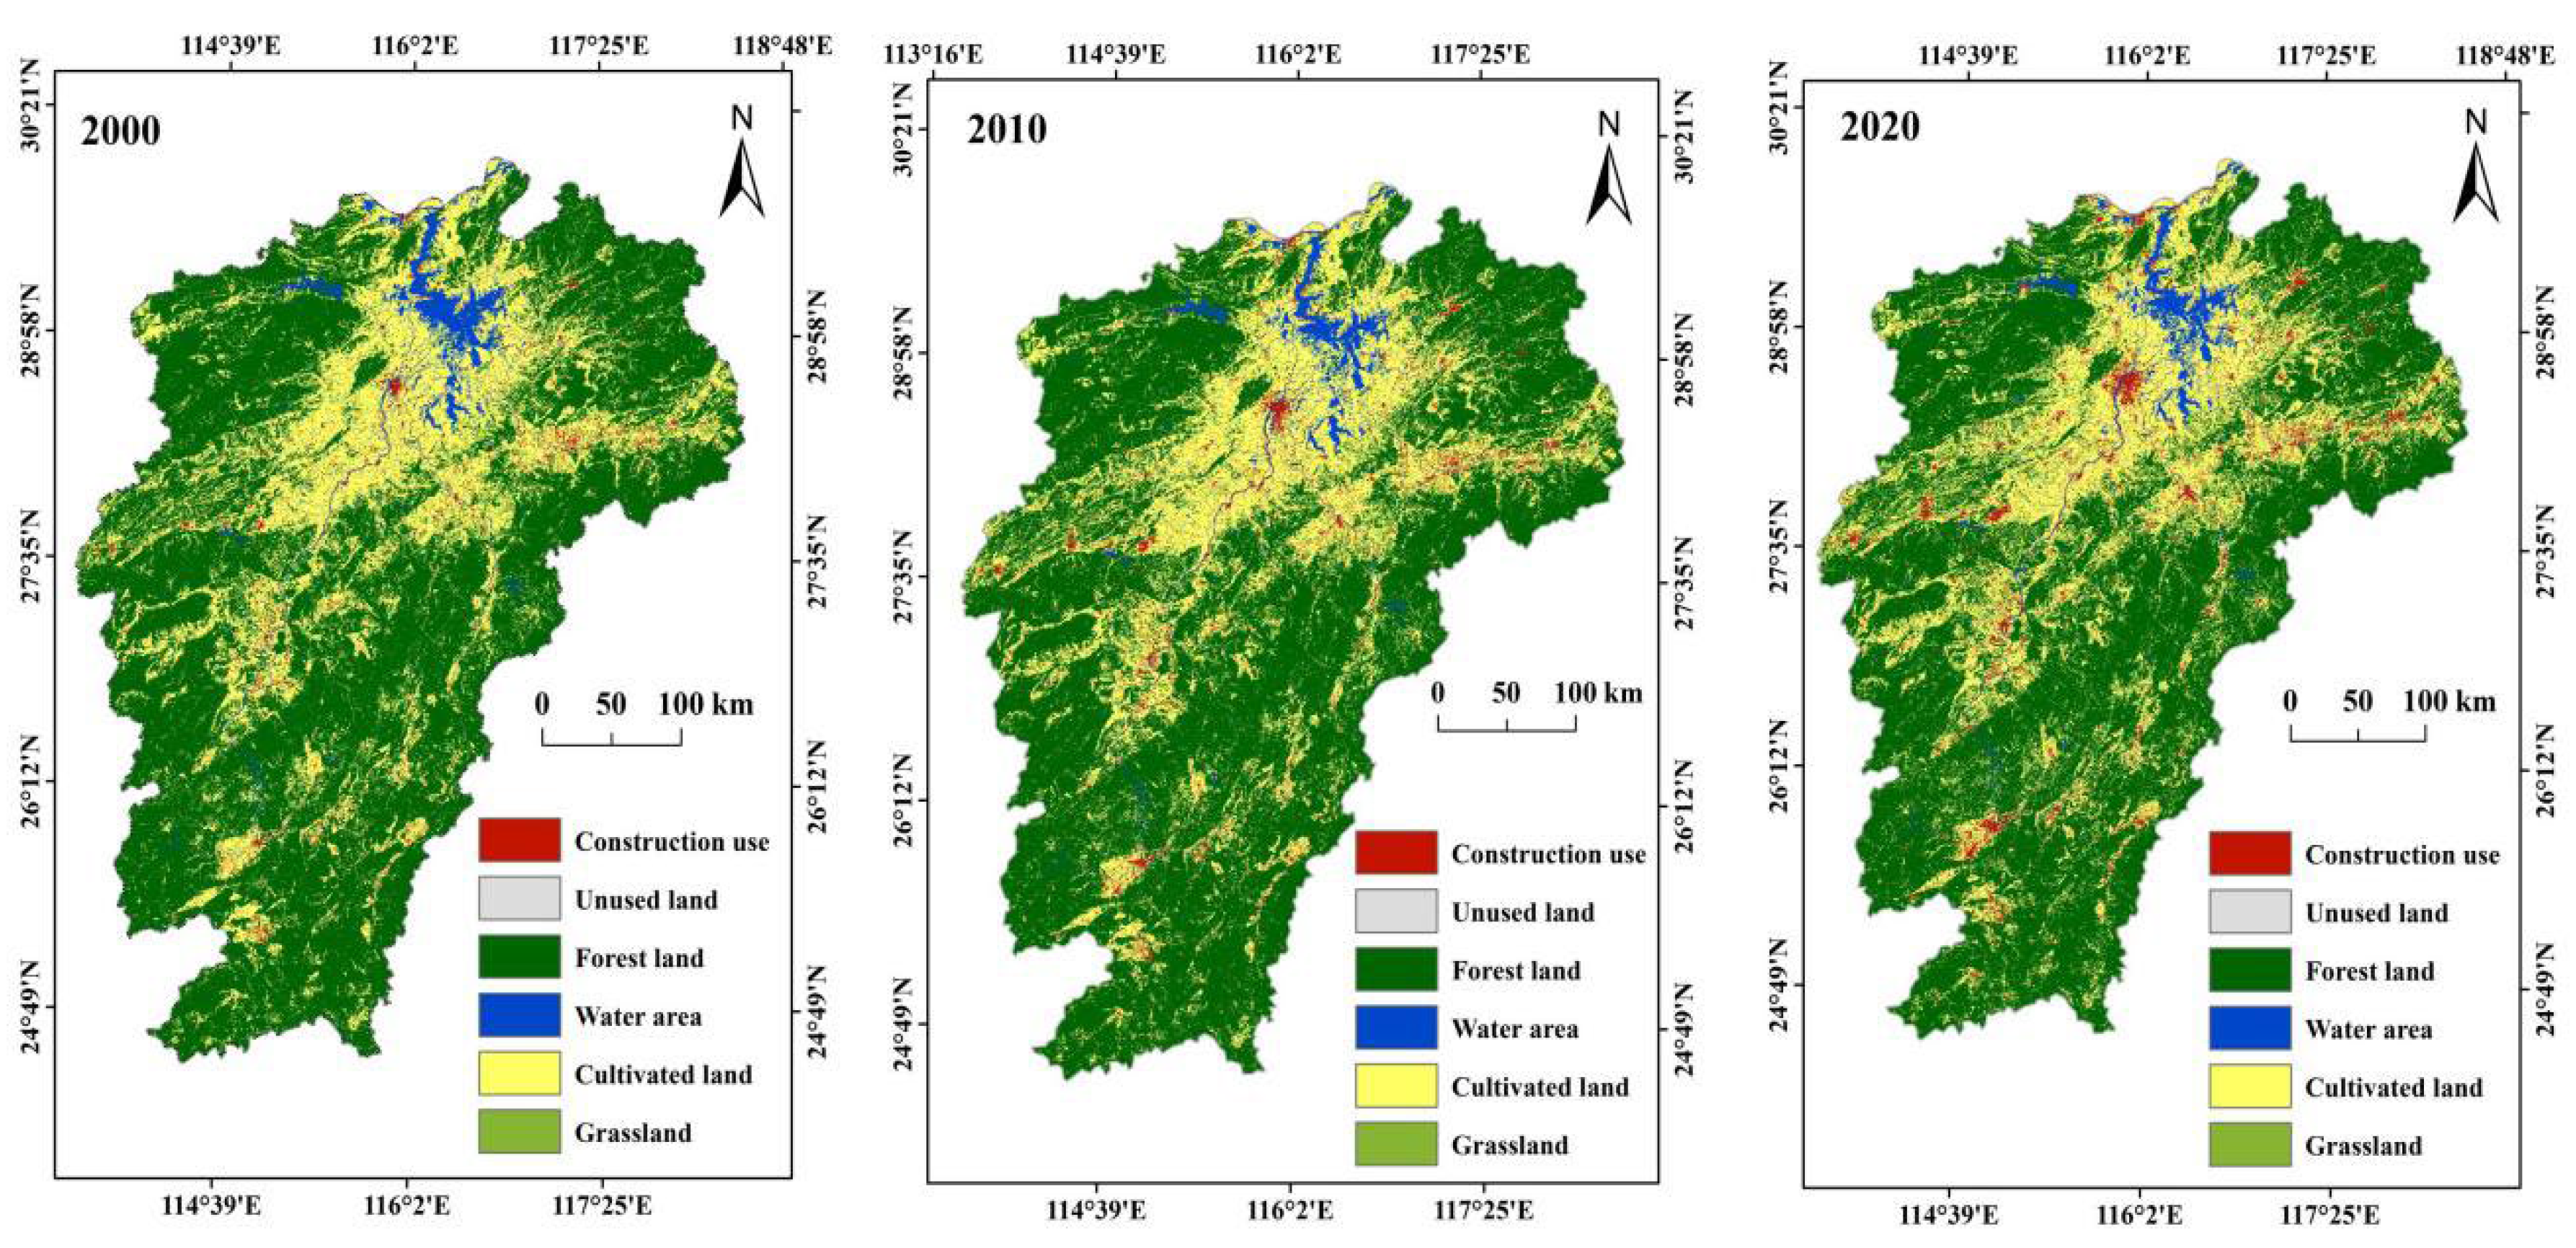
2.2. Data Source and Preprocessing
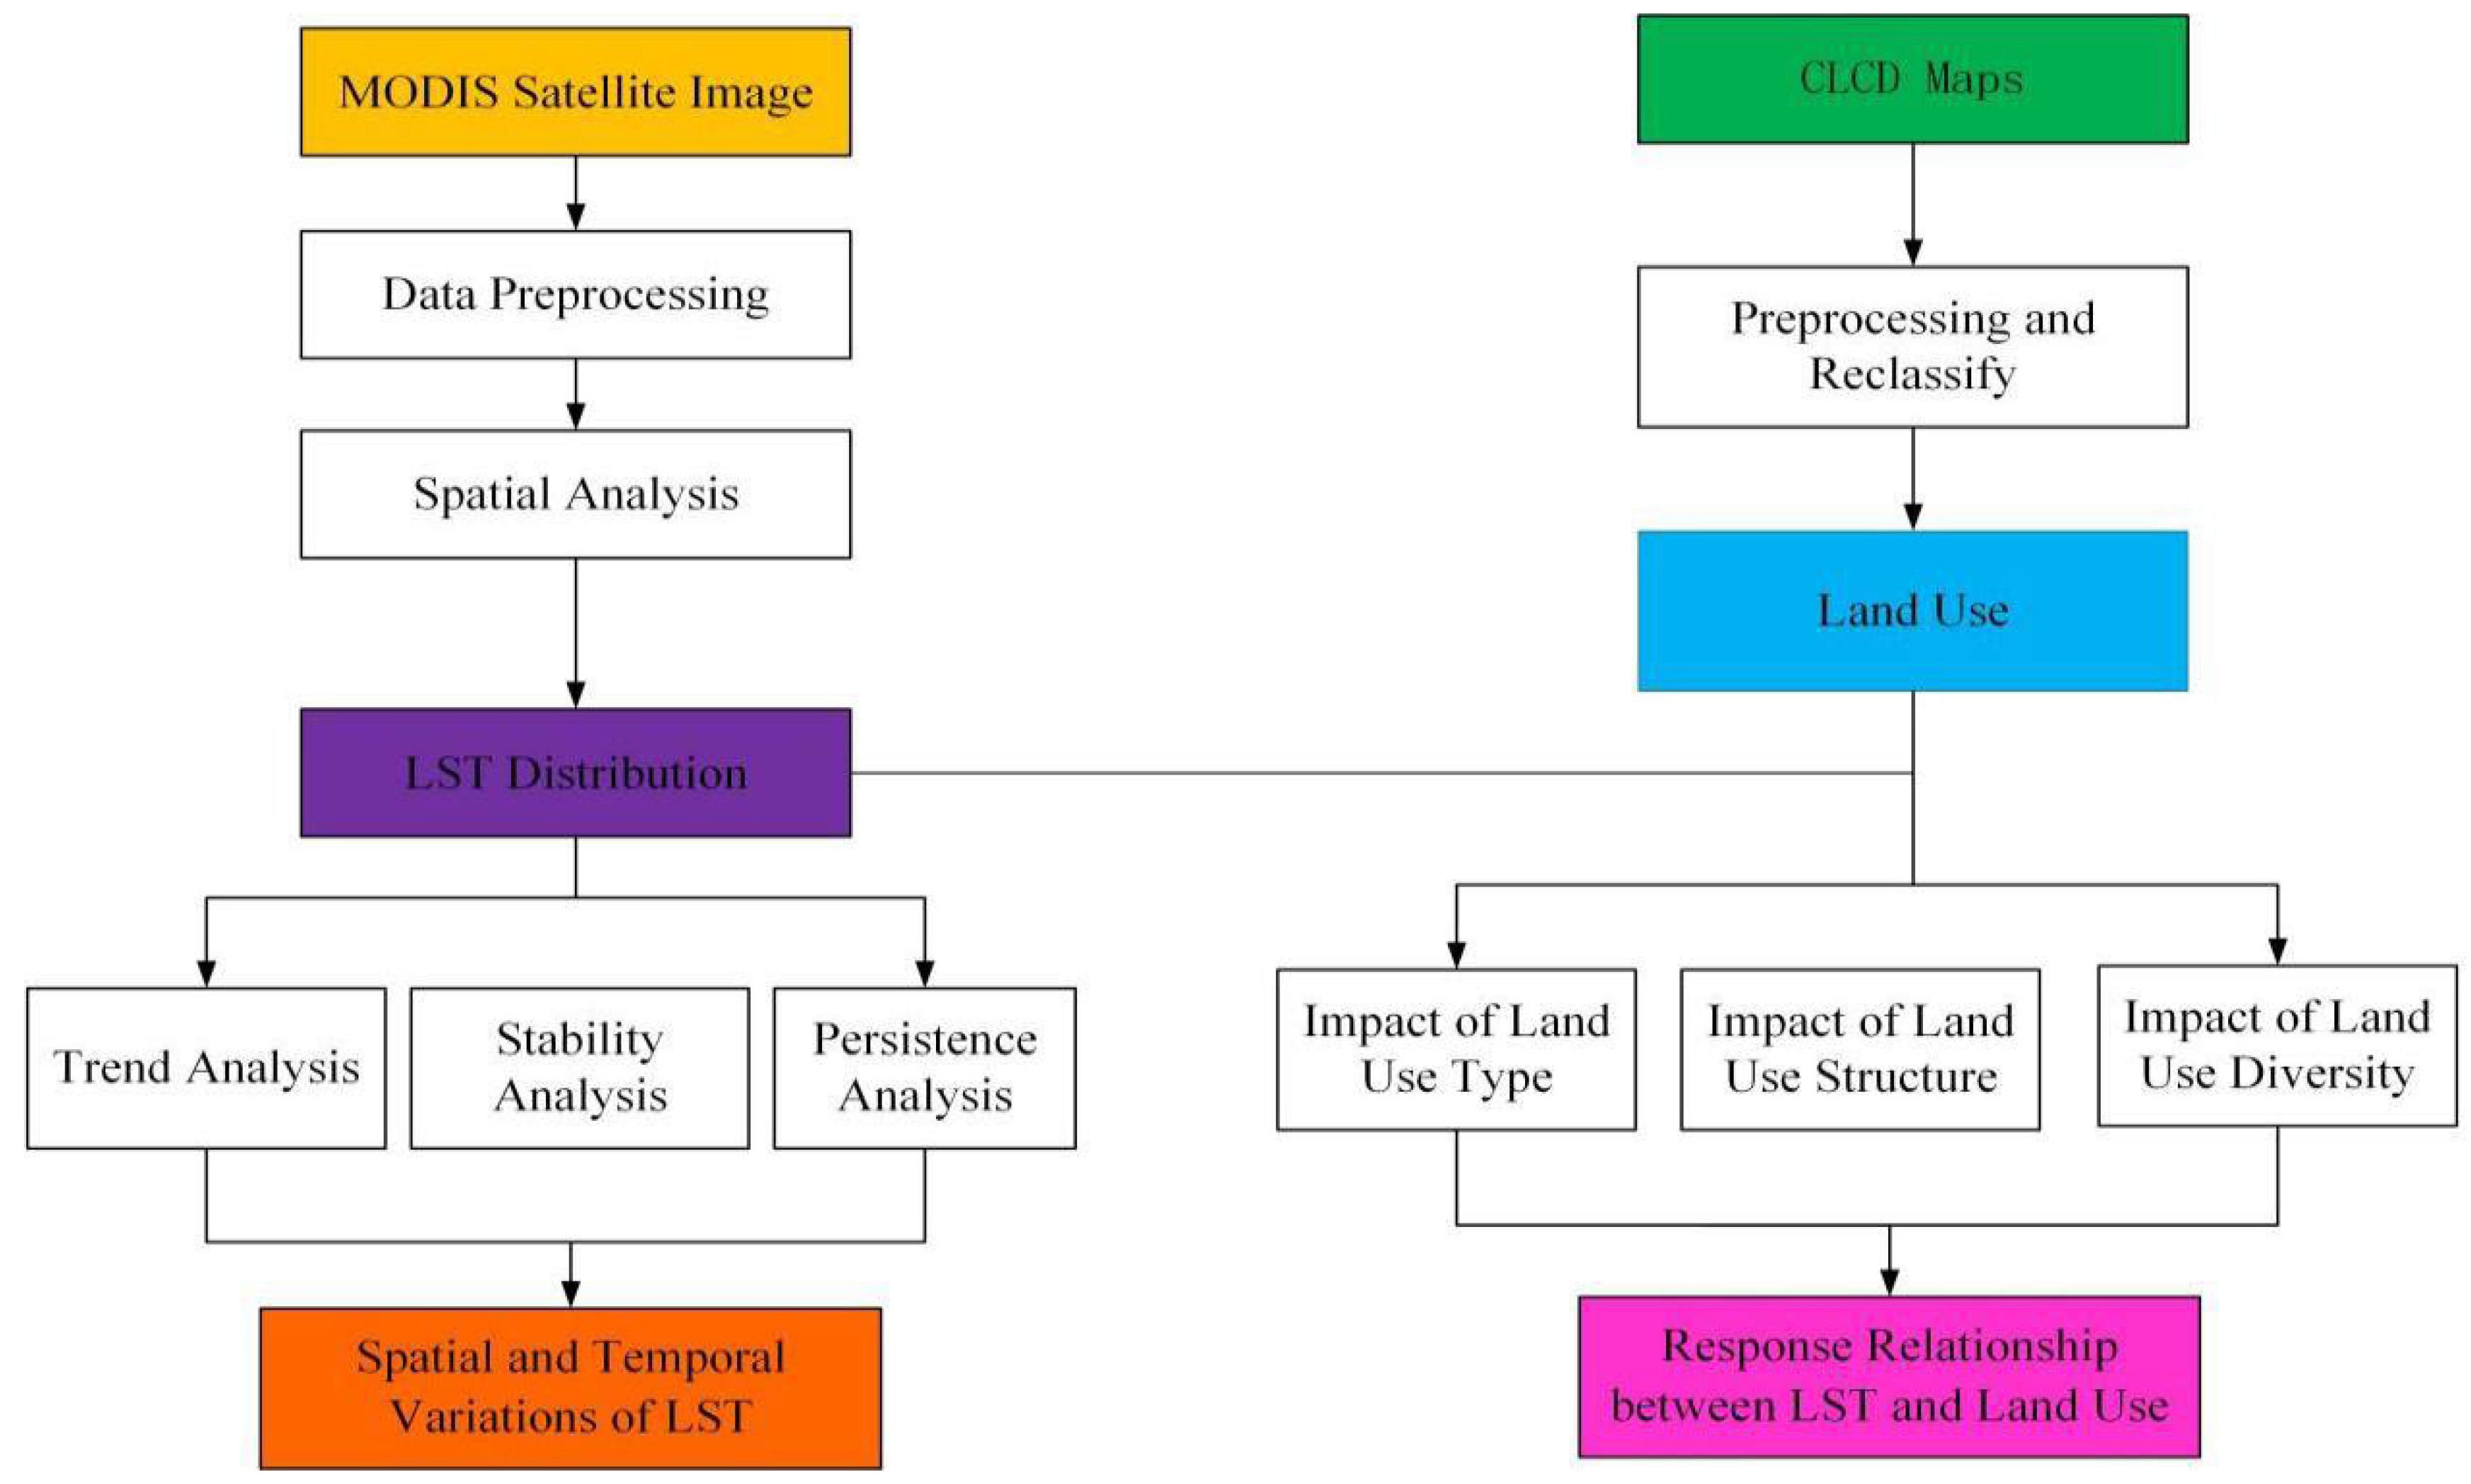
MODIS LST products are widely used in LST research due to their daily global coverage ability [14,29]. At the same time, they have relatively high estimation accuracy (within ±1K in most cases), which is the best choice for characterizing the spatiotemporal variation on LST [52]. MODIS/Terra global LST 8-day L3 (MOD11A2) from January 2000 to December 2020 was used in the present investigation to obtain the LST (daytime) in Jiangxi Province, China. The data were downloaded through the National Aeronautics and Space Administration (NASA) (https://ladsweb.modaps.eosdis.nasa.gov/search/order/3/MOD11A2--61/2000-01-01.2020-12-31/ accessed on 5 June 2022), with a spatial resolution of 1 km, including LST_Day_1km, LST_Night_1km, QC_Day and QC_Night, etc. Firstly, mosaicking, reprojection and resampling of LST_Day_1km were performed using the MODIS Reprojection Tool (MRT) to obtain monthly-scale LST data. Secondly, the monthly-scale LST was cropped, and format was converted using ENVI5.3 to obtain the monthly-scale LST of the study area. Finally, the annual LST were obtained by synthesizing the maximum value of the monthly-scale LST in the study area, and kriging interpolation was performed on the images with missing values using ArcGIS10.2. Meanwhile, 1000 random samples were selected, and the correlation coefficient (R) [53] and the root mean square error (RMSE) [54] were used to test the accuracy of the interpolated LST values (Table 1). By setting different parameters of kriging interpolation, the interpolated LST with the optimal accuracy of more than 93.77% was selected as the basic data for subsequent research (Figure 2). The selected LST_Day_1km sub-dataset were performed radiometric calibration and converted to LST [55,56]. Its formula is as follows [57]:
Ts = DN × 0.02 − 273.15
where Ts represents the land surface temperature, and the unit is °C; DN represents the brightness value of the data product pixel. It was multiplied by 0.02 to get the Kelvin temperature, and the unit is K.
In addition to the LST, the Chinese land cover dataset products (CLCD) [58] from 2000 to 2020 were downloaded in order to study the impacts of LULC on LST. It covers nine major land types, including cropland, forest, shrub, grassland, water, snow/ice, barren, impervious and wetland, with a spatial resolution of 30m. Since the classification system of this data was different from the “Present Situation of Land Use Classification (GB/T 2110–2017) ” in China, the LULC data in the study area are re-divided into six types of land use, including cultivated land (original cropland), forest land (original forest and shrub), grassland (original grassland), construction land (original impervious), water area (original water) and unused land (original snow/ice, barren and wetland) (Figure 3).
Other data used in this study included the Digital Elevation Model (DEM) data, downloading from the geospatial data cloud (http://www.gscloud.cn/search accessed on 5 June 2022) and the administrative boundary data, obtaining from the Jiangxi Department of Natural Resources.

2.3. Methods

The research program is shown in Figure 4. Firstly, the MOD11A2 LST products were preprocessed by ArcGIS10.2, ENVI5.3 and MRT tools. Secondly, based on the LST of Jiangxi Province from 2000 to 2020, Theil-Sen + Mann-Kendall, coefficient of variation (CV) and Hurst index were used to analyze the characteristics of LST trend, stability and persistence. Finally, considering land use is a key factor affecting LST, the contribution index (CI) and diversity index were utilized to analyze the impact of land use on LST. The main methods of this study were introduced as follows:

2.3.1. Theil-Sen + Mann-Kendall Trend Analysis

Theil-Sen’s Slope estimator, also known as Sen’s slope estimator, is neither affected by abnormal values nor by specific distribution and has good ability to avoid measurement error or discrete data [59,60,61]. It can simulate the change trend on pixel-wise level. Moreover, through the spatial variation characteristics of pixel-wise, the evolution law of LST under a certain time series is comprehensively reflected [32]. Mann-Kendall test is a nonparametric statistical test method, which is often used to diagnose monotonic trends of long time series climatic, environmental, and hydrological data [12,62,63]. It does not require samples to obey a certain distribution and is not disturbed by a few outliers. The LST trend was evaluated using the Mann-Kendall test, which can more realistically reflect the spatial variation characteristics of the LST [16]. Therefore, the magnitude of trend in annual LST time series is determined by using Theil-Sen’s Slope estimator and the LST trends variation in time series is evaluated using the Mann-Kendall test in this study.

2.3.2. Coefficient of Variation Analysis

The coefficient of variation (CV) is the ratio of the standard deviation to the mean, also known as the coefficient of dispersion, which is a mathematical indicator that measures the degree of dispersion between observations and the mean [64]. Its expression is as follows:
C V = 1 L S T ¯ 1 n 1 i = 1 n ( L S T i L S T ¯ ) 2
where, CV refers to the coefficient of variation of the LST value, LSTi is the LST in year i, L S T ¯ is the mean LST, and LST is the inter-annual LST of Jiangxi Province from 2000 to 2020. When the CV value is larger, the LST is more dispersed, and the inter-annual variation is larger. When the CV value is smaller, the LST is more stable, and the inter-annual variation is basically stable.

2.3.3. Hurst Index Analysis

The Hurst index (H) has been applied for many disciplines, such as hydrology [57], economics [65] and environmental science [66], especially in the study of surface thermal environment changes [67]. It is a nonlinear time series analysis method, also known as the R/S analysis, which is often used to analyze the fractal characteristics and long-term memory process of long-term series. Previous studies have shown that the complete randomness and future persistence of long-time series LST in the study area can be diagnosed by the H [32,67]. The H ranges from 0 to 1. When the H is equal to 0.5, it indicates that the LST time series is a random series, with no persistence and no long-term correlation. When the H is less than 1 and greater than 0.5, it shows that the changes before and after the LST is positively correlated, indicating that the LST time series are persistent, and the future trend is consistent with the current LST time series trend. When H is less than 0.5 and greater than 0, it shows that the changes before and after the LST is negatively correlated, suggesting that the future trend is opposite to the current LST time series trend or may remain basically stable, indicating the uncertainty of future trend changes.

2.3.4. Contribution Index Analysis

Contribution Index (CI) was used to quantify the contribution of different land use types to the temporal and spatial variation of LST in the study area for 20 years [68]. Its expression is as follows:
C I = ( L S T i L S T A ) × S i / S
where, CI is the contribution index, LSTi is the LST mean of the i-th land use type, LSTA is the LST mean of the whole study area, Si is the area of the i-land use type, and S is the area of the whole study area.

2.3.5. Diversity Index Analysis

In order to comprehensively measure the pattern characteristics of the spatial distribution and combination of land use in Jiangxi Province, China, the Shannon’s diversity index (SHDI) of landscape ecology was introduced to represent the spatial pattern of land types, that is, the SHDI of land use [69]. It is a comprehensive reflection of land use type richness and combination complexity. Its expression is as follows:
S H D I = i = 1 m P i × log 2 P i
where, SHDI is the Shannon’s diversity index, Pi is the area proportion of the i-th land use type, and m is the number of all land types in the counted county. All statistical analyses were performed in R4.1.3, ArcGIS10.2 and ENVI5.3.

3. Results

3.1. The Spatiotemporal Evolution of Pixel-wise LST

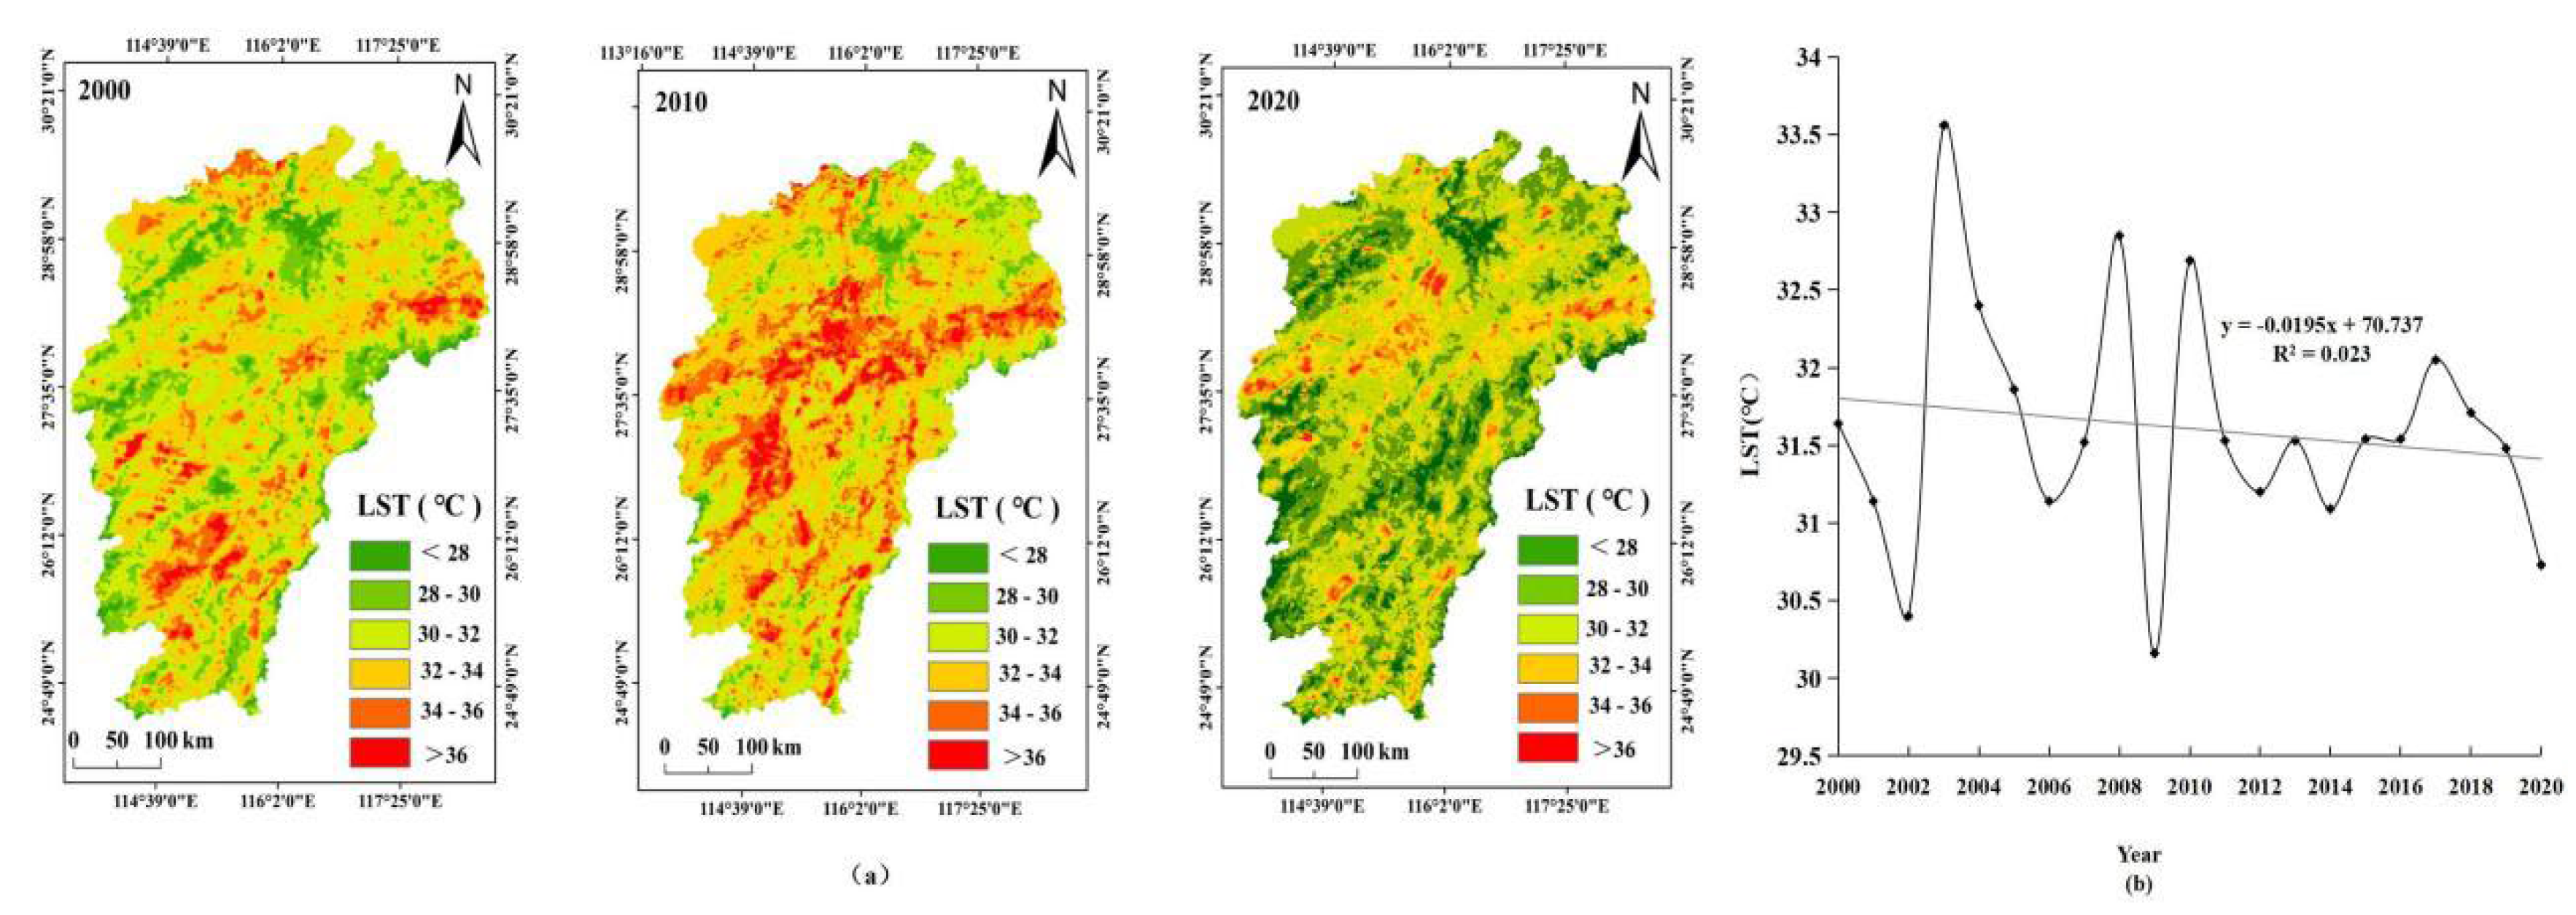
3.1.1. Variation Characteristics

It can be seen that from 2000 to 2020, the overall spatial distribution of LST was generally high in the eastern, central, southern and western regions, while low in the southeast, northwest and northern regions in Jiangxi Province (Figure 5a). The high-value areas (LST > 36 °C) were mainly distributed in the alluvial plain area of Poyang Lake, the valley terraces of the middle reaches of Ganfu, the middle-low mountain and hilly areas of the eastern and central areas of southwestern Jiangxi. These regions have flat terrain, obvious urban expansion, large human disturbance, and prominent social and economic development. The low-value areas (LST < 28 °C) were mainly distributed in the water area of Poyang Lake and the mountainous and hilly areas. These areas have wide water coverage, dense natural forests and shrubs, weak human activities with small urban areas. Moreover, it can be seen that from 2000 to 2020, the LST showed a decreasing trend as a whole, with the lowest value of 30.16 °C in 2009 and the highest value of 33.56 °C in 2003 (Figure 5b). The trend of LST could be roughly divided into four stages: the first stage was a rising period with rapid up and down fluctuations (from 2000 to 2003), the second stage was a declining period with the high up and down fluctuations (from 2003 to 2009), and the third stage was a rising period with stable up and down fluctuations (from 2009 to 2017), and the fourth stage was a period of rapid decline (from 2017 to 2020). Moreover, the reduction rates of LST in four stages were 3.92%, 10.13%, 4.89%, and 4.12%, respectively.

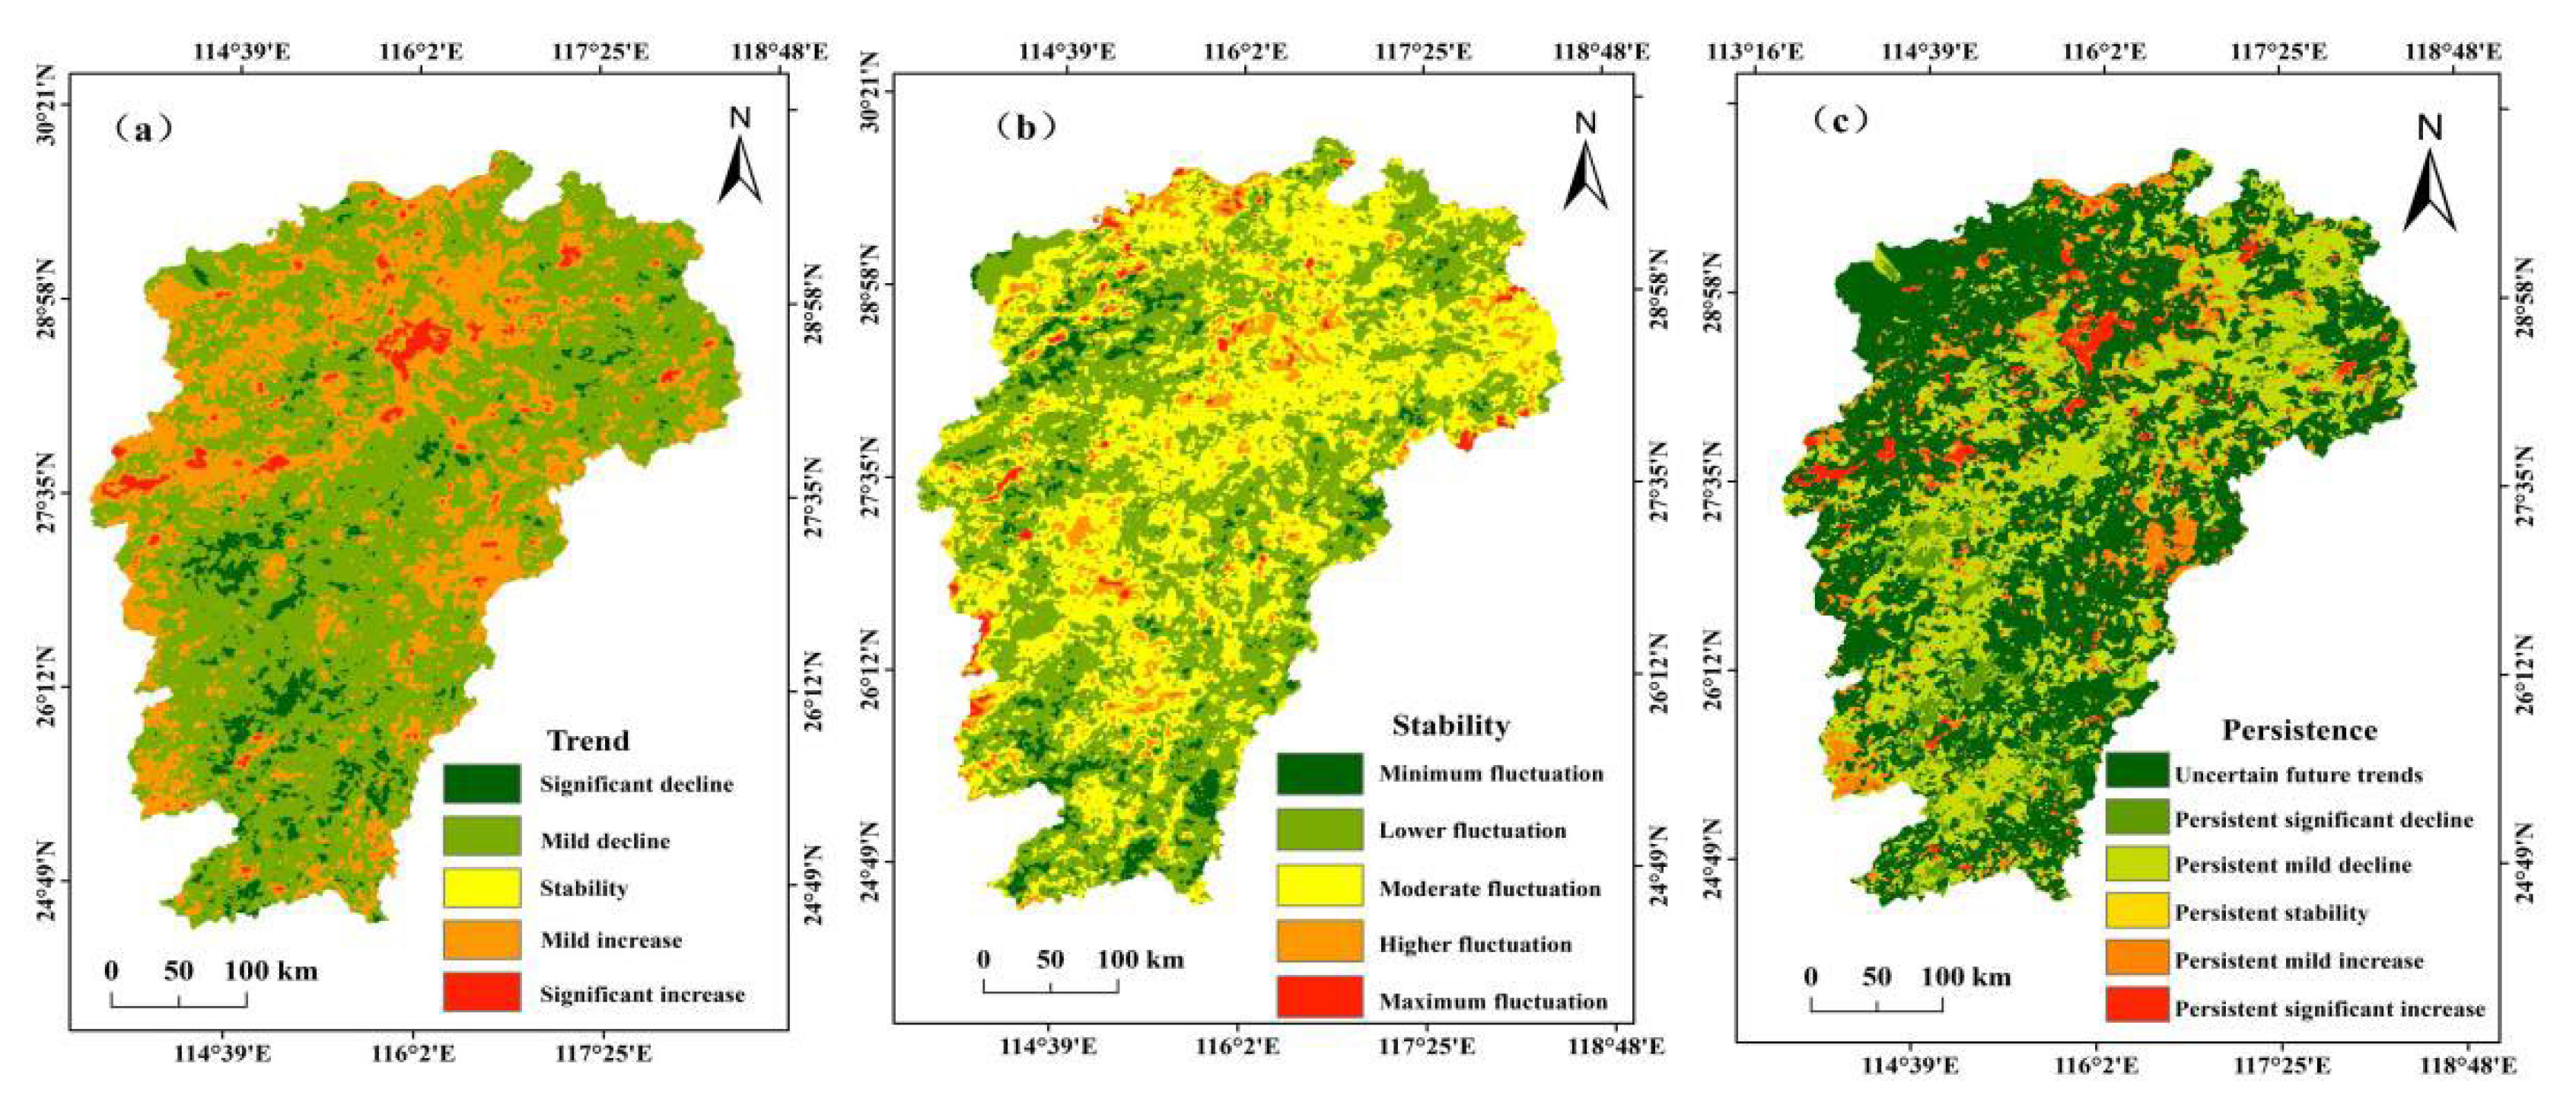
3.1.2. Trend Characteristics

According to Theil-Sen’s Slope estimator and the Mann-Kendall test, the trend characteristics of LST were divided into five categories, and the trend from 2000 to 2020 were spatially displayed (Table 2 and Figure 6a). The significant increase area accounted for 2.14%, mainly distributed in Nanchang City in the center and Pingxiang City in the southwest. The mild increase and stability areas accounted for 29.57%, mainly distributed in the alluvial plain of Poyang Lake, the hilly area in the middle reaches of Ganjiang and Fuhe River, and the middle and low mountains and hilly areas in northwestern Jiangxi. The mild decline area accounted for 62.97%, mostly distributed in the mountainous and hilly areas in the south and northeast. The significant decline areas accounted for 5.32%, which were concentrated in the waters and middle and low mountains and hilly areas of Ji’an City and Ganzhou City in the southwest. Generally speaking, the trend of LST was characterized by "more falling areas than rising areas".

3.1.3. Stability Characteristics

According to the coefficient of variation, the stable characteristics were divided into five categories, and the stable characteristics of the LST from 2000 to 2020 were spatially demonstrated (Table 3 and Figure 6b). The minimum fluctuation and the lower fluctuation accounted for 50.37% of the total area, and the LST change was small, mainly distributed in the alluvial plain of Poyang Lake and the hilly area of southwest Jiangxi. The moderate fluctuation accounted for 41.58% of the total area, scattered throughout the territory in the shape of sporadic and patchy. The higher fluctuation and maximum fluctuation accounted for 8.05% of the total area, concentrated in the urban areas of the center, northwest and southwest where the urbanization process was rapid, i.e., Nanchang City, Jiujiang City, and Yichun City. The stability of LST was characterized by "coexistence of high and low fluctuations, high proportion of medium and low fluctuations with obvious spatial differences".

3.1.4. Persistent Characteristics

According to Theil-Sen’s Slope estimator, the Mann-Kendall test and the Hurst index, the persistent features were divided into six categories, and the persistent features of the LST from 2000 to 2020 were shown spatially (Table 4 and Figure 6c). Persistent significant increase and persistent mild increase accounted for 1.83% and 9.06%, respectively. It was mainly strip-shaped and large patches, concentrated in the central alluvial plain of Poyang Lake and the urban areas in the southwest and southeast of Jiangxi. The percentage of persistent stability was 0.23%. The proportions of persistent mild decline and persistent significant decline were 30.35% and 4.70%, respectively, which were mainly distributed in waters and low mountain and hilly areas in central, southern and northeastern Jiangxi. The proportion of uncertain future trends was 53.83%, mainly distributed in northwestern and southeastern Jiangxi.

3.2. Land Use Impact Analysis

3.2.1. Impact of Land Use Type

From 2000 to 2020, it can be seen from the average LST value and CI of different land use types (Figure 7), that construction land, cultivated land, grassland and unused land were all higher than water area and forest land. The construction land was the highest, the forest land was lower, and the water area was the lowest. This is because the vegetation transpiration in forest land can reduce heat storage, and the water area is easy for heat storage, leading to the rise of LST. The CI of construction land and cultivated land was greater than 0, indicating that the warming effect was significant. The CI of unused land and grassland was close to 0, indicating that there was no heating or cooling effect. The CI of forest land and water area was less than 0, indicating that the cooling effect was significant. The CI of cultivated land was higher than that of construction land, and the CI of forest land was lower than that of water area. In the past 20 years, with the continuous expansion of construction land in Jiangxi Province, the average decline range of LST of each land use type was ranked as grassland, forest, unused land, cultivated land, and construction land. The CI of construction land, water area and cultivated land showed a significant upward trend, while the CI of forest land showed a significant downward trend.

3.2.2. Impact of Land Use Structure

According to the proportion of each land use type in the six LST grades (Figure 8), when the LST was greater than 34 °C, it was mostly construction land, forest land and cultivated land, and when the LST was less than 28 °C, it was mostly forest land and water area. From the low temperature zone (LST less than 28 °C) to the high temperature zone (LST greater than 36 °C), the proportion of cultivated land and construction land increased, while the proportion of forest land and water area decreased. From 2000 to 2020, the proportion of construction land and cultivated land in areas with LST greater than 34 °C increased, and the proportion of forest land and water area decreased, which showed that high-temperature areas gradually transferred from forest land and water area to cultivated land and construction land, especially construction land.
Then, the area proportion of each land use type and LST mean values of each county were calculated. By area ratio interval of 10%, the average value of LST of different land use types under each area ratio was calculated to analyze the influence of area ratios on LST (Figure 9). It can be seen that when the area ratio is less than 10 %, the LST difference among different land use types was small except for cultivated land and forest land, while when the area ratio was greater than 10 %, the LST difference among other land use types begins to be obvious except for grassland and unused land. With the increase of area ratio, the mean LST of construction land and cultivated land increased, while the mean LST of forest land and water area decreased. From the perspective of time series, when the area ratio was less than 10 %, the absolute value of LST change amplitude of different land use types was ranked as forest land, construction land, water area, unused land, grassland, and cultivated land. With the increase of the area ratio, the LST of cultivated land increased slightly, the LST of construction land increased significantly, and the LST of forest land and water area decreased. It showed that with the acceleration of urbanization, forest land and cultivated land are rapidly transferred to construction land, resulting in a significant warming effect of construction land.

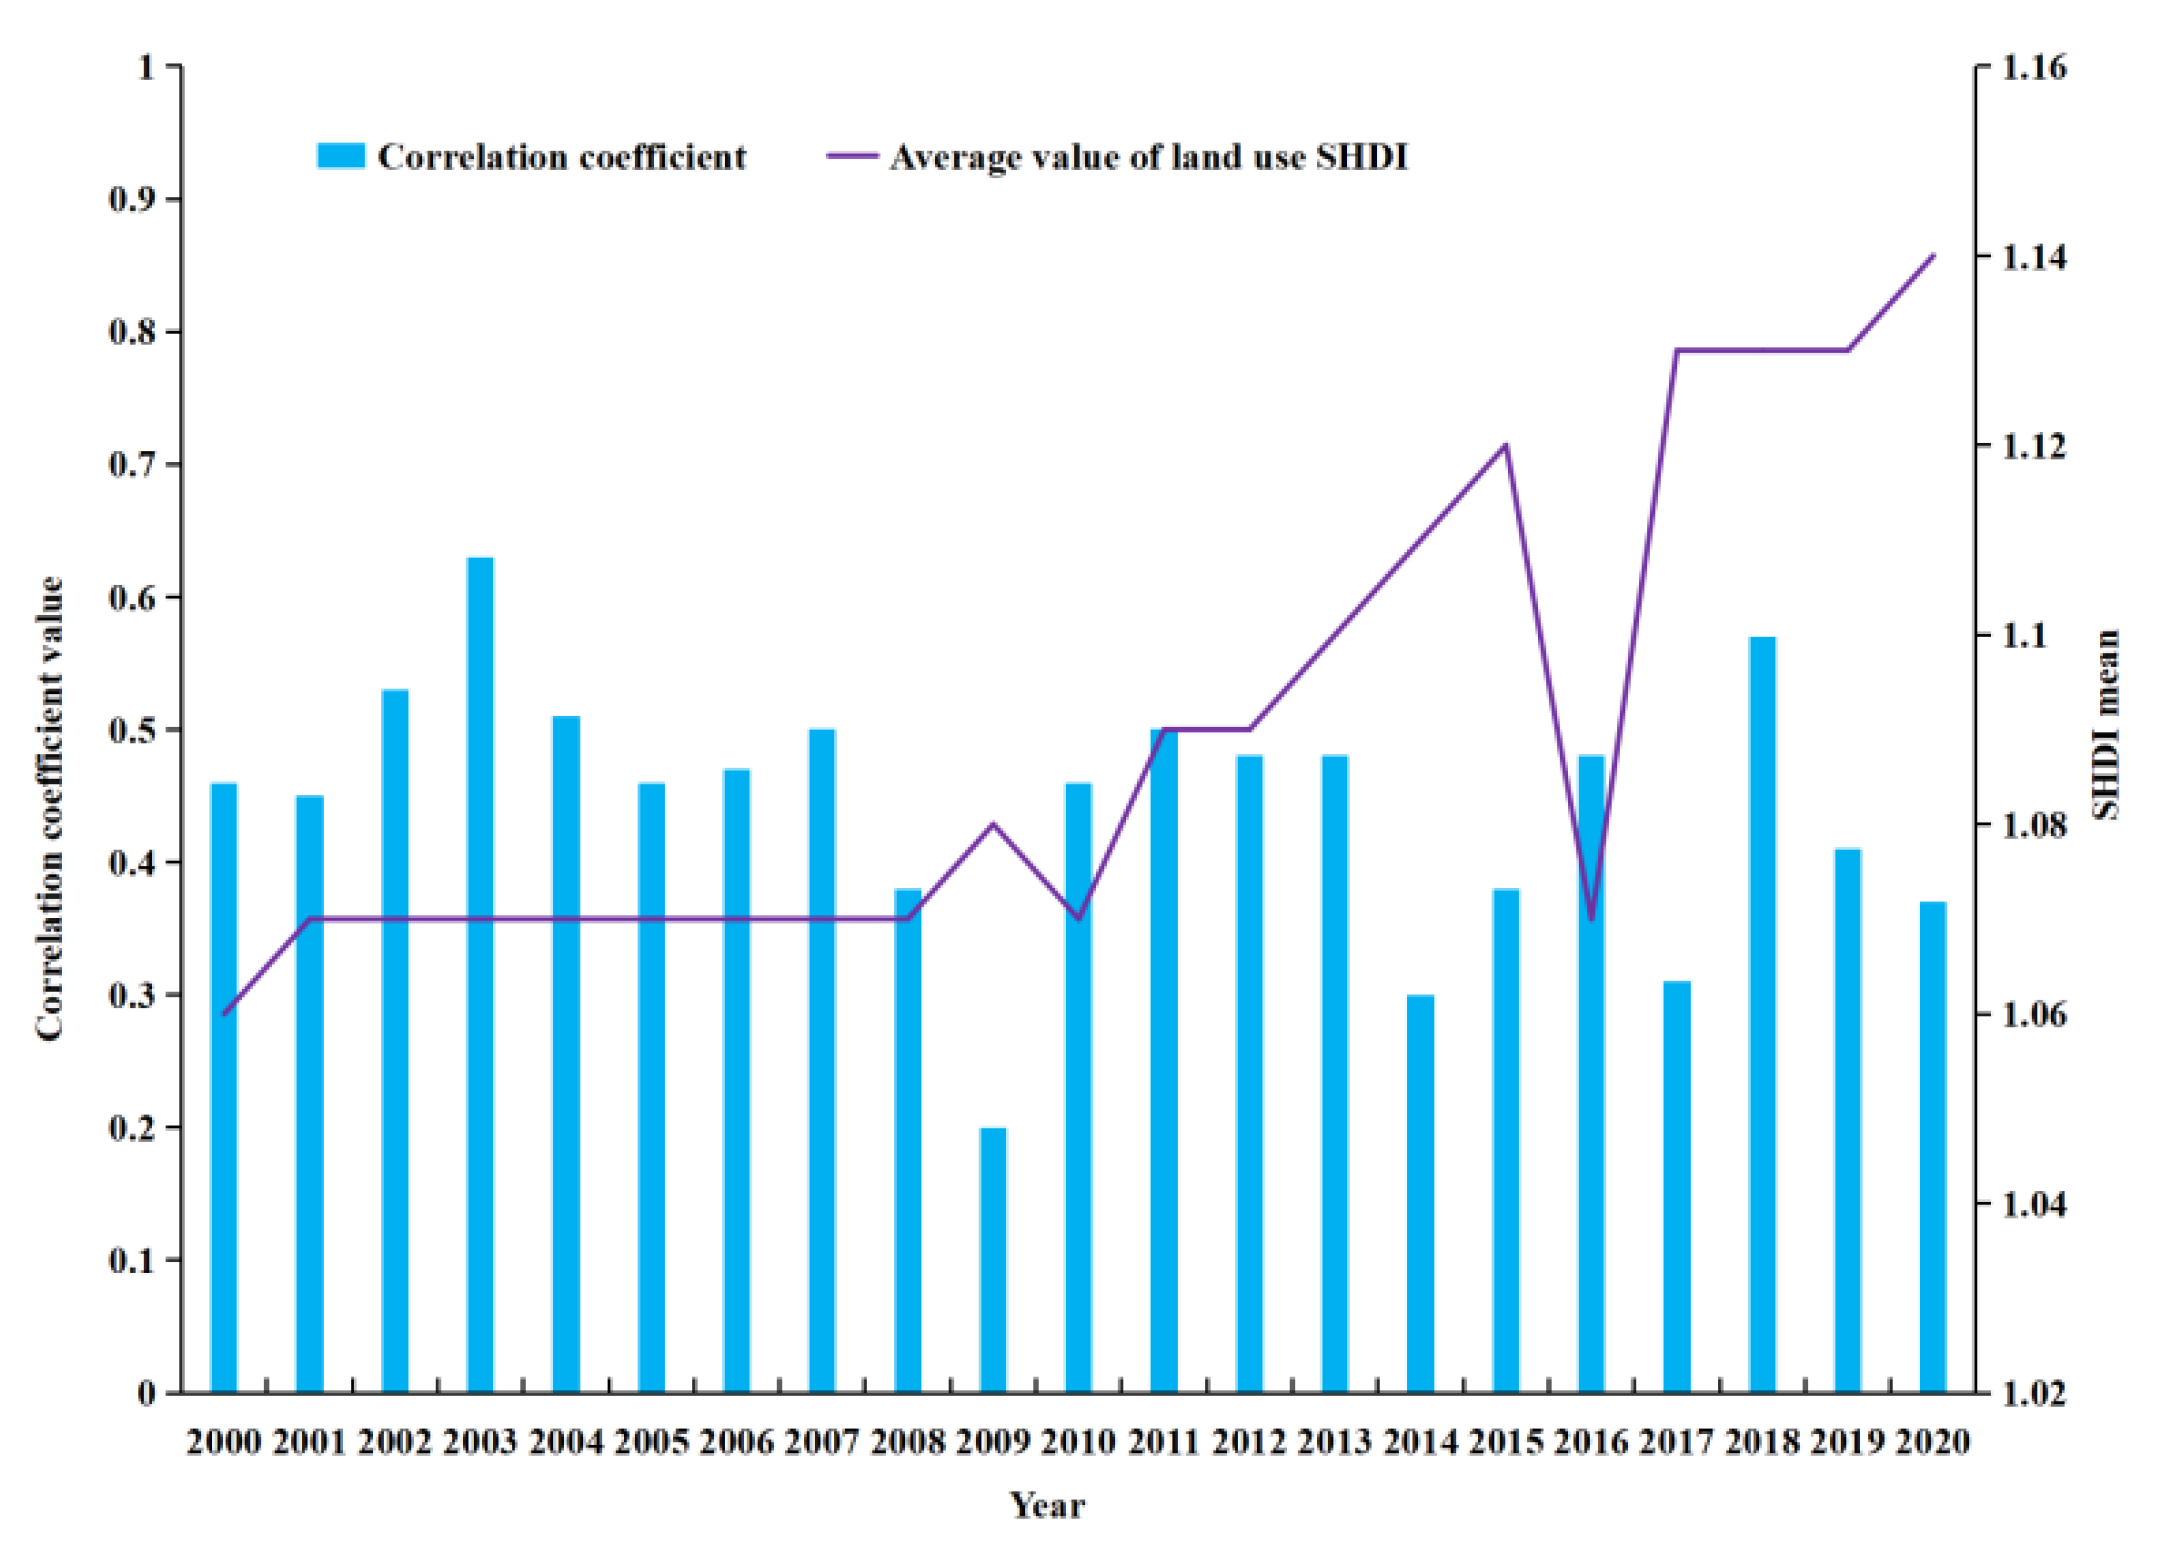
3.2.3. Impact of Land Use Diversity

A diversity index of land use was used to explore the influence of the land use spatial pattern on LST. Taking 100 counties as the basic unit, correlation analysis was used to reveal the relationship between land use diversity and LST, and regression analysis was further utilized to reveal the response relationship of LST to land use. It can be seen that there was a significant positive correlation between SHDI and LST, and the correlation coefficient was between 0.2 and 0.63, significant at the 0.01 level (2-tailed) (Figure 10). This showed that LST was not only directly affected by land use type and structure, but also by its spatial pattern. In the past 20 years, the SHDI increased from 1.06 to 1.14, the correlation coefficient decreased from 0.46 to 0.37, and the R2 values decreased from 0.2126 to 0.1352 (Table 5). This indicated that the correlation of land use diveristy and LST became weaker, indicating LST was more and more affected by factors other than land use diversity.

4. Discussion

According to previous studies, urbanization would inevitably lead to the change of land use type, structure and pattern, the destruction of the balance between surface radiation and energy, the excessive release of consumed energy, and the change of near surface atmospheric structure [4,5,22,32], which would eventually lead to the change of temporal and spatial pattern of surface temperature. Moreover, for rapidly expanding urban areas, the replacement of vegetation, the changes in building materials and surface reflectivity will be very rapid [30,41,45], which will lead to rapid evolution of the spatial distribution of LST. At the same time, the green ecological policies and planning and design implemented by the government will also indirectly lead to changes in surface temperature [1,70,71]. In this study, in the past 20 years, the overall LST in Jiangxi Province showed a downward trend. This is because the implementation of ecological policies such as returning cultivated land to forest land and grassland, around Poyang Lake area in Jiangxi Province. Furthermore, LST persistence was characterized by ‘persistent mild decline and uncertain future trend, but mainly uncertain future change trend’. The possible reason is because Jiangxi Province in China is dominated by hilly areas with low and medium mountains, alluvial plains of Poyang Lake densely covered with surface vegetation and water. The complex geographical environment makes LST persistence more uncertain. The comprehensive analysis of land use type, structure and pattern can better reflect the response relationship between land use and surface temperature [18,30,31,72]. In this study, construction land and cultivated land were proven to have warming effect with CI greater than 0, while forest land and water area were proven to have cooling effect with CI less than 0. This is because the construction land and cultivated land have small heat capacity, fast heat absorption, and weak vegetation transpiration, resulting in a significant warming effect. On the contrary, forest land has strong vegetation transpiration, large water heat capacity, and strong heat storage, resulting in a significant cooling effect. With the increase in the proportion of land use, the warming effect of construction land and cultivated land was significant, while the cooling effect of forest land was significant. Without considering other factors, the greater the land use diversity, the greater the impact on LST, but when the land use diversity increased to a certain extent, the impact will be reduced.
It is very important to understand the potential impact of future changes in the region by detecting the past trend, change and variability of the time series of climate change variables (such as precipitation and temperature) [59]. There are many different methods to assess climate change. Many researchers often use various parameter and nonparametric statistical tests to assess the trend of climate, thermal environment and hydrological time series [34,60,61,63]. In this paper, the pixel-wise LST trend analysis by statistical trend technique revealed the intensity grade in LULC with high mountain and hilly areas, which has some guiding significance for the study of similar areas. However, there is a lack of more accurate research on pixel-wise LST trend on seasonal, monthly, daily level. Future research should further consider the temporal and spatial variation of long-term time series for more accuracy. Furthermore, land use can be characterized as land use type, structure and pattern. This study explored the impacts of land use on LST from the aspects of land use type and structure deeply, but in terms of pattern, only land use diversity was applied. More land use pattern indices or models are required to study how affects LST.

5. Conclusions

Taking Jiangxi Province, China as the study area, based on MODIS LST products from 2000 to 2020, the temporal and spatial evolution characteristics of pixel-wise LST was analyzed using Theil Sen + Mann-Kendall, coefficient of variation and Hurst index, and the relationship between LST and land use was explored using contribution index and diversity index. The results of this study are as follows:
(1) From 2000 to 2020, the overall LST showed the spatial distribution characteristics of “high in the middle-east-west-south direction, and low in the north-northwest-southeast direction”. High-value areas were mainly distributed in the alluvial plain area of Poyang Lake, the valley terraces of the middle reaches of Ganjiang and Fuhe river, the middle-low mountain and hilly areas of eastern Jiangxi and the central area of southwestern Jiangxi. Low-value areas were mainly distributed in the water areas of Poyang Lake and the mountainous and hilly areas around.
(2) From 2000 to 2020, the overall LST showed a downward trend. The trend characteristic was "more falling area than the rising area". The stability characteristics were characterized by “high and low fluctuations coexist, the proportion of medium and low fluctuation areas is high, and the spatial difference is significant”. The overall performance of the persistent characteristic was "persistent mild decline and uncertain future trend, but mainly uncertain future change trend".
(3) The areas with higher LST were mostly construction land and unused land, while the areas with lower LST were mostly water area and forest land. The warming effect of construction land and cultivated land was obvious, and the cooling effect of forest land was much greater than that of water area. The high temperature area (LST greater than 34 °C) gradually shifted from forest land and water area to construction land and cultivated land, especially construction land. With the increase in the proportion of the area of each land use type, the warming effect of construction land and cultivated land was significant, and the cooling effect of forest land was significant. The higher the land use diversity, the more obvious the impact on LST. With the acceleration of urbanization, LST was less and less affected by land use diversity.

Author Contributions

Conceptualization, Q.X. and W.C.; methodology, S.L.; software, S.L.; validation, L.H., Q.X. and W.C.; formal analysis, Q.X.; investigation, S.L.; resources, S.L.; data curation, Q.X.; writing—original draft preparation, Q.X.; writing—review and editing, W.C.; visualization, W.C.; supervision, H.L.; project administration, H.L.; funding acquisition, W.C. and L.H. All authors have read and agreed to the published version of the manuscript.

Funding

This research was supported by the National Natural Science Foundation of China (NO. 41961036, NO. 41901130).

Institutional Review Board Statement

Not applicable.

Informed Consent Statement

Not applicable.

Data Availability Statement

MODIS LST products used to support this study were supplied by the National Aeronautics and Space Administration (NASA) (https://ladsweb.modaps.eosdis.nasa.gov/search/order/3/MOD11A2--61/2000-01-01.2020-12-31/ accessed on 5 June 2022). DEM was downloaded from the China Academy of Sciences website (http://www.gscloud.cn/search accessed on 5 June 2022).

Acknowledgments

We are very grateful to anonymous reviewers and editors, whose valuable comments and suggestions have greatly improved the research.

Conflicts of Interest

The authors declare no conflict of interest.

References

  1. Wei, Y.D.; Ye, X. Urbanization, urban land expansion and environmental change in China. Stoch. Environ. Res. Risk Assess. 2014, 28, 757. [Google Scholar] [CrossRef]
  2. Vadrevu, K.P.; Ohara, T. Focus on land use cover changes and environmental impacts in South/Southeast Asia. Environ. Res. Lett. 2020, 15, 100201. [Google Scholar] [CrossRef]
  3. Qiu, T.; Song, C.; Zhang, Y.; Liu, H.; Vose, J.M. Urbanization and climate change jointly shift land surface phenology in the northern mid-latitude large cities. Remote Sens. Environ. 2020, 236, 111477. [Google Scholar] [CrossRef]
  4. Neog, R. Evaluation of temporal dynamics of land use and land surface temperature (LST) in Agartala city of India. Environ. Dev. Sustain. 2022, 24, 3419. [Google Scholar] [CrossRef]
  5. Akinyemi, F.O.; Ikanyeng, M.; Muro, J. Land cover change effects on land surface temperature trends in an African urbanizing dryland region. City Environ. Interact. 2019, 4, 100029. [Google Scholar] [CrossRef]
  6. Sun, Y.; Gao, C.; Li, J.; Li, W.; Ma, R. Examining urban thermal environment dynamics and relations to biophysical composition and configuration and socio-economic factors: A case study of the Shanghai metropolitan region. Sustain. Cities Soc. 2018, 40, 284–295. [Google Scholar] [CrossRef]
  7. Ahmed, H.A.; Singh, S.K.; Kumar, M.; Maina, M.S.; Dzwairo, R.; Lal, D. Impact of urbanization and land cover change on urban climate: Case study of Nigeria. Urban Clim. 2020, 32, 100600. [Google Scholar] [CrossRef]
  8. Li, Z.; Tang, B.; Wu, H.; Ren, H.; Yan, G.; Wan, Z.; Trigo, I.F.; Sobrino, J.A. Satellite-derived land surface temperature: Current status and perspectives. Remote Sens. Environ. 2013, 131, 14. [Google Scholar] [CrossRef]
  9. Weng, Q. Thermal infrared remote sensing for urban climate and environmental studies: Methods, applications, and trends. ISPRS J. Photogramm. Remote Sens. 2009, 64, 335–344. [Google Scholar] [CrossRef]
  10. Tariq, A.; Riaz, I.; Ahmad, Z.; Yang, B.; Amin, M.; Kausar, R.; Andleeb, S.; Farooqi, M.A.; Rafiq, M. Land surface temperature relation with normalized satellite indices for the estimation of spatio-temporal trends in temperature among various land use land cover classes of an arid Potohar region using Landsat data. Environ. Earth Sci. 2019, 79, 40. [Google Scholar] [CrossRef]
  11. Wang, Z.; Liu, M.; Liu, X.; Meng, Y.; Zhu, L.; Rong, Y. Spatio-temporal evolution of surface urban heat islands in the Chang-Zhu-Tan urban agglomeration. Phys. Chem. Earth Parts A/B/C 2020, 117, 102865. [Google Scholar] [CrossRef]
  12. Zhao, W.; He, J.; Wu, Y.; Xiong, D.; Wen, F.; Li, A. An Analysis of Land Surface Temperature Trends in the Central Himalayan Region Based on MODIS Products. Remote Sens. 2019, 11, 900. [Google Scholar] [CrossRef]
  13. Aguilar-Lome, J.; Espinoza-Villar, R.; Espinoza, J.; Rojas-Acuña, J.; Willems, B.L.; Leyva-Molina, W. Elevation-dependent warming of land surface temperatures in the Andes assessed using MODIS LST time series (2000–2017). Int. J. Appl. Earth Obs. Geoinf. 2019, 77, 119–128. [Google Scholar] [CrossRef]
  14. Zhou, J.; Liang, S.; Cheng, J.; Wang, Y.; Ma, J. The GLASS Land Surface Temperature Product. IEEE J. Sel. Top. Appl. Earth Obs. Remote Sens. 2019, 12, 493–507. [Google Scholar] [CrossRef]
  15. Yang, Q.; Huang, X.; Tang, Q. The footprint of urban heat island effect in 302 Chinese cities: Temporal trends and associated factors. Sci. Total Environ. 2019, 655, 652. [Google Scholar] [CrossRef]
  16. Muro, J.; Strauch, A.; Heinemann, S.; Steinbach, S.; Thonfeld, F.; Waske, B.; Diekkrüger, B. Land surface temperature trends as indicator of land use changes in wetlands. Int. J. Appl. Earth Obs. Geoinformation 2018, 70, 62–71. [Google Scholar] [CrossRef]
  17. Mao, K.B.; Ma, Y.; Tan, X.L.; Shen, X.Y.; Liu, G.; Li, Z.L.; Chen, J.M.; Xia, L. Global surface temperature change analysis based on MODIS data in recent twelve years. Adv. Space Res. 2017, 59, 503. [Google Scholar] [CrossRef]
  18. Khan, I.; Javed, T.; Khan, A.; Lei, H.; Muhammad, I.; Ali, I.; Huo, X. Impact assessment of land use change on surface temperature and agricultural productivity in Peshawar-Pakistan. Environ. Sci. Pollut. Res. 2019, 26, 33076–33085. [Google Scholar] [CrossRef] [PubMed]
  19. Deilami, K.; Kamruzzaman, M.; Liu, Y. Urban heat island effect: A systematic review of spatio-temporal factors, data, methods, and mitigation measures. Int. J. Appl. Earth Obs. Geoinf. 2018, 67, 30. [Google Scholar] [CrossRef]
  20. Liu, J.; Hagan, D.F.T.; Liu, Y. Global Land Surface Temperature Change (2003–2017) and Its Relationship with Climate Drivers: AIRS, MODIS, and ERA5-Land Based Analysis. Remote Sens. 2021, 13, 44. [Google Scholar] [CrossRef]
  21. Orimoloye, I.R.; Mazinyo, S.P.; Nel, W.; Kalumba, A.M. Spatiotemporal monitoring of land surface temperature and estimated radiation using remote sensing: Human health implications for East London, South Africa. Environ. Earth Sci. 2018, 77, 77. [Google Scholar] [CrossRef]
  22. Wu, Y.; Shan, Y.; Lai, Y.; Zhou, S. Method of calculating land surface temperatures based on the low-altitude UAV thermal infrared remote sensing data and the near-ground meteorological data. Sustain. Cities Soc. 2022, 78, 103615. [Google Scholar] [CrossRef]
  23. Hao, P.; Niu, Z.; Zhan, Y.; Wu, Y.; Wang, L.; Liu, Y. Spatiotemporal changes of urban impervious surface area and land surface temperature in Beijing from 1990 to 2014. GI Sci. Remote Sens. 2016, 53, 63. [Google Scholar] [CrossRef]
  24. Sarafanov, M.; Kazakov, E.; Nikitin, N.O.; Kalyuzhnaya, A.V. A Machine Learning Approach for Remote Sensing Data Gap-Filling with Open-Source Implementation: An Example Regarding Land Surface Temperature, Surface Albedo and NDVI. Remote Sens. 2020, 12, 3865. [Google Scholar] [CrossRef]
  25. Wang, Y.; Yi, G.; Zhou, X.; Zhang, T.; Bie, X.; Li, J.; Ji, B. Spatial distribution and influencing factors on urban land surface temperature of twelve megacities in China from 2000 to 2017. Ecol. Indic. 2021, 125, 107533. [Google Scholar] [CrossRef]
  26. Zareie, S.; Rangzan, K.; Khosravi, H.; Sherbakov, V.M. Comparison of split window algorithms to derive land surface temperature from satellite TIRS data. Arab. J. Geosci. 2018, 11, 391. [Google Scholar] [CrossRef]
  27. Liu, F.; Zhang, X.; Murayama, Y.; Morimoto, T. Impacts of Land Cover/Use on the Urban Thermal Environment: A Comparative Study of 10 Megacities in China. Remote Sens. 2020, 12, 307. [Google Scholar] [CrossRef]
  28. Wang, M.; He, G.; Zhang, Z.; Wang, G.; Wang, Z.; Yin, R.; Cui, S.; Wu, Z.; Cao, X. A radiance-based split-window algorithm for land surface temperature retrieval: Theory and application to MODIS data. Int. J. Appl. Earth Obs. Geoinf. 2019, 76, 204–217. [Google Scholar] [CrossRef]
  29. Shiff, S.; Helman, D.; Lensky, I.M. Worldwide continuous gap-filled MODIS land surface temperature dataset. Sci. Data. 2021, 8, 74. [Google Scholar] [CrossRef]
  30. Feng, Y.; Gao, C.; Tong, X.; Chen, S.; Lei, Z.; Wang, J. Spatial Patterns of Land Surface Temperature and Their Influencing Factors: A Case Study in Suzhou, China. Remote Sens. 2019, 11, 182. [Google Scholar] [CrossRef]
  31. Liu, F.; Hou, H.; Murayama, Y. Spatial Interconnections of Land Surface Temperatures with Land Cover/Use: A Case Study of Tokyo. Remote Sens. 2021, 13, 610. [Google Scholar] [CrossRef]
  32. Panwar, M.; Agarwal, A.; Devadas, V. Analyzing land surface temperature trends using non-parametric approach: A case of Delhi, India. Urban Clim. 2018, 24, 19. [Google Scholar] [CrossRef]
  33. Yu, Y.; Duan, S.; Li, Z.; Chang, S.; Xing, Z.; Leng, P.; Gao, M. Interannual Spatiotemporal Variations of Land Surface Temperature in China From 2003 to 2018. Int. J. Appl. Earth Obs. Geoinf. 2021, 14, 1783–1795. [Google Scholar] [CrossRef]
  34. Bayable, G.; Alemu, G. Spatiotemporal variability of land surface temperature in north-western Ethiopia. Environ. Sci. Pollut. Res. 2022, 29, 2629. [Google Scholar] [CrossRef] [PubMed]
  35. Moradi, M.; Darand, M. Trend analysis of land surface temperature over Iran based on land cover and topography. Int. J. Environ. Sci. Technol. 2022, 19, 7229–7242. [Google Scholar] [CrossRef]
  36. Pepin, N.C.; Maeda, E.E.; Williams, R. Use of remotely sensed land surface temperature as a proxy for air temperatures at high elevations: Findings from a 5000 m elevational transect across Kilimanjaro. J. Geophys. Res. Atmos. 2016, 121, 9998. [Google Scholar] [CrossRef]
  37. Rasul, A.; Ningthoujam, R. Snow cover and vegetation greenness with leaf water content control the global land surface temperature. Environ. Dev. Sustain. 2021, 23, 14722. [Google Scholar] [CrossRef]
  38. Zhao, Z.; He, B.; Li, L.; Wang, H.; Darko, A. Profile and concentric zonal analysis of relationships between land use/land cover and land surface temperature: Case study of Shenyang, China. Energ. Build. 2017, 155, 282. [Google Scholar] [CrossRef]
  39. Estoque, R.C.; Murayama, Y.; Myint, S.W. Effects of landscape composition and pattern on land surface temperature: An urban heat island study in the megacities of Southeast Asia. Sci. Total Environ. 2017, 577, 349. [Google Scholar] [CrossRef]
  40. Bento, V.A.; Gouveia, C.M.; DaCamara, C.C.; Libonati, R.; Trigo, I.F. The roles of NDVI and Land Surface Temperature when using the Vegetation Health Index over dry regions. Glob. Planet Change 2020, 190, 103198. [Google Scholar] [CrossRef]
  41. Deng, Y.; Wang, S.; Bai, X.; Tian, Y.; Wu, L.; Xiao, J.; Chen, F.; Qian, Q. Relationship among land surface temperature and LUCC, NDVI in typical karst area. Sci. Rep. 2018, 8, 641. [Google Scholar] [CrossRef] [PubMed]
  42. Sekertekin, A.; Zadbagher, E. Simulation of future land surface temperature distribution and evaluating surface urban heat island based on impervious surface area. Ecol. Indic. 2021, 122, 107230. [Google Scholar] [CrossRef]
  43. Gomez-Martinez, F.; de Beurs, K.M.; Koch, J.; Widener, J. Multi-Temporal Land Surface Temperature and Vegetation Greenness in Urban Green Spaces of Puebla, Mexico. Land 2021, 10, 155. [Google Scholar] [CrossRef]
  44. Hu, M.; Wang, Y.; Xia, B.; Huang, G. Surface temperature variations and their relationships with land cover in the Pearl River Delta. Environ. Sci. Pollut. Res. 2020, 27, 37614. [Google Scholar] [CrossRef] [PubMed]
  45. Guo, L.; Liu, R.; Men, C.; Wang, Q.; Miao, Y.; Zhang, Y. Quantifying and simulating landscape composition and pattern impacts on land surface temperature: A decadal study of the rapidly urbanizing city of Beijing, China. Sci. Total Environ. 2019, 654, 430. [Google Scholar] [CrossRef]
  46. Shukla, A.; Jain, K. Analyzing the impact of changing landscape pattern and dynamics on land surface temperature in Lucknow city, India. Urban For. Urban Green. 2021, 58, 126877. [Google Scholar] [CrossRef]
  47. Lu, Y.; Yue, W.; Liu, Y.; Huang, Y. Investigating the spatiotemporal non-stationary relationships between urban spatial form and land surface temperature: A case study of Wuhan, China. Sustain. Cities Soc. 2021, 72, 103070. [Google Scholar] [CrossRef]
  48. Ma, E.; Liu, A.; Li, X.; Wu, F.; Zhan, J. Impacts of Vegetation Change on the Regional Surface Climate: A Scenario-Based Analysis of Afforestation in Jiangxi Province, China. Adv. Meteorol. 2013, 2013, 1. [Google Scholar] [CrossRef]
  49. Wang, Q.; Riemann, D.; Vogt, S.; Glaser, R. Impacts of land cover changes on climate trends in Jiangxi province China. Int. J. Biometeorol. 2014, 58, 645. [Google Scholar] [CrossRef]
  50. Zhang, X.; Xie, H.; Shi, J.; Lv, T.; Zhou, C.; Liu, W. Assessing Changes in Ecosystem Service Values in Response to Land Cover Dynamics in Jiangxi Province, China. Int. J. Environ. Res. Public Health 2020, 17, 3018. [Google Scholar] [CrossRef]
  51. Yang, J.; Huo, Z.; Li, X.; Wang, P.; Wu, D. Hot weather event-based characteristics of double-early rice heat risk: A study of Jiangxi province, South China. Ecol. Indic. 2020, 113, 106148. [Google Scholar] [CrossRef]
  52. Wan, Z. New refinements and validation of the collection-6 MODIS land-surface temperature/emissivity product. Remote Sens. Environ. 2014, 140, 36. [Google Scholar] [CrossRef]
  53. Azamathulla, H.M.; Ab Ghani, A.; Fei, S.Y. ANFIS-based approach for predicting sediment transport in clean sewer. Appl. Soft Comput. 2012, 12, 1227. [Google Scholar] [CrossRef] [PubMed]
  54. Azamathulla, H.M.; Guven, A.; Demir, Y.K. Linear genetic programming to scour below submerged pipeline. Ocean Eng. 2011, 38, 995. [Google Scholar] [CrossRef]
  55. Wan, Z.; Li, Z.L. A physics-based algorithm for retrieving land-surface emissivity and temperature from EOS/MODIS data. IEEE Trans. Geosci. Remote Sens. 1997, 35, 980–996. [Google Scholar]
  56. Wan, Z.; Zhang, Y.; Zhang, Q.; Li, Z.L. Quality assessment and validation of the MODIS global land surface temperature. Int. J. Remote Sens. 2004, 25, 261. [Google Scholar] [CrossRef]
  57. Ying, H.; Shan, Y.; Zhang, H.; Yuan, T.; Rihan, W.; Deng, G. The Effect of Snow Depth on Spring Wildfires on the Hulunbuir from 2001–2018 Based on MODIS. Remote Sens. 2019, 11, 321. [Google Scholar] [CrossRef]
  58. Yang, J.; Huang, X. The 30 m annual land cover dataset and its dynamics in China from 1990 to 2019. Earth Syst. Sci. Data 2021, 13, 3907. [Google Scholar]
  59. Mehta, D.; Yadav, S.M. An analysis of rainfall variability and drought over Barmer District of Rajasthan, Northwest India. Water Supply 2021, 21, 2505. [Google Scholar] [CrossRef]
  60. Pingale, S.M.; Khare, D.; Jat, M.K.; Adamowski, J. Spatial and temporal trends of mean and extreme rainfall and temperature for the 33 urban centers of the arid and semi-arid state of Rajasthan, India. Atmos. Res. 2014, 138, 73. [Google Scholar] [CrossRef]
  61. Mehta, D.; Yadav, S.M. Temporal analysis of rainfall and drought characteristics over Jalore District of S-W Rajasthan. Water Pract. Technol. 2021, 17, 254. [Google Scholar] [CrossRef]
  62. Perera, A.; Mudannyaka, S.; Azamathulla, H.; Rathnayake, U. Recent Climatic Trends in Trinidad and Tobago, West Indies. Asia-Pacific J. Sci. Technol. 2020, 25, 1–11. [Google Scholar]
  63. Mehta, D.; Yadav, S. Long-term trend analysis of climate variables for arid and semi-arid regions of an Indian State Rajasthan. Int. J. Hydrol. Sci. Technol. 2020, 1, 1. [Google Scholar] [CrossRef]
  64. Eleftheriou, M. A change-point model for monitoring the coefficient of variation based on squared ranks test. Comput. Ind. Eng. 2019, 136, 366. [Google Scholar] [CrossRef]
  65. Sánchez Granero, M.A.; Trinidad Segovia, J.E.; García Pérez, J. Some comments on Hurst exponent and the long memory processes on capital markets. Phys. A Stat. Mech. Applications 2008, 387, 5543–5551. [Google Scholar] [CrossRef]
  66. Tong, S.; Lai, Q.; Zhang, J.; Bao, Y.; Lusi, A.; Ma, Q.; Li, X.; Zhang, F. Spatiotemporal drought variability on the Mongolian Plateau from 1980–2014 based on the SPEI-PM, intensity analysis and Hurst exponent. Sci. Total Environ. 2018, 615, 1557. [Google Scholar] [CrossRef]
  67. Karmakar, S.; Goswami, S.; Chattopadhyay, S. Exploring the pre- and summer-monsoon surface air temperature over eastern India using Shannon entropy and temporal Hurst exponents through rescaled range analysis. Atmos. Res. 2019, 217, 57–62. [Google Scholar] [CrossRef]
  68. Yu, Z.; Yao, Y.; Yang, G.; Wang, X.; Vejre, H. Spatiotemporal patterns and characteristics of remotely sensed region heat islands during the rapid urbanization (1995–2015) of Southern China. Sci. Total Environ. 2019, 674, 242. [Google Scholar] [CrossRef]
  69. Peng, J.; Jia, J.; Liu, Y.; Li, H.; Wu, J. Seasonal contrast of the dominant factors for spatial distribution of land surface temperature in urban areas. Remote Sens. Environ. 2018, 215, 255. [Google Scholar] [CrossRef]
  70. Tran, D.X.; Pla, F.; Latorre-Carmona, P.; Myint, S.W.; Caetano, M.; Kieu, H.V. Characterizing the relationship between land use land cover change and land surface temperature. ISPRS J. Photogramm. Remote Sens. 2017, 124, 119. [Google Scholar] [CrossRef]
  71. Luo, H.; Wu, J. Effects of urban growth on the land surface temperature: A case study in Taiyuan, China. Environ. Dev. Sustain. 2021, 23, 10787. [Google Scholar] [CrossRef]
  72. Zhou, G.; Wang, H.; Chen, W.; Zhang, G.; Luo, Q.; Jia, B. Impacts of Urban land surface temperature on tract landscape pattern, physical and social variables. Int. J. Remote Sens. 2020, 41, 683. [Google Scholar] [CrossRef]
Figure 1. The geographical location of the study area.
Atmosphere 13 01278 g001
Figure 2. Spatial distribution of LST before and after the interpolation in 2000 and 2020 and the main changes after the interpolation.
Atmosphere 13 01278 g002
Figure 3. Spatial distribution of land use in Jiangxi Province, China during consecutive periods from 2000 to 2020 (represented by the starting year 2000, the middle year 2010, and the end year 2020).
Atmosphere 13 01278 g003
Figure 4. The research program in this study.
Atmosphere 13 01278 g004
Figure 5. (a) The spatial distribution of LST in Jiangxi Province, China during consecutive periods from 2000 to 2020 (represented by the starting year 2000, the middle year 2010, and the last year 2020) and (b) the inter-annual variation of its mean value.
Atmosphere 13 01278 g005
Figure 6. Distribution map of (a) LST trend, (b) stability, and (c) persistence characteristics in Jiangxi Province, China from 2000 to 2020.
Atmosphere 13 01278 g006
Figure 7. (a) LST mean and (b) CI of each land use type from 2000 to 2020.
Atmosphere 13 01278 g007
Figure 8. Proportion of different land use types for each LST grade during consecutive periods from 2000 to 2020 (represented by the starting year 2000, the middle year 2010, and the end year 2020).
Atmosphere 13 01278 g008
Figure 9. Average LST values of different proportions of land use types in the consecutive period from 2000 to 2020 (represented by the starting year 2000, the middle year 2010, and the end year 2020).
Atmosphere 13 01278 g009
Figure 10. Correlation analysis between land use SHDI and LST from 2000 to 2020 (Significant correlated at the 0.01 level (2-tailed)).
Atmosphere 13 01278 g010
Table 1. Different parameters of kriging interpolation and corresponding random sampling point correlation coefficient and root mean square error.
Sample NumberNuggetMajor RangePartial StillLag SizeRRMSE
12.185129,4211.517,7280.96570.0166
22.185129,4211.817,7280.96840.0161
32.185129,4212.117,7280.96590.0166
42.185129,4212.517,7280.96110.0176
52.185129,4212.717,7280.95910.0181
62.185129,421317,7280.95660.0186
72.185129,4213.317,7280.96350.0171
82.185129,4213.617,7280.95400.0191
92.185129,4213.917,7280.95340.0192
102.185129,4214.517,7280.95280.0193
Table 2. Trend classification of LST.
β ValueZ ValueLST Trend GradePercentage of Area (%)
>0.0005>1.96Significant increase2.14%
>0.0005−1.96–1.96Mild increase28.80%
−0.0005–0.0005−1.96–1.96Stability0.77%
<−0.0005−1.96–1.96Mild decline62.97%
<−0.0005<−1.96Significant decline5.32%
Table 3. Classification of LST coefficient of variation.
CV ValueLST Fluctuation GradePercentage of Area (%)
0.01–0.03Minimum fluctuation4.98%
0.03–0.04Lower fluctuation45.39%
0.04–0.05Moderate fluctuation41.58%
0.05–0.06Higher fluctuation6.84%
>0.06Maximum fluctuation1.21%
Table 4. Persistence classification of LST.
LST Persistence Gradeβ ValueZ ValueH ValuePercentage of Area (%)
Persistent significant increase>0.0005>1.96>0.51.83%
Persistent mild increase>0.0005−1.96–1.96>0.59.06%
Persistent stability−0.0005–0.0005−1.96–1.96>0.50.23%
Persistent mild decline>−0.0005−1.96–1.96>0.530.35%
Persistent significant decline<−0.0005<−1.96>0.54.70%
Uncertain future trends<0.553.83%
Table 5. Regression analysis of land use SHDI and LST from 2000 to 2020.
YearRegression ModelR2
2000LST = 1.5892SHDI + 30.120.2126
2001LST = 1.6545SHDI + 29.6210.2059
2002LST = 1.7064SHDI + 28.8350.2833
2003LST = 2.8025SHDI + 30.8920.3985
2004LST = 2.335SHDI + 30.2180.2618
2005LST = 1.9304SHDI + 30.1130.2112
2006LST = 2.1322SHDI + 29.2420.223
2007LST = 2.0615SHDI + 29.6270.2487
2008LST = 1.5567SHDI + 31.4060.1447
2009LST = 0.7713SHDI + 29.5290.0395
2010LST = 1.9095SHDI + 31.0520.2112
2011LST = 2.6835SHDI + 29.180.2546
2012LST = 1.986SHDI + 29.4560.2348
2013LST = 2.5836SHDI + 29.2730.2296
2014LST = 1.3187SHDI + 29.9690.0918
2015LST = 1.6609SHDI + 30.0850.1456
2016LST = 2.0931SHDI + 29.7740.235
2017LST = 1.579SHDI + 30.5640.0949
2018LST = 2.6474SHDI + 29.2030.3239
2019LST = 1.9633SHDI + 29.7580.1687
2020LST = 1.7568SHDI + 29.2520.1352
Publisher’s Note: MDPI stays neutral with regard to jurisdictional claims in published maps and institutional affiliations.

