1. Introduction
A sand and dust storms (SDS) hotspot can be defined as a spot location where SDS originated from or near surroundings [
1]. It is not specifically a certain point location, but more similar to a polygon area. In the Middle East, the unusual meteorological conditions with extremely dry and hot environments enhance very fine sand, clay, and silt particles for erosion during sand and dust storms in the region. Key features of a dust hotspot are a desert environment, strong winds, loose, fine sediments, and rare or absent vegetation. Elevated terrain in the region coupled with strong winds accelerates the transport of the dust from hotspots over a wide geographic region. SDS has profound impacts beyond local and regional limits, making them a global issue. Dust particles resulting from wind erosion make up half of the aerosols in the troposphere [
2]. The dry regions of Northern Africa, Middle East, Central Asia, and China, as well as America, South Africa, and to a lesser extent Australia, are the primary suppliers of worldwide mineral dust [
2,
3]. In the desert ecosystem, the wind is the most active element, which has the ability to blow away sand, silt, and clay-sized particles from the surface over great distances via SDS [
1]. Dust is categorized based on visibility (vis) into blowing dust (vis between 1 and 5 km), suspended dust (vis < 10 km), and SDS (vis below 1 km) [
4].
Globally, the Middle East has one of the highest fluxes of fallen dust [
5,
6,
7]. The SDS is a persistent challenge in the Middle East Region. The dust fluxes depend on the severity, time extent, loftiness, and distance from the origin [
8]. The Mesopotamian Flood Plain, Iraq’s Western Desert, northern Africa’s Sahara, and the Nafud and Empty Quarter Deserts are the main sources of silica dust in the Middle East [
9]. The regional SDS is a precarious event interacting with exposure circumstances, capacity, and vulnerability, resulting in a socioeconomic negative effect on the region [
2]. Such events have a wide range of negative consequences, ranging from economic disruptions to serious health consequences for the population. Dust concentrations in the environment have an extensive effect on human health. The dust particle size is a crucial indicator of possible health risks. Particles bigger than 10 μm in diameter are not easily inhaled, and therefore, they can harm external tissues and organs, causing eye infections and skin irritations [
10]. Allergy, asthma, tracheitis, silicosis, and pneumonia are all connected with particles of sizes less than 10 μm, which are easily breathable and are frequently stuck in the throat, mouth, nose, and upper part of the respiratory system. The tiniest dust grains with a diameter of less than 2.5 μm can pass through the lower part of the respiratory system and into the circulation, where they are able to harm all internal tissues or organs and cause heart problems [
11]. According to a 2014 worldwide model evaluation within over 30 populations, dust grains with a diameter less than 2.5 μm caused nearly 400,000 untimely deaths due to cardiovascular illness [
12].
The Middle East mainly consists of deserts and is affected by SDS throughout the year [
13]. Climate change, soil formation, loess deposition, ocean sedimentation, and nutrient inputs to marine and terrestrial ecosystems are all examples of SDS ecological impacts. Additionally, the SDS is transporting microorganisms (viruses, fungi, bacteria, pollen, and spores). Microorganisms associated with dust, in particular, can have a direct influence on human health through pathogenesis, sensitivity development (e.g., asthma) as a result of continuous exposure, and cellular component exposure (pollen and fungal allergens, for example) [
10]. In arid areas, dust storms are the most dangerous natural hazard, commonly occurring in the Middle East’s environment, and are considered a characteristic feature of the environment. The transportation of dust poses a variety of risks to human civilization [
14]. These include effects on air quality, radiative transfer, and ecological impacts.
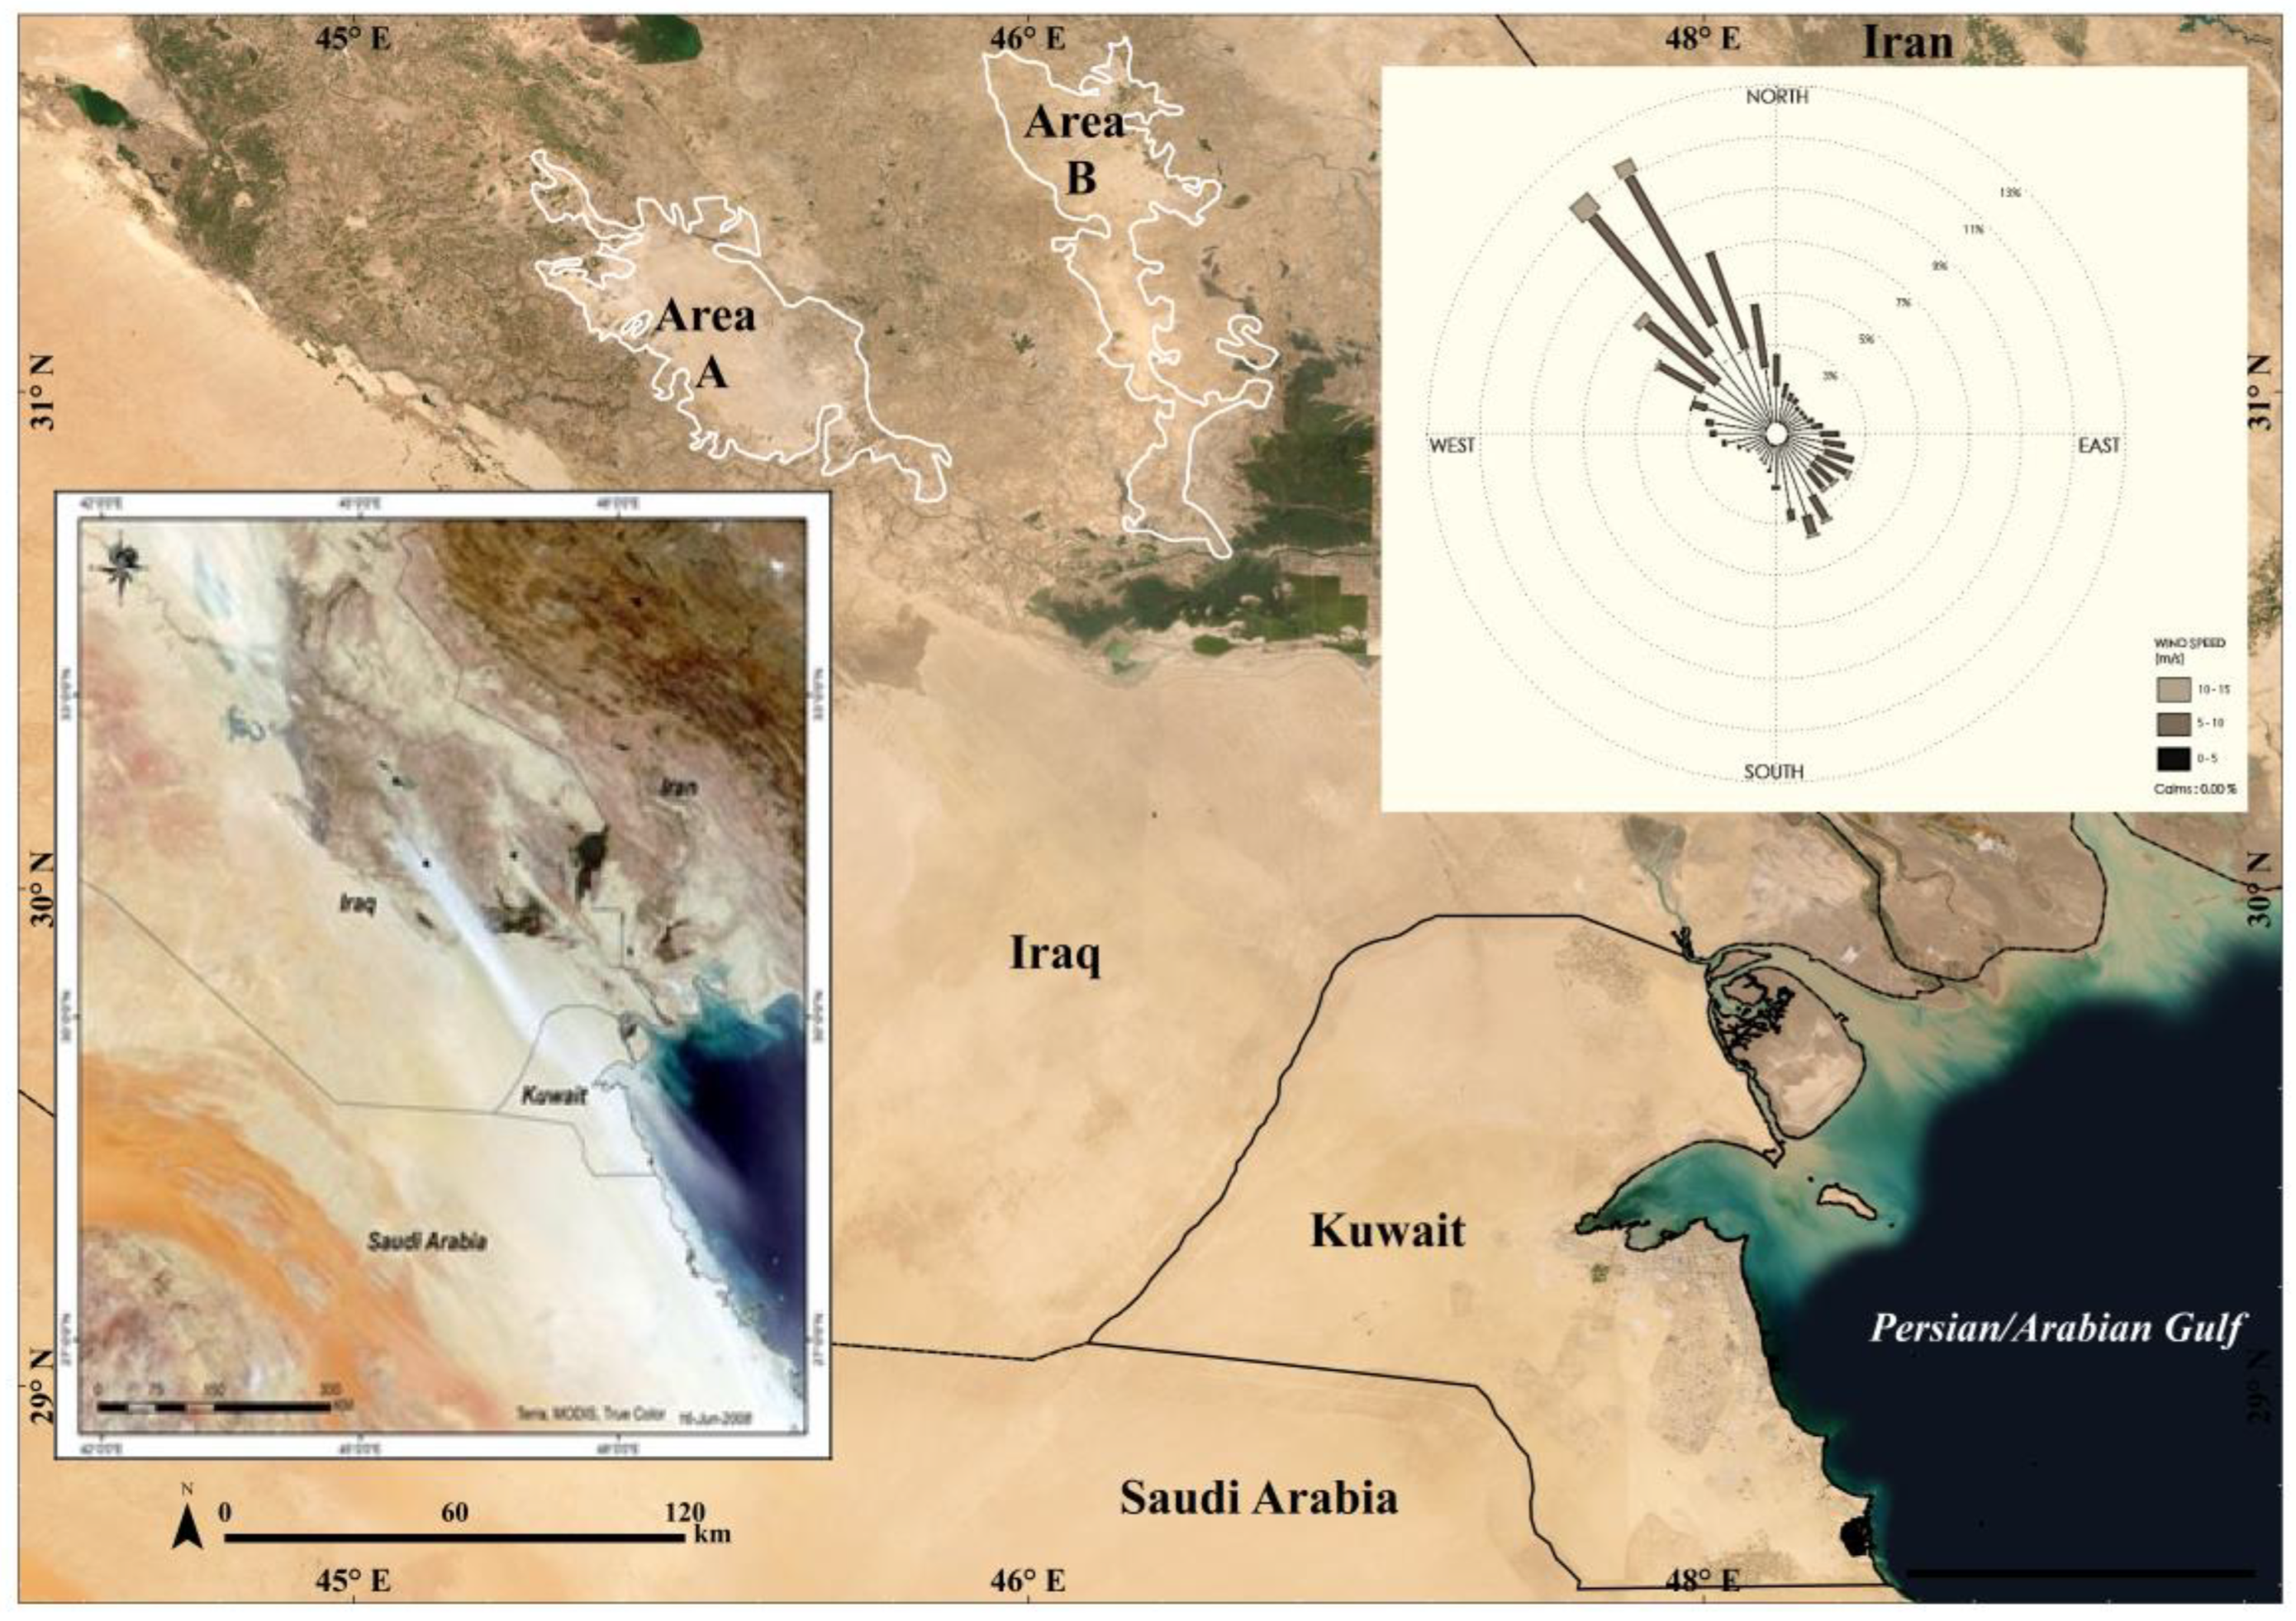
Preventing and mitigating desertification in locations where sand and dust storms originate, such as southern Iraq, is necessary to reduce SDS incidents in the Middle East. Similarly, efforts should be implemented in the Middle East to diminish the impact of SDS and the numerous challenges they generate. Meteorological conditions and soil characteristics in hotspot areas for local and global are the driving forces of SDS. Precise SDS paths for each season were identified by previous studies [
15,
16,
17,
18,
19], and it was determined that the prevailing northern winds from Syria and southern Iraq are the primary suppliers of SDS that occur between February and April [
20], with a dust fallout rate to maximum more than 400 tons·km
−2·yr
−1 in Ahvaz, southern Iraq, and Kuwait, and the lowest (less than 50 tons·km
−2·yr
−1) in Syria, Lebanon, and Jordan [
20]. Deposited dust particles are finer in size fractions on the northern side of the Middle East compared to the southern side. Blown dust is distinguished by its high particulate matter (PM) intensity, which raises dust particle concentrations for a number of days. Severe SDS paths originate from the two main hotspot areas located in the southern part of the Mesopotamian Flood Plain and these paths extend downwind to regions crossing borders and covering southern Iraq, southeastern Iran, Kuwait, eastern Saudi, Qatar, Bahrain, and Emirates. Recently, around 40 million people in the region were shown to be affected by these two hotspots. The aim of this study is to expand the knowledge and awareness of factors and conditions that enable SDS, their effects, and prevention to initiate a success story via setting a mitigation plan to fix SDS hotspot areas on the southern side of the Mesopotamian Flood Plain.
3. Materials and Methods
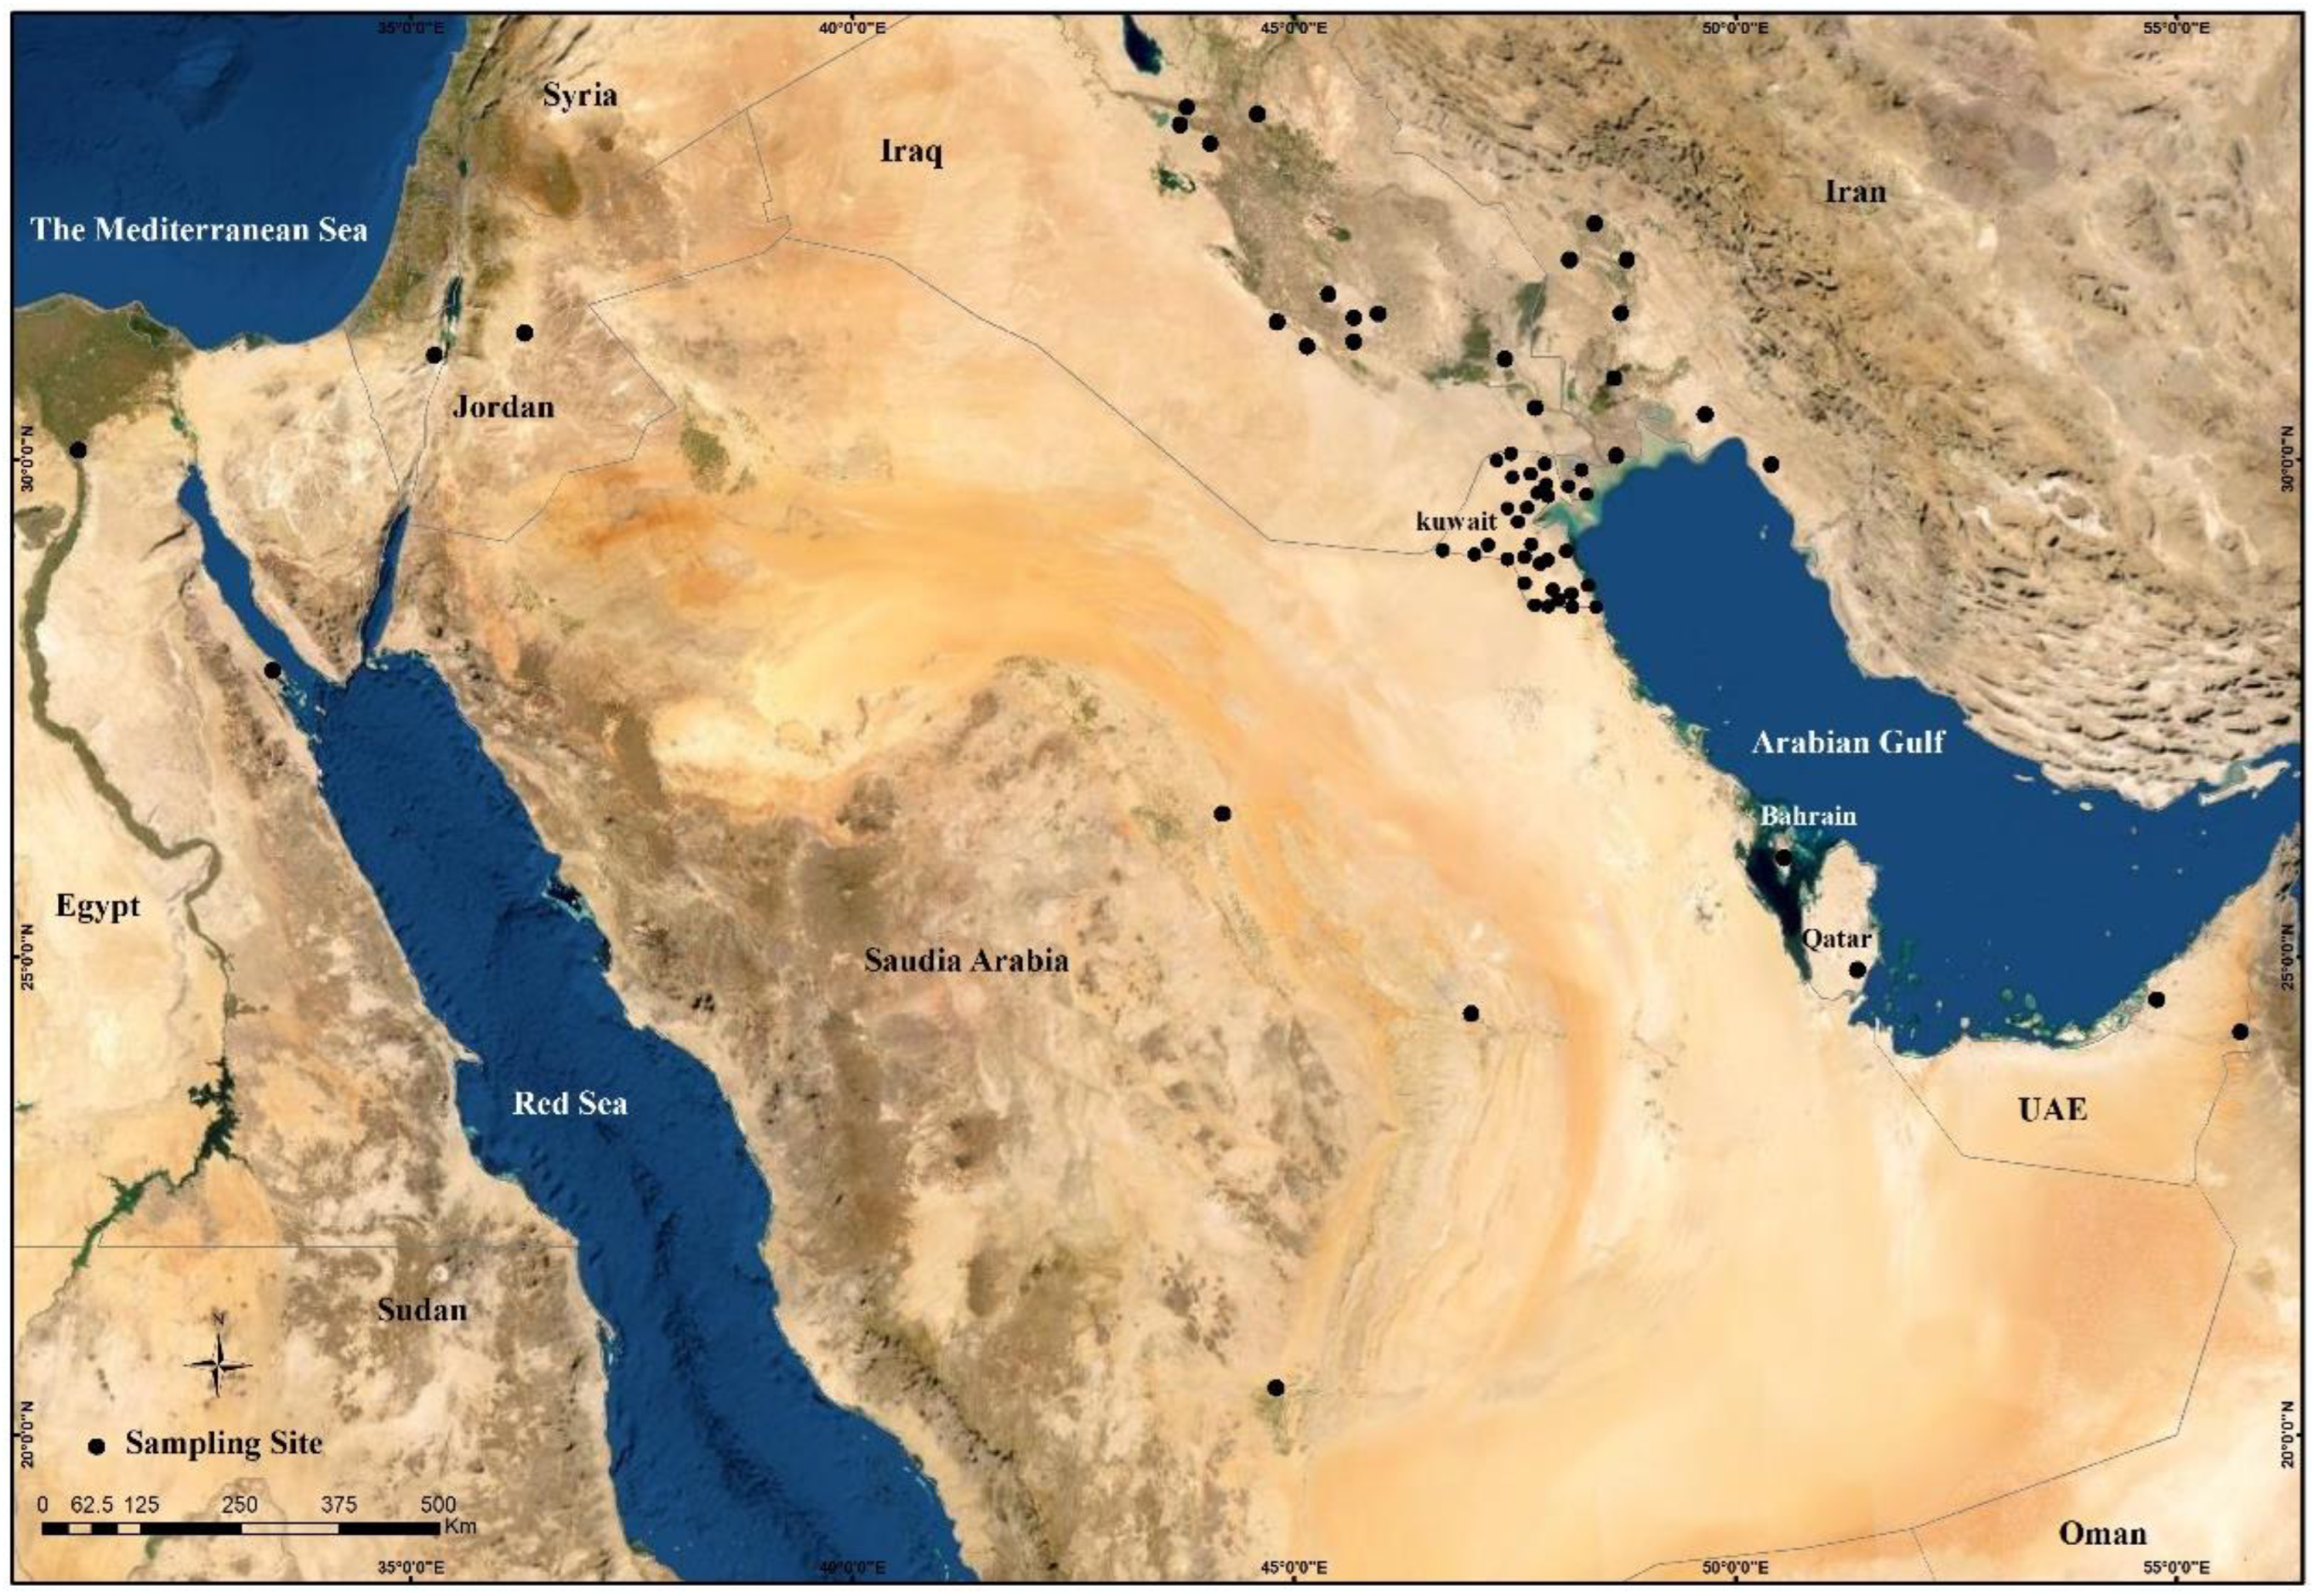
Meticulously, dust samples from building roofs (>10 m) were collected within the study area and surrounding areas and compared to various parts of the world samples to detect regional and worldwide variants in silica dust mineralogical and physical features. These include Um Qasir-Iraq, Manama-Bahrain, Qatar, the western (Wadi Dawasir) and eastern borders of the Empty Quarter Desert (Dubai and Ain at UAE), Amman-Jordan, Cairo-Egypt, and Dushanbe-Tajikistan (
Figure 4). In addition, the monthly and annual rates of deposited dust were monitored in Kuwait (located downwind of the two main SDS hotspots using 42 dust traps with 1008 as a total sample for two years from 1st of September to 31st of August for comparison, following the design of [
21,
22] and later modified by several researchers [
15,
23]. Around thirty surface sediment samples in a line transect from upwind to downwind were collected from the hotspot (A) during 20–26 April 2019 covering the borders and center of the hotspot area.
A laser granulometric analyzer was used to estimate particle size percentages. The BET (Brunauer, Emmett, and Teller equation) surface area is measured in this study using Coulter SA 3100 and is represented in terms of values for a certain weight of loose particles in terms of m2g−1. The samples were softly crushed and examined using the Philips PW-1830 Powder Diffractometer X-ray diffraction (XRD), and using the X’Pert II program, the output data were semi-quantitatively calculated.
The dust samples were prepared in a vial counting geometry for radioactivity measurements. The total net dry weight ranges between 15 g and 0.5 g, kept in a small vial (3 cm length and 1 cm diameter) and stored for about three weeks to achieve the materialistic stability between the 222Rn and its progenies 214Pb and 214Bi for determining the 226Ra content. The prepared samples were counted by a gamma spectrometry system with an exceptionally low energy resolution Canberra Broad Energy Germanium (BEGe) detector (FWHM @ 122 keV is 750 eV). The sample counting time was long enough to get an excellent statistical peak area. The massic activities of the natural radionuclides (40K, 224Ra, 226Ra, 228Ra, and 234Th) and 137Cs were determined using certified calibration standard sources.
The satellite imagery data (
Table 1) was collected from multi-sensors from different sources. The atmospheric correction (AC) process for remote sensing is a method of removing the atmospheric effects on the image reflectance values taken by satellite sensors. For removing the effects of the atmosphere using the radiometric calibration tool in ENVI software to calibrate image data to radiance and reflectance. The Normalized Difference Vegetation Index (NDVI) is calculated for the record period from 1984 to 2020 as the difference between the difference and the sum of the refracted near-infrared and red radiations to find change detection for vegetation cover in the two SDS hotspots. The AERONET measurements and MODIS satellite imagery for the sun photometers at Kuwait University in east Kuwait (29°19.5′ N, 47°58.3′ E) are attained from the AERONET (
https://aeronet.gsfc.nasa.gov (accessed on 15 June 2022) web page.
4. Results and Discussion
The SDS shape and size are principally controlled by two key elements: the wind (direction and speed) and topography. There are other SDS classifications that depend on visibility, wind seed [
19], and particulate matter (PM10) [
24]. On the other hand, the SDS dimensions (width and length) are a key factor as larger scale SDS can affect wider areas than the short one. Therefore, this study takes into consideration to put a special classification depending on SDS dimensions. There were 178 SDS events were detected from 19th March 2003 to 13th June 2021 by meteorological stations in the region. Thus, the satellite images of the 178 SDS events were collected in the region. Each SDS dimensionally has a short (maximum width) and a long (maximum length) axis in its mature form the hotspot to the end. In reference to the short axis (the width), there are three main forms of SDS in the Middle East; namely: small, intermediate, and extensive. Among the three main SDS, there are 12 minor forms of sand and dust storms (
Figure 5) as follows:
- 1.
Small (with width <100 km from the core of the SDS).
- a.
Has three sub-forms (needle-like, arrow shape-straight, and arrow shape-curved).
- 2.
Intermediate (300–100 km width),
- a.
Has three sub-types (straight, curved, and hook)
- 3.
Extensive (SDS with 300 km width or more)
- a.
Encloses six sub-forms (agglomerated–dispersed, agglomerated–dense, wavy, hook–multiple heads, and Spiral Hook–single head),
NASA’s Terra, MODIS (Moderate Resolution Imaging Spectroradiometer) satellite displays brown areas where plants were growing less than they did on average between 2000 and 2008. The MODIS image shows the deterioration of vegetation in the south including the two hotspot areas. Compared to African (Saharan) dust, Arabian dust has multiple sources. The source that has the highest AODs in the Eastern Province of Saudi Arabia, followed by the Nafud desert. The dust characteristics measurements made by CALIPSO are reliable, and the record length is considerable both seasonally and inter-annually. Measurements are useful for assimilation (into) and validation of dust transport models. CALIOP Monthly Mean Dust Aerosol Optical Depth 532 nm, All-sky at night, 2006–2019 (
Figure 6a). CALIPSO monitored the vertical distribution of dust plumes downwind of the two hotspots on a regular basis. The dust stretched from the surface to a height of 6 km near Kuwait City, according to the vertical feature mask (
Figure 6b,c). The development of dust microphysical characteristics was studied using the volume depolarization ratio, which was shown to rise with longitude, indicating a steady change in dust properties as it moved westward. The total attenuated backscatter CALIPSO observation on 8 July 2019, at night, shows a small arrow curved type of SDS from the area (A) towards Kuwait and the northern Arabian Gulf (
Figure 7).
The downwind part (Kuwait) of the two SDS hotspots receives yearly around 373 tons.km
−2 of fallen dust. The deposited dust downwind of the two hotspots A and B was measured from September to August for two years; in Kuwait, yearly dust levels ranged from 10 to 1065 t/km
2, with an average of 278 t/km
2. (
Figure 8a,b). According to Safar (1980), Kuwait at downwind of the two hotspots has an annual average of 255.4 dusty days (SDS, rising dust, suspended dust, and haze).
The first year was found to be 43% dustier compared to the second year. The annual SDS days and average within the SDS source area (A) are about 8 and 15 times more in comparison to the downwind and upwind, respectively, from the source (
Table 2). The SDS occasionally occurs more during summer and spring, respectively. The deposited dust annual rates that fall into the Arabian Gulf that originated from the main sources, including the two SDS hotspots, are the highest when compared to all seas and oceans (around 10,330 tons for each cubic kilometer volume of water) [
25]. About 40 million people in the region are suffering from the two hotspots, including populations in Iran, Iraq, Kuwait, Bahrain, Saudi, Emirates, and Qatar. Two SDS hotspot locations were identified in the Mesopotamian Flood Plain using 30 years of satellite measurements. Both hotspots encompass roughly 8212 km
2 and contribute 11%, 42%, 38%, 83%, 85% in 2005, 2012, 2018, 2020, and 2021, respectively, of the total SDS in the region (
Figure 9). The SDS originated from the two hotspots that can cover the whole of Arabia and the Arabian Gulf (
Figure 10).
Comparing results of the Corona Satellite imagery in 1984 and 1991, the reclaimed lands increased through this period from 11,491 km
2 to 12,824.7 km
2, while the bare areas decreased to 3649 km
2 and the waterbody decreased. By comparing the boundaries of the area between 1968 and 1984 (
Figure 11), it is clear that the bare lands increased while wetlands decreased due to soil degradation due to the drying up of ponds and swamps and their conversion to agricultural lands. The bare areas between 1984 and 1991 increased in comparison to reclaimed lands, which may be a result of the lack of water in the Mesopotamian Flood Plain region, while the bare land in the years 1991 and 2000 decreased with an increase in the area of cultivated land, which makes its soil vulnerable to desertification during harvest times, especially in the summer (
Figure 11). The bare areas have shrunk significantly, as they decreased in the years 2000, 2013, and 2020 (
Figure 11). There is clearly a decrease in bare areas by 1053.2 km
2 for SDS hotspot (A) and about 1783.1 km
2 for hotspot (B) (
Table 3), due to the increase in the area of cultivated land in 2020. The change series in the total area of the two SDS hotspots during 1968, 1984, 1991, 2000, 2013, and 2020 are illustrated in
Figure 12.
4.1. The Mineralogical Content
The mineralogy of dust fallout constitutes percentages in the source area compared to upwind and downwind are presented in (
Table 4). Quartz, carbonates, and feldspar are the major mineral percentages in deposited dust. Generally, the carbonates ratio is the highest during the spring and winter seasons (October–April). Between October and April, the carbonates in the falling dust in Kuwait increased by up to 58 percent. Carbonates, which make up a large part of the mineralogy of dust fallout, are strong markers of low aeolian activity in the area throughout the winter and spring. Low carbonates percentages in dust, on the other hand, are strong markers of significant aeolian activity throughout the summer (May–September). Dust in several parts of Kuwait revealed a decrease in carbonate percentages during September. The lowest percentages, down to 5% of the total weight of dust samples, are found in the northern and western regions of the wind corridor. Carbonates in collected dust range from 4 to 36.8% on a yearly basis, with an average of 27.6%. Coastal locations and Kuwait’s northeastern regions have the greatest carbonate percentages. Kuwait dust has almost identical levels of carbonates to that found in nearby regions such as Bahrain and Dubai, but differs significantly from that found in other regional locations, such as Um Qasir and Ahwar-Iraq on Kuwait’s northeastern side (
Table 1). This is due to dust storm paths that originate in Iraq and Iran, where carbonates and mud are abundant [
26,
27].
The main minerals found in ordinary deposited dust across the world are quartz and carbonates, with feldspars and clay minerals also present in significant quantities. The proportion of quartz varies from 13% in Um Qasr, Iraq, to 64% in Tripoli, Libya, with a national average of 38%. In general, the Middle East’s southern sector (the Empty Quarter region) has greater quartz percentages, whereas the northern sector (around the two hotspot zones) has higher carbonates (varying from 41 to 80 percent) and lower feldspar percentages.
The deposited dust in Iran is with exotic mineralogical content characterized by the lowest carbonate content, (Al, Fe, Mg, and Ca) element oxides, but the highest in (Ba, Cr, and Ni) in comparison to others in the Middle East (
Figure 13a). The deposited dust in the SDS hotspot (A) is characterized by high carbonate, but lower than upwind and downwind areas in the Middle East. Additionally, the dust from hotspot (A) and Kuwait shows the lowest in (Ba) compared to other regions in the Middle East (
Figure 13b).
4.2. Radionuclides Analysis
The average activity concentrations of the radionuclides in each country are presented in (
Figure 14). The average concentrations of the crustal origin radionuclides, such as
40K, radium, and thorium isotopes, were relatively comparable; however, there is clear evidence that the fallout origin radionuclides (
210Pb and
137Cs) concentrations were lower in Tajikistan. In contrast, the primordial radionuclide
40K concentration was the highest compared to the other countries (693 mBq g
−1). A multivariate analysis of the radionuclides concentrations and their locations in dust samples was performed (
Figure 2a,b) to understand the behavior of the radionuclide in the studied sites. The natural (
40K,
224Ra,
226Ra,
228Ra, and
234Th) and the fallout origin radionuclides (
210Pb and
137Cs) were well clustered (
Figure 2a).
137Cs had been injected into the atmosphere in the mid of the last century via nuclear bomb tests and nuclear power plant accidents (Aba et al., 2018). At the same time, 210Pb is a member of the Uranium series with a half-life time of 22.3 years produced through the decay of the radium subseries in the form of Radon gas. The radon gas exhaled from the soil surface into the air and formed a
210Pb Airborne aerosol. According to geographical and meteorological conditions, both radionuclides will be transported and deposited on the ground at different levels. The resuspension, deposition, and transportation of these radionuclides are complicated processes. Hence, drawing a solid concert statement is tricky, as the results are statistically limited. Even though general conclusions can be drawn based on (
Figure 14 and
Figure 15), the relatively low concentrations of
210Pb and
137Cs in Tajikistan samples compared to the other countries might be linked to the different origin and pathways of the dust that impacted the country. In contrast, the other three Middle east countries (Iraq, Kuwait, and Qatar) were clustered in one group, providing that they are vulnerable to similar dust origin and pathways. This conclusion is in line with those obtained by other researchers [
31].
6. Planned Control Measures
Treating shifting sand and suspended dust reduces the chances of SDS occurring from major sources (the two hotspots), which directly enhance health and social activities in the downwind regions (Southern Iraq, Ahwaz-Iran, Kuwait, and other gulf countries). Therefore, a four-year plan project will be implemented by the Kuwait Institute for Scientific Research (KISR), with a total cost of 21 million US dollars, to put control plans for hotspot (B) as it acts as the major source of SDS in southern Iraq. The activities that will be implemented to address the challenge will include:
Afforestation: Green belts and windbreaks using native plants (
Tamarix artaculata,
Atriplex halimus) and drought-resistant trees (
Prosopis juliflora) will be constructed and planted in the form of tapes to reduce wind action and give durability to treatment. Preparing seedlings of trees and shrubs, it is required to establish a specialized nursery for a production capacity estimated at 1–2 million seedlings per year, with the provision of the requirements for establishing the nursery, including wooden and plastic canopies, seeds, cuttings, plastic bags, employment of 20 workers, watering requirements, and transporting seedlings to afforestation sites. Providing water to afforestation sites is necessary, and water sources for irrigation will be drained via establishing channels from the main rivers within the general plan for the project duration (
Figure 20).
Mud coverage: through the use of heavy machinery (bulldozers and shafts), a layer of 25 cm thickness is placed to cover the present sand dunes in both hotspots, where the mud acts as heavy soils that hold together when rain falls, which reduces the chances of their movement by the wind, and thus, allows growth for native plants.
7. Conclusions
Two source locations (hotspots) for SDS in the southern part of the Mesopotamian Flood Plain were identified as hotspot areas (A) and (B). Both hotspots encompass roughly 5356 km2 and contribute 11% in 2005 to 85% in 2021 of the total SDS in the region. Both SDS hotspot areas are decreasing with time. Area (B) is covered by farms and cultivation and is expected to be completely stabilized by the end of 2022. On the other hand, area (A) acts as a major source of sand and dust storms. Therefore, a plan was put in action involving satellite remote sensing and robust transport models to locate the most effective sites for planting can be used to develop an effective reforestation strategy for this hotspot. The plan will include dredging channels and attributes from major rivers and water bodies covering the area to stabilize the SDS hotspot. The vertical distribution of dust plumes was regularly observed by the CALIPSO downwind of the two hotspots. The vertical feature mask shows that the dust extended from the surface to a height of ~6 km near Kuwait City. The evolution of microphysical properties of the dust was tracked using volume depolarization ratio and was found to increase with the longitude, indicating a gradual change in the dust properties as they are transported westwards.
Passing through particle size percentages all over the year, some average fallen dust samples from the coastal areas in Kuwait that are located directly downwind of two hotspots show trimodality, which is similar to the surface sediments in SDS hotspot (A). The natural (40K, 224Ra, 226Ra, 228Ra, and 234Th) and the fallout origin radionuclides (210Pb and 137Cs) were well clustered. In contrast, the other three Middle East countries (Iraq, Kuwait, and Qatar) were clustered in one group, providing that they are vulnerable to similar dust origin and pathways. On the other hand, the two hotspots (A and B) are characterized by the highest BET surface area for dust particles in comparison to all collected samples all over the world. The BET surface area for dust particles is decreasing with distance from all directions from the two hotspots (A and B). This can be attributed due to the high content of carbonates and clay minerals, which was reflected in the major and trace element quantities.
More research should be done on adapting to SDS by regulating or redirecting sand grain particles, which account for almost one-third of the overall dust percentages, particularly in desert regions. Additionally, more mitigation plans should be implemented around the affected urban areas in the region.


 ,
, 


