Article

Triskeles and Symmetries of Mean Global Sea-Level Pressure

by
Fernando Lopes
*,
Vincent Courtillot
and
Jean-Louis Le Mouël
Institut de Physique du Globe de Paris, Université de Paris, 75005 Paris, France
*
Author to whom correspondence should be addressed.
Atmosphere 2022, 13(9), 1354; https://doi.org/10.3390/atmos13091354
Submission received: 18 July 2022 / Revised: 16 August 2022 / Accepted: 21 August 2022 / Published: 25 August 2022
(This article belongs to the Section Biosphere/Hydrosphere/Land–Atmosphere Interactions)

Abstract

:
The evolution of mean sea-level atmospheric pressure since 1850 is analyzed using iterative singular spectrum analysis. Maps of the main components (the trends) reveal striking symmetries of order 3 and 4. The Northern Hemisphere (NH) displays a set of three positive features, forming an almost perfect equilateral triangle. The Southern Hemisphere (SH) displays a set of three positive features arranged as an isosceles triangle, with a possible fourth (weaker) feature. This geometry can be modeled as the Taylor–Couette flow of mode 3 (NH) or 4 (SH). The remarkable regularity and three-order symmetry of the NH triskeles occurs despite the lack of cylindrical symmetry of the northern continents. The stronger intensity and larger size of features in the SH is linked to the presence of the annular Antarctic Oscillation (AAO), which monitors the periodic reinforcement and weakening of the circumpolar vortex; it is a stationary mode. These components represent 70% of the variance in total pressure since 1850 and are stable in both time and space. In the remaining 30% of the variance, we have extracted quasi-periodical components with periods larger than 1 year (2% of the variance) and a harmonic sequence of the 1-year period (20% of the variance).

1. Introduction

Understanding the mean circulation of air masses is one of the most ancient problems in meteorology (cf. [1,2]). Solar insolation drives the first-order structure and motions of atmospheric masses. Early views thought them to be organized in planetary-scale circulation cells, arranged roughly symmetrically with respect to the Equator. In the troposphere, warm winds blow from the Equator, forming the top of the Hadley cells (cf. [3]); air cools, becomes denser and sinks near 30° (N and S), generating two belts of high pressures. The circuit is closed by return winds blowing towards the (low-pressure) Equator. Cold winds in the lower atmosphere blow from the poles to warmer regions; their density decreases as they approach 60° (N and S) latitude, where they rise. The circuit is closed by return winds in the troposphere, back to the polar high pressures, forming the polar cells. The Ferrel cells (cf. [4]) located between the polar and Hadley cells extend between 30° and 60° (N and S).
Lindzen and Hou [2] summarize the situation at the end of the first half of the 20th century: “By the early part of this century [5], the idea was being put forth that the zonally averaged circulation might, in large measure, be forced by eddies” …“[6] was going so far as to suggest that the symmetric circulation was inconsequential”. Schneider et al. [7,8] were probably the first to propose an explicit calculation of the symmetric circulation; they showed that purely symmetric circulations could maintain strong subtropical jets and contribute to the maintenance of surface winds. The symmetry of the mean heat received by the Earth was sufficient to force the symmetry of the cell structure, the symmetry of the subtropical currents and the general wind pattern.
Based on a decade of observations (1963–1973), [2] found that as soon as the peak heating is a few degrees in latitude off the Equator, profound asymmetries in the Hadley circulation occur, with the summer cell becoming negligible. The annually averaged Hadley circulation is much larger than that forced by the annually averaged heating.
We know that the heat coming from the Sun’s activity varies with time (e.g., [9,10,11,12,13,14,15,16,17,18]) and so does the inclination of our planet’s rotation axis (e.g., [19,20,21,22,23,24,25,26,27,28]). Consequences of these two variabilities are expected to affect the atmosphere, and in particular the climate (e.g., [10,13,14,19,22,29,30,31,32,33,34,35,36,37,38,39,40]). To these already complex interactions, one must add those due to the ocean, the largest heat exchanger that warms and cools on its own (longer) time scales. Lindzen [41] was the first to show how (to the first order) atmospheric circulation was forced by the physics of the ocean surface.
Interest in recent climate warming has led to the question of how the convection cells, and in particular the Hadley cells, being the main ones, react to a temperature increase (e.g., [42,43,44,45,46,47,48,49,50,51]). Additionally, how do these variations affect extreme meteorological events (e.g., [52,53,54,55,56])? Most authors who have studied the space-time evolution of convection cells call upon the analysis in terms of components of sea-level pressure (SLP). SLP is directly related to climate indices (e.g., [35,57]). Decomposition methods often use “Empirical Orthogonal Functions” (EOF). In this paper, we select an alternate method: the time decomposition of SLP using “Singular Spectrum Analysis” (SSA, e.g., [58], a method that we have used extensively with success in some recent works (e.g., [16,17,18,23,25,27,28].
The SSA method is presented in Section 2, the SLP data we use are described in Section 3, their analysis using SSA and the results are discussed in Section 4, a model is introduced in Section 5, and the conclusion formed is presented in Section 6.

2. The Singular Spectrum Analysis Method

SSA was popularized in the geophysical community by the paleoclimatology community in the early 1990s [59,60,61]. These authors developed it with the aim of making up for the limitations of Fourier transform (FT), detecting quasi-periodic components as opposed to perfectly periodic ones in FT, analysis of signals with irregular sampling or mending gaps in the data. Their work was mainly focused on climatic and paleoclimatic series. The method is curiously under-used in our view. We direct the reader interested in knowing all the details of the method to [58], a book with the full, robust mathematical treatment of SSA.
SSA can be summarized in four steps. Let us consider a discrete (nonzero) time series ( X N ) of length N (N > 2):
X N = ( x 1 , , x N ) .

2.1. Step 1 (Embedding Step)

X N is divided into K segments of length L in order to build a matrix X with the dimensions K × N where K = N L + 1 will condition our decomposition. This is the first “tuning knob”. Integrating X yields a Hankel matrix:
X = x 1 x 2 x 3 x K x 2 x 3 x 4 x K + 1 x 3 x 4 x 5 x K + 2 x L x L + 1 x L + 2 x N
Embedding, the first step in an SSA, consists in projecting the one-dimensional time series in a multidimensional space of series X N such that vectors X i = ( x i , , x i + L 1 ) t belong to R L , where K = N L + 1 . This definition was introduced by Mañé [62] and Takens [63], with the aim of building a space in which strange attractors could be described correctly, often a Banach space. A strange attractor is an object whose dynamical properties may change and evolve into chaos (that is by nature nonlinear). The parameter that controls the embedding is L, the size of the analyzing window, an integer between 2 and N 1 . The Hankel matrix has a number of symmetry properties: its transpose X t , called the trajectory matrix, has the dimension K. Embedding is a compulsory step in the analysis of nonlinear series. It consists formally in the empirical evaluation of all pairs of distances between two offset vectors, delayed (lagged) in order to calculate the correlation dimension of the series. This dimension is rather close to the fractal dimension of strange attractors that could generate that type of series. In this case, it is advised to select for the size of window L very small values (and thus a very large K). On the contrary, for SSA, L must be sufficiently large, so that each vector contains an important part of the information contained in the initial time series. From a mathematical point of view, one must work in the frame of Structural Total Least Squares for a Hankel matrix [64]. This is quite different from the fractal dimension mentioned above. Another benefit of considering a very large L is the possibility of considering sub-vectors X i as independent sub-series with distinct dynamics, and thus to be able to identify common characteristics in collections of these sub-series.

2.2. Step 2 (Decomposition in Singular Values—SVD)

SVD [65] of nonzero trajectory matrix X (dimensions L × K ) takes the shape:
X = i = 1 d λ i U i V i t
where the eigenvalues λ i ( i = 1 , , L ) of matrix S = XX T are arranged in order of decreasing amplitudes. Eigenvectors U i and V i are given by:
V i = X T U i / λ i
The V i form an orthonormal basis and are arranged in the same order as the λ i . Let X i be a part of matrix X such that:
X i = λ i U i V i t .
Embedding matrix X can then be represented as a simple linear sum of elementary matrices X i . If all eigenvalues are equal to 1, then decomposition of X into a sum of unitary matrices is:
X = X 1 + X 2 + + X d
where d is the rank of X ( d = rank X = m a x { i | λ i > 0 } ). SVD allows one to write X as a sum of d unitary matrices, defined in a univocal way.
Let us now discuss the nature and the characteristics of the embedding matrix. Its rows and columns are sub-series of the original time series (or signal). The eigenvectors U i and V i have a time structure, and they can be considered as a representation of temporal data. Let X be a suite of L lagged parts of ( X and X 1 , , X K ) the linear basis of its eigenvectors. If we let:
Z i = i = 1 d λ i V i
with i = 1 , , d , then the relation (5) can be written:
X = i = 1 d U i Z i t
that is, for the jth elementary matrix:
X j = i = 1 d z j i U i
where z j i is a component of vector Z i . This means that vector Z i is composed of the ith components of vector X j . In the same way, if we let:
Y i = i = 1 d λ i U i
we obtain for the transposed trajectory matrix:
X j t = i = 1 d U i Y i t
which corresponds to a representation of the K lagged vectors in the orthogonal basis ( V 1 , …, V d ). One sees why SVD is a very good choice for the analysis of the embedding matrix, since it provides two different geometrical descriptions.
Remark 1.
There are very strong common features between performing an SVD of the trajectory matrix, as is done in SSA, and multivariate analyses in principal components (PCA) or Karhunen–Loève (KL) decompositions, which are commonly found in time series analysis. SSA differs in the nature of its trajectory matrix, a Hankel matrix with a particular structure: its rows and columns are sub-parts of the signal to be analyzed. They both have a meaning, obviously a temporal physical meaning. Such is not the case for PCA or KL.
Remark 2.
In general, the orthonormal basis ( U i ) associated with the trajectory matrix and obtained through SVD can be replaced by any orthonormal basis ( P i ). In that case, Equation (6) becomes X i = P i Q i t with Q i = X t P i , for those who want to perform a Fourier analysis with an orthonormal basis made of sine functions. A classical example of an alternate basis is that of the eigenvectors of a self-covariant matrix (Toeplitz SSA).

2.3. Step 3 (Reconstruction)

As we have seen, X i matrices are unit matrices, and (as in the classical approach) one can “re-group” these matrices into a physically homogeneous quantity (or energetically homogeneous, etc…). This is the second “tuning knob” of SSA. In order to regroup the unit matrices, one divides the set of indices i { 1 , , d } into m disjoint subsets of indices { I 1 , , I m } .
Let I be the grouping of p indices of I = { i 1 , i 2 , , i p } ; because (6) is linear, the resulting matrix X I that regroups indices I can be written:
X I = X I 1 + X I 2 + + X I m
This step is called regrouping the eigen triplets ( λ , U and V). In the limit case m = d , (12) becomes exactly (6), and we find again the unit matrices.
Next, how can one associate pairs of eigen triplets? This means separating the additive components of a time series. One must first consider the concept of separability.
Let X be the sum of two time series X ( 1 ) and X ( 2 ) , such that x i = x i ( 1 ) + x i ( 2 ) for any i [ 1 , N ] . Let L be the analyzing window (with fixed length), and X, X ( 1 ) and X ( 2 ) the embedding matrices of series X , X ( 1 ) and X ( 2 ) . These two sub-series are separable (even weakly) in Equation (6) if there is a collection of indices I { 1 , , d } such that X ( 1 ) = i I X i , respectively, if there is a collection of indices such that X ( 1 ) = i I X i .
In the case when separability does exist, the contribution of X ( 1 ) for instance corresponds to the ratio of associated eigenvalues ( i I λ i ) to total eigenvalues ( i = 1 d λ i ).
Still, in the case of relation (6), let I = I 1 be the set of indices corresponding to the first time series, with corresponding matrix X I 1 . If both this matrix and that corresponding to the second time series ( X I 2 = X X I 1 ) are close or identical to a Hankel matrix, then the time series are approximately or perfectly separable. So, regrouping SVD components can be summarized by the decomposition into several elementary matrices, whose structure must be as close as possible to a Hankel matrix of the initial trajectory matrix (this is true on paper only; in reality things are much more difficult).

2.4. Step 4 (the Diagonal Mean, or Hankelization Step)

The next, final step consists in going back to data space, that is, to calculate time series with length N associated with sub-matrices X I . Let Y be a matrix with the dimensions L K and for each element y i , j we have 1 i L and 1 j K . Let L * be the minimum and K * be the maximum. One always has N = L + K 1 . Finally, let y i j * = y i j if L < K and y i j * = y j i otherwise. The diagonal average applied to the kth index of time series y associated with matrix Y gives:
y k = 1 k m = 1 k y m , k m + 1 * 1 k L * 1 L * m = 1 L * y m , k m + 1 * L * k K * 1 N K + 1 m = k K + 1 N K + 1 y m , k m + 1 * K * k N *
The relation (13) corresponds to the mean of the element on the antidiagonal i + j = k + 1 of the matrix. For k = 1 , y 1 = y 1 , 1 . For k = 2 , y 2 = ( y 1 , 2 + y 2 , 1 ) / 2 , etc …
Thus, one reconstructs the time series with length N from the matrices of step 3. If one applies the diagonal mean to unit matrices, then the series one obtains are called elementary series. Note that one can naturally extend the SSA of real signals to complex signals. One only has to replace all transposed marks with complex conjugates.
As mentioned above, step 3 is the most difficult part. We have chosen one approach among many others: iterative SSA (iSSA). Since the relation (6) is linear, we can iterate the decomposition. We start with a small value of L (we are looking for the longest period) that we increase until obtaining a quasi-Hankel matrix (step 1 and 2). We then extract the corresponding lowest frequency component that it subtracted from the original signal. We increase again the value of L to find the next component (shortest period). The algorithm stops when no pseudo-cycle can be detected or extracted. In this way, we scan the series from low to high frequencies.

3. The SLP Data

The SLP data are maintained by the Met Office Hadley Centre https://www.metoffice.gov.uk/hadobs/hadslp2/data/download.html (accessed on 24 October 2020). They are available in map form for global pressure every month since 1850 to the present, with a spatial sampling of 5 ° × 5 ° . As indicated by the Met Office, the series is not homogeneous in time (two intervals from 1850 to 2004 and 2005 to 2020 in which the means are homogeneous but the variances differ). Allan et al. [66] discuss the locations and number of ground observations they used to build the series. We show the map of mean pressures from 1850 to 2020 in Figure 1.
The map in Figure 1 is very similar to that obtained from simply averaging monthly SLP maps, demonstrating the very stable geometry of the global atmospheric structure. Well-known patterns are clearly rendered by the map: in the Southern Hemisphere, the structure is dominated by three large positive features in the southern parts of the main oceans (Pacific, Atlantic and Indian), separated by the southern ends of the three southern continents (South America, South Africa and Australia). This approximate three-fold symmetry actually seems to “leak” into a four-fold symmetry: the positive feature extending from Australia to western South America can be described as exhibiting two weaker features, the one over Australia and east of it being the weakest.
The pattern in the Northern Hemisphere is similar to that in the Southern Hemisphere, with two features extending over the northern Pacific and Atlantic oceans, similar to the southern structure, but with the third positive anomaly lying over the Asian continents (Central Asia and Tibet). This overall structure of global positive pressure features could be roughly described as the intersection of a series of three strong cylinders and one weaker cylinder, parallel to the Earth’s axis of rotation, with the Earth’s surface. South of 40°S latitude, the features turn negative and form the quasi-circular Antarctic oscillation (AAO), also known as the Southern Annular Mode (SAM), a belt of low pressures surrounding the frozen continent (e.g., [67,68]). A zonal average of Figure 1 is not really consistent with the classical latitudinal description of the Hadley, Ferrel and polar cells, with relatively moderate low pressures over the equatorial belt, high pressures around 30°N and lower values at higher latitudes, particularly over AntarcticaThe overall averaged zonal structure is not symmetrical with respect to the Equator [2].
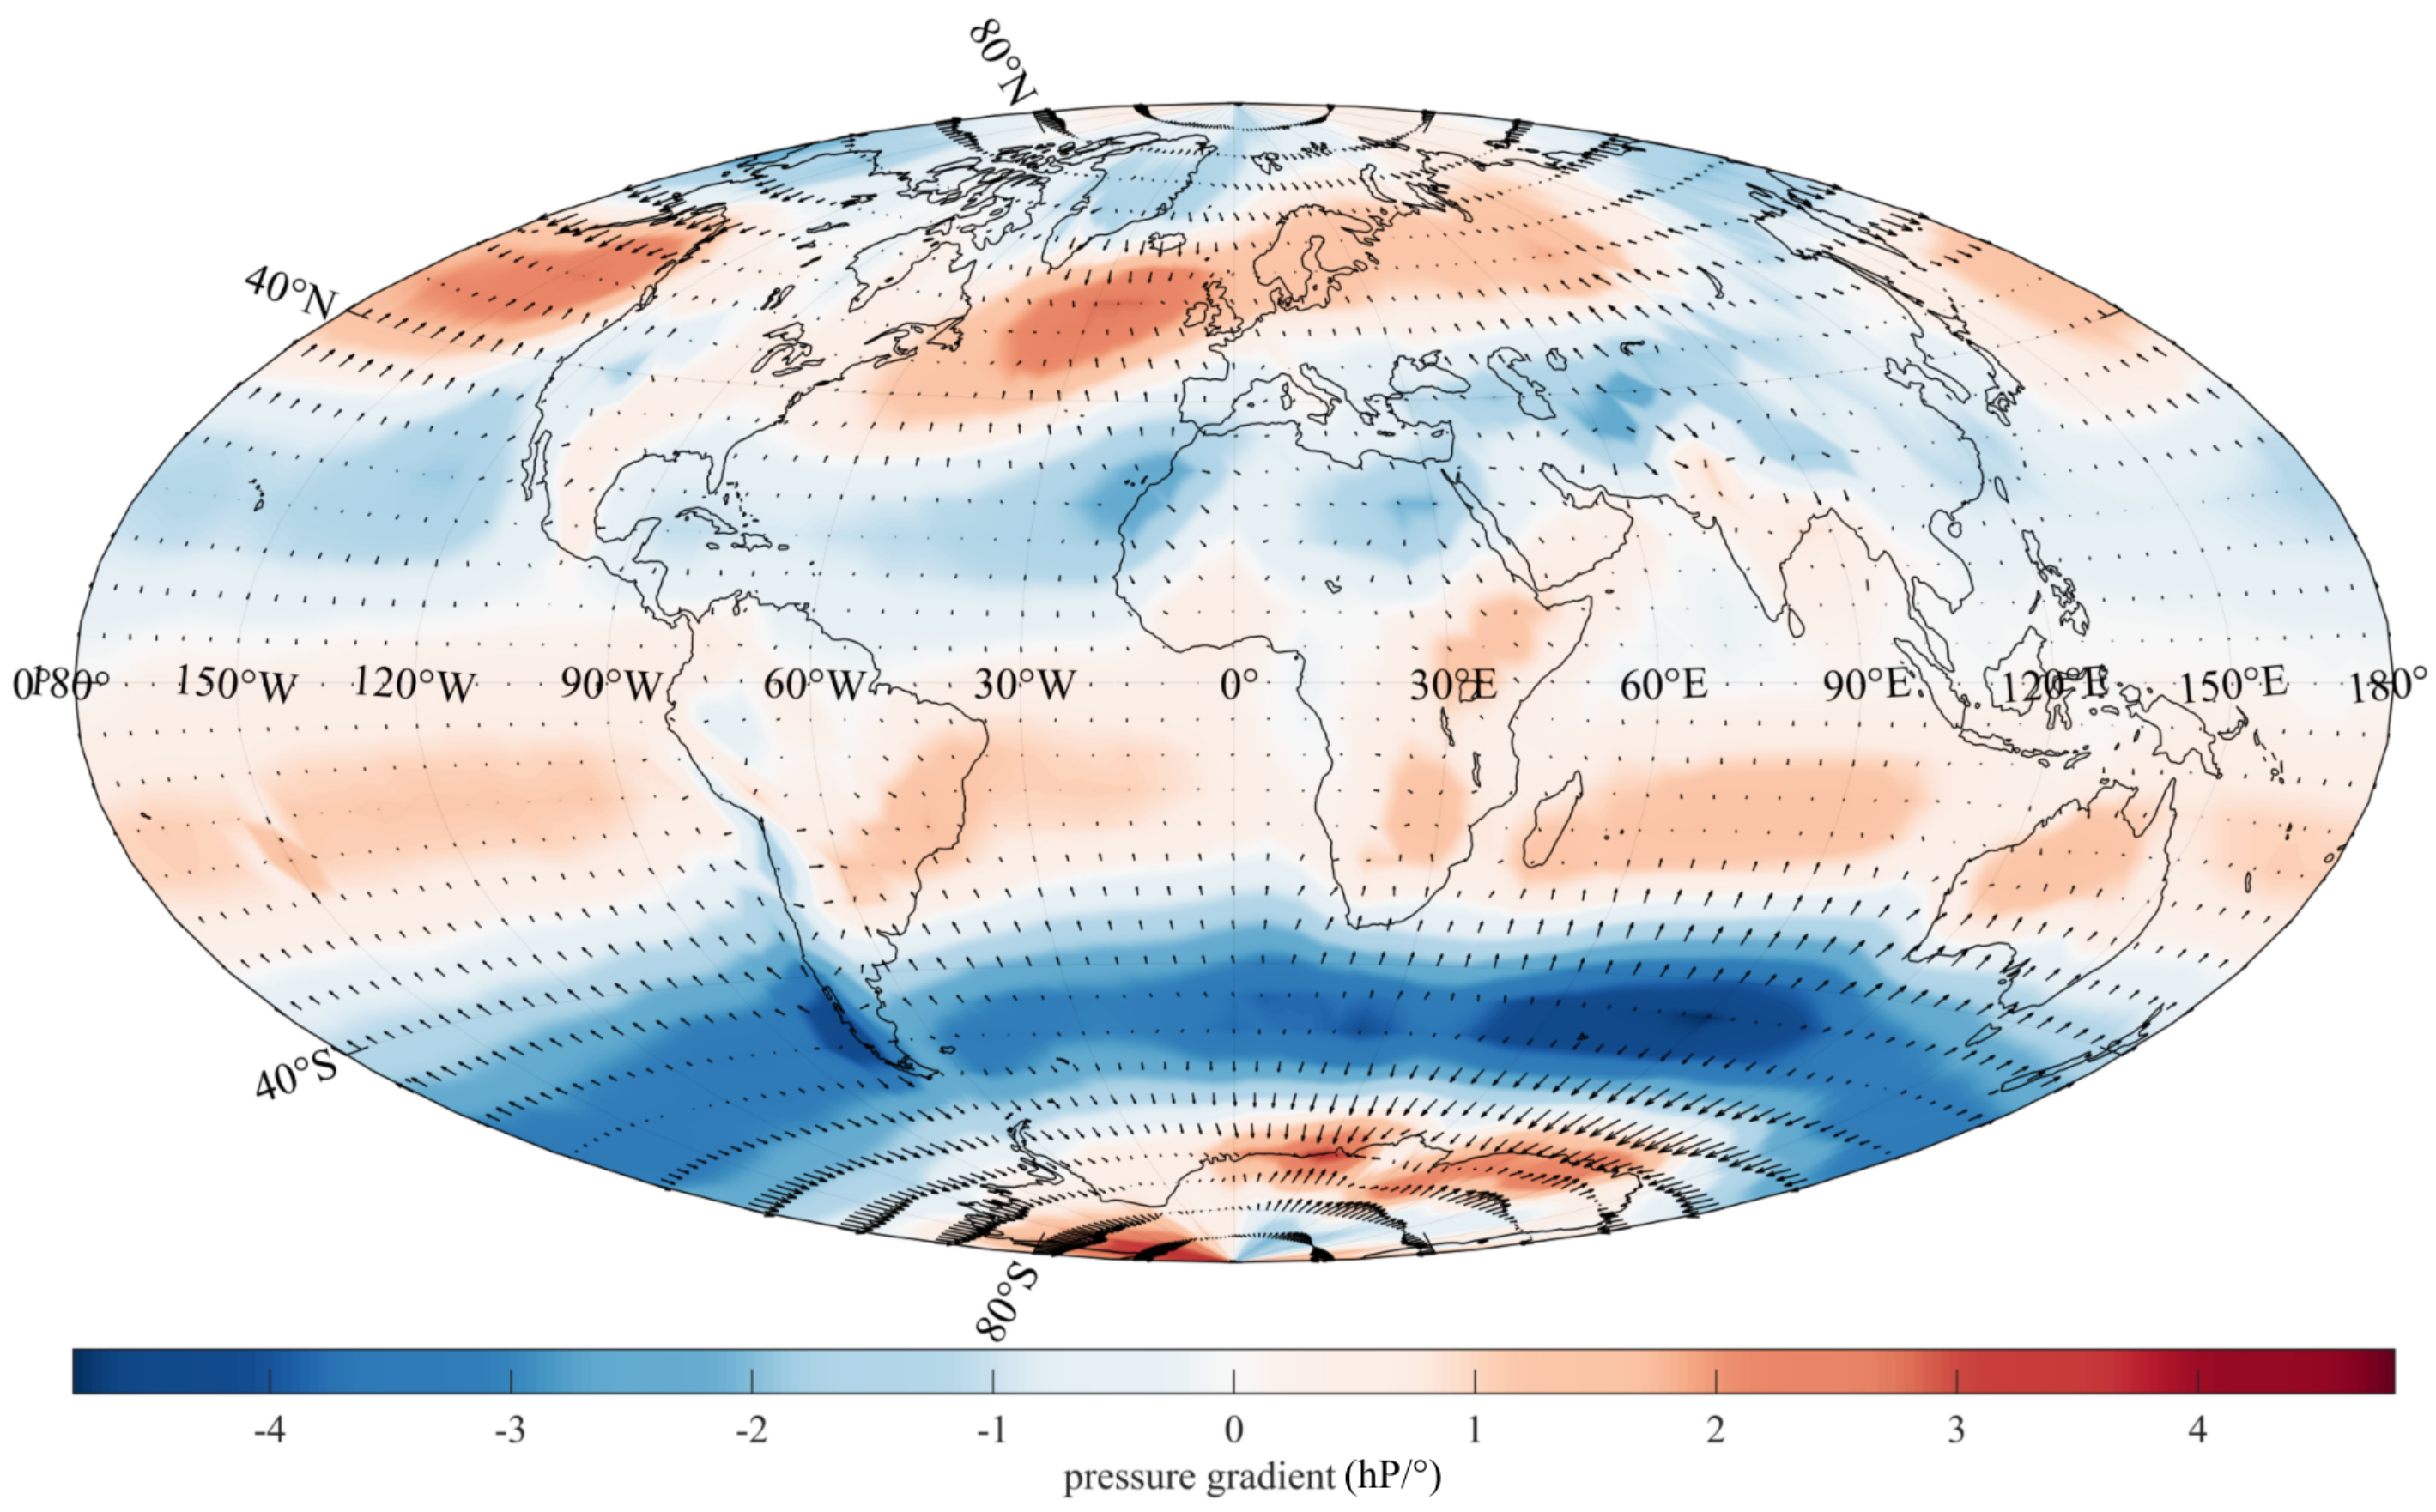
Winds are proportional to the space derivative of pressure (Figure 2, which is the map most people are familiar with), and thus in space-phase quadrature with pressure features. The space derivative is a high-pass operator which exacerbates discontinuities and promotes oscillations one order higher than the causative features. Figure 2 shows how winds (the gradients of pressure) are slowed or suppressed by continental masses; additionally, the red and blue “anomalies” are often paired, which reminds one of Laplace’s statement that the vector sum of winds must be close to zero at any instant.

4. The SSA of SLP Data

Rather than building a map of spatial likelihood of pressure structures at a given time, we build the time series of pressure for each couple of (longitude, latitude) coordinates. These are analyzed using the method of iterative singular spectrum analysis (iSSA, e.g., [58]); each time series is decomposed into a sum of a trend and periodic or quasiperiodic components.
Note: the trend is the first component “extracted” by SSA. It is a sort of mean with respect to time, a nonoscillating function of time; it should not be confused with the spatial mean of maps in time (see, for example, Figure 2).
The trend (∼1008 hP), that is, the first and largest SSA component, represents more than 70% of the total variance (sv) of the original series. The sequence of the next quasi-periodic components is, in decreasing order of periods, ∼130 years (∼0.7 hP, ∼0.06% of the sv; [69]), ∼90 yr (∼21 hP, ∼1.9% of the sv; [70,71]), ∼50 yr (∼0.2 hP, ∼0.02% of the sv), ∼22 yr (∼0.50 hP, ∼0.04% of the sv; Hale cycle, [72]), ∼15 yr ( ∼0.2 hP, ∼0.02% of the sv, upper bound of the Schwabe cycle; [73], ∼4 yr (∼0.3 hP, ∼0.03% of the sv), ∼1.8 yr (∼0.3 hP, ∼0.03% of the sv), then 1 yr ( ∼93 hP, ∼8.3% of the sv), 0.5 yr (∼65 hP, ∼5.8% of the sv), 0.33 yr (∼44 hP, ∼3.9% of the sv) and 0.25 yr (∼21 hP, ∼ 1.9% of the sv) [74].
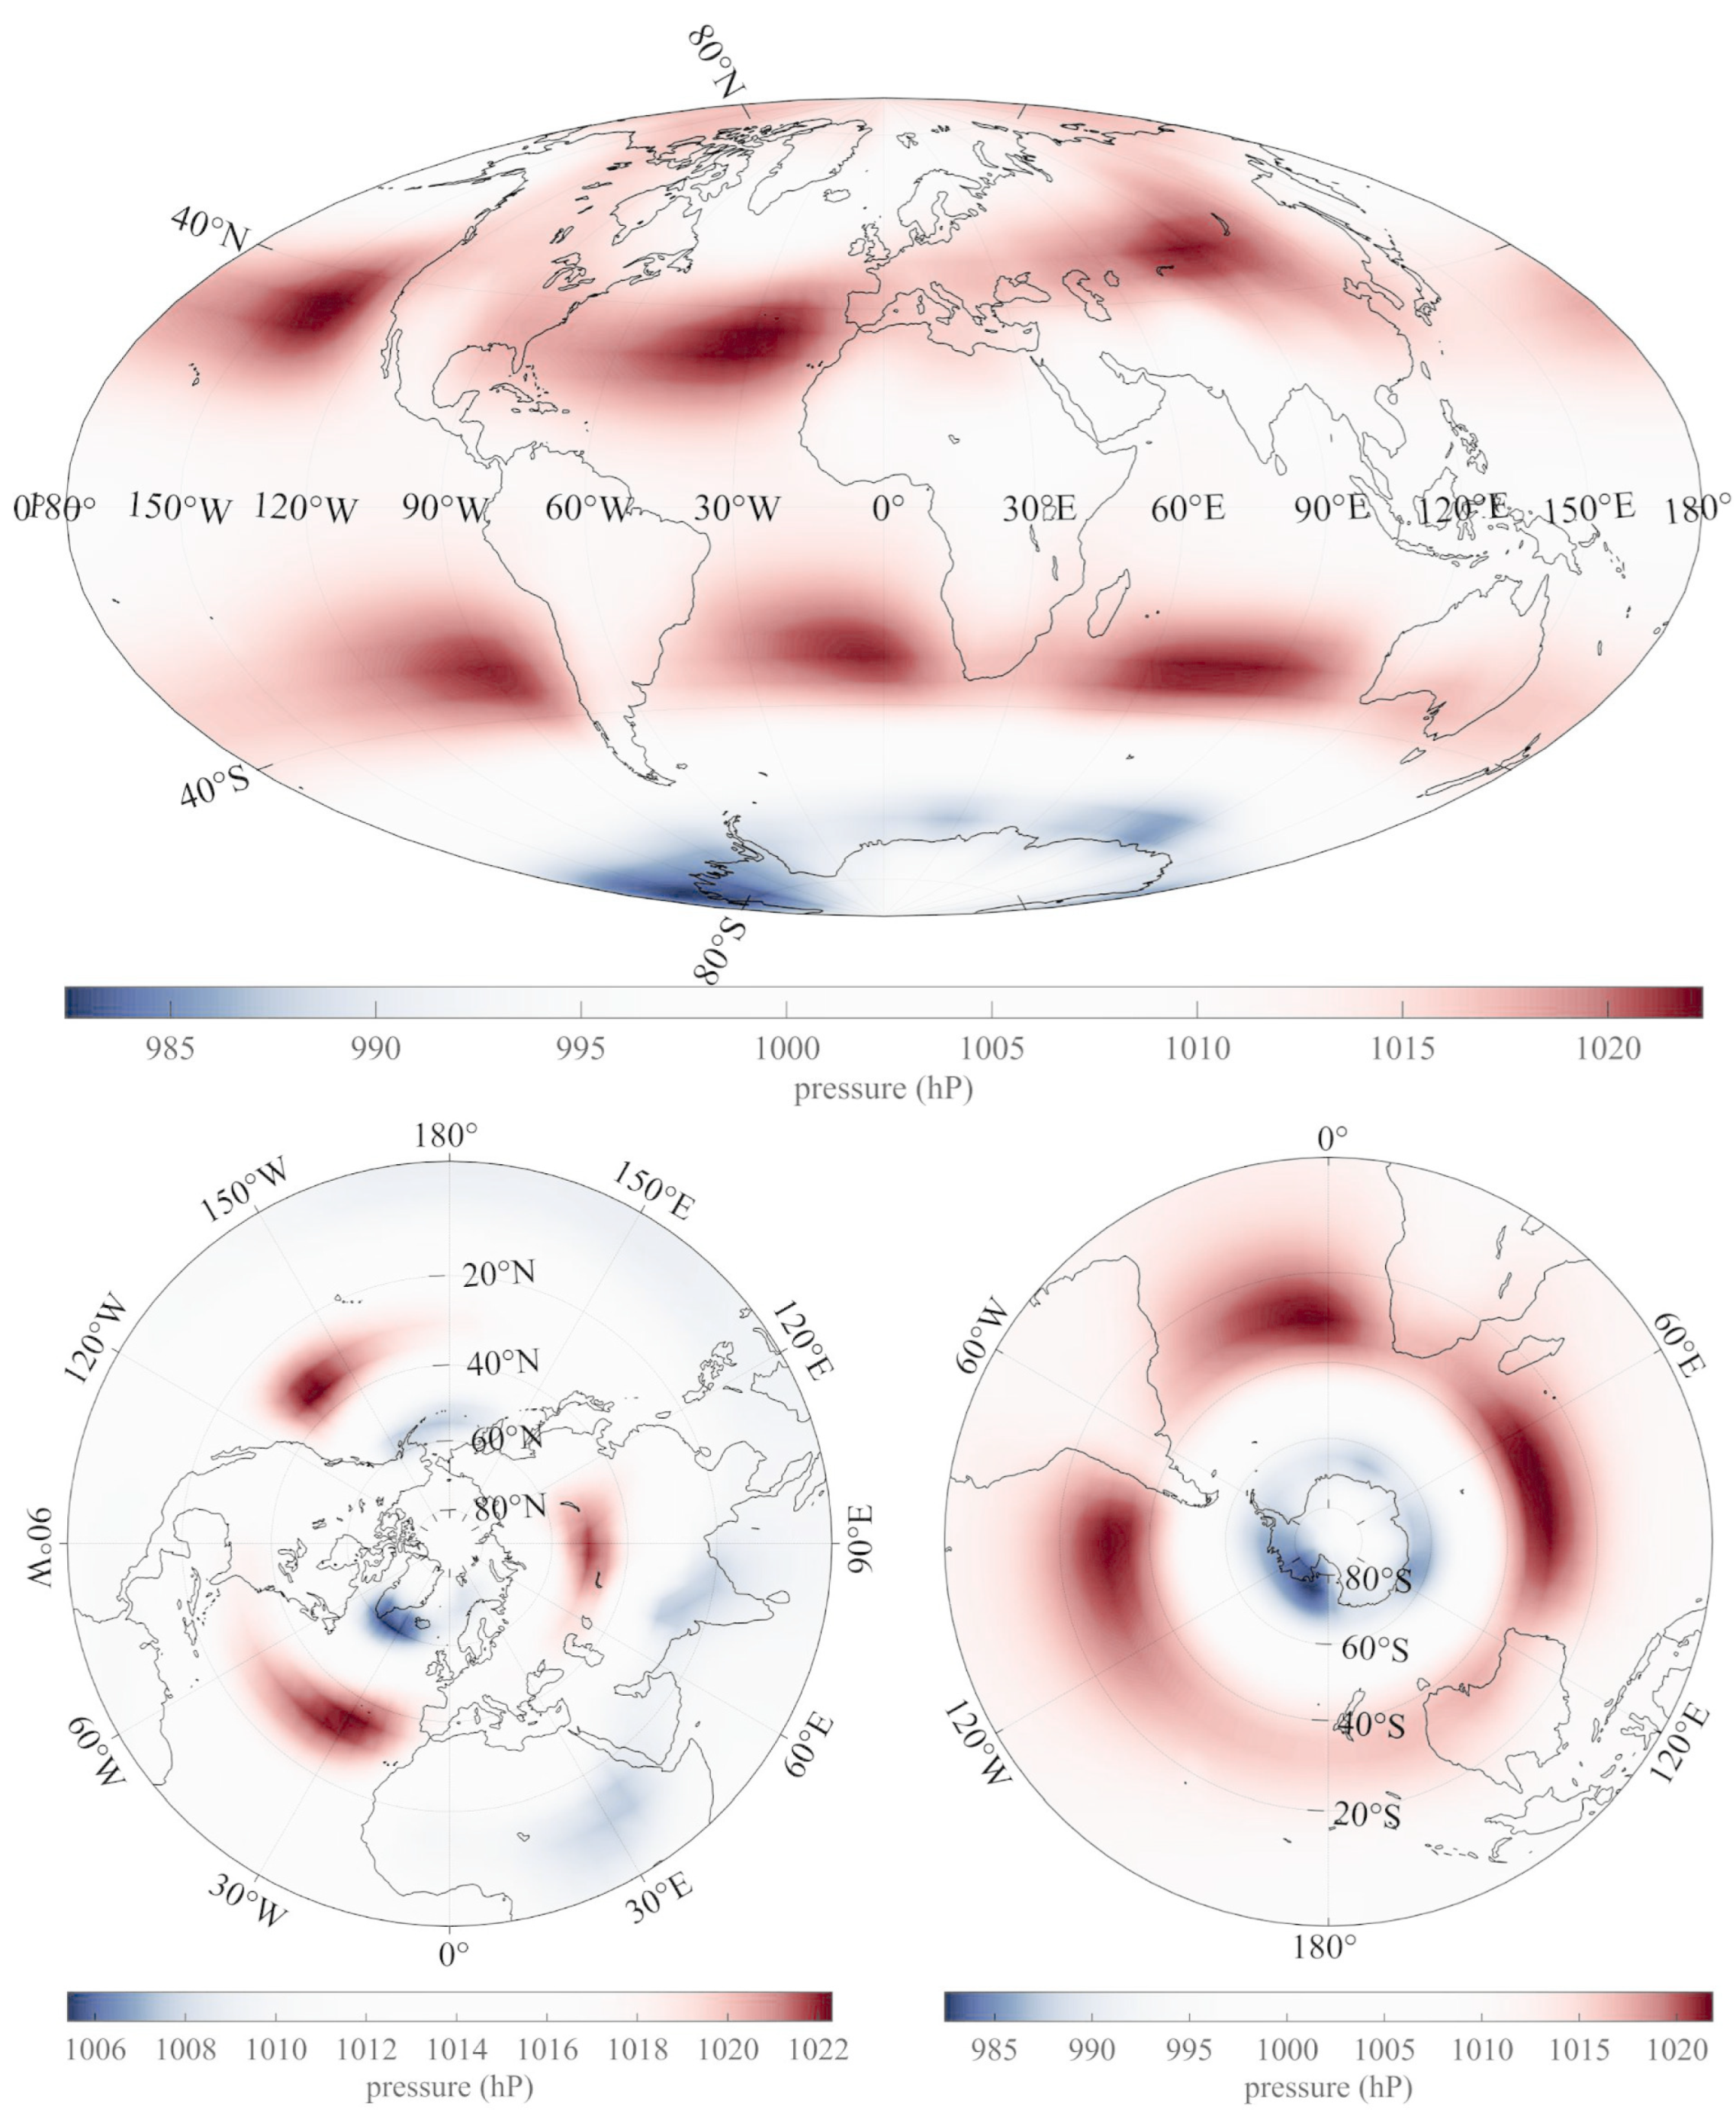
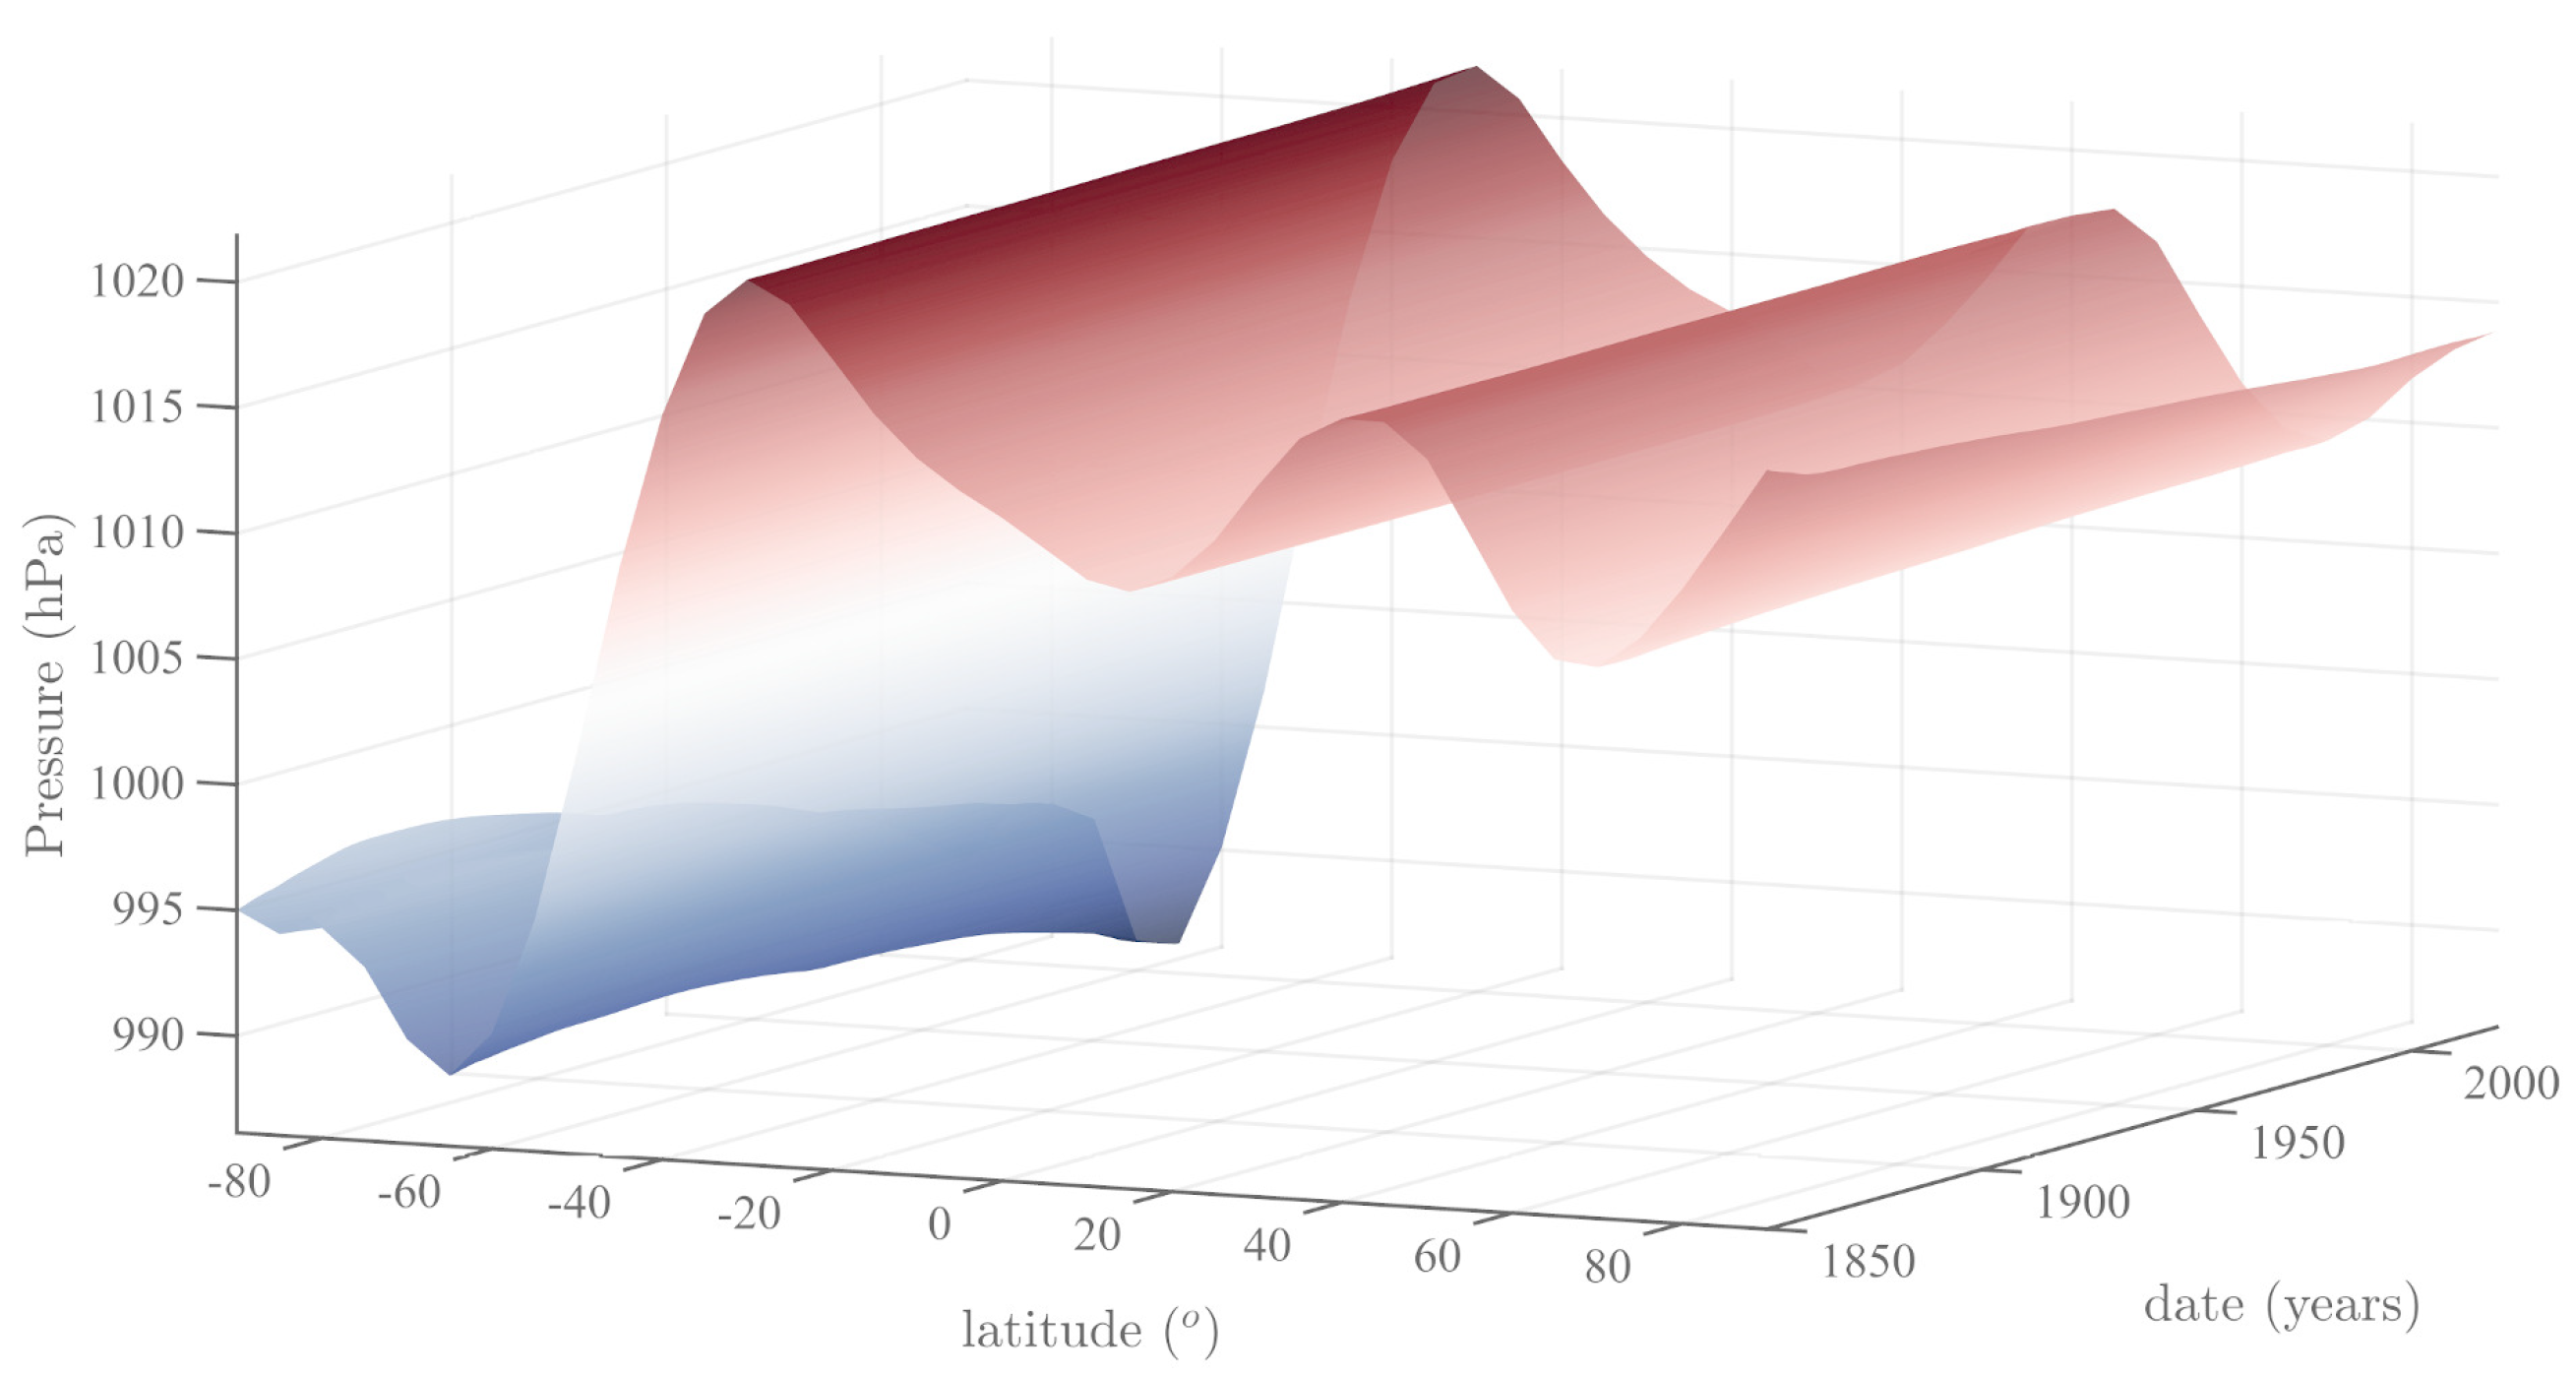
These are readily recognized as the Jose, Gleissberg, Hale and Schwabe cycles, the quasi-biennial oscillation and the annual cycle followed by its first three harmonics. Figure 3 represents the mean (from 1850 to 2020) of the SSA trends of SLP in Hammer–Aitoff and north and south stereographic polar projections. This mean is representative, since the observed (decreasing) overall variation in pressure is only 0.1% in the 170 years of the study. We illustrate the stability of the SLP trend both in space and time with Figure 4, which shows the variation in the trend of SLP since 1850 as a function of latitude. Indeed, the latitudinal structure of mean pressure (SSA trend) is remarkably stable over 170 years (a rather rare feature in geophysics and geodynamics, both internal and external to the solid Earth), with its typical asymmetry between the two hemispheres.
The stereographic projections of Figure 3 give a clear image of the large-scale atmospheric circulation. They are close to the original mean of Figure 1, and the same large-scale features appear, with sharper contours. The polar projections are particularly revealing. There is a strong negative feature south of Greenland. In the Northern Hemisphere, three sharp positive features lie on a circle at 40°N latitude and are located at the three apices of an equilateral triangle. The center of this three-fold symmetry (that we will call a “triskeles”, a three-fold symmetry often encountered in Celtic symbols, as well as in the symbol for Sicily) is located near 77°N, 90°W (13° away from the North Pole). In the Southern Hemisphere, the pattern is closer to four-fold symmetry, with one of the four features being much weaker than the other three.

5. A Model

The physics most appropriate for analyzing the motions of fluid masses in the atmosphere and ocean (and mantle) is stationary turbulent flow (e.g., [75,76]). The large Hadley, Ferrel and polar cells are generally interpreted in terms of Taylor–Couette flow. Analytical solutions are available in the case of a cylindrical geometry (e.g., [77]), but raise problems in the spherical case (e.g., [78,79,80,81,82,83,84]).
Forbes et al. [85] show that a simple solution for Taylor–Couette flow of a viscous fluid between two concentric cylinders with radii a and b rotating in opposite directions and submitted to an azimuthal perturbation with angle θ can be written as:
r ( ξ ) = r n + ε a cos ( q ξ )
θ ( ξ , t ) = ξ ( b 2 + a 2 ) ω t [ 1 r n 2 r 2 ( ξ ) ] / ( b 2 a 2 )
in which r n is the neutral radius and q is an integer corresponding to the flow mode. One can obtain:
r n = 2 a 2 b 2 a 2 + b 2
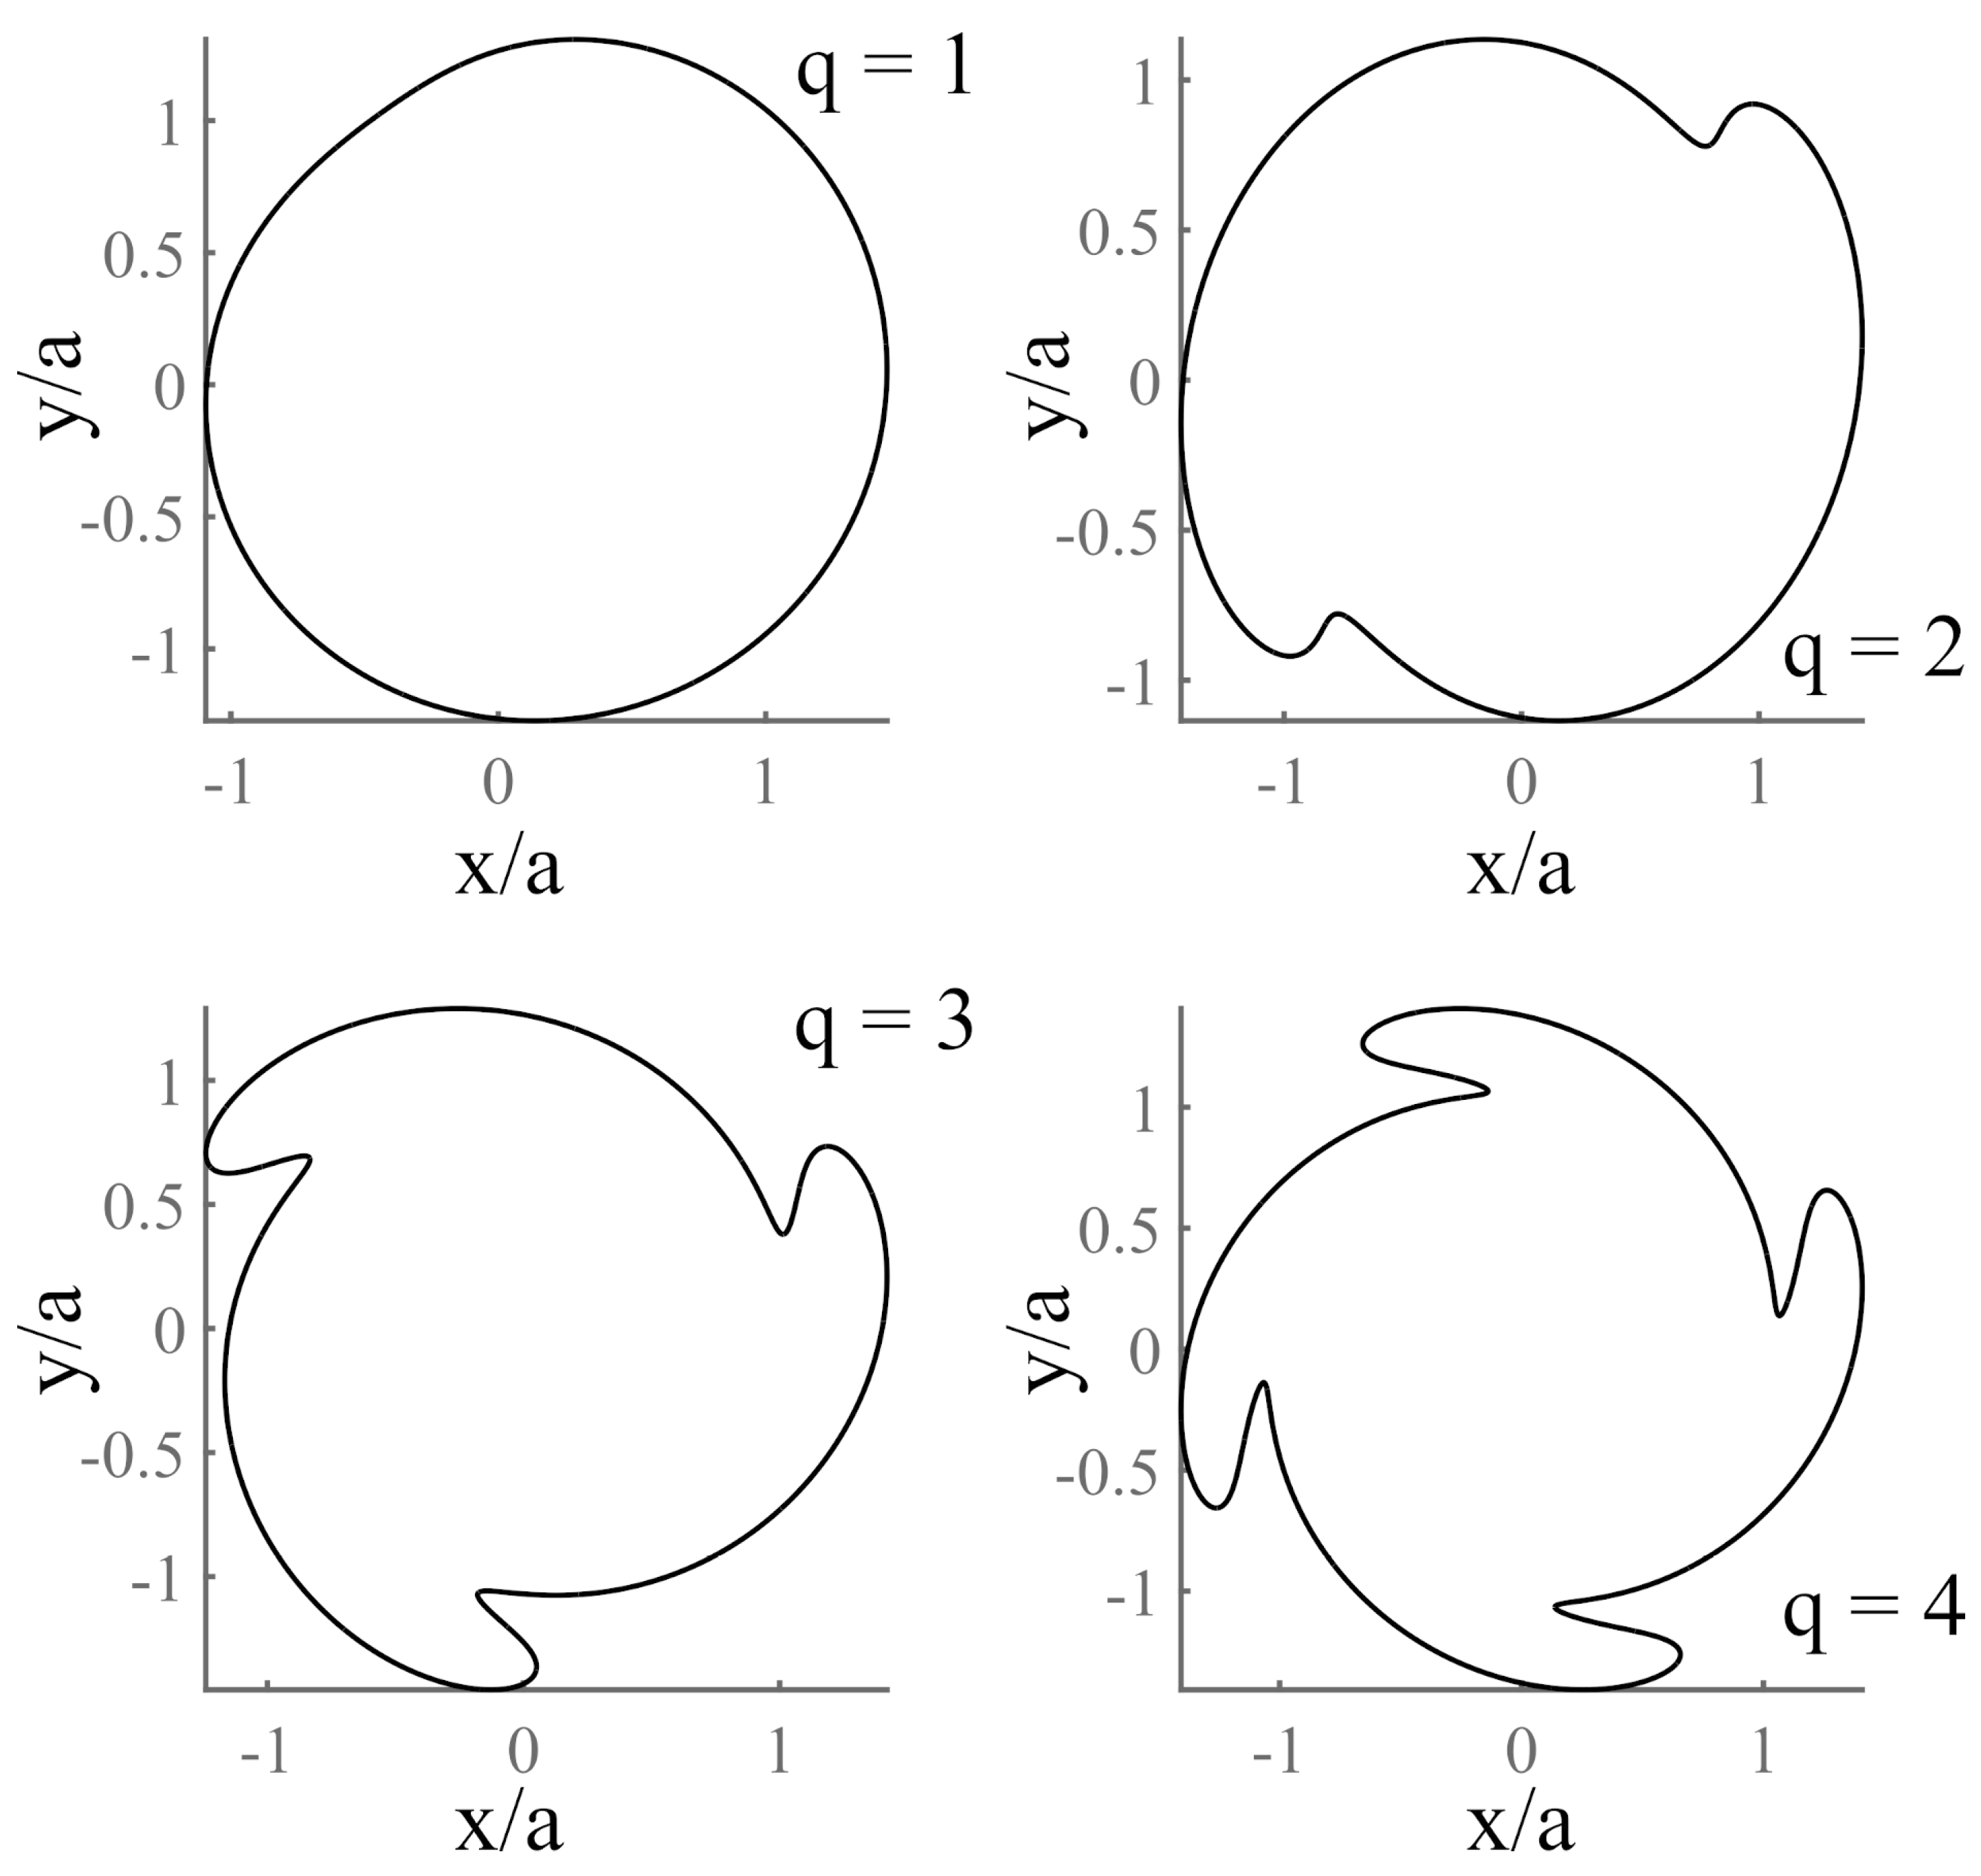
The solutions of systems (14a) and (14b) are displayed in Figure 5 for stationary flows with integers q = 1 to 4, with a = 0.5, b = 1, ω t = 1 and ε = 0.1. Modes corresponding to parameter q evolve, and q is fixed by the nature and symmetry of the flow.
Figure 6a shows the superimposition of a pattern of Taylor–Couette flow with mode q = 3 and the SLP trend map of Figure 3 (lower left) for the Northern Hemisphere. We invert Equations (14a) and (14b) by simulated annealing [86] for ω t = 1 (flow stationary and constant in time). The amplitude of the flow perturbation ε is on the order of 0.100 ± 0.002, and the triskeles pattern is centered on 91.3 ± 0.1°W, −77.1 ± 0.2°N. The fit is excellent and compatible with the shearing due to the direction of winds (east to west) at mid latitudes, opposite to the direction of Earth’s rotation from west to east.
Figure 6b shows the superimposition of a pattern of Taylor–Couette flow with mode q = 4 and the SLP trend map of Figure 3 (lower right) for the Southern Hemisphere. The amplitude of the flow perturbation ε is reduced to 0.05 ± 0.01, and the symmetry 4 is centered on 88.1 ± 0.2°W, −7.5 ± 0.1°N.
The Hadley, Ferrell or polar type cells change with the season. This is why the zonal structure of the atmosphere is shown in seasonal (monthly, bi-monthly) maps that can be averaged over several years. These oscillations cannot be analyzed through spatial decomposition methods such as EOF or spherical harmonics. On the other hand, iSSA is a scalar time analysis and can extract from the data temporal features. We have shown that atmospheric surface pressures display simple geometric/geographic features that are stable both in space and time. The oscillatory components belong to the harmonic families of the Schwabe (33, 22, 11, 5.5, 3.3 and 1.6 yr) and annual (1, 1/2, 1/3, 1/4 and 1/5 yr) cycles, plus the dominant 90 yr Gleissberg cycle.
Finally, one can only be struck by the kinship between the axial cylinders that form the main components of the sea-level pressure structure (with the quasi-symmetry of the outline of these cylinders, despite the failure of perfect symmetry, with three cylinders in the Northern Hemisphere and closer to four in the Southern Hemisphere). These are geometrically reminiscent of the axial cylinders found by Gubbins et al. [87] and Gubbins et al. [88] in their analyses of flow in the Earth’s molten outer core that generates the geomagnetic field. The physics in both cases appears quite distinct, but the analogy may indicate a path to finding the mechanism that generates these features.

6. Conclusions

On this note, we have analyzed the time evolution of mean sea-level pressure SLP since 1850, using the iSSA method of spectral analysis. The method decomposes the original time series into a set of time-dependent components and a trend. The quasi-periodic components are in the decreasing order of periods, cycles of approximately 130, 90, 50, 22, 15, 4, 1.8, 1, 0.5, 0.33 and 0.25 years (see [74] for the harmonic series of 1 year). These are recognized as the Jose, Gleissberg, Hale and Schwabe “long” (decadal and multidecadal) cycles (with some harmonics of the well-known Schwabe “solar” cycle (the Schwabe quasi-cycle is traditionally thought to be 11 yr long but actually spans the 9 to 14 yr range) and the “short” annual cycle and its first three harmonics. These periods are encountered in many solar and terrestrial phenomena and are now attributed to commensurable periods of the Jovian planets [28,29].
As far as the general trends of sea-level pressure extracted with iSSA are concerned, they have fluctuated by less than 0.1% in 170 years (or 6 × 10⁻³ hP/yr) studied. The mid latitudes of each hemisphere of the Earth’s surface harbor a set of positive features (on the order of 20 hP), except for one (over Central Asia and Tibet) lying over the main ocean basins (Figure 3, top). This is in full agreement with Schneider et al. [8], who see the oceans as the main engine driving the general circulation of the atmosphere. In stereographic polar projection, the Northern Hemisphere displays a set of three positive features, forming an almost perfect equilateral triangle or triskeles (Figure 3, lower left). The Southern Hemisphere also features a set of three main positive features, but these are arranged as an isosceles triangle, with a possible fourth (but much fainter) feature (Figure 3, lower right). A preliminary analysis suggests that the atmosphere in the two hemispheres could be the site of Taylor–Couette (sheared) differential flow of mode 3 (N hemisphere) or mode 4 (S hemisphere). The mode is imposed by the geometry of the oceanic vs. continental nature of the Earth’s surface. The remarkable regularity and three-order symmetryof the Northern Hemisphere triskeles occur despite the lack of cylindrical symmetry of the northern continents. The stronger intensity and larger size of features in the Southern Hemisphere are due to the presence of the annular flow of cold air over the Southern Ocean and the obstacles due to the southern parts or tips of South America, Southern Africa and Australia.
Singular spectrum analysis is a scalar analysis as a function of time, which is useful in detecting time-varying patterns and features. Spatial components that SSA extracts are not artifacts, contrary to what could happen when using spherical harmonics or EOF. A component is present only if there is spatial coherency in the observational data. In the case of sea-level pressure, we find stable (nonoscillatory) components/structures/features (as we have called them). The stability of pressure trends over the 170 years of the analysis implies that the idea of eddies maintaining the cells and forcing their oscillations is no more warranted. Taylor–Couette flow between rotating cylinders provides a good fit to the observations. The geometrical analogy with the cylinders generating the geodynamo may be a promising path to solving the dynamics of the large-scale circulation in the Earth’s atmosphere.

Author Contributions

F.L., V.C. and J.-L.L.M. contributed to conceptualization, formal analysis, interpretation and writing. All authors have read and agreed to the published version of the manuscript.

Funding

This research was supported by the Université de Paris, IPGP.

Data Availability Statement

The used data are freely available at the following address: https://www.metoffice.gov.uk/hadobs/hadslp2/data/download.html (accessed on 24 October 2020).

Acknowledgments

We thank the anonymous reviewers for their helpful comments on the manuscript.

Conflicts of Interest

The authors declare no conflict of interest.

References

  1. Lorentz, E.N. The Nature and Theory of the General Circulation of the Atmosphere; WMO 218, TP-115; World Meteorological Organization: Geneva, Switzerland, 1967; 161p. [Google Scholar]
  2. Lindzen, R.S.; Hou, A.V. Hadley circulations for zonally averaged heating centered off the equator. J. Atmos. Sci. 1988, 45, 2416–2427. [Google Scholar] [CrossRef]
  3. Hadley, G. VI. Concerning the cause of the general trade-winds. Philos. Trans. R. Soc. 1735, 39, 58–62. [Google Scholar]
  4. Ferrel, W. Essay on the winds and ocean currents. Nashv. J. Med. Surg. 1856, 11, 287–301. [Google Scholar]
  5. Jeffreys, H. On the dynamics of geostrophic winds. Q. J. R. Meteor. Soc. 1926, 52, 85–104. [Google Scholar] [CrossRef]
  6. Starr, V.P. An essay on the general circulation of the earth atmosphere. J. Atmos. Sci. 1948, 5, 39–43. [Google Scholar]
  7. Schneider, E.K. Axially symmetric steady-state models of the basic state for instability and climate studies. Part II, Nonlinear calculations. J. Atmos. Sci. 1977, 34, 280–296. [Google Scholar] [CrossRef]
  8. Schneider, E.K.; Lindzen, R.S. Axially symmetric steady-state models of the basic state for instability and climate studies. Part I. Linearized calculations. J. Atmos. Sci. 1977, 34, 263–279. [Google Scholar] [CrossRef]
  9. Usoskin, I.G.; Solanki, S.K.; Schüssler, M.; Mursula, K.; Alanko, K. Millennium-scale sunspot number reconstruction: Evidence for an unusually active Sun since the 1940s. Phys. Rev. Lett. 2003, 91, 211101. [Google Scholar] [CrossRef] [PubMed]
  10. Solanki, S.K.; Usoskin, I.G.; Kromer, B.; Schüssler, M.; Beer, J. Unusual activity of the Sun during recent decades compared to the previous 11,000 years. Nature 2004, 431, 1084–1087. [Google Scholar] [CrossRef]
  11. Lockwood, M.; Owens, M.J.; Barnard, L.; Davis, C.J.; Steinhilber, F. The persistence of solar activity indicators and the descent of the Sun into Maunder Minimum conditions. Geophys. Res. Lett. 2011, 38. [Google Scholar] [CrossRef]
  12. Vieira, L.E.A.; Solanki, S.K.; Krivova, N.A.; Usoskin, I. Evolution of the solar irradiance during the Holocene. Astron. Astrophys. 2011, 531, A6. [Google Scholar] [CrossRef]
  13. Abreu, J.A.; Beer, J.; Ferriz-Mas, A.; McCracken, K.G.; Steinhilber, F. Is there a planetary influence on solar activity? Astron. Astrophys. 2012, 548, A88. [Google Scholar] [CrossRef]
  14. Kutiev, I.; Tsagouri, I.; Perrone, L.; Pancheva, D.; Mukhtarov, P.; Mikhailov, A.; Lastovicka, J.; Jakowski, N.; Buresova, D.; Blanch, E. et al. Solar activity impact on the Earth’s upper atmosphere. J. Space Weather. Space Clim. 2013, 3, A06. [Google Scholar] [CrossRef] [Green Version]
  15. Thuillier, G.; Bolsée, D.; Schmidtke, G.; Foujols, T.; Nikutowski, B.; Shapiro, A.I.; Brunner, R.; Weber, M.; Erhardt, C.; Hersé, M.; et al. The solar irradiance spectrum at solar activity minimum between solar cycles 23 and 24. Sol. Phys. 2014, 289, 1931–1958. [Google Scholar] [CrossRef]
  16. Le Mouël, J.L.; Lopes, F.; Courtillot, V. Characteristic time scales of decadal to centennial changes in global surface temperatures over the past 150 years. Earth Space Sci. 2020, 7, e2019EA000671. [Google Scholar] [CrossRef]
  17. Le Mouël, J.L.; Lopes, F.; Courtillot, V. Solar turbulence from sunspot records. Mon. Not. R. Astron. Soc. 2020, 492, 1416–1420. [Google Scholar] [CrossRef]
  18. Courtillot, V.; Lopes, F.; Le Mouël, J.L. On the prediction of solar cycles. Sol. Phys. 2021, 296, 1–23. [Google Scholar] [CrossRef]
  19. Barnes, R.T.H.; Hide, R.; White, A.A.; Wilson, C.A. Atmospheric angular momentum fluctuations, length-of-day changes and polar motion. Proc. R. Soc. A Math. Phys. Sci. 1983, 387, 31–73. [Google Scholar]
  20. Rochester, M.G. Causes of fluctuations in the rotation of the Earth. Philos. Trans. R. Soc. Ser. A Math. Phys. Sci. 1984, 313, 95–105. [Google Scholar]
  21. Lambeck, K. The Earth’s Variable Rotation: Geophysical Causes and Consequences; Cambridge University Press: Cambridge, UK, 2005. [Google Scholar]
  22. Schindelegger, M.; Böhm, S.; Böhm, J.; Schuh, H. Atmospheric effects on Earth rotation. In Atmospheric Effects in Space Geodesy; Springer: Berlin/Heidelberg, Germany, 2013; pp. 181–231. [Google Scholar]
  23. Lopes, F.; Le Mouël, J.L.; Gibert, D. The mantle rotation pole position. A solar component. Comptes Rendus Geosci. 2017, 349, 159–164. [Google Scholar] [CrossRef]
  24. Barkin, M.Y.; Krylov, S.S.; Perepelkin, V.V. Modeling and analysis of the Earth pole motion with nonstationary perturbations. J. Phys. Conf. Ser. 2019, 1301, 012005. [Google Scholar] [CrossRef]
  25. Le Mouël, J.L.; Lopes, F.; Courtillot, V.; Gibert, D. On forcings of length of day changes: From 9-day to 18.6-year oscillations. Phys. Earth Planet. Inter. 2019, 292, 1–11. [Google Scholar] [CrossRef]
  26. Krylov, S.S.; Perepelkin, V.V.; Filippova, A.S. Long-Period Lunar Perturbations in Earth Pole Oscillatory Process: Theory. In Advances in Theory and Practice of Computational Mechanics: Proceedings of the 21st International Conference on Computational Mechanics and Modern Applied Software Systems; Springer Nature: Singapore, 2020; Volume 173, p. 315. [Google Scholar]
  27. Le Mouël, J.L.; Lopes, F.; Courtillot, V. Sea-Level Change at the Brest (France) Tide Gauge and the Markowitz Component of Earth’s Rotation. J. Coast. Res. 2021, 37, 683–690. [Google Scholar] [CrossRef]
  28. Lopes, F.; Le Mouël, J.L.; Courtillot, V.; Gibert, D. On the shoulders of Laplace. Phys. Earth Planet. Inter. 2021, 316, 106693. [Google Scholar] [CrossRef]
  29. Mörth, H.T.; Schlamminger, L. Planetary motion, sunspots and climate. In Solar-Terrestrial Influences on Weather and Climate; Springer: Dordrecht, The Netherlands, 1979; pp. 193–207. [Google Scholar]
  30. Lindzen, R.S. Climate dynamics and global change. Annu. Rev. Fluid Mech. 1994, 26, 353–378. [Google Scholar] [CrossRef]
  31. Gray, L.J.; Beer, J.; Geller, M.; Haigh, J.D.; Lockwood, M.; Matthes, K.; Cubasch, U.; Fleitmann, D.; Harrison, G.; Hood, L.; et al. Solar influences on climate. Rev. Geophys. 2010, 48. [Google Scholar] [CrossRef]
  32. Gray, L.J.; Scaife, A.A.; Mitchell, D.M.; Osprey, S.; Ineson, S.; Hardiman, S.; Butchart, N.; Knight, J.; Sutton, R.; Kodera, K. A lagged response to the 11 year solar cycle in observed winter Atlantic/European weather patterns. J. Geophys. Res. Atmos. 2013, 118, 13–405. [Google Scholar] [CrossRef]
  33. Roy, I.; Haigh, J.D. Solar cycle signals in sea level pressure and sea surface temperature. Atmos. Chem. Phys. 2010, 10, 3147–3153. [Google Scholar] [CrossRef]
  34. Johnstone, J.A.; Mantua, N.J. Atmospheric controls on northeast Pacific temperature variability and change, 1900–2012. Proc. Natl. Acad. Sci. USA 2014, 111, 14360–14365. [Google Scholar] [CrossRef]
  35. Le Mouël, J.L.; Lopes, F.; Courtillot, V. A solar signature in many climate indices. J. Geophys. Res. Atmos. 2019, 124, 2600–2619. [Google Scholar] [CrossRef]
  36. Gruzdev, A.N.; Bezverkhnii, V.A. Manifestation of the 11-year solar cycle in the North Atlantic climate. In Proceedings of the IOP Conference Series: Earth and Environmental Science—Climate Change: Causes, Risks, Consequences, Problems of Adaptation and Management, Moscow, Russia, 26–28 November 2019; Volume 606, p. 012018. [Google Scholar]
  37. Cionco, R.G.; Kudryavtsev, S.M.; Soon, W.H. Possible Origin of Some Periodicities Detected in Solar-Terrestrial Studies: Earth’s Orbital Movements. Earth Space Sci. 2021, 8, e2021EA001805. [Google Scholar] [CrossRef]
  38. Connolly, R.; Soon, W.; Connolly, M.; Baliunas, S.; Berglund, J.; Butler, C.J.; Cionco, R.G.; Elias, A.G.; Fedorov, V.M.; Harde, H.; et al. How much has the Sun influenced Northern Hemisphere temperature trends? An ongoing debate. Res. Astron. Astrophys. 2021, 21, 131. [Google Scholar] [CrossRef]
  39. Drews, A.; Huo, W.; Matthes, K.; Kodera, K.; Kruschke, T. The Sun’s Role for Decadal Climate Predictability in the North Atlantic. Atmos. Chem. Phys. Discuss. 2021, 22, 7893–7904. [Google Scholar] [CrossRef]
  40. Sonechkin, D.M.; Vakulenko, N.V. Polyphony of Short-Term Climatic Variations. Atmosphere 2021, 12, 1145. [Google Scholar] [CrossRef]
  41. Lindzen, R.S. On a calculation of the symmetric circulation and its implications for the role of eddies. Gen. Circ.-Theory Model. Obs. 1978, 257–281. [Google Scholar]
  42. Chang, E.K. The influence of Hadley circulation intensity changes on extratropical climate in an idealized model. J. Atmos. Sci. 1995, 52, 2006–2024. [Google Scholar] [CrossRef]
  43. Dima, I.M.; Wallace, J.M. On the seasonality of the Hadley cell. J. Atmos. Sci. 2003, 60, 1522–1527. [Google Scholar] [CrossRef]
  44. Frierson, D.M.; Lu, J.; Chen, G. Width of the Hadley cell in simple and comprehensive general circulation models. Geophys. Res. Lett. 2007, 34. [Google Scholar] [CrossRef]
  45. Hu, Y.; Fu, Q. Observed poleward expansion of the Hadley circulation since 1979. Atmos. Chem. Phys. 2007, 7, 5229–5236. [Google Scholar] [CrossRef]
  46. Kharin, V.V.; Zwiers, F.W.; Zhang, X.; Hegerl, G.C. Changes in temperature and precipitation extremes in the IPCC ensemble of global coupled model simulations. J. Clim. 2017, 20, 1419–1444. [Google Scholar] [CrossRef]
  47. Lu, J.; Vecchi, G.A.; Reichler, T. Expansion of the Hadley cell under global warming. Geophys. Res. Lett. 2007, 34. [Google Scholar] [CrossRef]
  48. Tandon, N.F.; Gerber, E.P.; Sobel, A.H.; Polvani, L.M. Understanding Hadley cell expansion versus contraction: Insights from simplified models and implications for recent observations. J. Clim. 2013, 26, 4304–4321. [Google Scholar] [CrossRef]
  49. Shepherd, T.G. Atmospheric circulation as a source of uncertainty in climate change projections. Nat. Geosci. 2014, 7, 703–708. [Google Scholar] [CrossRef]
  50. Tao, L.; Hu, Y.; Liu, J. Anthropogenic forcing on the Hadley circulation in CMIP5 simulations. Clim. Dyn. 2016, 46, 3337–3350. [Google Scholar] [CrossRef]
  51. Grise, K.M.; Davis, S.M. Hadley cell expansion in CMIP6 models. Atmos. Chem. Phys. 2020, 20, 5249–5268. [Google Scholar] [CrossRef]
  52. Schaeffer, M.; Selten, F.M.; Opsteegh, J.D. Shifts of means are not a proxy for changes in extreme winter temperatures in climate projections. Clim. Dyn. 2005, 25, 51–63. [Google Scholar] [CrossRef]
  53. Stott, P.A.; Gillett, N.P.; Hegerl, G.C.; Karoly, D.J.; Stone, D.A.; Zhang, X.; Zwiers, F. Detection and attribution of climate change: A regional perspective. Wiley Interdiscip. Rev. Clim. Chang. 2010, 1, 192–211. [Google Scholar] [CrossRef]
  54. Rahmstorf, S.; Coumou, D. Increase of extreme events in a warming world. Proc. Natl. Acad. Sci. USA 2011, 108, 17905–17909. [Google Scholar] [CrossRef]
  55. Rummukainen, M. Changes in climate and weather extremes in the 21st century. Wiley Interdiscip. Rev. Clim. Chang. 2012, 3, 115–129. [Google Scholar] [CrossRef]
  56. Trenberth, K.E.; Fasullo, J.T.; Shepherd, T.G. Attribution of climate extreme events. Nat. Clim. Chang. 2015, 5, 725–730. [Google Scholar] [CrossRef]
  57. Vaideanu, P.; Dima, M.; Pirloaga, R.; Ionita, M. Disentangling and quantifying contributions of distinct forcing factors to the observed global sea level pressure field. Clim. Dyn. 2020, 54, 1453–1467. [Google Scholar] [CrossRef]
  58. Golyandina, N.; Zhigljavsky, A. Singular Spectrum Analysis for Time Series; Springer: Berlin/Heidelberg, Germany, 2013; Volume 120. [Google Scholar]
  59. Vautard, R.; Ghil, M. Singular spectrum analysis in nonlinear dynamics, with applications to paleoclimatic time series. Phys. D Nonlinear Phenom. 1989, 35, 395–424. [Google Scholar] [CrossRef]
  60. Ghil, M.; Vautard, R. Interdecadal oscillations and the warming trend in global temperature time series. Nature 1991, 350, 324–327. [Google Scholar] [CrossRef]
  61. Vautard, R.; Yiou, P.; Ghil, M. Singular-spectrum analysis: A toolkit for short, noisy chaotic signals. Phys. D Nonlinear Phenom. 1992, 58, 95–126. [Google Scholar] [CrossRef]
  62. Mañé, R. On the dimension of the compact invariant sets of certain non-linear maps. In Dynamical Systems and Turbulence; Warwick: St. Charles, IL, USA, 1980; Springer: Berlin/Heidelberg, Germany, 1981; pp. 230–242. [Google Scholar]
  63. Takens, F. Detecting strange attractors in turbulence. In Dynamical Systems and Turbulence; Warwick: St. Charles, IL, USA, 1980; Springer: Berlin/Heidelberg, Germany, 1981; pp. 366–381. [Google Scholar]
  64. Lemmerling, P.; Van Huffel, S. Analysis of the structured total least squares problem for Hankel/Toeplitz matrices. Numer. Algorithms 2001, 27, 89–114. [Google Scholar] [CrossRef]
  65. Golub, G.H.; Reinsch, C. Singular value decomposition and least squares solutions. In Linear Algebra; Springer: Berlin/Heidelberg, Germany, 1971; pp. 134–151. [Google Scholar]
  66. Allan, R.; Ansell, T. A new globally complete monthly historical gridded mean sea level pressure dataset (HadSLP2): 1850–2004. J. Clim. 2006, 19, 5816–5842. [Google Scholar] [CrossRef] [Green Version]
  67. Marshall, G.J. Trends in the Southern Annular Mode from observations and reanalyses. J. Clim. 2003, 16, 4134–4143. [Google Scholar] [CrossRef]
  68. Gillett, N.P.; Kell, T.D.; Jones, P.D. Regional climate impacts of the Southern Annular Mode. Geophys. Res. Lett. 2006, 33. [Google Scholar] [CrossRef]
  69. Jose, P.D. Sun’s motion and sunspots. Astron. J. 1965, 70, 193–200. [Google Scholar] [CrossRef]
  70. Gleissberg, W. A long-periodic fluctuation of the sunspot numbers. Observatory 1939, 62, 158. [Google Scholar]
  71. Le Mouël, J.L.; Lopes, F.; Courtillot, V. Identification of Gleissberg cycles and a rising trend in a 315-year-long series of sunspot numbers. Sol. Phys. 2017, 292, 43. [Google Scholar] [CrossRef]
  72. Usoskin, I.G. A history of solar activity over millennia. Living Reviews. Sol. Phys. 2017, 14, 1–97. [Google Scholar]
  73. Schwabe, H. Sonnen-Beobachtungen im Jahre 1843. Astron. Nachr. 1844, 21, 233–236. [Google Scholar] [CrossRef]
  74. Courtillot, V.; Le Mouël, J.-L.; Lopes, F.; Gibert, D. On the Nature and Origin of Atmospheric Annual and Semi-Annual Oscillations. arXiv 2022, arXiv:2206.12133. [Google Scholar]
  75. Chandrasekhar, S. Hydrodynamic and Hydromagnetic Stability; Oxford University Press: Oxford, UK, 1961. [Google Scholar]
  76. Frisch, U.; Kolmogorov, A.N. Turbulence: The Legacy of AN Kolmogorov; Cambridge University Press: Cambridge, UK, 1995. [Google Scholar]
  77. Taylor, G.I. VIII. Stability of a viscous liquid contained between two rotating cylinders. Philos. Trans. R. Soc. Ser. A Contain. Pap. Math. Phys. Character 1923, 223, 289–343. [Google Scholar]
  78. Schrauf, G. The first instability in spherical Taylor–Couette flow. J. Fluid Mech. 1986, 166, 287–303. [Google Scholar] [CrossRef]
  79. Mamun, C.K.; Tuckerman, L.S. Asymmetry and Hopf bifurcation in spherical Couette flow. Phys. Fluids 1995, 7, 80–91. [Google Scholar] [CrossRef]
  80. Nakabayashi, K.; Tsuchida, Y. Flow-history effect on higher modes in the spherical Couette system. J. Fluid Mech. 1995, 295, 43–60. [Google Scholar] [CrossRef]
  81. Hollerbach, R.; Junk, M.; Egbers, C. Non-axisymmetric instabilities in basic state spherical Couette flow. Fluid Dyn. Res. 2006, 38, 257. [Google Scholar] [CrossRef]
  82. Mahloul, M.; Mahamdia, A.; Kristiawan, M. The spherical Taylor–Couette flow. Eur. J. Mech. B Fluids 2016, 59, 1–6. [Google Scholar] [CrossRef]
  83. Garcia, F.; Seilmayer, M.; Giesecke, A.; Stefani, F. Modulated rotating waves in the magnetised spherical Couette system. J. Nonlinear Sci. 2019, 29, 2735–2759. [Google Scholar] [CrossRef]
  84. Mannix, P.M.; Mestel, A.J. Bistability and hysteresis of axisymmetric thermal convection between differentially rotating spheres. J. Fluid Mech. 2021, 911, A12. [Google Scholar] [CrossRef]
  85. Forbes, L.K.; Bassom, A.P. Interfacial behaviour in two-fluid Taylor–Couette flow. Q. J. Mech. Appl. Math. 2018, 71, 79–97. [Google Scholar] [CrossRef]
  86. Kirkpatrick, S.; Gelatt, C.D.; Vecchi, M.P. Optimization by simulated annealing. Science 1983, 220, 671–680. [Google Scholar] [CrossRef] [PubMed]
  87. Gubbins, D.; Bloxham, J. Morphology of the geomagnetic field and implications for the geodynamo. Nature 1987, 325, 509–511. [Google Scholar] [CrossRef]
  88. Gubbins, D.; Kelly, P. Persistent patterns in the geomagnetic field over the past 2.5 Myr. Gubbins 1993, 365, 829–832. [Google Scholar] [CrossRef]
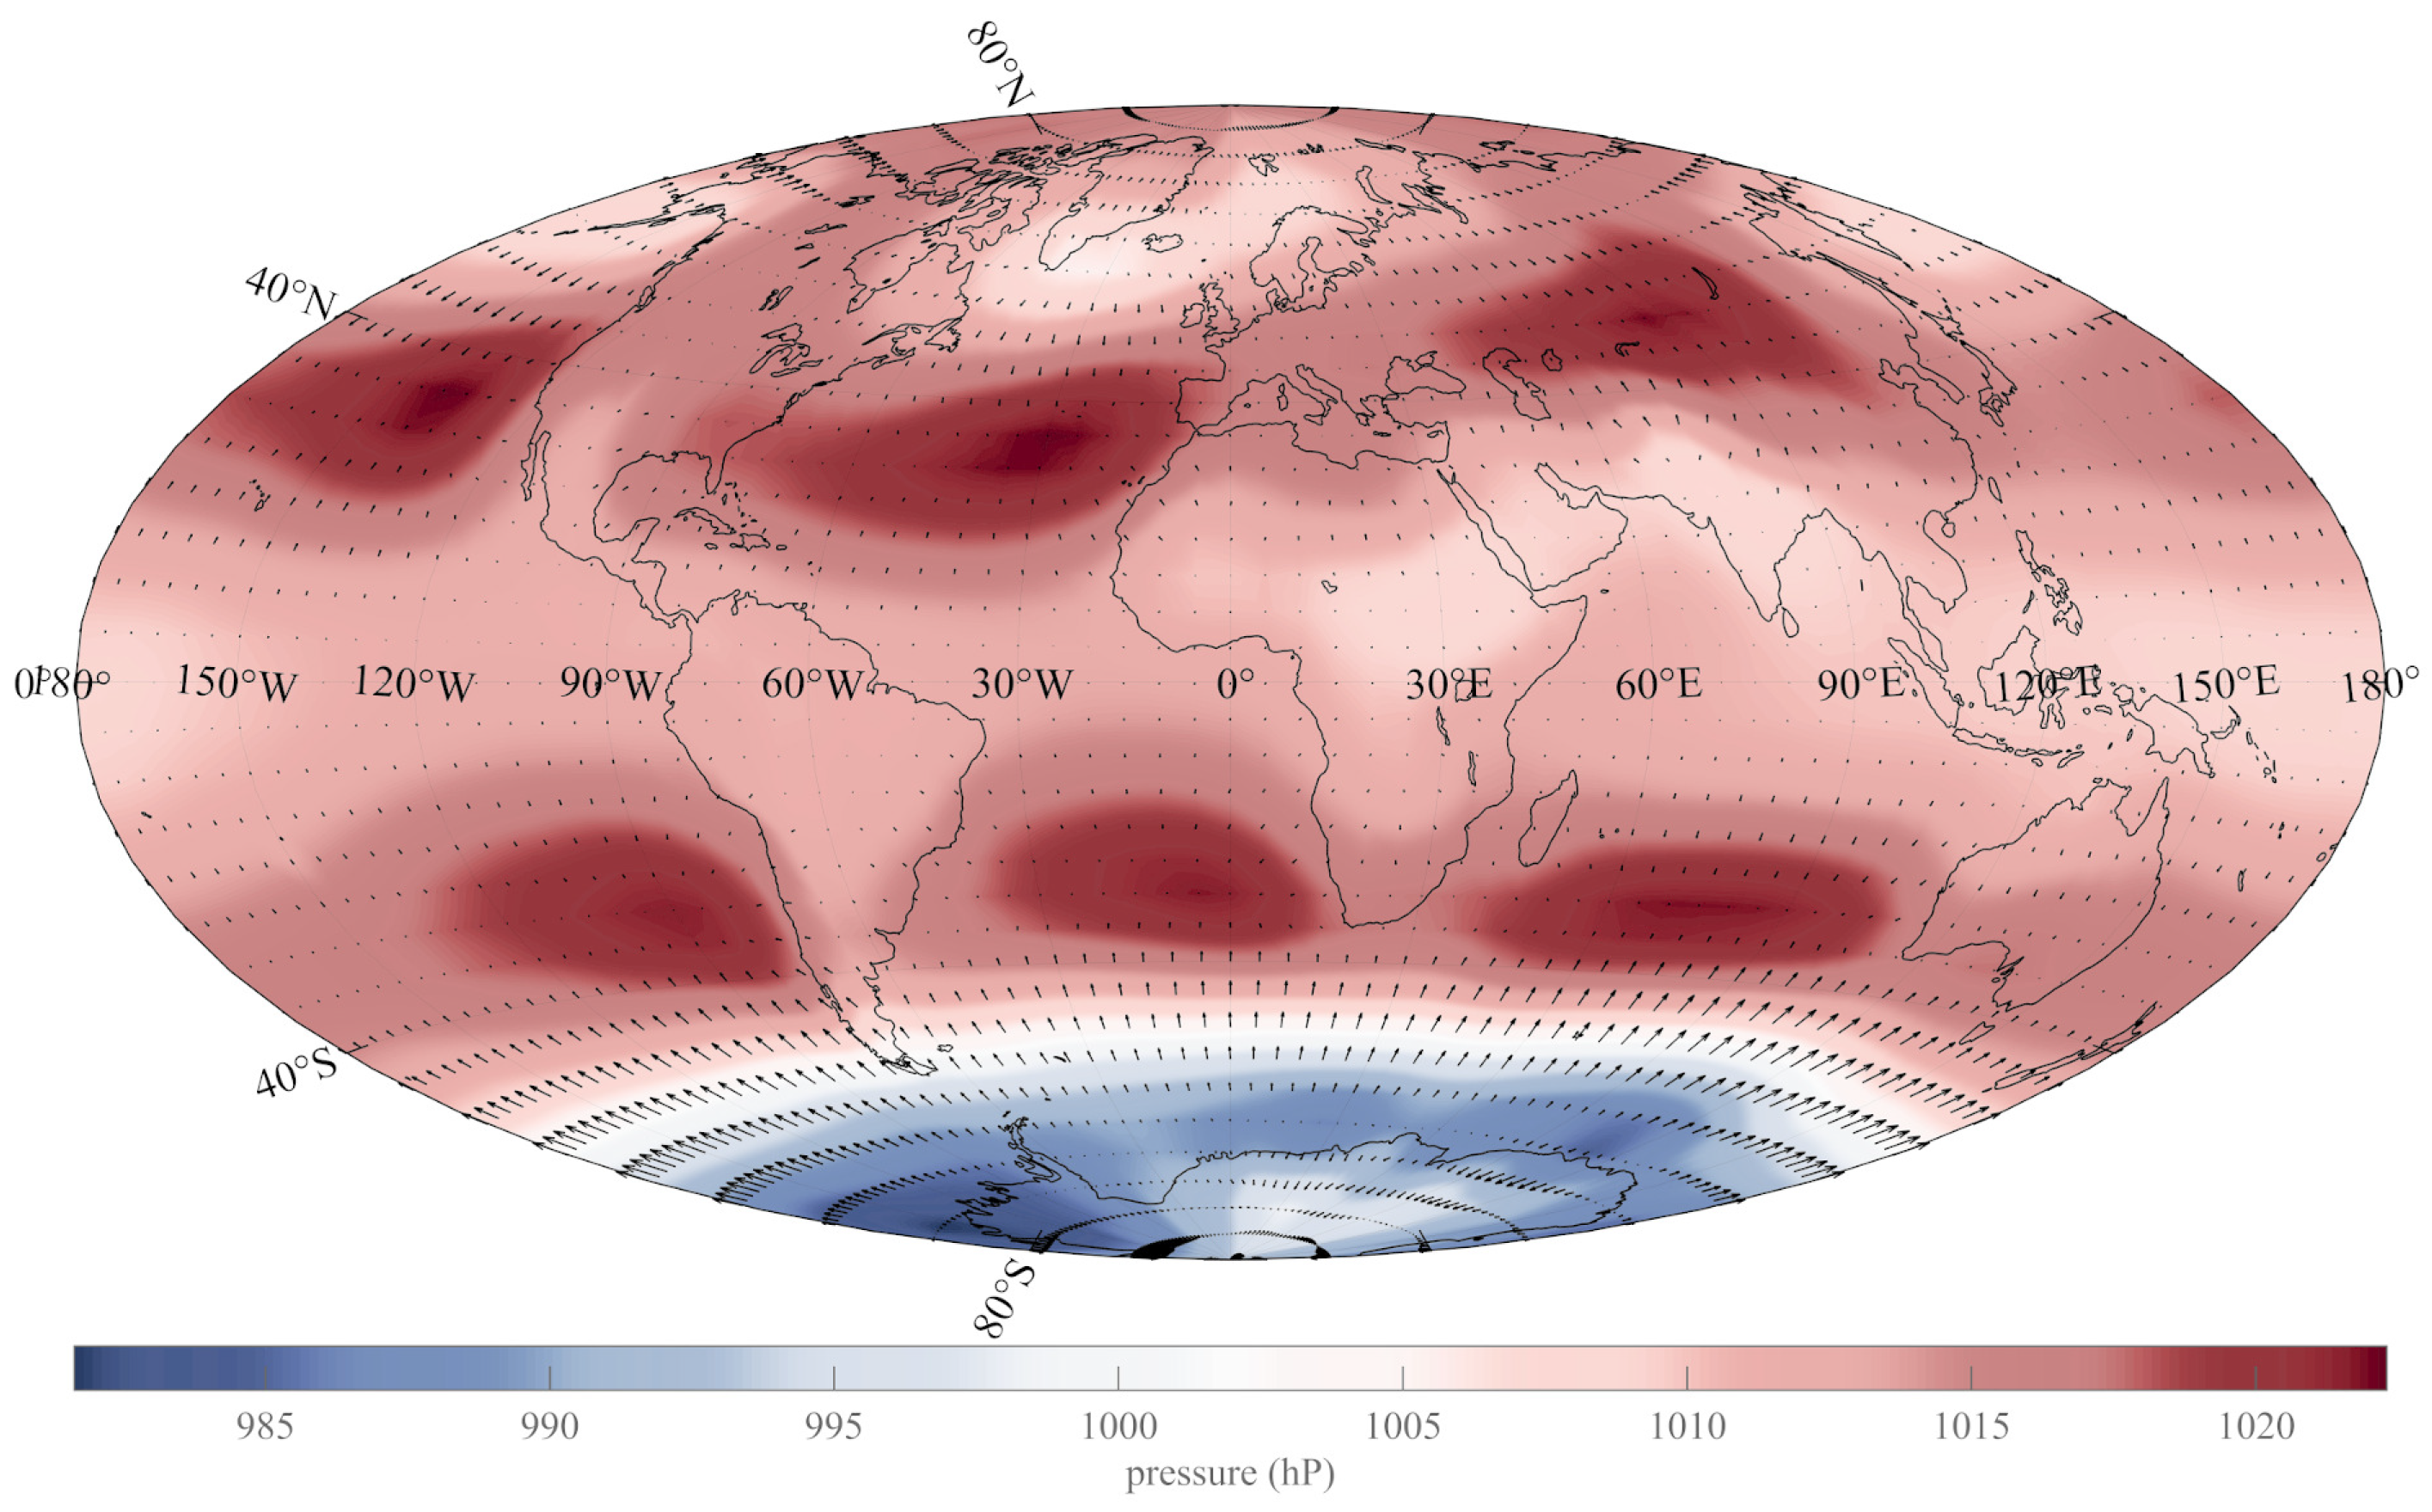
Figure 1. Mean pressure at sea level from 1850 to 2020 (SLP) (Hammer–Aitoff projection).
Atmosphere 13 01354 g001
Figure 2. Time average of the spatial pressure gradients from 1850 to 2020 (i.e., winds up to a constant) at sea level (Hammer–Aitoff projection).
Atmosphere 13 01354 g002
Figure 3. Mean of trends of pressure at sea level from 1850 to 2020 (SLP), determined using singular spectrum analysis (SSA) (top: Hammer–Aitoff projection; lower left: stereographic projection of the NH; lower right: stereographic projection of the SH).
Atmosphere 13 01354 g003
Figure 4. Evolution of the SSA trend of SLP as a function of time (170 yr since 1850) and latitude, illustrating the stability of the zonal pressure structure in time.
Atmosphere 13 01354 g004
Figure 5. Solutions of system of Equations (14a) and (14b), for integer mode values q = 1 to 4 (see text).
Atmosphere 13 01354 g005
Figure 6. Superimposition of the Taylor–Couette patterns for both North and South Hemispheres. (a) Superimposition of the triskeles’ Taylor–Couette pattern of flow for mode q = 3 and observed mean pattern of sea-level pressure in the North Hemisphere from 1850 to 2020. (b) Superimposition of the Taylor–Couette pattern of flow for mode q = 4 and observed mean pattern of sea-level pressure in the South Hemisphere from 1850 to 2020.
Atmosphere 13 01354 g006
Publisher’s Note: MDPI stays neutral with regard to jurisdictional claims in published maps and institutional affiliations.