Article

Predictability of Intra-Seasonal Descriptors of Rainy Season over Senegal Using Global SST Patterns

by
Abdou Kader Touré
1,*,
Cheikh Modou Noreyni Fall
1,
Moussa Diakhaté
1,2,
Dahirou Wane
1,
Belen Rodríguez-Fonseca
3,
Ousmane Ndiaye
4,
Mbaye Diop
5 and
Amadou Thierno Gaye
1
1
Laboratoire Physique de l’Atmosphère et de l’Océan-Siméon Fongang (LPAO-SF), Ecole Supérieure Polytechnique (ESP), Université Cheikh Anta Diop de Dakar, Dakar 10700, Senegal
2
Faculty of Engineering Sciences and Techniques, Université Amadou Mahtar Mbow (UAM), VDN, Cité Keur Gorgui, Dakar 45927, Senegal
3
Departamento de Física de la Tierra, Astronomía y Astrofísica I (Geofísica y Meteorología), Facultad de Físicas, Universidad Complutense de Madrid (UCM), 28040 Madrid, Spain
4
Agence Nationale de l’aviation Civile et de la Météorologie (ANACIM), Dakar 8184, Senegal
5
Institut Sénégalais de Recherches Agricoles (ISRA), Dakar 3120, Senegal
*
Author to whom correspondence should be addressed.
Atmosphere 2022, 13(9), 1437; https://doi.org/10.3390/atmos13091437
Submission received: 28 June 2022 / Revised: 23 August 2022 / Accepted: 26 August 2022 / Published: 6 September 2022
(This article belongs to the Special Issue Agricultural Drought Monitoring and Impacts Assessment)

Abstract

:
Seasonal forecasting of the rainfall characteristics in Sahel is of crucial interest in determining crop variability in these countries. This study aims to provide further characterization of nine rainfall metrics over Senegal (Onset, cessation, LRS, CDD, CDD7, CDD15, NR90p, NR95p, NR99p) and their response to global SST patterns from 1981 to 2018. The Climate Hazards Group InfraRed Precipitation with Station (CHIRPS) dataset and the Hadley Centre Global Sea Ice and Sea Surface Temperature (HadISST) were used. The results showed strong spatio-temporal variability with a pronounced south–north gradient for all metrics. The earliest onset was observed in the south of the country from 4 July and the latest onset in the north from 9 August. Since 2012, a new regime is observed with an increase in both long dry spells and extreme wet events. Furthermore, SST forcing has shown that the North tropical Atlantic and the East Equatorial Pacific are better able to explain the interannual variability of the intraseasonal descriptors. However, the prediction of metrics is earlier for the most remote basin (Pacific) compared to the most local basin (Atlantic). These results have implications for the seasonal forecasting of Sahel’s intraseasonal variability based on SST predictors, as significant predictability is found far from the beginning of the season.

1. Introduction

Spatio-temporal variability of the West African Monsoon (WAM) remains an important research challenge for different West African socio-economics activities. In Senegal, like other Sahelian countries, the economy and food security of the rural population are strongly dependent on farming [1,2,3,4], which, in turn, depend on rainfall. Indeed, rain-fed crops are the main source of food, livestock fodder and incomes [5]. In 2014, a severe drought affected several localities in Senegal, leading the Senegalese government to receive USD 6.5 million in funding from the African Risk Capacity [6]. In addition, according to the World Food Program (WFP), Senegal is one of the seven Sahelian countries where the number of food-insecure people increased significantly from the current 314,600 to 548,000 during the lean season of 2018 [7].
The rainy season in Senegal extends mainly from June to October [8,9,10], and it is associated with the latitudinal shift of the Inter-Tropical Convergence Zone (ITCZ) [11,12]. The mean date for the onset occurrence is 24 June, and its standard deviation is 8 days [13]. However, the establishment of the West African monsoon is characterized by a succession of active and inactive phases, also known as breaks, during which the rains intensify and weaken [14,15]. Some of these intraseasonal descriptors, such as the rainfall occurrence, average daily rainfall intensity, and wet/dry spells, are strong indicators of the strengthening and weakening phases of the West African Monsoon, whereas the duration of the monsoon season depends strongly on the onset and the cessation date of the season ([16,17]). For several operators, the quality of a rainy season is generally associated with its seasonal accumulation of rainfall (S). Nonetheless, a rainy season can only be summed up by this information alone. The authors of [17] suggest that a cumulative seasonal rainfall in Sahel can be broken down as the product of the occurrence of rainy days by the average intensity of rainfall daily. This hypothesis has been tested in Senegal by [15], who showed that the relationship between early/late characteristic onset and seasonal accumulation (JAS) is most evident in northern Senegal, where an Early break can lead to greater seasonal accumulation. Furthermore, the relationship between early/late characteristics onset and seasonal accumulation (JAS) is most evident in northern Senegal, where a late break can lead to less seasonal accumulation. The behavior of the rainy season is almost the opposite, depending on whether the cessation date is early or late. In southern Senegal, however, this relationship is less perceptible. It should be noted that these dry or wet intraseasonal descriptions can have an impact on the economy. Furthermore, the rural population’s food security is heavily dependent on agriculture. Indeed, rain-fed crops are the main source of food, fodder for livestock and income. In Senegal, more than 26 people died because of direct and indirect impacts of an extreme rainfall event on 26 August 2012, marked by 161 mm in less than 3 h [18].
Unfortunately, very few studies have focused on the predictability of these intraseasonal descriptors. Most studies have only focused on cumulative seasonal rainfall, which does not allow a better understanding of potentially high-impact events. On the continental scale, WAM rainfall is influenced by remote variations in the atmosphere–ocean systems via teleconnections. Sea surface temperatures (SSTs) play an important role in modulating rainfall variability since the ocean surface accumulates energy due to its thermal inertia, and this energy is released into the atmosphere some months later, adding predictability. Idealized SST anomalies have been used to force global and regional circulation models to simulate rainfall variability and study the physical mechanisms behind the variability over various regions [19,20,21,22,23]. These studies and others based on observations [24,25,26,27,28,29,30] have suggested that the SST’s role in modulating rainfall variability is either quite direct—through enhanced convection over warm waters, for instance—or indirect—through an alteration in the position of ITCZ. In particular, an anomalous SST in the tropical Pacific during ENSO has an impact on Sahelian countries’ rainy season, in which a warming over the tropical Pacific is associated with deep convection and upper level divergence over the Indian Ocean and with a descending branch over the Sahel and a reduction in rainfall [31,32,33]. It is likely that other mechanisms also contribute to the teleconnection between the African sector and the tropical Pacific as well [34]. The impact of basins can vary according to the type of rainfall event. Studies have shown that moderate events appear to be enhanced by positive SST anomalies over the tropical North Atlantic and Mediterranean. The Mediterranean Sea is the main moisture source for Sahelian rainfall; however, it is rarely dominant (greater than 50%; [35]). We can see that their average contribution for the total number of cases is practically the same (34.6% Mediterranean Sea vs. 34.7% Atlantic). However, in the most extreme cases, the contribution of the Atlantic is higher. In years when the Mediterranean SST is warmer than average, increased evaporation leads to enhanced moisture content in the lower troposphere that is advected southwards into the Sahel by the low-level mean flow across the eastern Sahara. The resulting increased moisture convergence over the Sahel feeds the convective activity, leading to increased precipitation. Hence, extensive knowledge of precipitation extremes is immensely useful for authorities to mitigate and reduce these impacts. In many regions, precipitation extremes correlate well with occurrences of ENSO events ([36,37]). Indeed, during a La Niña phase combined with a warming of the Mediterranean, vertical atmospheric instability is increased over the Sahel, and the transport of moisture in the lower layers from the equatorial Atlantic is strengthened over the region, which tends to favor convective activity and therefore extreme events rainfall [38,39]. Thus, it is important to improve our understanding of the multi-scale variability of these intraseasonal descriptors in order to make their predictability more effective.
This article therefore seeks to improve the existing knowledge of intraseasonal descriptors by considering two main aspects. The first aspect is a further characterization of six intraseasonal descriptor indices across Senegal using datasets from the Expert Team on Climate Change Detection and Indices (ETCCDI) [40] and CHIRPS [41]. This will enable the users of the climate predictions to consider the options available before the start of the rainfall season depending on the predictions made. The second aspect focuses on the interannual variability of these indices, searching for oceanic sources of predictability worldwide to provide skillful seasonal forecasts that may help the users of climate predictions to make more informed decisions.
Section 2 describes the data used for the study (Section 2.1), the definition of the different ETCCDI indices, as well as methods for determining the links between large-scale SST patterns and intraseasonal descriptors of the rainy season in Senegal. This methodology of defining oceanic and climate indicators can be integrated into early warning systems for many impacts. The results obtained from the different analyses are presented together with the discussions in Section 3. The last section highlights the main conclusions of the study and recommendations.

2. Materials and Method
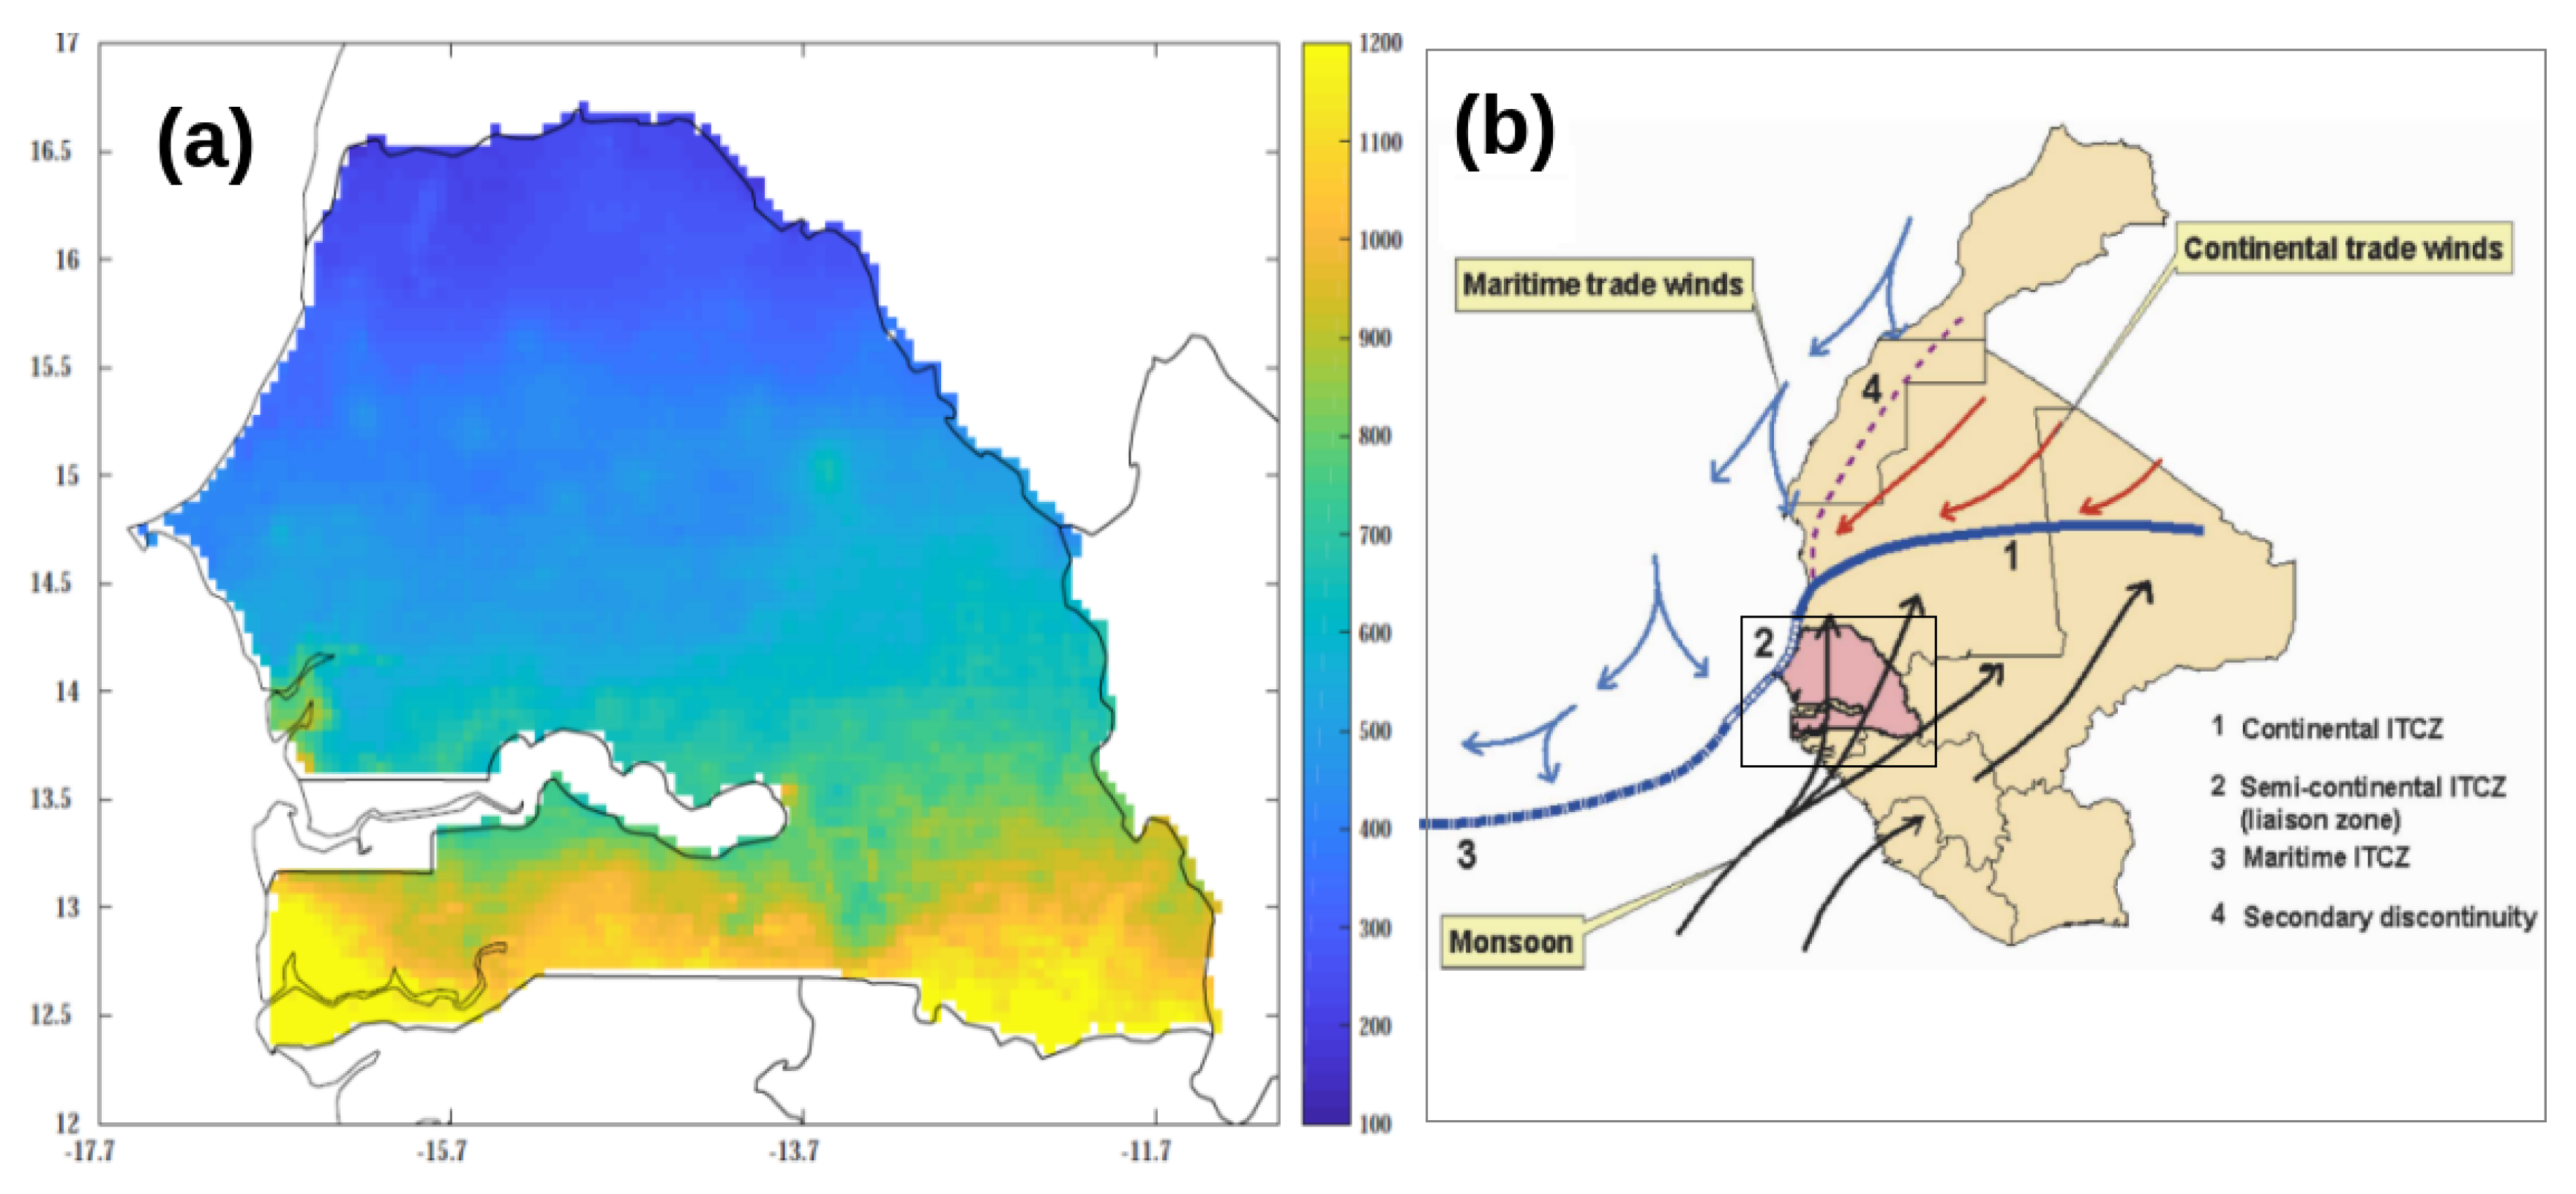
2.1. Study Area

Senegal is the westernmost country in Africa, bordered by the Atlantic Ocean on its western border (Figure 1). The country is located between latitudes 12 ° 30 and 16 ° 30 N and longitudes 11 ° 30 and 17 ° 30 W. Its topography is generally free of steep terrain—its altitude is not greater than 130 m, with the exception of a small portion in the southeast, where the highest elevation is 581 m. Two factors play an important role in determining Senegal’s climate: (i) the absence of significant topography—the country is largely open to different air masses—and (ii) the geographical position—the country lies entirely within the tropical region. In Senegal, the rainy season lasts from early May in the south (June–July in the north) to late October (early October in the north). It begins in the south and spreads north in conjunction with the ITCZ as it migrates northward, thus reaching the whole territory and bringing moisture from the Atlantic Ocean. Rainfall occurs in a single rainy season that extends from June–July to October–November (Figure 1). This rainfall is characterized by high spatial and temporal variability and periodic droughts, particularly during the 1970s and 1980s [42]. However, since the 1990s, annual rainfall amounts in Senegal, as in West Africa [1,43,44,45], have shown an increasing trend, although not reaching the values of the 1950s.

2.2. Data

The scarcity of ground observations makes it difficult to study the characterization of intraseasonal descriptors. Consequently, the rainfall data from the CHIRPS version 2 developed by the Climate Hazards Group of the University of California were used. The CHIRPS algorithm combines three main data sources: (a) the Climate Hazards group Precipitation climatology (CHPclim), a global precipitation climatology at 0.05 ° latitude/longitude resolution estimated for each month based on station data, averaged satellite observations, elevation, latitude and longitude [41,47]; (b) TIR-based satellite precipitation estimates (IRP); and (c) in situ rain-gauge measurements. The CHPclim is distinct from other precipitation climatologies in that it uses long-term average satellite rainfall fields as a guide to deriving climatological surfaces.
According to previous studies by [48], CHIRPS is very close to the commonly used satellite products CMORPH [49], TMPA [50], PERSIANN [51] and TRMM [50] at the decadal, monthly and seasonal time scales in West Africa. They noticed a fair proximity of the seasonal trends (1981–2015) of the mean precipitation, the number of wet days, precipitation intensity and average dry spell length analysis, from the CHIRPS dataset against 18 daily rain gauge stations—listed in [52]—across the Sahel and the Guinea Coast. They further mentioned an exception along the Guinea Coast where, unlike the rain gauge stations, the CHIRPS dataset shows a tendency towards more (less) frequent and less (more) intense precipitation during both rainy seasons (during the first rainy season). This study aims to characterize intraseasonal descriptors indices and their predictability using global SST anomalies. The SST dataset from the Met Office HadISST is used and regressed on precipitation indices to search for possible oceanic teleconnections [53].
The Hadley Centre Global Sea Ice and Sea Surface Temperature (HadISST) is a combination of monthly globally complete fields of SST and sea ice concentration from 1871 to the present. HadISST uses reduced space optimal interpolation applied to SSTs from the Marine Data Bank (mainly ship tracks) and ICOADS since 1981 and a blend of in situ and adjusted satellite-derived SSTs for 1982 onward.

2.3. Metrics

We focused on CHIRPS daily data for the period 1981–2018 to compute descriptors of the rainy season: onset, cessation, length of the rainy season (LRS), very wet days (NRs) and consecutive dry days (CDDs) (see Table 1). Following previous studies [52,54,55], we use a threshold of 1 mm to define a rainy day, as it is more resistant to measurement errors associated with low precipitation and asserted that precipitation below this amount evaporates directly. Based on the Sivakumar agroclimatic onset concept [56] and the work of [16], we define the agronomic onset date (hereinafter referred to as onset) as the first wet day of a 3-day wet spell receiving at least 20 mm without any 10-day dry spell in the following 20 days from 1 May. Cessation is quantified by considering the date after 1 September on which a long dry spell lasting 20 days or 2 dekads [57] occurs. The length of the rainy season (days) for a year is taken as the difference between the Julian day numbers of the determined cessation date and the determined onset date for that year. We compute three types of consecutive dry days (CDD, CDD7 and CDD15) and three categories of very wet days: NR90p, NR95p and NR99p, which are, respectively, above 90, 95 and 99 percentiles. These wet indices are defined as very wet days and represent the accumulated amount of precipitation that is above the threshold during all wet days over the given period (1981–2018) from May to November. The indices used in this study are crucial for the socio-economic activities mainly dependent on agriculture. For instance, the onset is closely associated with the ideal sowing date. Indeed, the sowing date is defined as the day when plant-available water in soil is greater than 10 mm at the end of the day. With regard to wet days, thresholds are set to assess moderate extremes that typically occur a few times every year rather than high impact (once-in-a-decade weather events). Nevertheless, in countries with less adaptive capacity, those moderate extremes may threaten livelihoods. These nine metrics were computed from May to November, thus covering the rainy season in the whole of the country. The details of these metrics are presented below.
Furthermore, the coefficient of variation (CV) is a statistical measure of the variation in cumulative seasonal precipitation as a function of climatology. A higher CV value is an indicator of greater interannual variability and vice versa. The degree of variability of rainfall events has been classified in as low (CV < 20), moderate (20 < CV < 30) and high (CV > 30) in the literature.

2.4. Regression Analysis

In order to assess the seasonal predictability of the various intraseasonal descriptors of the rainy season, a linear regression analysis is used to develop an empirical statistical prediction model with a sufficient lead time. We considered four basins: the North Atlantic delimited by [lon = 30S, lon = 5S and lat = 10E, lat = 25E]; [lon = 5S, lon = 10S and lat = 2W, lat = 2E] by the South Atlantic, the Equatorial Pacific: [lon = 170S, lon = 90S and lat = 5W, lat = 5E] and the Mediterranean: [lon = 0, lon = 20N and lat = 30E, lat = 45E]. The forecast period corresponds to the peak of the WAM July to September (JAS), and the predictability of the nine intraseasonal descriptors of the rainy season is analyzed considering lags from 0 (JAS) to 6 (JFM) (see [58]). The time lag was 1 month, and lags 6 (January–March sequence) to 0 (July–September sequence) were used in this analysis. The regression map of the global anomalous SST onto onset, cessation and LRS. We follow the evolution of the spatial structure of the SST with a lag of one month. It should be noted that regression provides a statistical result on the relationship/co-variability of two variables. When a base index is correlated with each time-series in a gridded field, the map can be an effective description of teleconnection patterns. In order to capture the significance relation between predictor and predictand, the non-parametric Monte Carlo method is used under a given number of random permutations. Statistical significance is set at the 95% (0.05) level using the Monte Carlo method (1000 permutations). A total of 1000 pairs of random time series of the same length as the original one that have been low-frequency filtered using the same filter are applied. In the present study, the significance level has been set to 95% ( α = 0.05).

3. Results

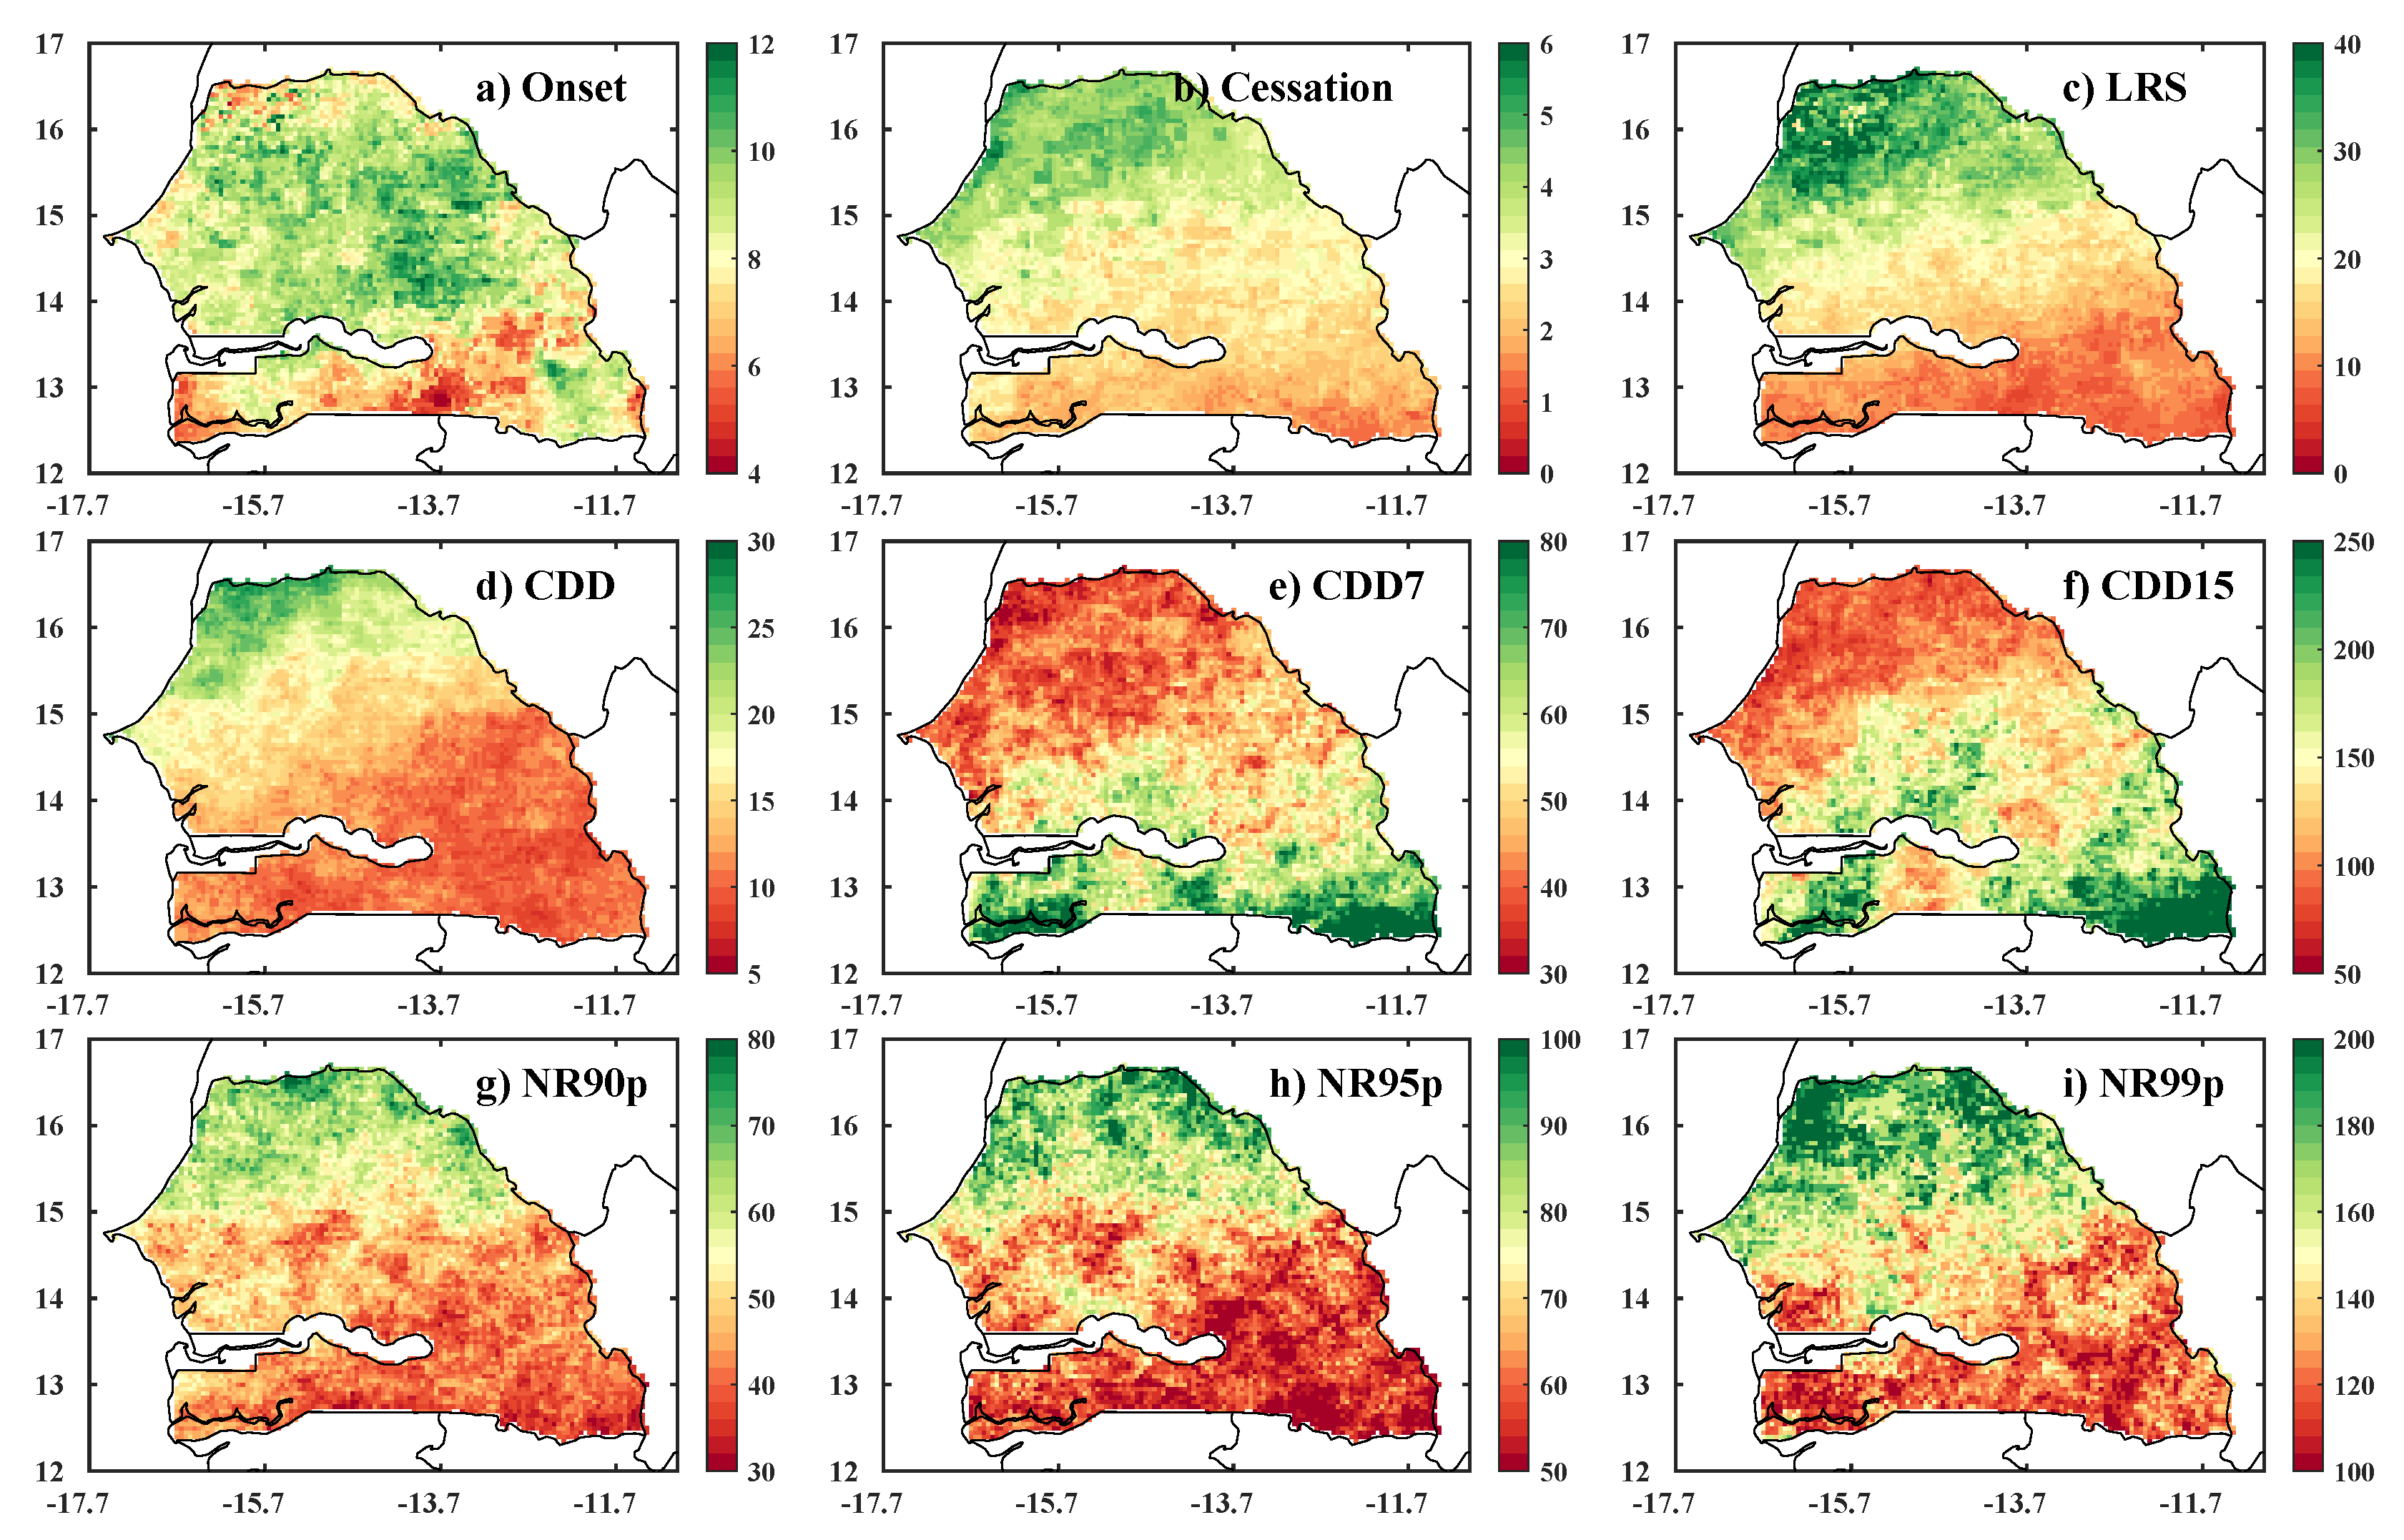
3.1. Spatial Variability of Metrics

The first step in this characterization is the assessment of the spatial variability of the nine descriptors of the rainy season used in this study. Figure 2 shows the mean value per season of each metric computed over the period 1981–2018 during the rainy season defined from May to November. We notice that all metrics exhibit a fairly strong meridional gradient. Firstly, the rainy season is longer in the south of the country, with an earlier start and a late cessation compared to the north. This difference in the length of the rainy season can reach sometimes 100 days between the north and the south of the country.
However, the largest differences are observed with dry spells. Looking at all categories of dry spells in terms of duration, a surprising South–North gradient is observed (Figure 2d). In fact, there are more CDDs in the south than in the north of the country. This result can be explained by the number of CDDs, as they are more frequent than CDD7 and CDD15. This short duration gives them a humid characteristic, as a succession of short CDDs finally leads to a fairly abundant rainfall. Conversely, for CDD7 (medium) and CDD15 (long), a more evident gradient is observed with a greater occurrence of these medium and long CDDs in the north of the country (Figure 2e,f). With regards to heavy rainfalls, the number of NR90p, NR95p, NR99p days and all CDDs have similar characteristics, with a similar pattern to the mean annual rainfall with a north–south gradient. For these extreme rainfall events, the disparities are rather in their numbers. The south of the country can record up to 10 NR90p, 5 NR95p and 1 NR99p per season, while in the north, these events are five times less frequent. These results are consistent with those described in [59] for their ‘semi-arid regions’ (category corresponding to countries such as Senegal). Indeed, the ITCZ controls Senegal’s wet season. It consists of a large-scale ascendance zone onto which the NW and NE trade winds, as well as the SW monsoon, converge, combining air masses from both hemispheres [60,61]. The ITCZ is characterized by a mobile band of cloudiness and rainfall, shifting in a north–south seasonal pattern, in relation to the apparent movement of the sun (with a typical lag of 6 weeks). Over Senegal, the ITCZ often has a NE–SW orientation and appears as a transitional branch linking the continental ITCZ with the maritime ITCZ. It reaches its northernmost position in August. The migration of the ITCZ determines the onset and duration of the wet season [62].
For a more precise analysis of these rainfall characteristics, the interannual variability of the nine metrics (see Figure 3) is conducted through the coefficient of variation (CVs). In contrast to spatial variability, we find that the interannual variability of the onset shows a weak south–north gradient as opposed to cessation. The cessation is more variable in the north (6%) compared to the south, where the variation rarely exceeds 1% of the climatology. Overall, there is more interannual variability in the onset dates, while the timing of the start of the rainy season is crucial in deciding when to sow crops [63].
On the other hand, comparing the whole dry spell (CDD) with the long dry spells (CDD7 and CDD15), the inversion of the meridional gradient observed in the spatial variability persists with the interannual variability. Indeed, the total duration of dry periods (CDDs) shows greater variability in the north of the country. This suggests that they constitute a limiting factor on the availability of water, which can affect crops in this region of the country, while CDD7 and CDD15 show similar trends with stronger CVs in the south of the country. Concerning the indicators of heavy precipitation (NR90p, NR95p, NR99p), high variability in the CVs is observed despite the presence of the gradient. This fluctuation in extreme events is partly explained by the trend observed in the recent period. However, the authors show this information to be wrong for Senegal (Figure 2 and Figure 4). Indeed, several authors have documented that the rainfall recovery in the Sahel is marked by an increase in extreme rainfall events [64,65]. Moreover, the frequency and intensity of extreme events are returning to what was observed before the drought [66].

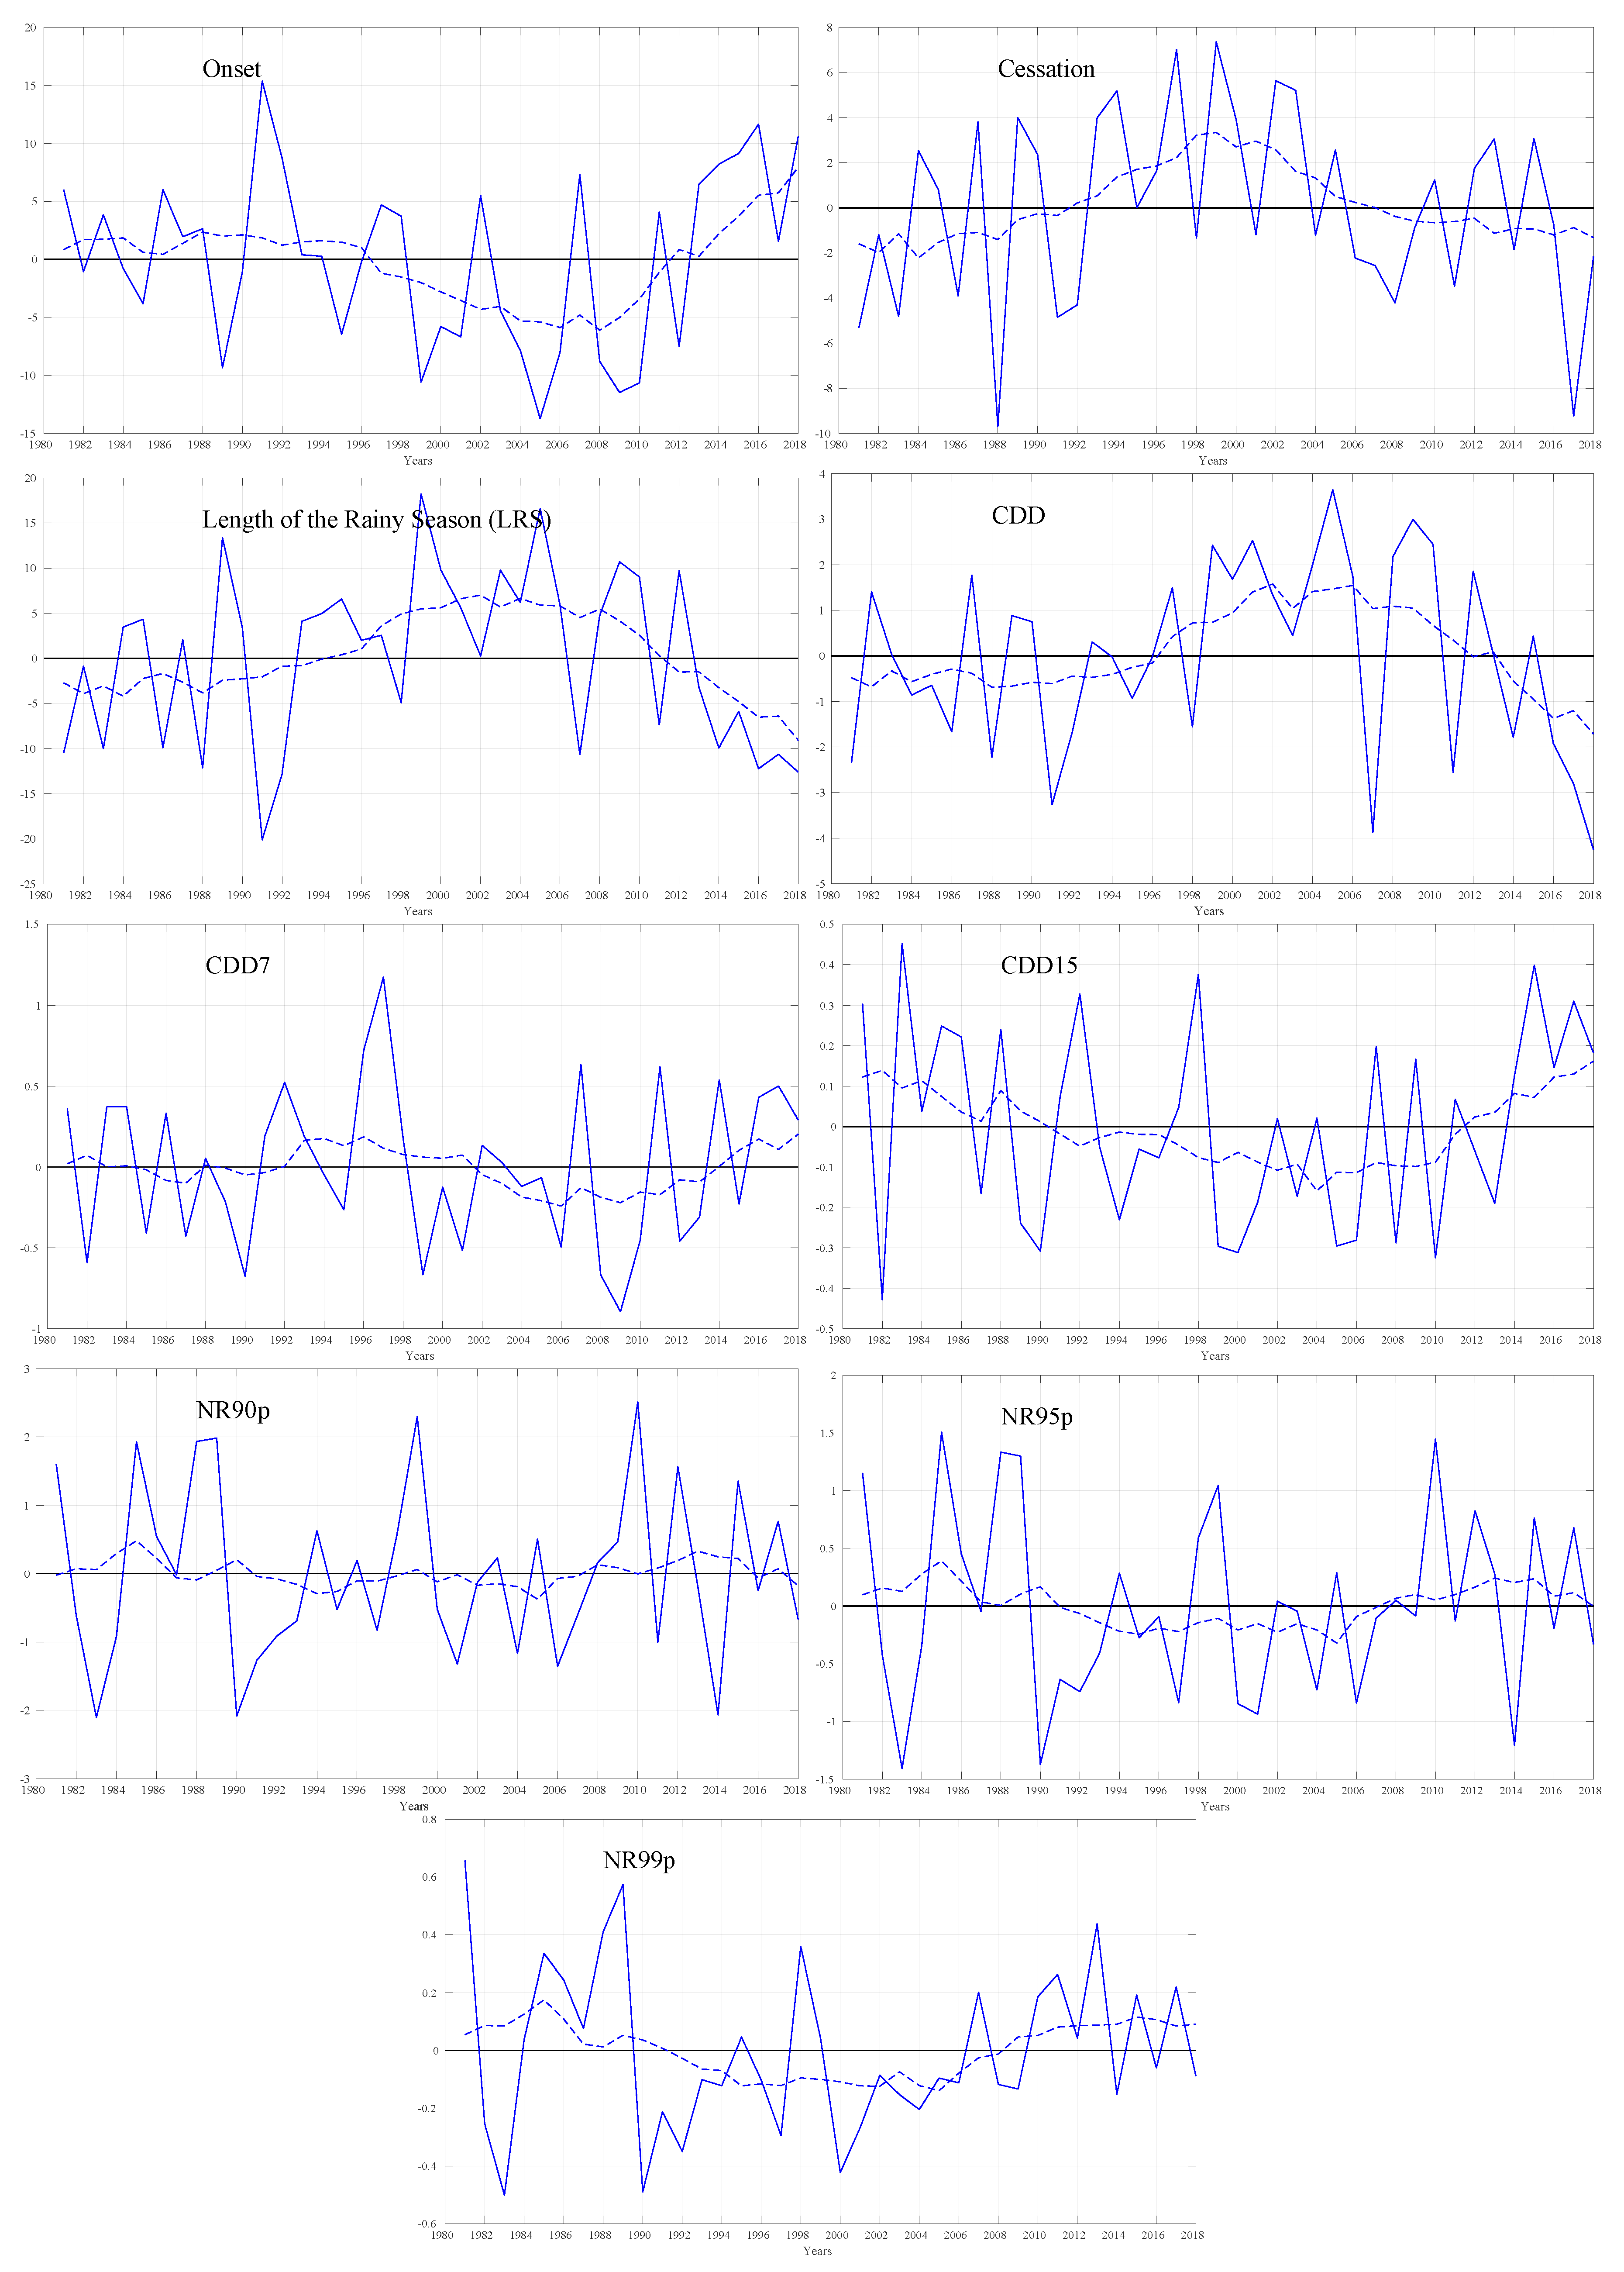
3.2. Interannual Variability

For this, we have firstly analyzed the trends (1981–2018) of all nine metrics averaged over Senegal. Table 2 reports the trends for all descriptors of the rainy season. The results show that Onset, CDD7, CDD15 and NR99p exhibited negative trends, while cessation, LRS, CDD and both NR90p, NR95p exhibited positive trends. However, only CDD7 and CDD15 present significant decreases, while CDD shows significant increases. The remaining metrics were found to have insignificant trends. The existence of a significant or insignificant trend is deemed at a p-value (see Table 2) lower or equal to 5% equivalent to a 95% confidence level.
Nevertheless, the analysis of detrended rainfall indices is useful for characterizing interannual variability. Figure 4 shows the interannual evolution and five-year mean of spatial averages for all nine detrended metrics for 1981–2018 over Senegal. The five-year mean shows three specific periods in the evolution of these descriptors of the rainy season. The first extends from 1981 to 1996 and is characterized by slightly late season starts, early season ends and, consequently, shorter rainy season lengths. During the same period, we found that the number of CDDs per season decreased, while long periods of drought, particularly CDD15, increased. On the wet events side, these three phases are more visible with extreme events (NR99p) compared to NR90p and NR95p. In fact, during this first phase, a slight increase in these heavy rains has been observed. This result is in line with the conclusions of [38], who noted a recovery of these extreme wet events in this first period. Although in terms of the length of the season and dry spells, drought persisted during this period.
A second phase occurred from 1997 to 2011, clearly showing a recovery to wetter conditions. Indeed, during this period, an early onset of the season was observed (up to 14 days before the average start on 7 July). Additionally, long and extreme dry spells were also much reduced while the number of CDD decreased. The increase in CDDs is explained by the high occurrence of short duration dry spells (dry spells lasting less than 7 days), which highlights better rainy activity during this period. However, despite these wet conditions, this period recorded a decrease in extreme events, particularly NR95p and NR99p, compared to the first period. The characteristics of this period were observed by [38], who showed that since the late 1990s, the five-year mean rainfall had recovered to more stable intermediate levels but had retained strong interannual variability.
Finally, since 2012, a third period is observed; it is quite similar to the first period in terms of onset, cessation, the length of the season and the different categories of dry spells. Indeed, late onset and early cessation, which generate shortening seasons, characterize this recent period. For dry spells, we are observing a decrease in the number of CDDs controlled by short dry spells, whereas the long duration dry spells (CDD7 and CDD15) show a strong increase, often at a higher level than the first period. However, the most significant difference between this recent period and the first period concerns heavy rainfall. Indeed, this period is clearly marked by an increase in extreme rainfall events (NR99p). Analysis of the characteristics of this period clearly shows a mixing of dry spells and extreme events, which resembles what several authors have described as hybrid rainy seasons. According to [67,68,69], these new types of season are among the evidence of the intensification of rainfall patterns, which could be related to one of the consequences of global warming.

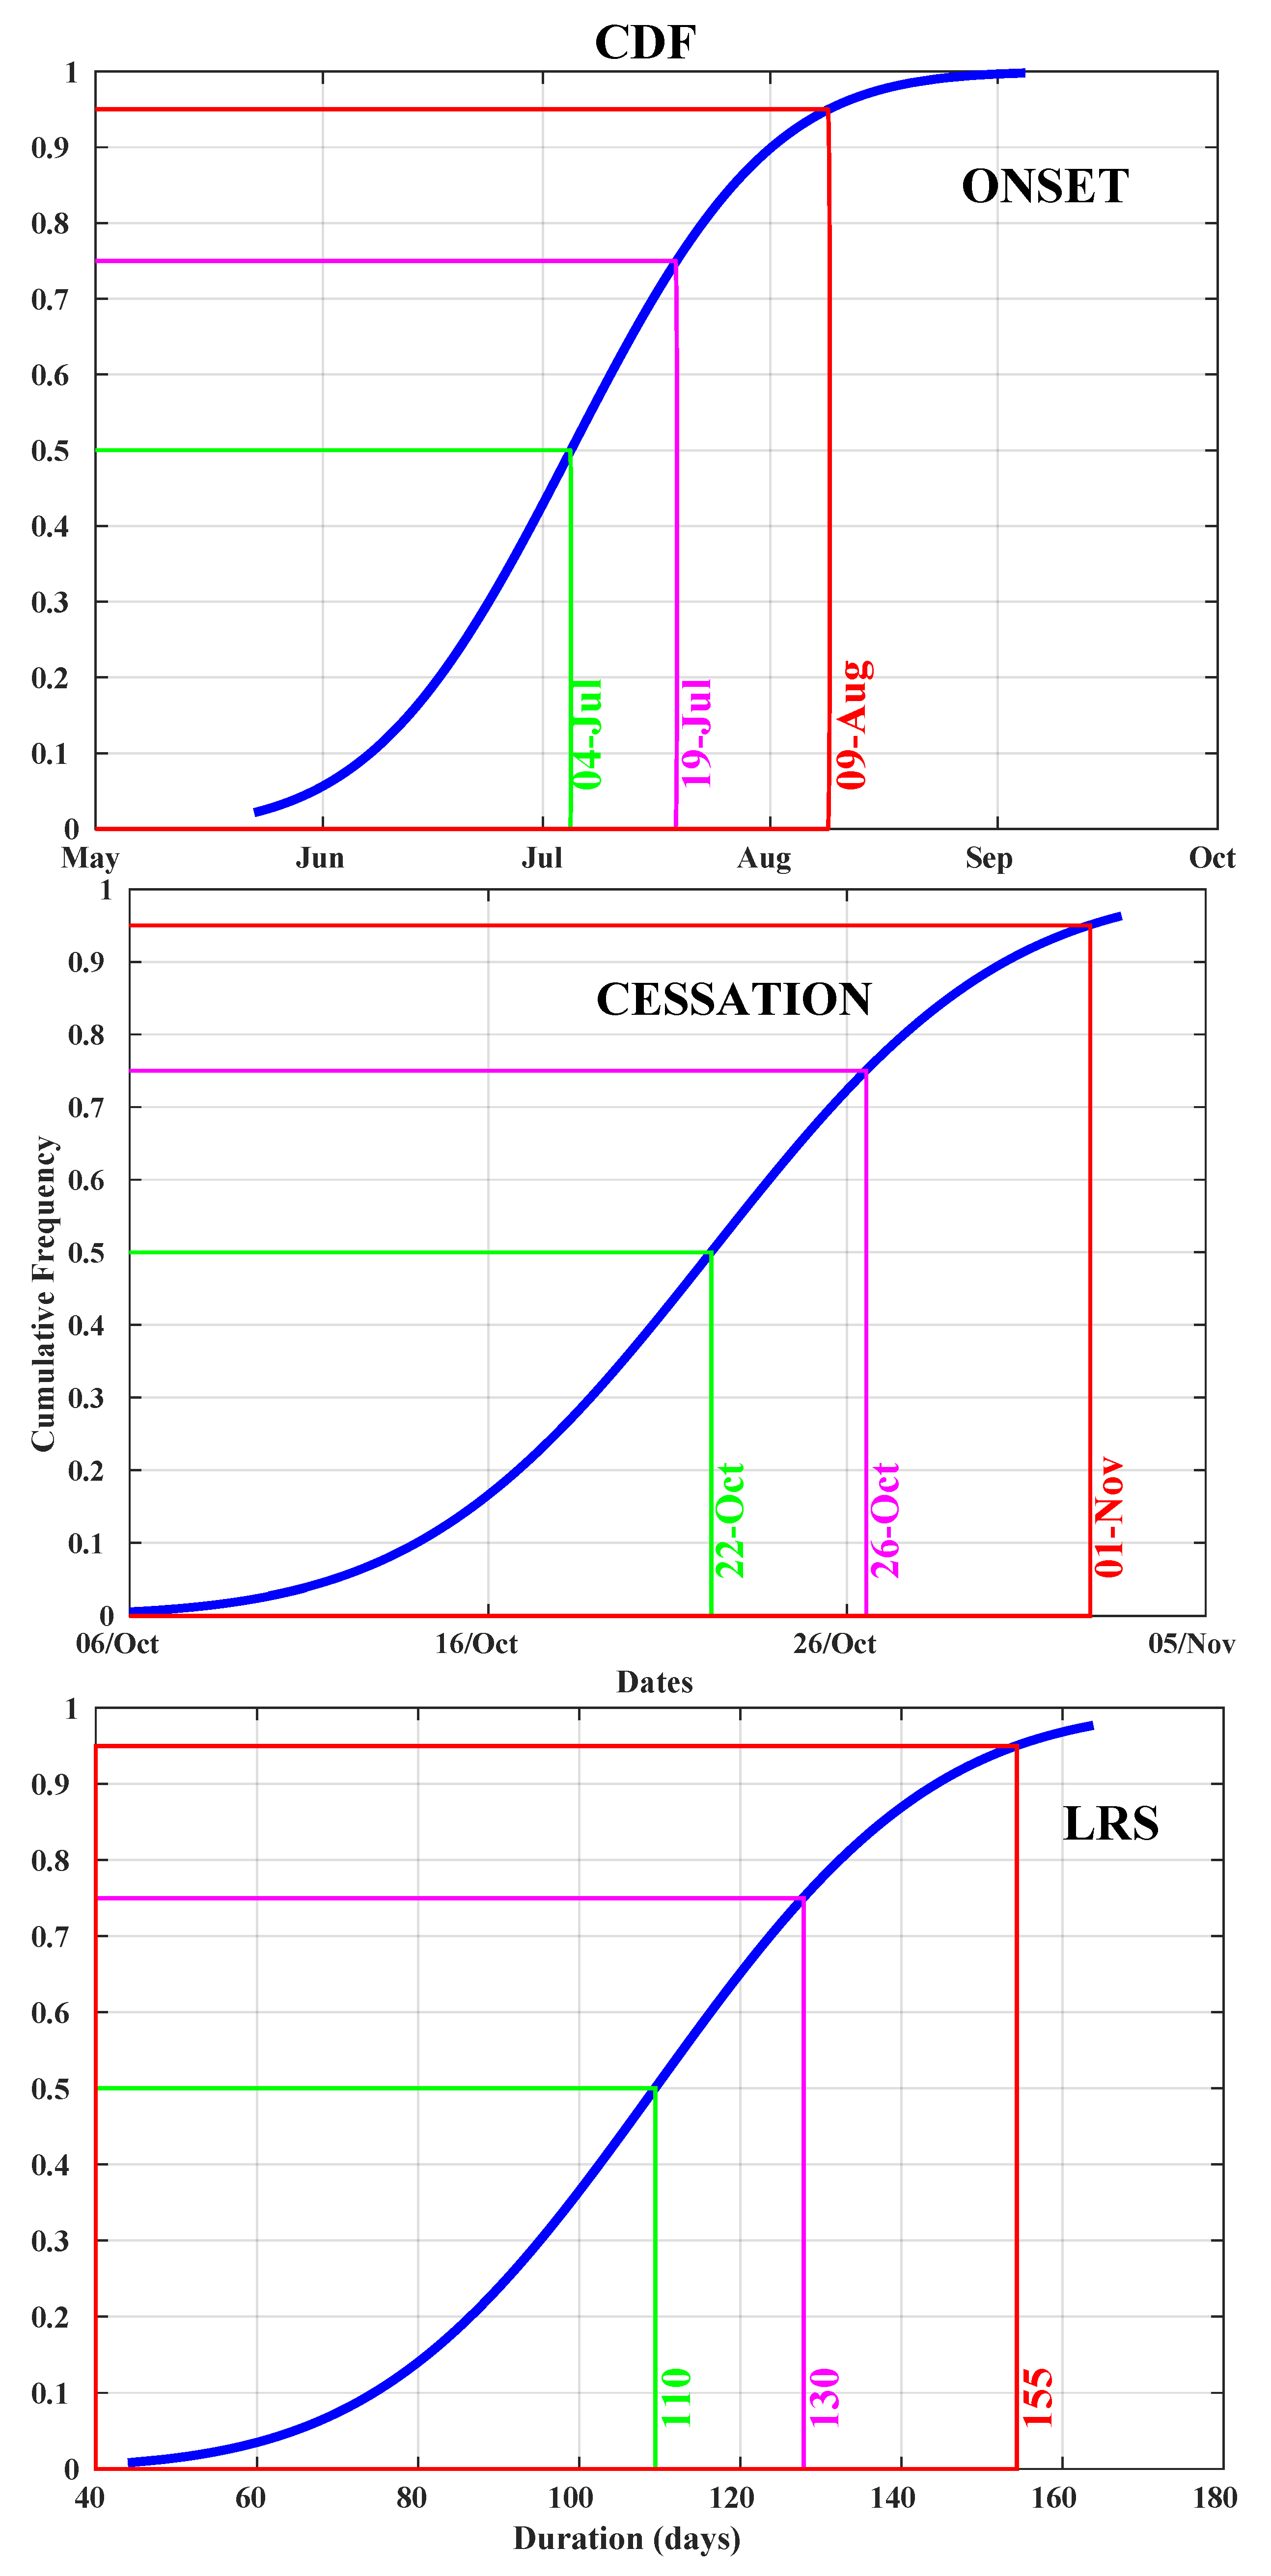
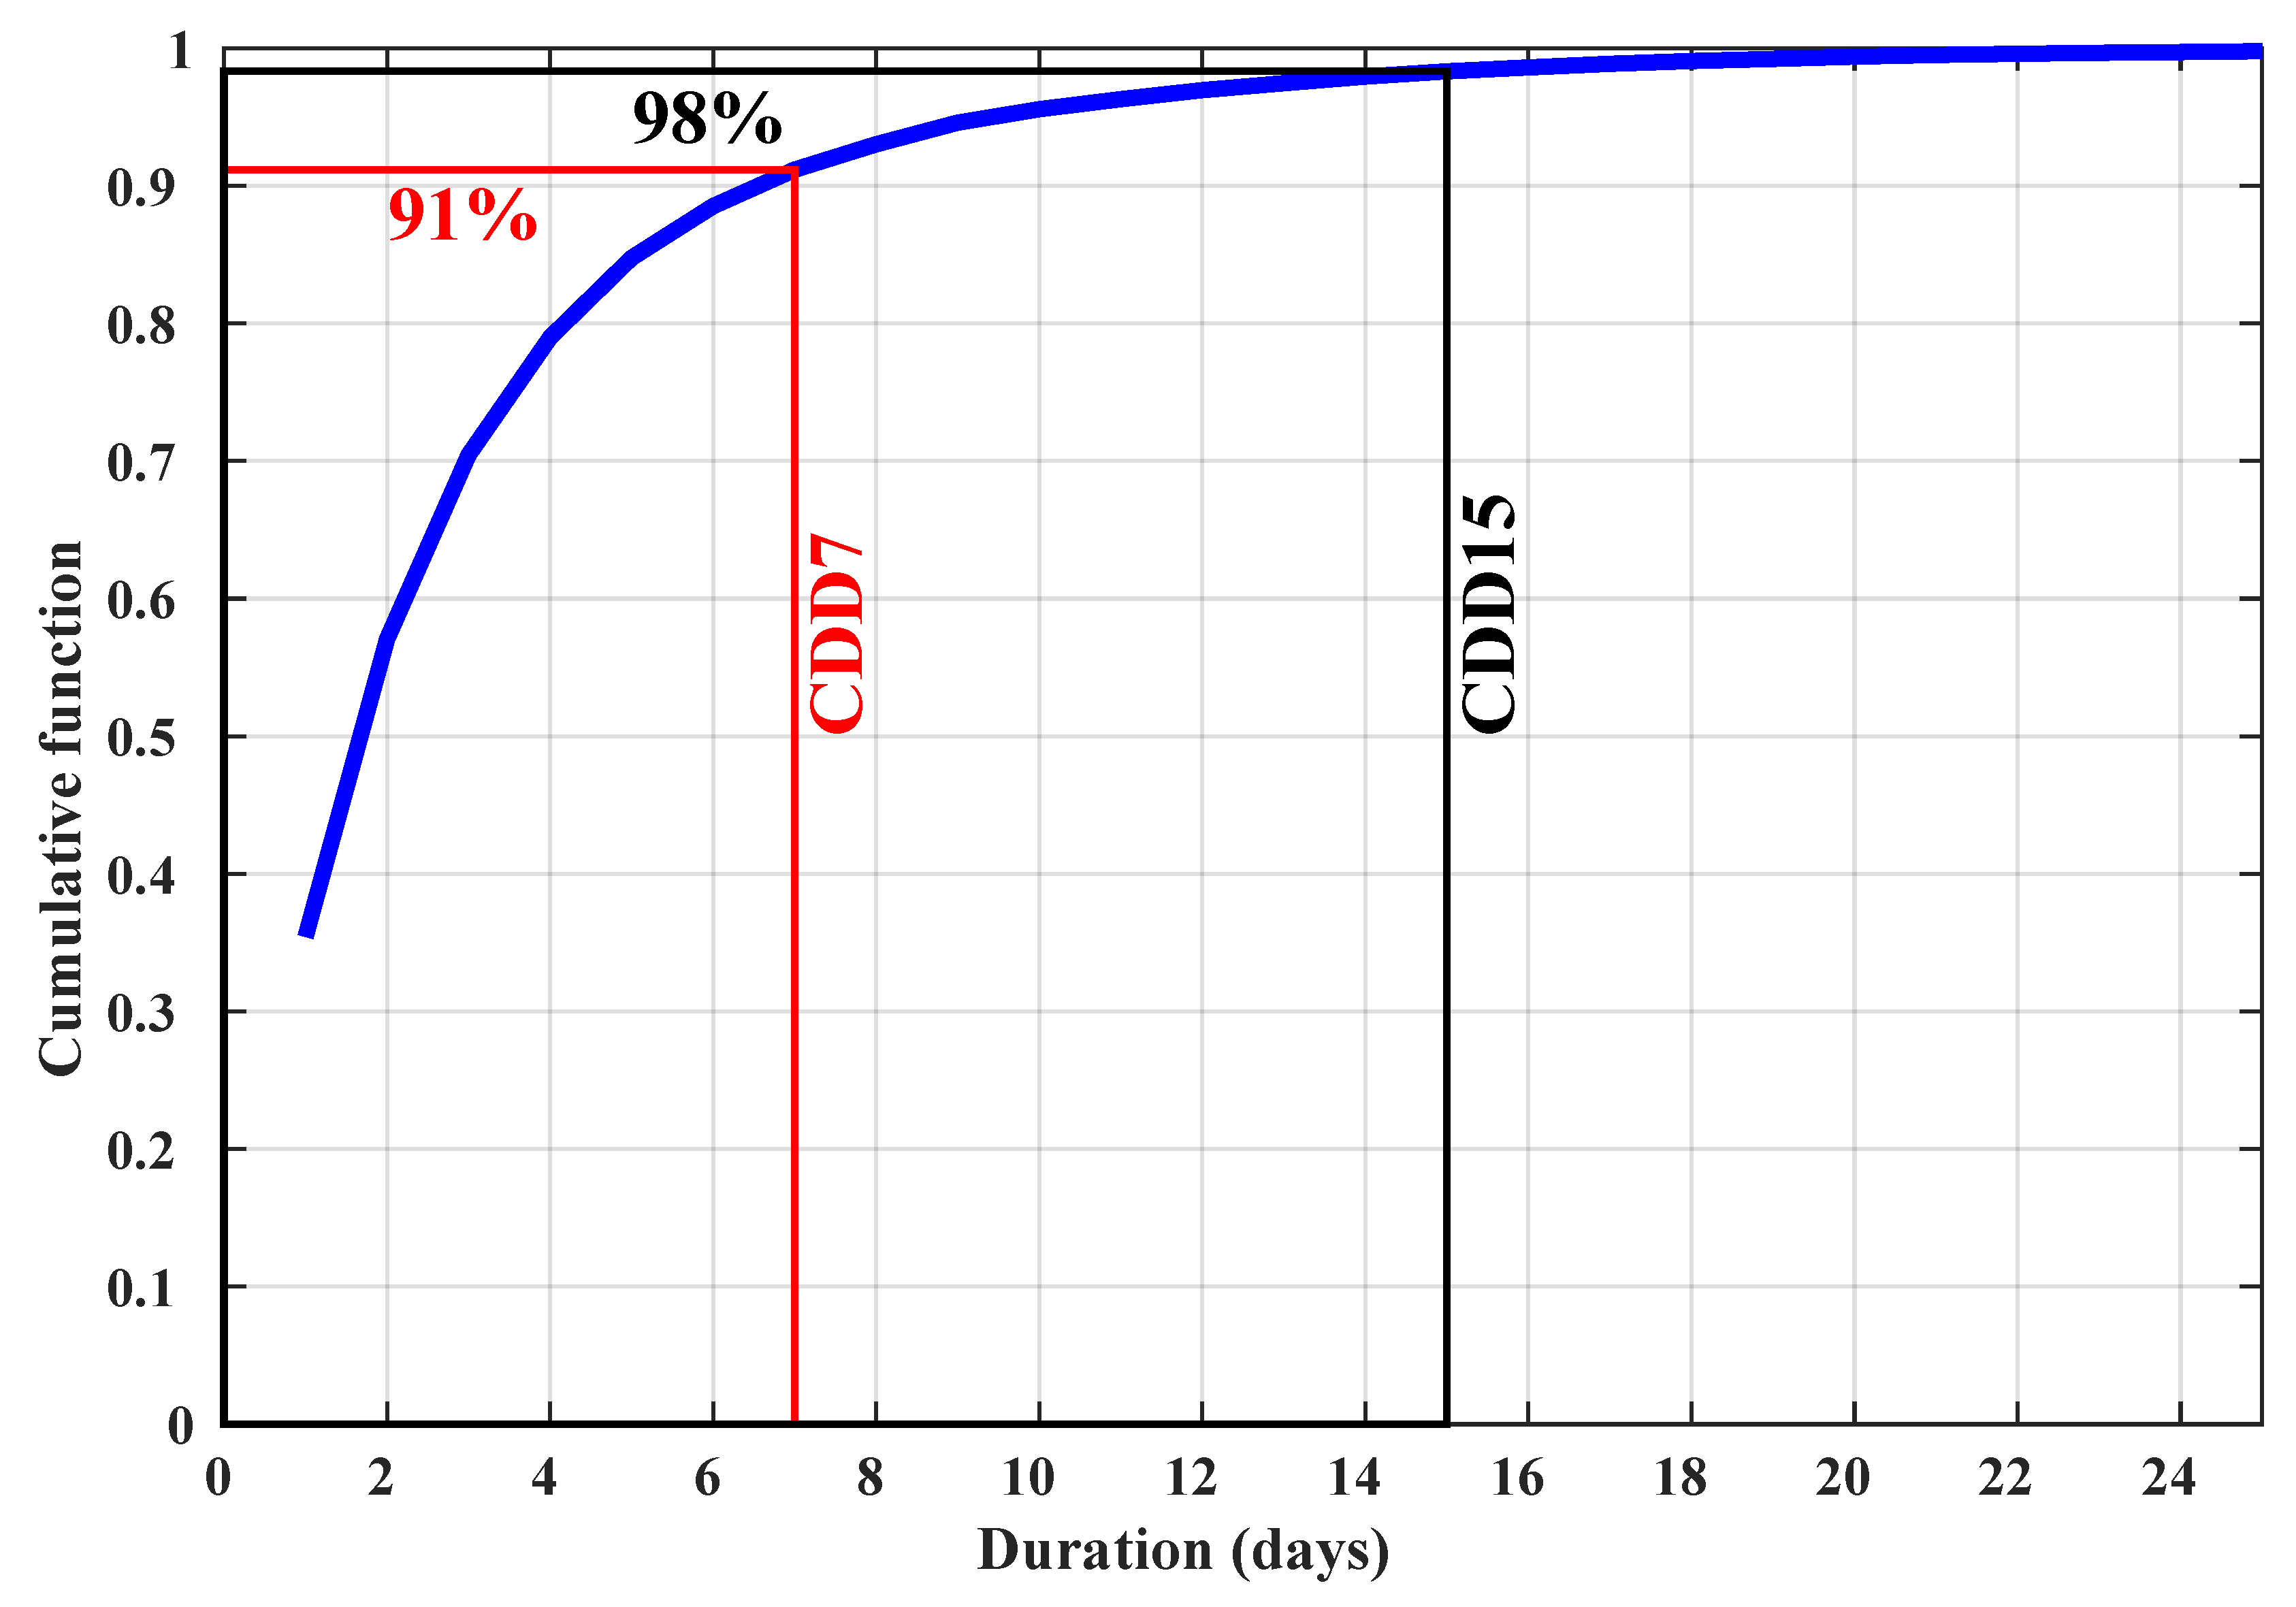
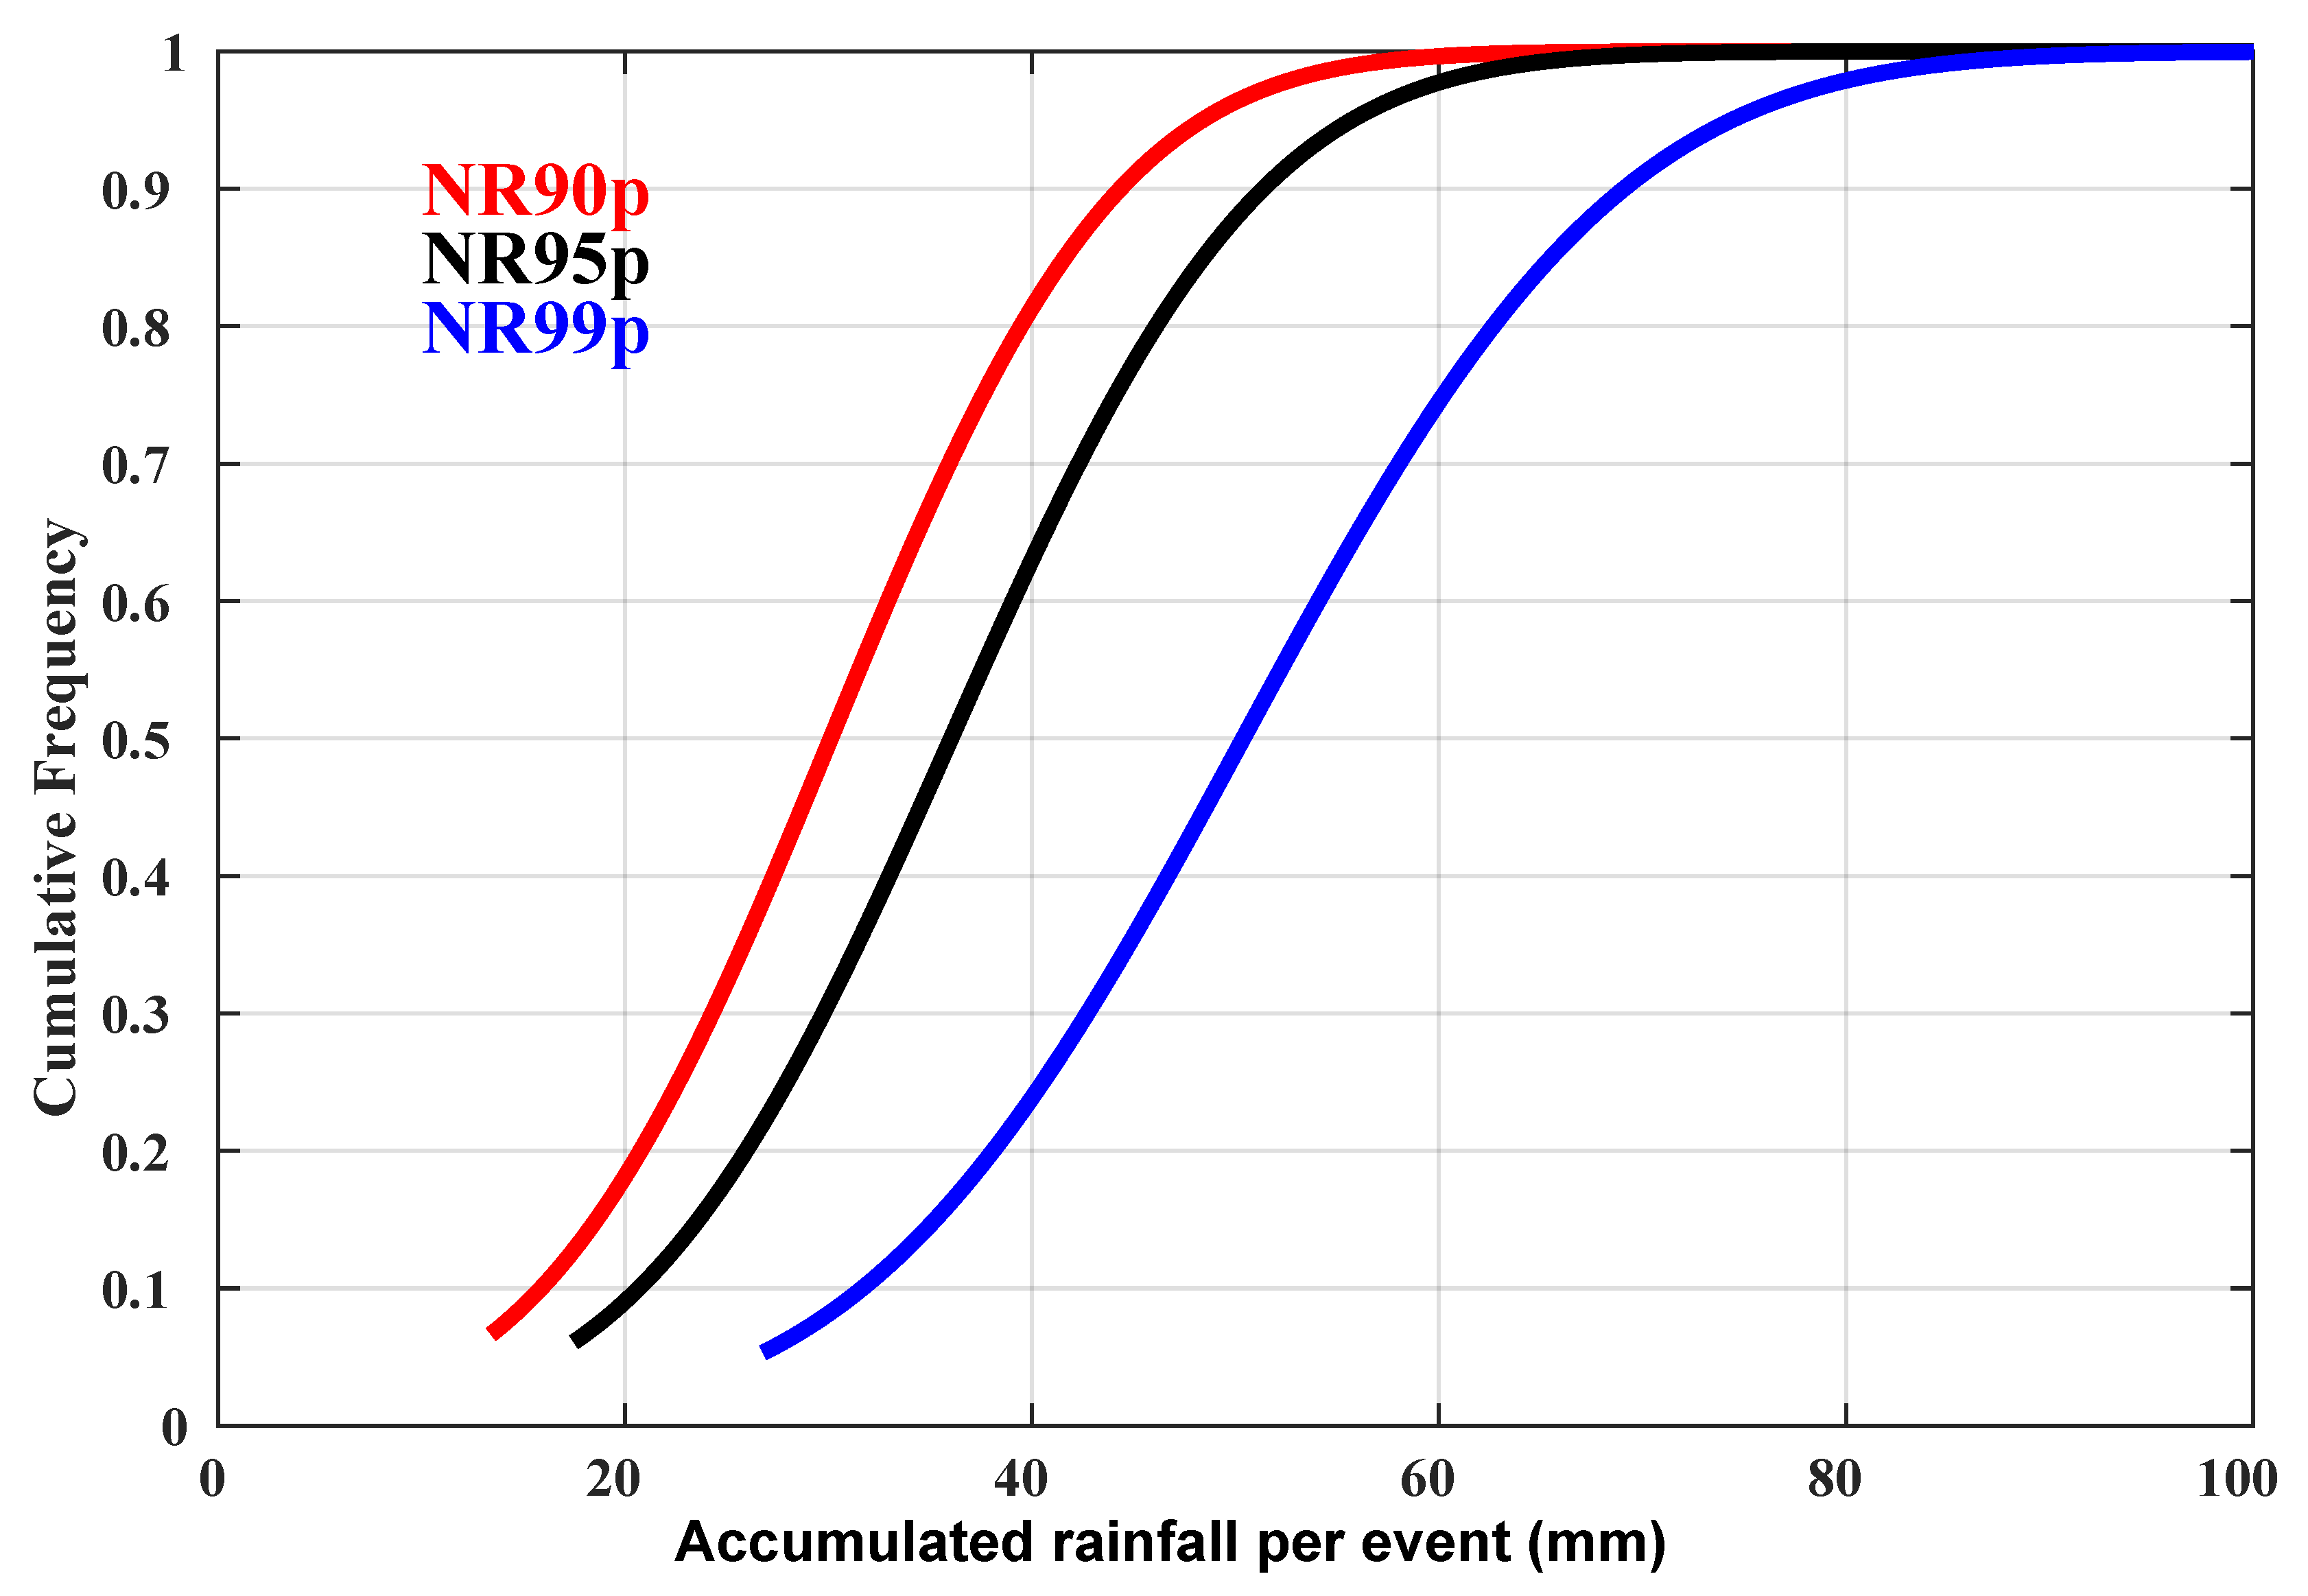
3.3. Descriptive Cumulative Distribution Function

In order to better characterize the spatial variability of these descriptors of the rainy season, the cumulative distribution was computed for the onset, cessation and length of the rainy season and plotted in Figure 5. The cumulative distribution shows that, from 1981 to 2018, the median of the grid points (50% of the distribution) displays an onset around 4 July, cessation around 22 October and around 110 days for the duration of the season. At the 75th Percentile, often considered moderate changes, the onset is observed for 19 July, 26 October for the cessation, and 130 days for the duration of the season. Finally, for most of Senegal (95th Percentile), we find that the latter onset can occur after 9 August, 1 November for the cessation and the season can extend to more than 155 days. However, the cessation shows a strong spatio-temporal coherence compared to the onset and length of the season (Figure 5). It is noteworthy that the difference between the median and the 95th percentile is only 10 days for the cessation, whereas for the onset, this difference is more than 1 month.
For the dry spells, the cumulative distribution was applied over the duration of all the dry spells. In Figure 2, Figure 3 and Figure 4, we noted a difference in behavior between CDD on the one hand and CDD7 and CDD15 on the other. These differences were explained by the predominance of short dry spells in CDDs. Due to their short duration, these events tend to express the wet character, unlike CDD7 and especially CDD15, which express drought. Figure 6 confirms this hypothesis with 70% of the dry spells lasting between 1 and 3 days. In contrast, less than 10% of the dry spells last more than 7 days. As for CDD15, it represents only 2% of all CDDs. Nevertheless, although these indices are widely used in the Sahel [43,54], they can have limits, particularly with regard to the absolute nature of the 7–15-day threshold. For instance, in the South, it is very rare to record 7 days without rain during the rainy season because of the high occurrence of the Mesoscale Convective System (MCS) and squall lines. Therefore, [70]’s definition that considers the amount of rainfall over defined periods may be appropriate and complementary to this definition. In order to avoid this problem inherent to the spatial gradient of the monsoon flow, we have applied the 90, 95 and 99 percentile thresholds over all rainy days. The cumulative distribution of these wet events shows that the difference in intensity between NR90p and NR95p days is not very large, at around 10 mm. Conversely, rainfall accumulations for the NR99p days can be close to double that on NR90p days. In fact, 50% of the most intense NR99p days exceed 50 mm, whereas, for NR90p and NR95p days, we have 30 mm and 35 mm, respectively. For the 20% of the most intense events where the NR99p register accumulations of more than 60 mm compared to around 40 mm for the NR90p and NR95p days. Consequently, the upward trend in these extreme wet events in the recent period (see Figure 7) is a sign of an intensification of the hydrological cycle. The term ’intensification of the hydrological cycle’ is used to denote this new regime of hybrid rainy seasons defined by a combination of long dry spells and intense rainy events when the rain occurs [71]. Other studies have reached similar conclusions. Ref. [72] focused on the seasonal and intraseasonal monsoon characteristics, including seasonal totals, onset and cessation and intraseasonal variability of the monsoon season. They observed a delayed onset and early retreat of the monsoon, along with the increased intensity of precipitation over the West Africa subregion, implying the growing season was shortened.

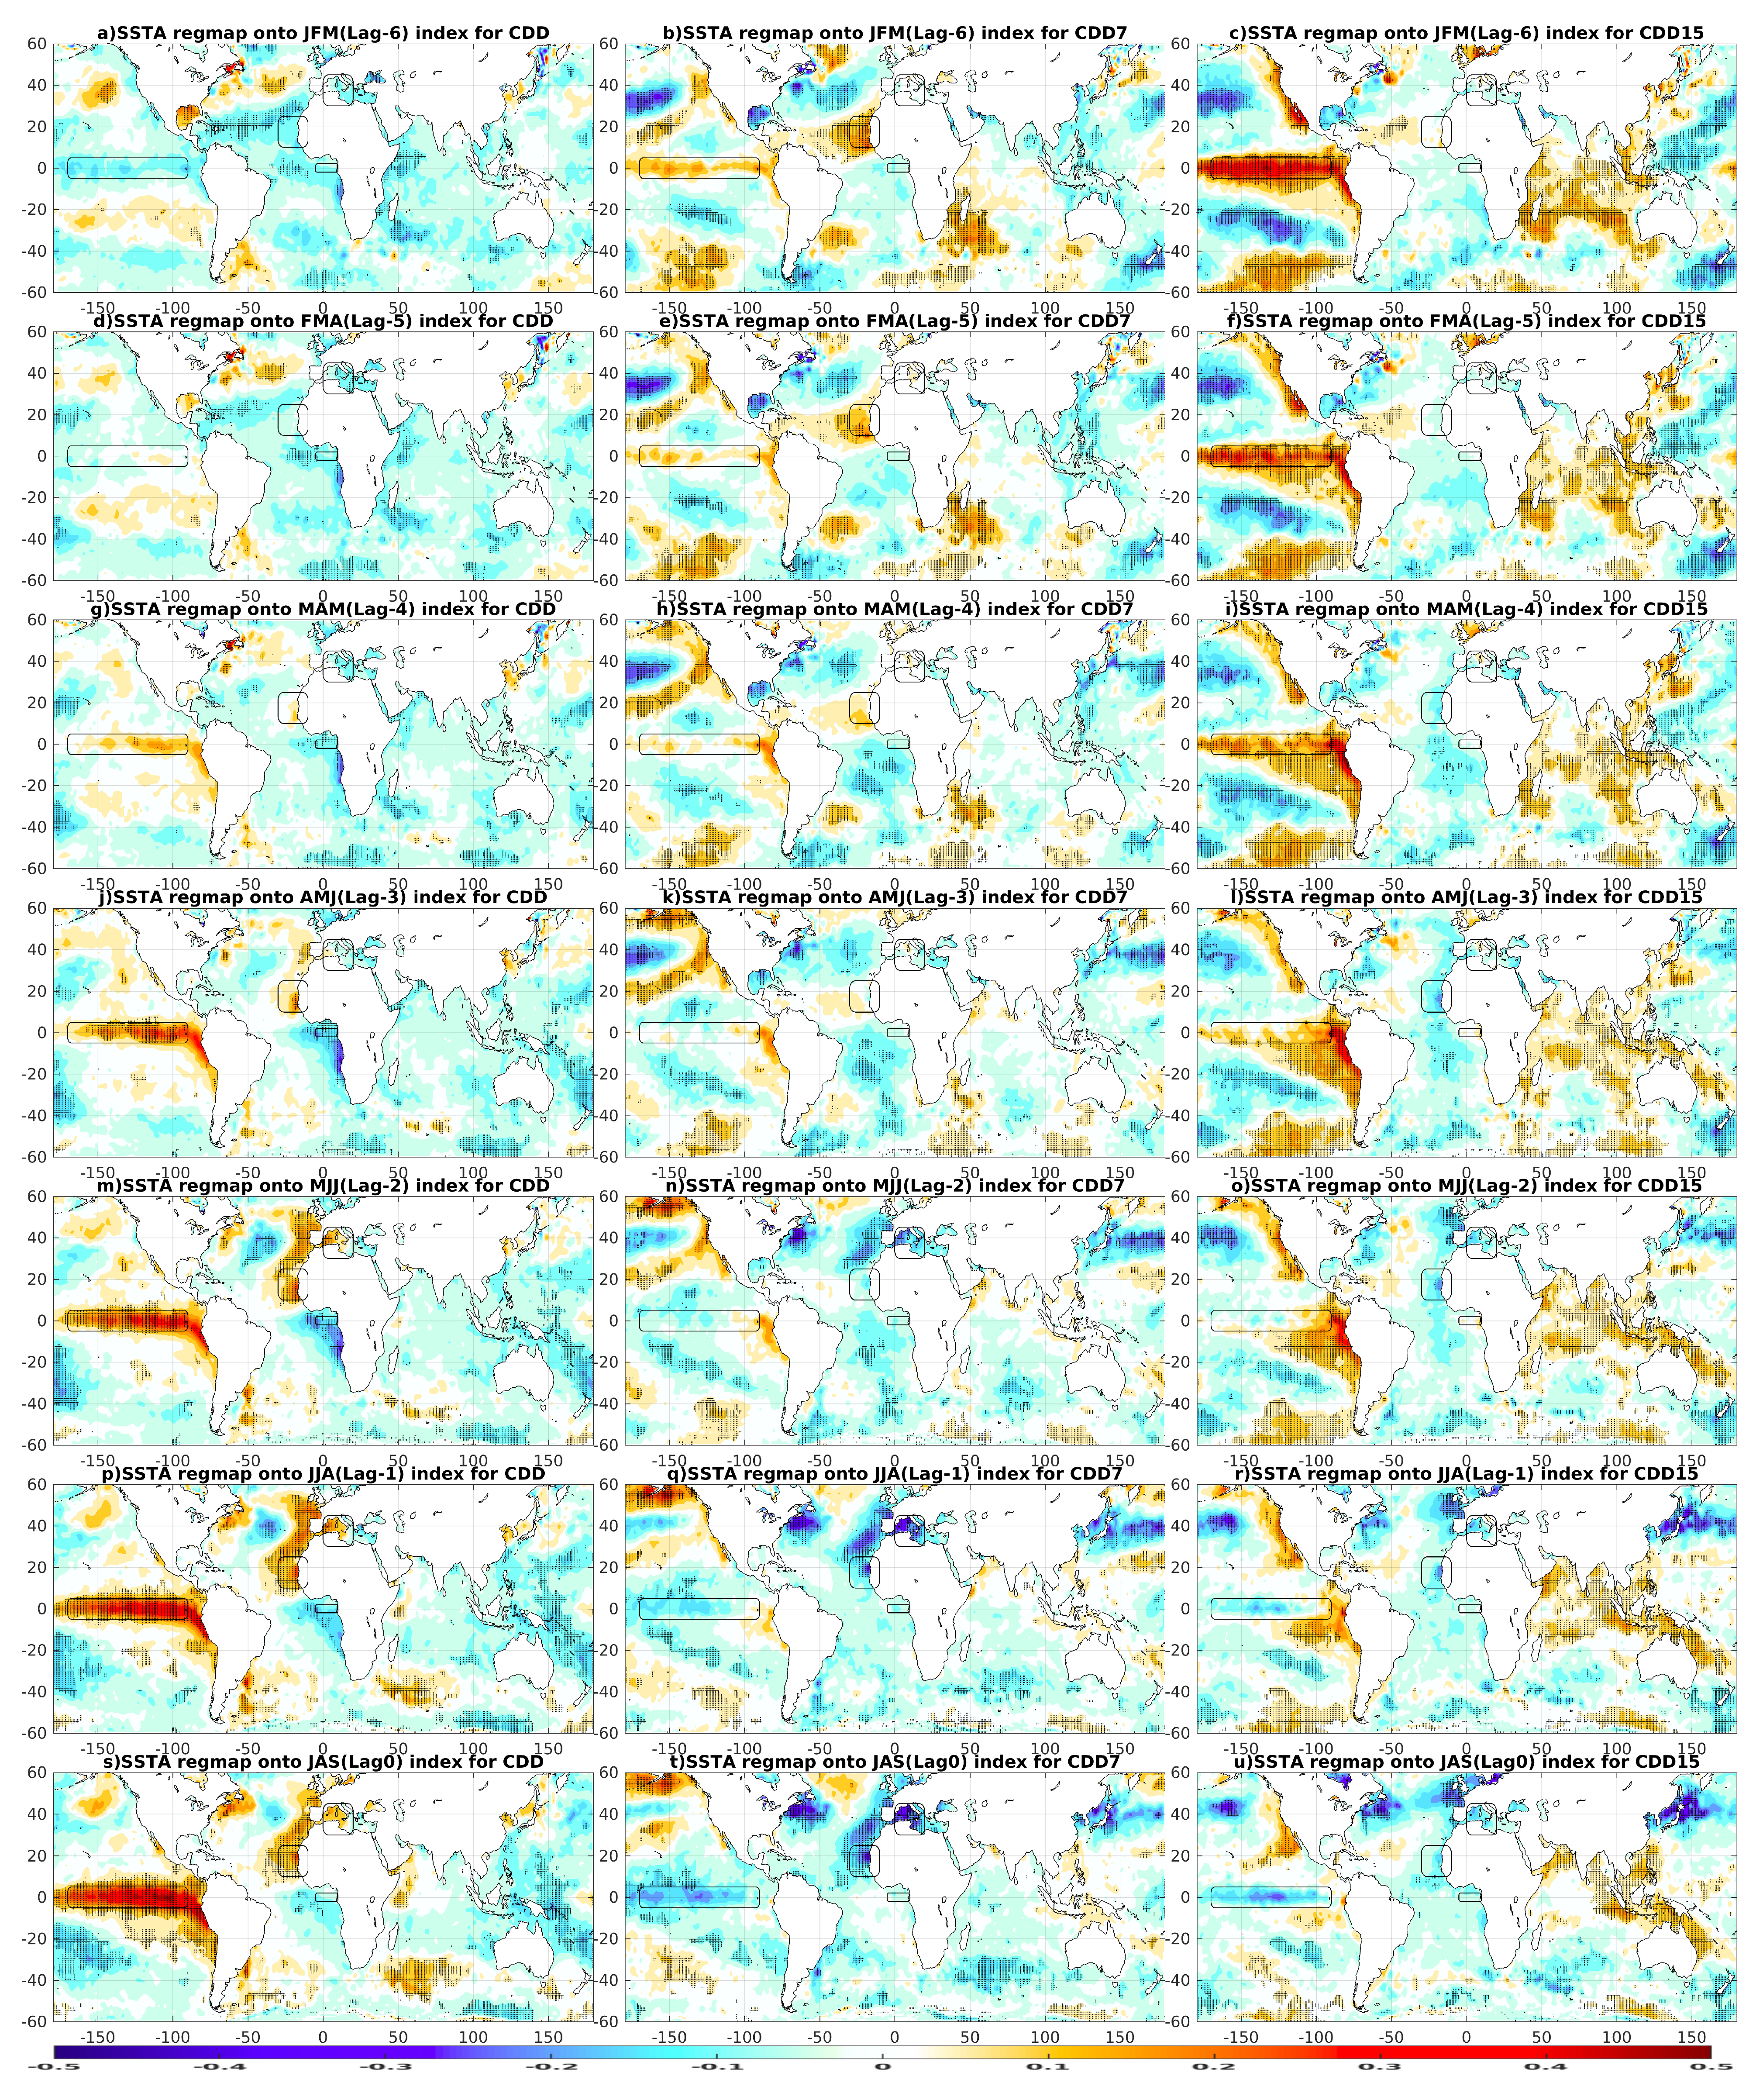
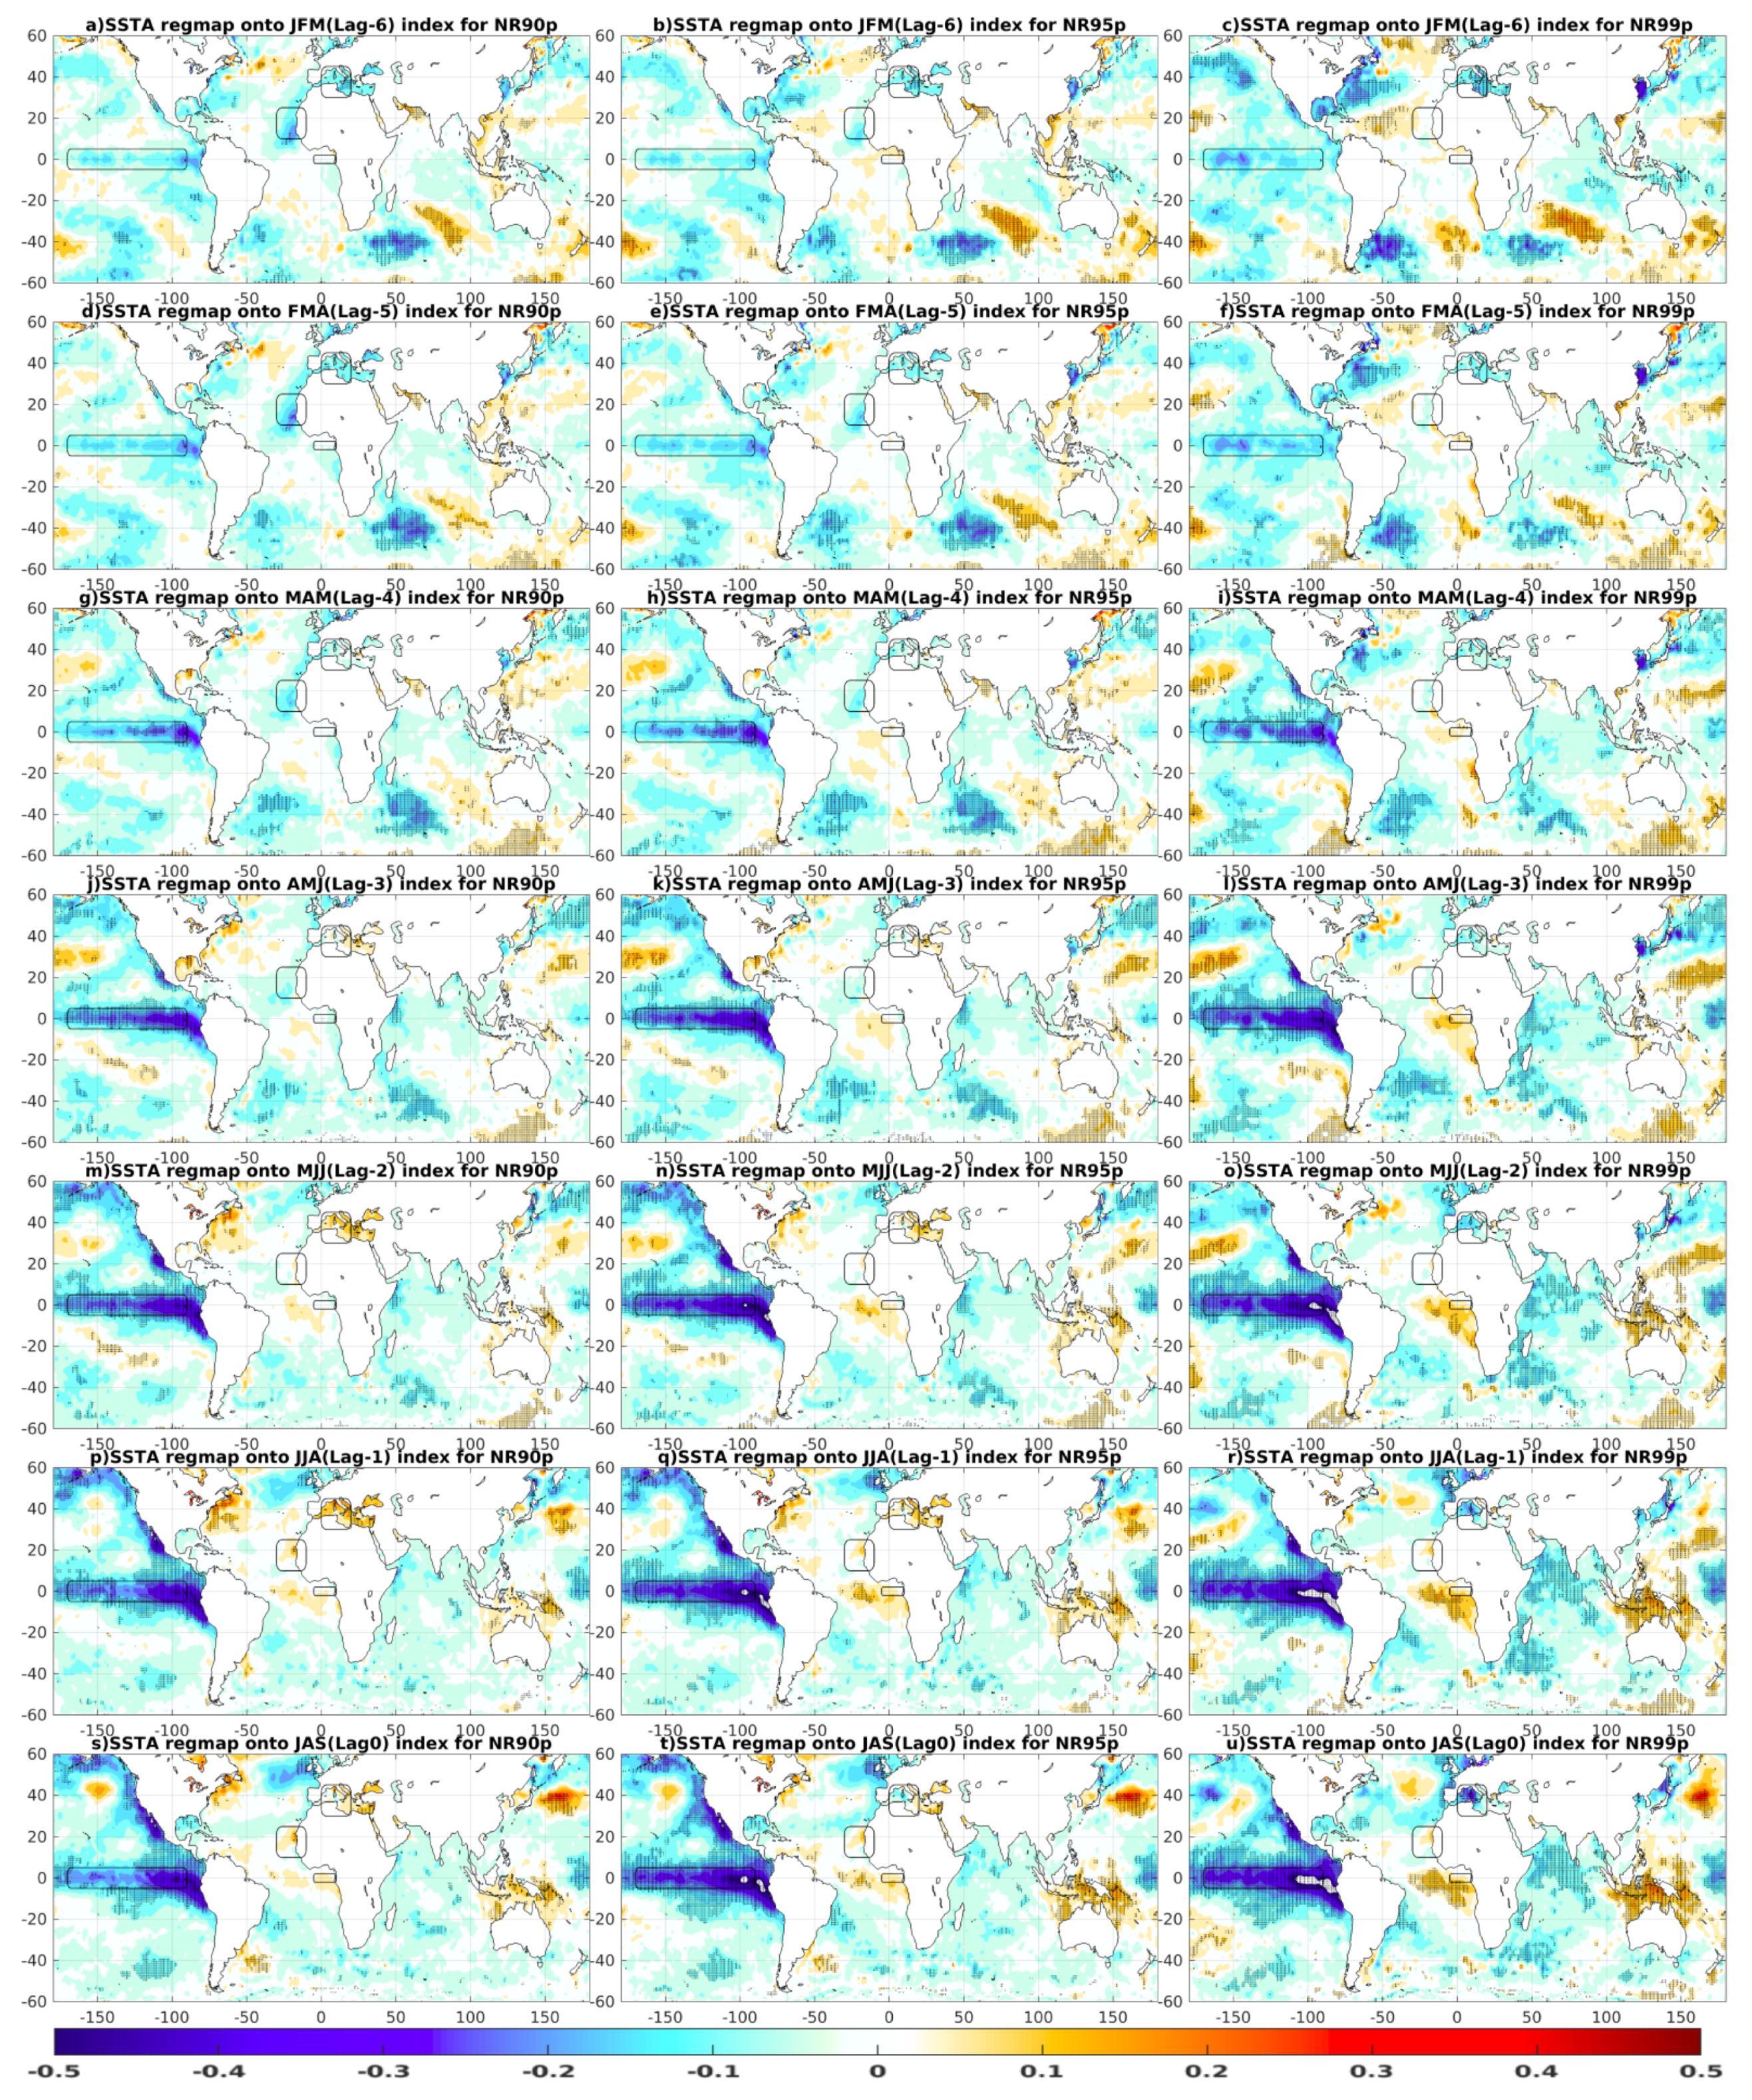
3.4. Sst Teleconnection Patterns

The teleconnections between rainy season descriptors and SST, which encompass oceanic areas known to influence the West African monsoon, will be taken into account in the current section [73,74,75,76,77,78,79]. This will enable us to study the predictability potential of these rainfall metrics (see Figure 8, Figure 9 and Figure 10). To understand the origin of the teleconnection between rainfall metrics and SST patterns, we examine the lag regression of SST and rainfall metrics on intraseasonal time scales [34,66]. The time of SST lag and the magnitude of the regression provide important information about the intensity of the SST forcing. A global SST field is used as the predictor (SST) and the predictand is a given index (onset, cessation, LRS, CDD, CDD7, CDD15, NR90p, NR95p and NR99p) field.
The three rainfall metrics and SST regression map shows pronounced seasonality. In boreal spring (JFM–FMA), significant regressions are found to the equatorial pacific and eastern tropical Atlantic centered at 20 ° N. However, an opposite relationship is observed between onset, on the one hand, with cessation and LRS, on the other hand. Thus, a warming of the Pacific at this stage of the year corresponds to a late onset and early cessation, which shortens the length of the rainy season. It is important to note that this period corresponds to the active phase of the ENSO oscillation. This is consistent with several studies that have demonstrated the negative impact of ENSO warming phases (El Nino) on the Sahelian rainy season [30,76,80,81]. These significant relationships disappear in the pre-rainy season from MAM to AMJ (see Figure 8g–l) before reappearing from MJJ to JAS (see Figure 8m–u). Globally for onset and LRS, the impact of SST is more local in the season and is concentrated in the eastern tropical Atlantic (see Figure 8a,c,m,o,p,r,s,u), while for cessation, the relationship always remains remote, with significant regressions in the equatorial Pacific (see Figure 8b,e,q,t). This result indicates the importance of the ENSO zone in the early prediction of the rainy season (lag-6). Nevertheless, the Eastern Tropical Atlantic and the North Atlantic play a significant role in the penetration of the monsoon flow.
Another notable feature is observed with the three categories of dry spells (CDD, CDD7, CDD15), as shown in Figure 9. SST forcing is symmetrical in time between CDD and CDD15. Indeed, significant relationships in the equatorial Pacific are found from AMJ to JAS for CDDs (see Figure 9j,m,p,q,s), while for long durations (CDD15), this relationship is from lag-6 to lag-2 (see Figure 9c,f,i,l,o). This relationship is less obvious with moderate dry spells (CDD7) (see Figure 9e,h,k,n). This indicates that the interannual variability of dry spells is strongly governed by equatorial Pacific SST. These dry spells are more likely to occur during a equatorial pacific warming. However, the prediction is earlier for CDD15 compared to CDDs. The strong impact of the equatorial Pacific is supported by the wet events (NR90p, NR95p, NR99p; see Figure 10). These events seem to be associated with a later prediction observed from lag-3 (AMJ) (see Figure 10m–u). Thus, a cooling of the equatorial Pacific from the AMJ sequence favors an increase in these strong rainfall events. Several hypotheses can be advanced on the remote influence of the equatorial Pacific on intraseasonal descriptors in the Sahel, particularly in Senegal. The increased energy that is extracted by positive feedback in the coupled ocean–atmosphere system in the central and eastern equatorial Pacific [82,83] not only increases heat content and SST but is also carried upward through the atmosphere by deep convection, warming up the tropical upper troposphere [84]. The upper-level warming in turn engenders a transient anomaly in vertical stability when the surface outside of the core ENSO region, especially the oceanic surface, takes a finite amount of time to warm up in response to such an energy imbalance. This situation leads to a transient top-down increase in vertical stability in regions remote from the core ENSO region and, hence, a reduction in precipitation [85].
Finally, in order to assess the performance of SST patterns in the predictability of intraseasonal variability, for each lag, the box is retained if and only if 50% of the grid points register a significance of 95%; otherwise, it is rejected (see Figure 11). The number 1 indicates the sequence where the maximum significance is observed. Figure 11 shows that for most local basins, such as the North Atlantic, the prediction is later (lag-1 and lag-0) with higher performance on onset, cessation, LRS, CDD and CDD7. As for the South Atlantic, it only works on CDDs during AMJ. The impact of Atlantic SSTs during the rainy season is largely explained by the dynamics of the monsoon flow. It is generally accepted that the interannual precipitation variability in West Africa is influenced by sea surface temperature anomalies (SSTAs) in different ocean basins at different time scales. Ref. [86] distinguished primary factors that modulate rainfall variation over the regions, including the interhemispheric SST gradient with warmer SSTAs in the North Atlantic and colder SSTAs in the equatorial cold tongue of the Gulf of Guinea, which manifests itself as an anomalous quasi-symmetrical structure in the tropical Atlantic Ocean [20,87,88].
As regards the most remote basins of Senegal (Pacific and the Mediterranean), the predictive ability is more precocious, especially for the Pacific. Already in lag-6, the most significant relationships are observed for the length of the season and extreme dry spells (CDD15). It is important to note that the equatorial Pacific is the only basin that succeeds in predicting extreme wet events as early as lag-2. However, the Mediterranean is less successful and shows a relationship for CDD7 during the rainy season. Overall, a common explanation for SST Pacific teleconnections is that there is an anomalous ascending motion over the equatorial Pacific, which results in the Walker circulation being displaced to the east. The negative anomaly over the central and eastern Pacific corresponds to the divergent response to the enhanced convection, and the positive anomaly over the Indian Ocean corresponds to the anomalous convergence and, thus, the anomalous subsidence. Note that this anomalous convergence extends over Africa. Therefore, the first possible mechanism for the teleconnection is that the anomalous subsidence favors droughts in the Sahel. In addition, there is current research on the Mediterranean Sea and on how changes in the temperature of the Mediterranean Sea can impact the Sahel. The Mediterranean Sea was, for instance, pointed out as an important oceanic basin for explaining the recovery in precipitation (see for instance [89]). However, on a larger spatial scale, Ref. [90] highlighted a connection between the WAM and the Indian monsoon through the circulation over the eastern Mediterranean driven by the Indian monsoon activity: the intensification of the climatological northeasterly flow crossing the eastern Mediterranean increases the convection over the Sahel. The linkage role of the Mediterranean between the WAM and the Indian monsoon has also been pointed out by [91,92].

4. Summary and Discussion

In this study, we characterize the spatio-temporal variability of nine descriptors of the rainy season in Senegal and their possible predictability using global SST patterns. The characteristics of the onset, cessation, length of the rainy season, dry spells (CDD, CDD7, CDD15) and very wet events (NR90p, NR95p, NR99p) in the various climatic zones in the country were investigated.
First, we analyzed the spatio-temporal variability of the metric using the coefficient of variation. This revealed interesting results concerning the spatio-temporal variability of these metrics. The interannual variability was analyzed. First, the trends in the interannual evolution of the metrics were quantified. Then, through a statistical approach, the cumulative distribution functions (CDF) were revealed from 1981 to 2018. Finally, the ocean–atmosphere issue, which is a major force with the contribution of sea surface temperature (SST) on the prediction of total precipitation, was studied. The work consisted of uncovering the oceanic teleconnections of different basins selected according to scientific reviews and the intraseasonal prediction strength of ETCCDI rainfall indices.
The spatial distribution of the metrics showed a strong south–north gradient, with higher humidity indices in the south of the country and higher drought situations in the north. Regarding their onset and cessation, the earliest starts are on 4 July and the latest on 9 July; for the end of the year, the gap is smaller, with 22 October and 1 November, respectively. We have shown that the CDD index is governed by short dry spells lasting between 1 and 3 days, which account for more than 70%. This is perfectly in line with the conclusion of [54] who found that in the four subregions, dry spells lasting 2–3 days mostly occur during the rainy seasons, with maximum occurrence in August in the two Sahelian and Sudanian regions and in May–June and September over the Guinea Coast and weaker occurrence during the little dry season in August. Furthermore, the coefficients of variation (CVs) showed the strong interannual variability of these rainy season descriptors. However, the interannual evolution of these indices highlighted three periods of low frequency with different characteristics. From 1981 to 1996, fairly dry rainfall conditions were observed over the country, with late onset and an increase in long dry spells. Then, a recovery to wetter conditions is observed from 1997 to 2011. An earlier onset, as well as longer rainy seasons, can be seen. In addition, extreme wet events have decreased during this period. From 2012 onwards, a rather specific rainfall pattern has been established in the country. This regime is a mixture of long dry spells and an increase in extreme wet events in extremely shortened rainy seasons. Therefore, these results add value to hypotheses proven by previous works concerning the intensification of the internal variability of the regional climate [93,94]. In fact, several authors have documented that rainfall intensification has already occurred in several regions of the world [95,96,97,98,99,100]; however, the link with anthropogenic greenhouse gas emissions has been difficult to establish with total certainty [101,102] for such attribution studies. Rainfall intensification is part of what the authors of [103] have defined as a more extreme hydrological climate, which has longer dry spells and more intense rainfall (see also, [64,65]). In addition, this result illustrates, in part, the high spatial gradient and temporal variability of the onset, as found by [16]. Indeed, onset shows a seasonal progression from the south to the north of Senegal, as shown in Figure 2. In addition, the interannual variability of the start date at the local scale does not appear to be strongly consistent spatially. In particular, a systematic and spatially consistent advance or delay in the start date is hardly observed throughout the country. As a result, the seasonal predictability of the start date at the local scale associated with, for example, large-scale SST is, at best, low.
Finally, the results also showed that significant relationships might exist between these descriptors of the rainy season in Senegal and the spatial patterns of global SSTs. We found that the closest basins, the North and South Atlantic, provide late predictions confirmed by the most significant relationships in JJA and JAS. However, the North tropical Atlantic performs better in forecasting compared to the Gulf of Guinea. This late prediction shows that these local basins have a direct impact on the West African monsoon flow. For the remote basins evaluated in this study, namely the equatorial Pacific and the Mediterranean, the prediction is earlier, especially for the equatorial Pacific, and records significant relations to JFM. Overall, we can observe synchronization between the Pacific and the Atlantic in the interannual evolution of the intraseasonal descriptors. This hypothesis seems to be confirmed by the correlations of the derived Trans-Atlantic–Pacific Ocean Dipole with precipitation anomalies over West Africa, suggesting a strong relationship between the observed SSTA structure and precipitation anomalies over West Africa. Moreover, the West African Summer Monsoon Index [104] is well correlated with the Trans-Atlantic–Pacific Ocean Dipole and precipitation anomalies over West Africa [105]. This perhaps indicates that a significant proportion of the monsoon system is modulated by the Trans-Atlantic–Pacific Ocean Dipole, which suggests enhanced (weakened) monsoonal flow during positive (negative) phases of the Trans-Atlantic–Pacific Ocean Dipole. Note that our results should be handled with certain care, as satellite-based products have the tendency to underestimate intensity and overestimate frequency, which is expected to have consequences on the following indices investigated in our rainfall metrics. Nevertheless, this study can contribute to the implementation of effective oceanic indicators for predicting intraseasonal rainfall variability in the Sahel.

Author Contributions

A.K.T. led the calculations and writing of the article. A.K.T., C.M.N.F. and D.W. helped with the preparation of the article. C.M.N.F., M.D. (Moussa Diakhaté) and B.R.-F. contributed to the conceptualization, writing and revision of the manuscript. A.T.G., O.N. and M.D. (Mbaye Diop) supervised and validated the manuscript. All authors have read and agreed to the published version of the manuscript.

Funding

This research was funded by the PNA-FEM project.

Institutional Review Board Statement

Not applicable.

Informed Consent Statement

Not applicable.

Data Availability Statement

Not applicable.

Acknowledgments

We thank the PNA-FEM project for funding the research that led to this paper. The LMI ECLAIRS 2 contributed significantly to this work. To this end, we thank this program, whose contribution was attributed to the author Touré, for helping with the realization of this study. We also thank the Department of Meteorology, Faculty of Physics, of the Universidad Complutense de Madrid (UCM).

Conflicts of Interest

The authors declare no conflict of interest.

Abbreviations

The following abbreviations are used in this manuscript:
ARCAfrican Risk Capacity
CDDConsecutive Dry Days
CDD7Consecutive Dry Days 7days
CDD15Consecutive Dry Days 15 days
CHIRPSClimate Hazards Group InfraRed Precipitation with Station
CVcoefficient of variation
ETCCDIExpert Team on Climate Change Detection and Indices
ENSOEl Niño–Southern Oscillation
HadISSTHadley centre global sea Ice and Sea Surface Temperature
ITCZInter Tropical Convergence Zone
JASJuly August September
JFMJanuary February March
LRSLength of Rainy Season
NR90pWet day with rainfall amount 90th percentile
NR95pWet day with rainfall amount 95th percentile
NR99pWet day with rainfall amount 99th percentile
SSTSea surface temperature
WAMWest African monsoon
WFPWorld Food Program

References

  1. Toure, A.K.; Diakhaté, M.; Thierno Gaye, A.; Diop, M.; Ndiaye, O. Sensivity of Crop Yields to Temperature and Rainfall Daily Metrics in Senegal. Am. J. Rural. Dev. 2020, 8, 1–11. [Google Scholar] [CrossRef]
  2. Diallo, M.D.; Wood, S.A.; Diallo, A.; Mahatma-Saleh, M.; Ndiaye, O.; Tine, A.K.; Ngamb, T.; Guisse, M.; Seck, S.; Diop, A.; et al. Soil suitability for the production of rice, groundnut, and cassava in the peri-urban Niayes zone, Senegal. Soil Tillage Res. 2016, 155, 412–420. [Google Scholar] [CrossRef]
  3. Sultan, B.; Defrance, D.; Iizumi, T. Evidence of crop production losses in West Africa due to historical global warming in two crop models. Sci. Rep. 2019, 9, 12834. [Google Scholar] [CrossRef] [PubMed]
  4. Roudier, P.; Kane, C.; Leblois, A.; Sultan, B.; Weber, S. Deux Exemples de Stratégies de Gestion du Risque Agricole en Afrique de l’Ouest: Services Climatiques et Assurances Indicielles. 2019. Available online: http://antoine.leblois.free.fr/chapitre_conference_GSA_v7.pdf (accessed on 25 August 2022).
  5. WMO. The Global Climatein 2015–2019; World Meteorological Organization: Geneva, Switzerland, 2015. [Google Scholar]
  6. ARC. Republic of Senegal Final Implementation Plan November 2014; The African Risk Capacity (ARC) Group: Johannesburg, South Africa, 2014. [Google Scholar]
  7. WFP. WFP Senegal Country Brief 2018; World Food Programme: Rome, Italy, 2018. [Google Scholar]
  8. Lamb, P.J. Large-scale tropical Atlantic surface circulation patterns associated with Subsaharan weather anomalies. Tellus 1978, 30, 240–251. [Google Scholar] [CrossRef]
  9. Nicholson, S.E. Revised rainfall series for the West African subtropics. Mon. Weather. Rev. 1979, 107, 620–623. [Google Scholar] [CrossRef]
  10. Nicholson, S.; Chervin, R. Recent Rainfall Fluctuations in Africa—Interhemispheric Teleconnections; Springer: Dordrecht, The Netherlands, 1983; pp. 221–238. [Google Scholar]
  11. Fontaine, B.; Louvet, S.; Roucou, P. Definition and predictability of an OLR-based West African monsoon onset. Int. J. Climatol. 2008, 28, 1787–1798. [Google Scholar] [CrossRef]
  12. Drobinski, P.; Sultan, B.; Janicot, S. Role of the Hoggar massif in the West African monsoon onset. Geophys. Res. Lett. 2005, 32. [Google Scholar] [CrossRef]
  13. Lavaysse, C.; Flamant, C.; Janicot, S.; Parker, D.J.; Lafore, J.P.; Sultan, B.; Pelon, J. Seasonal evolution of the West African heat low: A climatological perspective. Clim. Dyn. 2009, 33, 313–330. [Google Scholar] [CrossRef]
  14. Nicholson, S.E. Sub-saharan rainfall 1981–1984. J. Clim. Appl. Meteorol. 1985, 24, 1388–1391. [Google Scholar] [CrossRef]
  15. Dieng, O.; Roucou, P.; Louvet, S. Variabilité intra-saisonnière des précipitations au Sénégal (1951–1996). Sécheresse 2008, 19, 87–93. [Google Scholar]
  16. Marteau, R.; Moron, V.; Philippon, N. Spatial Coherence of Monsoon Onset over Western and Central Sahel (1950–2000). J. Clim. 2009, 22, 1313–1324. [Google Scholar] [CrossRef] [Green Version]
  17. Moron, V.; Robertson, A.W.; Ward, M.N. Seasonal predictability and spatial coherence of rainfall characteristics in the tropical setting of Senegal. Mon. Weather. Rev. 2006, 134, 3248–3262. [Google Scholar] [CrossRef]
  18. Sagna, P.; Ndiaye, O.; Diop, C.; Niang, A.D.; Sambou, P.C. Les Variations réCentes du Climat Constatées au Sénégal Sont-Elles en Phase Avec les Descriptions Données par les Scénarios du GIEC? 2016. Available online: https://inondations-dakar.org/dataset/les-variations-recentes-du-climat-constatees-au-senegal (accessed on 25 August 2022). [CrossRef]
  19. Reason, C.; Rouault, M.; Melice, J.L.; Jagadheesha, D. Interannual winter rainfall variability in SW South Africa and large scale ocean—Atmosphere interactions. Meteorol. Atmos. Phys. 2002, 80, 19–29. [Google Scholar] [CrossRef]
  20. Li, S.; Robinson, W.A.; Peng, S. Influence of the North Atlantic SST tripole on northwest African rainfall. J. Geophys. Res. Atmos. 2003, 108. [Google Scholar] [CrossRef]
  21. Misra, V. The influence of Pacific SST variability on the precipitation over southern Africa. J. Clim. 2003, 16, 2408–2418. [Google Scholar] [CrossRef]
  22. Moron, V.; Philippon, N.; Fontaine, B. Skill of Sahel rainfall variability in four atmospheric GCMs forced by prescribed SST. Geophys. Res. Lett. 2003, 30. [Google Scholar] [CrossRef]
  23. Paeth, H.; Friederichs, P. Seasonality and time scales in the relationship between global SST and African rainfall. Clim. Dyn. 2004, 23, 815–837. [Google Scholar] [CrossRef]
  24. Janowiak, J.E. An investigation of interannual rainfall variability in Africa. J. Clim. 1988, 1, 240–255. [Google Scholar] [CrossRef]
  25. Walker, N. Links between South African summer rainfall and temperature variability of the Agulhas and Benguela Current systems. J. Geophys. Res. Ocean. 1990, 95, 3297–3319. [Google Scholar] [CrossRef]
  26. Jury, M.R.; Valentine, H.R.; Lutjeharms, J.R. Influence of the Agulhas Current on summer rainfall along the southeast coast of South Africa. J. Appl. Meteorol. Climatol. 1993, 32, 1282–1287. [Google Scholar] [CrossRef]
  27. Mason, S.J. Sea-surface temperature—South African rainfall associations, 1910–1989. Int. J. Climatol. 1995, 15, 119–135. [Google Scholar] [CrossRef]
  28. Reason, C.; Lutjeharms, J. Variability of the South Indian Ocean and implications for southern African rainfall. S. Afr. J. Sci. 1998, 94, 115–123. [Google Scholar]
  29. Biasutti, M.; Battisti, D.S.; Sarachik, E. Mechanisms controlling the annual cycle of precipitation in the tropical Atlantic sector in an atmospheric GCM. J. Clim. 2004, 17, 4708–4723. [Google Scholar] [CrossRef]
  30. Nicholson, S.E.; Dezfuli, A.K. The relationship of rainfall variability in western equatorial Africa to the tropical oceans and atmospheric circulation. Part I: The boreal spring. J. Clim. 2013, 26, 45–65. [Google Scholar] [CrossRef]
  31. Shinoda, M.; Kawamura, R. Tropical rainbelt, circulation, and sea surface temperatures associated with the Sahelian rainfall trend. J. Meteorol. Soc. Jpn. Ser. II 1994, 72, 341–357. [Google Scholar] [CrossRef]
  32. Trzaska, S.; Janicot, S. The role of the Indian Ocean in modulation of ENSO impacts on the West African Monsoon. CLIVAR Exch. 2003, 8, 17–18. [Google Scholar]
  33. Giannini, A.; Saravanan, R.; Chang, P. Oceanic forcing of Sahel rainfall on interannual to interdecadal time scales. Science 2003, 302, 1027–1030. [Google Scholar] [CrossRef]
  34. Ndiaye, O. The Predictability of the Sahelian Climate: Seasonal Sahel Rainfall and Onset over Senegal; Columbia University: New York, NY, USA, 2010; Volume 72. [Google Scholar]
  35. Insua-Costa, D.; Senande-Rivera, M.; Llasat, M.C.; Miguez-Macho, G. A global perspective on western Mediterranean precipitation extremes. npj Clim. Atmos. Sci. 2022, 5, 9. [Google Scholar] [CrossRef]
  36. Donat, M.; Peterson, T.; Brunet, M.; King, A.; Almazroui, M.; Kolli, R.; Boucherf, D.; Al-Mulla, A.Y.; Nour, A.Y.; Aly, A.A.; et al. Changes in extreme temperature and precipitation in the Arab region: Long-term trends and variability related to ENSO and NAO. Int. J. Climatol. 2014, 34, 581–592. [Google Scholar] [CrossRef]
  37. Diakhaté, M.; Rodríguez-Fonseca, B.; Gómara, I.; Mohino, E.; Dieng, A.L.; Gaye, A.T. Oceanic Forcing on Interannual Variability of Sahel Heavy and Moderate Daily Rainfall. J. Hydrometeorol. 2019, 20, 397–410. [Google Scholar] [CrossRef]
  38. Taylor, C.M.; Belušić, D.; Guichard, F.; Parker, D.J.; Vischel, T.; Bock, O.; Harris, P.P.; Janicot, S.; Klein, C.; Panthou, G. Frequency of extreme Sahelian storms tripled since 1982 in satellite observations. Nature 2017, 544, 475–478. [Google Scholar] [CrossRef]
  39. Panthou, G.; Mailhot, A.; Laurence, E.; Talbot, G. Relationship between surface temperature and extreme rainfalls: A multi-time-scale and event-based analysis. J. Hydrometeorol. 2014, 15, 1999–2011. [Google Scholar] [CrossRef]
  40. Cattani, E.; Merino, A.; Guijarro, J.A.; Levizzani, V. East Africa rainfall trends and variability 1983–2015 using three long-term satellite products. Remote Sens. 2018, 10, 931. [Google Scholar] [CrossRef]
  41. Funk, C.; Peterson, P.; Landsfeld, M.; Pedreros, D.; Verdin, J.; Shukla, S.; Husak, G.; Rowland, J.; Harrison, L.; Hoell, A.; et al. The climate hazards infrared precipitation with stations—A new environmental record for monitoring extremes. Sci. Data 2015, 2, 150066. [Google Scholar] [CrossRef]
  42. Roudier, P.; Muller, B.; d’Aquino, P.; Roncoli, C.; Soumaré, M.A.; Batté, L.; Sultan, B. The role of climate forecasts in smallholder agriculture: Lessons from participatory research in two communities in Senegal. Clim. Risk Manag. 2014, 2, 42–55. [Google Scholar] [CrossRef]
  43. Salack, S.; Muller, B.; Gaye, A.T. Rain-based factors of high agricultural impacts over Senegal. Part I: Integration of local to sub-regional trends and variability. Theor. Appl. Climatol. 2011, 106, 1–22. [Google Scholar] [CrossRef]
  44. Bodian, A. Caractérisation de la variabilité temporelle récente des précipitations annuelles au Sénégal (Afrique de l’Ouest). Physio-Géo. Géographie Phys. Environ. 2014, 8, 297–312. [Google Scholar] [CrossRef]
  45. Faye, C.; Sow, A.A.; Ndong, J.B. Étude des sècheresses pluviométriques et hydrologiques en Afrique tropicale: Caractérisation et cartographie de la sècheresse par indices dans le haut bassin du fleuve Sénégal. Physio-Géo. Géographie Phys. Environ. 2015, 9, 17–35. [Google Scholar] [CrossRef]
  46. Fall, S.; Niyogi, D.; Semazzi, F. Analysis of Mean Climate Conditions in Senegal (1971–98). Earth Interact. 2006, 10, 1–40. [Google Scholar] [CrossRef]
  47. Funk, C.; Michaelsen, J.; Marshall, M.T. Mapping Recent Decadal Climate Variations in Precipitation and Temperature across Eastern Africa; Remote Sensing of Drought: Innovative Monitoring Approaches; CRC Press: Boca Raton, FL, USA, 2012; pp. 331–358. [Google Scholar] [CrossRef]
  48. Sacré Regis, M.D.; Mouhamed, L.; Kouakou, K.; Adeline, B.; Arona, D.; Houebagnon Saint, J.C.; Koffi Claude, A.K.; Talnan Jean, H.C.; Salomon, O.; Issiaka, S. Using the CHIRPS Dataset to Investigate Historical Changes in Precipitation Extremes in West Africa. Climate 2020, 8, 84. [Google Scholar] [CrossRef]
  49. Xie, P.; Joyce, R.; Wu, S.; Yoo, S.H.; Yarosh, Y.; Sun, F.; Lin, R. Reprocessed, bias-corrected CMORPH global high-resolution precipitation estimates from 1998. J. Hydrometeorol. 2017, 18, 1617–1641. [Google Scholar] [CrossRef]
  50. Huffman, G.J.; Adler, R.F.; Bolvin, D.T.; Nelkin, E.J. The TRMM multi-satellite precipitation analysis (TMPA). In Satellite Rainfall Applications for Surface Hydrology; Springer: Dordrecht, The Netherland, 2010; pp. 3–22. [Google Scholar] [CrossRef]
  51. Sorooshian, S.; Nguyen, P.; Sellars, S.; Braithwaite, D.; AghaKouchak, A.; Hsu, K. Satellite-based remote sensing estimation of precipitation for early warning systems. Extrem. Nat. Hazards Disaster Risks Soc. Implic. 2014, 1, 99–112. [Google Scholar]
  52. Bichet, A.; Diedhiou, A. Less frequent and more intense rainfall along the coast of the Gulf of Guinea in West and Central Africa (1981–2014). Clim. Res. 2018, 76, 191–201. [Google Scholar] [CrossRef]
  53. Rayner, N.; Parker, D.E.; Horton, E.; Folland, C.K.; Alexander, L.V.; Rowell, D.; Kent, E.; Kaplan, A. Global analyses of sea surface temperature, sea ice, and night marine air temperature since the late nineteenth century. J. Geophys. Res. Atmos. 2003, 108, D14. [Google Scholar] [CrossRef]
  54. Froidurot, S.; Diedhiou, A. Characteristics of wet and dry spells in the West African monsoon system. Atmos. Sci. Lett. 2017, 18, 125–131. [Google Scholar] [CrossRef]
  55. Bichet, A.; Diedhiou, A. West African Sahel has become wetter during the last 30 years, but dry spells are shorter and more frequent. Clim. Res. 2018, 75, 155–162. [Google Scholar] [CrossRef]
  56. Sivakumar, M.V.K. Predicting rainy season potential from the onset of rains in southern Sahelian and Sudanian climatic zones of West Africa. Agric. For. Meteorol. 1988, 42, 295–305. [Google Scholar] [CrossRef]
  57. Stern, R.; Dennett, M.; Garbutt, D. The start of the rains in West Africa. J. Climatol. 1981, 1, 59–68. [Google Scholar] [CrossRef]
  58. Lebel, T.; Diedhiou, A.; Laurent, H. Seasonal cycle and interannual variability of the Sahelian rainfall at hydrological scales. J. Geophys. Res. Atmos. 2003, 108, 8389. [Google Scholar] [CrossRef]
  59. Ratan, R.; Venugopal, V. Wet and dry spell characteristics of global tropical rainfall. Water Resour. Res. 2013, 49, 3830–3841. [Google Scholar] [CrossRef]
  60. Dhonneur, G. Essai de Synthèse sur les Théories des Lignes de Grains en Afrique Occidentale et Centrale; ASECNA Pub: Dakar, Senegal, 1970. [Google Scholar]
  61. Mahdi Amin Le Roux, E.T. The variability of the pentade rainfall in the Sudan. East Afr. Geogr. Rev. 1973, 1973, 82–87. [Google Scholar]
  62. Camberlin, P.; Diop, M. Inter-Relationships Between Groundnut Yield in Senegal, Interannual Rainfall Variability and Sea-Surface Temperatures. Theor. Appl. Climatol. 1999, 63, 163–181. [Google Scholar] [CrossRef]
  63. Sivakumar, M. Empirical analysis of dry spells for agricultural applications in West Africa. J. Clim. 1992, 5, 532–539. [Google Scholar] [CrossRef]
  64. Trenberth, K.E.; Dai, A.; Rasmussen, R.M.; Parsons, D.B. The changing character of precipitation. Bull. Am. Meteorol. Soc. 2003, 84, 1205–1218. [Google Scholar] [CrossRef]
  65. Trenberth, K.E. Changes in precipitation with climate change. Clim. Res. 2011, 47, 123–138. [Google Scholar] [CrossRef]
  66. Diakhaté, M.; Lazar, A.; de Coëtlogon, G.; Gaye, A.T. Do SST gradients drive the monthly climatological surface wind convergence over the tropical Atlantic? Int. J. Climatol. 2018, 38, e955–e965. [Google Scholar] [CrossRef]
  67. Giannakopoulos, C.; Le Sager, P.; Bindi, M.; Moriondo, M.; Kostopoulou, E.; Goodess, C. Climatic changes and associated impacts in the Mediterranean resulting from a 2 C global warming. Glob. Planet. Chang. 2009, 68, 209–224. [Google Scholar] [CrossRef]
  68. Huntington, T.G. Evidence for intensification of the global water cycle: Review and synthesis. J. Hydrol. 2006, 319, 83–95. [Google Scholar] [CrossRef]
  69. Loo, Y.Y.; Billa, L.; Singh, A. Effect of climate change on seasonal monsoon in Asia and its impact on the variability of monsoon rainfall in Southeast Asia. Geosci. Front. 2015, 6, 817–823. [Google Scholar] [CrossRef]
  70. Fall, C.M.N.; Lavaysse, C.; Drame, M.S.; Panthou, G.; Gaye, A.T. Wet and dry spells in Senegal: Evaluation of satellite-based and model re-analysis rainfall estimates. Nat. Hazards Earth Syst. Sci. Discuss. 2019, 21, 1051–1069. [Google Scholar] [CrossRef]
  71. Panthou, G.; Lebel, T.; Vischel, T.; Quantin, G.; Sane, Y.; Ba, A.; Ndiaye, O.; Diongue-Niang, A.; Diopkane, M. Rainfall intensification in tropical semi-arid regions: The Sahelian case. Environ. Res. Lett. 2018, 13, 064013. [Google Scholar] [CrossRef]
  72. Mariotti, L.; Diallo, I.; Coppola, E.; Giorgi, F. Seasonal and intraseasonal changes of African monsoon climates in 21st century CORDEX projections. Clim. Chang. 2014, 125, 53–65. [Google Scholar] [CrossRef]
  73. Nicholson, S.E. The spatial coherence of African rainfall anomalies: Interhemispheric teleconnections. J. Appl. Meteorol. Climatol. 1986, 25, 1365–1381. [Google Scholar] [CrossRef]
  74. Ropelewski, C.F.; Halpert, M.S. Global and regional scale precipitation patterns associated with the El Niño/Southern Oscillation. Mon. Weather. Rev. 1987, 115, 1606–1626. [Google Scholar] [CrossRef]
  75. Rowell, D.P.; Folland, C.K.; Maskell, K.; Ward, M.N. Variability of summer rainfall over tropical North Africa (1906–92): Observations and modelling. Q. J. R. Meteorol. Soc. 1995, 121, 669–704. [Google Scholar]
  76. Nicholson, S.E.; Kim, J. The relationship of the El Niño–Southern oscillation to African rainfall. Int. J. Climatol. J. R. Meteorol. Soc. 1997, 17, 117–135. [Google Scholar] [CrossRef]
  77. Janicot, S.; Moron, V.; Fontaine, B. Sahel droughts and ENSO dynamics. Geophys. Res. Lett. 1996, 23, 515–518. [Google Scholar] [CrossRef]
  78. Janicot, S.; Trzaska, S.; Poccard, I. Summer Sahel-ENSO teleconnection and decadal time scale SST variations. Clim. Dyn. 2001, 18, 303–320. [Google Scholar] [CrossRef]
  79. Rodríguez-Fonseca, B.; Janicot, S.; Mohino, E.; Losada, T.; Bader, J.; Caminade, C.; Chauvin, F.; Fontaine, B.; García-Serrano, J.; Gervois, S.; et al. Interannual and decadal SST-forced responses of the West African monsoon. Atmos. Sci. Lett. 2011, 12, 67–74. [Google Scholar] [CrossRef]
  80. Lübbecke, J.F.; Rodríguez-Fonseca, B.; Richter, I.; Martín-Rey, M.; Losada, T.; Polo, I.; Keenlyside, N.S. Equatorial Atlantic variability—Modes, mechanisms, and global teleconnections. Wiley Interdiscip. Rev. Clim. Chang. 2018, 9, e527. [Google Scholar] [CrossRef]
  81. Rifai, S.W.; Li, S.; Malhi, Y. Coupling of El Niño events and long-term warming leads to pervasive climate extremes in the terrestrial tropics. Environ. Res. Lett. 2019, 14, 105002. [Google Scholar] [CrossRef]
  82. Bjerknes, J. Atmospheric teleconnections from the equatorial Pacific. Mon. Weather. Rev. 1969, 97, 163–172. [Google Scholar] [CrossRef]
  83. Cane, M.A.; Clement, A.C.; Kaplan, A.; Kushnir, Y.; Pozdnyakov, D.; Seager, R.; Zebiak, S.E.; Murtugudde, R. Twentieth-century sea surface temperature trends. Science 1997, 275, 957–960. [Google Scholar] [CrossRef] [Green Version]
  84. Yulaeva, E.; Wallace, J.M. The signature of ENSO in global temperature and precipitation fields derived from the microwave sounding unit. J. Clim. 1994, 7, 1719–1736. [Google Scholar] [CrossRef]
  85. Chiang, J.C.; Sobel, A.H. Tropical tropospheric temperature variations caused by ENSO and their influence on the remote tropical climate. J. Clim. 2002, 15, 2616–2631. [Google Scholar] [CrossRef]
  86. Sharon, N.E. On the factors modulating the intensity of the tropical rainbelt over West Africa. Int. J. Climatol. J. R. Meteorol. Soc. 2009, 29, 673–689. [Google Scholar]
  87. Chiang, J.C.; Vimont, D.J. Analogous Pacific and Atlantic meridional modes of tropical atmosphere-ocean variability. J. Clim. 2004, 17, 4143–4158. [Google Scholar] [CrossRef]
  88. Lin, Z.H.; Victor Nnamdi, D. Impact of Trans-Atlantic-Pacific Ocean Dipole–like pattern on summer precipitation variability over West Africa. Atmos. Ocean. Sci. Lett. 2018, 11, 509–517. [Google Scholar] [CrossRef]
  89. Park, J.y.; Bader, J.; Matei, D. Anthropogenic Mediterranean warming essential driver for present and future Sahel rainfall. Nat. Clim. Chang. 2016, 6, 941–945. [Google Scholar] [CrossRef]
  90. Raicich, F.; Nadia, P.; Navarra, A. Teleconnections between Indian monsoon and Sahel rainfall and the Mediterranean. Int. J. Climatol. J. R. Meteorol. Soc. 2003, 23, 173–186. [Google Scholar] [CrossRef]
  91. Fontaine, B.; Monerie, P.A.; Gaetani, M.; Roucou, P. Climate adjustments over the African-Indian monsoon regions accompanying Mediterranean Sea thermal variability. J. Geophys. Res. (Atmos.) 2011, 116. [Google Scholar] [CrossRef]
  92. Fontaine, B.; Pham, X. Modulation of the African-Indian rainfall relationship by the thermal variability over the Mediterranean Sea in northern summer. Int. J. Climatol. 2012, 33, 2744–2757. [Google Scholar] [CrossRef]
  93. Salack, S.; Giannini, A.; Diakhaté, M.; Gaye, A.T.; Muller, B. Oceanic influence on the sub-seasonal to interannual timing and frequency of extreme dry spells over the West African Sahel. Clim. Dyn. 2014, 42, 189–201. [Google Scholar] [CrossRef]
  94. Salack, S.; Klein, C.; Giannini, A.; Sarr, B.; Worou, O.N.; Belko, N.; Bliefernicht, J.; Kunstman, H. Global warming induced hybrid rainy seasons in the Sahel. Environ. Res. Lett. 2016, 11, 104008. [Google Scholar] [CrossRef]
  95. Alpert, P.; Baldi, M.; Ilani, R.; Krichak, S.; Price, C.; Rodó, X.; Saaroni, H.; Ziv, B.; Kishcha, P.; Barkan, J.; et al. Chapter 2 Relations between climate variability in the Mediterranean region and the tropics: ENSO, South Asian and African monsoons, hurricanes and Saharan dust. Dev. Earth Environ. Sci. 2006, 4, 149–177. [Google Scholar] [CrossRef]
  96. Westra, S.; Fowler, H.J.; Evans, J.P.; Alexander, L.V.; Berg, P.; Johnson, F.; Kendon, E.J.; Lenderink, G.; Roberts, N.M. Future changes to the intensity and frequency of short-duration extreme rainfall. Rev. Geophys. 2014, 52, 522–555. [Google Scholar] [CrossRef]
  97. Fischer, E.M.; Knutti, R. Detection of spatially aggregated changes in temperature and precipitation extremes. Geophys. Res. Lett. 2014, 41, 547–554. [Google Scholar] [CrossRef]
  98. Saffioti, C.; Fischer, E.M.; Scherrer, S.C.; Knutti, R. Reconciling observed and modeled temperature and precipitation trends over Europe by adjusting for circulation variability. Geophys. Res. Lett. 2016, 43, 8189–8198. [Google Scholar] [CrossRef]
  99. Donat, M.G.; Lowry, A.L.; Alexander, L.V.; O’Gorman, P.A.; Maher, N. More extreme precipitation in the world’s dry and wet regions. Nat. Clim. Chang. 2016, 6, 508–513. [Google Scholar] [CrossRef]
  100. Fischer, E.M.; Knutti, R. Observed heavy precipitation increase confirms theory and early models. Nat. Clim. Chang. 2016, 6, 986–991. [Google Scholar] [CrossRef]
  101. Min, S.K.; Zhang, X.; Zwiers, F.W.; Hegerl, G.C. Human contribution to more-intense precipitation extremes. Nature 2011, 470, 378–381. [Google Scholar] [CrossRef] [PubMed]
  102. Zhao, Y.; Zhang, J.; Nielsen, C.P. The effects of recent control policies on trends in emissions of anthropogenic atmospheric pollutants and CO2 in China. Atmos. Chem. Phys. 2013, 13, 487–508. [Google Scholar] [CrossRef]
  103. Giorgi, F.; Im, E.S.; Coppola, E.; Diffenbaugh, N.S.; Gao, X.J.; Mariotti, L.; Shi, Y. Higher Hydroclimatic Intensity with Global Warming. J. Clim. 2011, 24, 5309–5324. [Google Scholar] [CrossRef]
  104. Jianping, L.; Qingcun, Z. A new monsoon index and the geographical distribution of the global monsoons. Adv. Atmos. Sci. 2003, 20, 299–302. [Google Scholar] [CrossRef]
  105. Nnamchi, H.C.; Li, J. Influence of the South Atlantic Ocean Dipole on West African Summer Precipitation. J. Clim. 2011, 24, 1184–1197. [Google Scholar] [CrossRef]
Figure 1. (a) Seasonal (MJJASON) rainfall distribution for the period 1981–2018 computed from CHIRPS daily rainfall data at the 0.05 °   ×   0.05 ° resolution (total rainfall amount in mm). Senegal is located between latitudes 12 ° 30 and 16 ° 30 N and longitudes 11 ° 30 and 17 ° 30 W. (b) The mean position of the ITCZ (adapted from [46]).
Atmosphere 13 01437 g001
Figure 2. Spatial patterns of the descriptors of the rainy season over Senegal: mean over 1981–2018 in MJJASON computed from CHIRPS daily rainfall data at 0.05 °   ×   0.05 ° as resolution.Each figure (from left to right and top to bottom) shows the north–south gradient in the spatial variation of the metrics. Units for (a,b) = Julian days; (c) = number of days; (df) = times; units for (gi) = mm/day.
Atmosphere 13 01437 g002
Figure 3. Coefficient of variation patterns of the descriptors of the rainy season over Senegal: mean over 1981–2018 in MJJASON computed from CHIRPS daily rainfall data at a 0.05 °   ×   0.05 ° resolution. The north–south gradient is observed in the interannual variation of rainfall indices. Units are in percentages (%).
Atmosphere 13 01437 g003
Figure 4. The evolution of metrics in Senegal over the period 1981 to 2018 computed from CHIRPS daily rainfall data at a 0.05 °   ×   0.05 ° resolution. All the evolutions are sawtooth with two observed regimes that differ according to the rain index. Units for onset, cessation and LRS = number of days; CDD, CDD7, CDD15, NR90p, NR95p and NR99p = times.
Atmosphere 13 01437 g004
Figure 5. Respectively, CDF of ONSET, CESSATION and LRS in Senegal over the period of 1981–2018 computed from CHIRPS daily rainfall data at a resolution of 0.05 °   ×   0.05 ° . The LRS is a result of onset and cessation. For example, on average, the early start of the rainfall and the late end of the rainfall, as noted in the first two figures, are consequently the cause of a long rainy season.
Atmosphere 13 01437 g005
Figure 6. CDF of all CDDs of metrics in Senegal over the period of 1981–2018 computed from CHIRPS daily rainfall data at a resolution of 0.05 °   ×   0.05 ° . For dry sequences, the greater the number of break days observed as an index, the less likely it is to observe the extreme event.
Atmosphere 13 01437 g006
Figure 7. CDF of all NRs in Senegal over the period of 1981–2018 computed from CHIRPS daily rainfall data at a resolution of 0.05 °   ×   0.05 ° . For wet sequences, the more intense the extreme event, the lower the probability of obtaining an occurrence of this event.
Atmosphere 13 01437 g007
Figure 8. Linear regression with the statistical significance tested by a Monte-Carlo approach over SST on ONSET, Cessation and LRS metrics in Senegal for the period 1981–2018 computed from CHIRPS daily rainfall data at a 0.05 °   ×   0.05 ° resolution. Signals that are 95% significant are represented by dotted lines. A positive regression value indicates that a warming of the SST is associated with a strengthening (or a delay) in the given metrics.
Atmosphere 13 01437 g008
Figure 9. Linear regression with the statistical significance tested using the Monte Carlo approach over SST on CDD, CDD7 and CDD15 metrics in Senegal for the period 1981–2018 computed from CHIRPS daily rainfall data at a 0.05 °   ×   0.05 ° resolution. Signals that are 95% significant are represented by dotted lines. A positive regression value indicates that a warming of the SST is associated with a strengthening (or a delay) in the given metrics.
Atmosphere 13 01437 g009
Figure 10. Linear regression with the statistical significance tested using the Monte Carlo approach over SST on NR90p, NR95p and NR99p metrics in Senegal for the period 1981–2018 computed from CHIRPS daily rainfall data at a 0.05 °   ×   0.05 ° resolution. Signals that are 95% significant are represented by dotted lines. A positive regression value indicates that a warming of the SST is associated with a strengthening (or a delay) in the given metrics.
Atmosphere 13 01437 g010
Figure 11. Basin coverage rate of percentile of significance (95%) greater than 50% of the basin area: MAXIMUM SELECTION.The focus is on the four basins, namely the North Atlantic (ATN), the South Atlantic (ATS), the Pacific (PAC) and the Mediterranean (MED). For each metric, the maximum significant area covered is coded by 1 and the others by 0. This makes it possible to see the most significant period at 95% for each basin and for each index.
Atmosphere 13 01437 g011
Table 1. Definition of intraseasonal descriptors of the rainy season used in this study.
NamesIndicatorsDefinitionsUnits
wethumid day
during the rainy season
rainy day with at least 1 mmmm/day
drydry day
during the rainy season
day with less than 1 mmmm/day
OnsetStart date
of the rainy season
Wet day with at least 20 mm
without any 10-day dry spell
Julian day
CessationEnd date
of the rainy season
Dry spell lasting 20 days
occurred after 1 September
Julian day
LRSLength
of the rainy season
End date minus start date
of the rainy season
days
CDDConsecutive
dry days
All Durations
of consecutive dry days
days
CDD7Consecutive
dry days 7 days
Durations > = 7 Days
of consecutive dry days
days
CDD15Consecutive
dry days 15 days
Durations > = 15 Days
of consecutive dry days
days
NR90pWet Day
90th percentile
Wet day with rainfall amount
above 90th percentile
mm/day
NR95pWet Day
95th percentile
Wet day with rainfall amount
above 95th percentile
mm/day
NR99pWet Day
99th percentile
Wet day with rainfall amount
above 99th percentile
mm/day
Table 2. The 1981–2018 trend and mean values of onset, cessation, Length of the Rainy Season (LRS), CDD, CDD7, CDD15 and NRs (90p, 95p, 99p) averaged over Senegal. The significant results are indicated with the symbols ‘*’ when the Mann–Kendall test is highly significant (99% confidence level) and ‘**’ when it is significant (95% confidence level).
MetricsTrendp-ValueMean
Onset−0.07880.5637 July
Cessation0.14520.05621 October
LRS0.22380.159106
CDD0.10990.001526.95 *
CDD7−0.02110.01112.56 **
CDD15−0.0120.00610.55 *
NR90p0.03790.0565.31
NR95p0.01050.42102.65
NR99p−0.00490.58020.53
Publisher’s Note: MDPI stays neutral with regard to jurisdictional claims in published maps and institutional affiliations.

