Abstract
Five sprites produced above the stratiform region and one sprite above the convective region in the mesoscale convective system (MCS) were observed on 22 July 2013 from the summit of Mt. Fuji. Four of the five sprites occurred in the stratiform region after the stratiform region was cut off from the convective region. The five sprite-producing +CGs (SP + CGs) occurred in and close to these cells with low lightning activity, although in-cloud lightning locations extensively spread out in the stratiform region. This suggests that positive charges were sufficient to produce the SP + CGs that accumulated extensively in the stratiform region due to a local (in situ) charge generation mechanism. One sprite occurred above the MCS convective region, and the SP + CG was also located at the MCS convective region. Video images indicated that the optical cloud flash associated with the SP + CG continued at least 150 ms until sprite emission. The optical cloud flash light occurred repeatedly at strong and weak intensities, and this characteristic indicated that the M components in the lightning occurred in the cloud. The SP + CG might have gathered sufficient positive charges to produce the sprite with a continuing current.
1. Introduction
Transient luminous events (TLEs) are generated in association with vigorous lightning activities in large thunderstorms, such as mesoscale convective systems (MCSs), and are induced between the upper troposphere and the lower ionosphere. The first TLEs were discovered in North America in 1989 [1]. A sprite, a well-known member of the family of TLEs, is produced at an altitude of 40–90 km [2,3]. Many observations of summer and winter sprites have been conducted since the discovery of TLEs (e.g., in summer: [4,5,6,7,8,9,10,11]; in winter: [12,13,14,15,16,17]).
When a sprite occurs, the polarity of the charge removed from thunderstorms by intense lighting is mostly positive [18,19]. The positive charges that cause sprites reside in the large stratiform region of MCSs [4,20]. However, not only MCS but also thunderstorm systems smaller than MCS can generate sprites (e.g., in summer: [21,22]; in winter: [12,17,23]).
The basic mechanism of sprite emission is due to the interaction between the quasi-electric (QE) field generated by intense cloud-to-ground strikes (CGs) and the upper atmosphere below the ionosphere. A thunderstorm is charged up until lightning discharge occurs. In the charging-up period, space charge is induced in the atmosphere above the thunderstorm. The space charge shields the higher-altitude region from the QE field of the thunderstorm charge. When the charge in the thunderstorm is quickly removed by the CG, the space charge shielding thunderstorm gradually disappears with a lifetime longer than the time of charge removal in the CG. The large shielding space charge, which remains with the opposite polarity of CG, produces a large QE field in the atmosphere above the thunderstorm. The large QE field heats electrons above the thunderstorm and ionizes, consequently producing sprites in the mesosphere [24,25].
The causative positive charge of the sprite, which makes a large QE field associated with sprites, is located in the lower part of the stratiform region of the thunderstorm near the melting layer (at an altitude of 4–5 km, corresponding to 0 °C) [20,26]. By contrast, the positive charge removed by the sprite-producing +CG resides above the melting layer in different storms (6–8 km corresponding to −15 to −25 °C) [27,28,29]. Moreover, locations of sprites that cause positive charges are possible in both the upper and lower parts of winter thunderstorms [30]. The charge structure in thunderstorms is very complex; that is, multiple positive charge layers with different altitudes could exist [31]. The altitude and number of positive charge layers depend on the MCS morphology [27]. However, most summer sprites have been observed above the stratiform region of MCSs and are associated with intense +CGs (e.g., [4,8,20,27,32,33,34]). According to Lyons et al. [4], sprites above the convective region are extremely rare.
As for charge generation and separation in the thunderstorm, Williams [35] described the collision of different-sized ice particles, the selective transfer of one sign to the larger particle, and the selective separation of charges by gravity-driven differential motions. Lang et al. [27] indicated that if most sprite-producing +CGs initiate within the stratiform region, sprite production may depend on in situ charging therein, and thus would depend on significant microphysical development within the stratiform region. The initiation of sprite-producing lightning has been presented by many researchers. For example, the negative leader of sprite-producing discharges starts as intra-cloud flashes from the convective cores, and the negative leaders travel downward, sloping from the upper positive charge layers into the stratiform region preceding the sprite-producing +CG [28,33,36]. The stratiform charge layer is physically connected to the upper-level convective positive charge via a downward sloping pathway. This appears to be fed via charge advection from the convective line [27]. Such lightning paths from convective to stratiform regions have also been documented for ordinary MCSs [37,38]. The +CG in the stratiform can initiate within both the convective and stratiform regions [27,29,39]. This may indicate that charge advection from the convective region is also important to the in situ charging process within the stratiform region.
As mentioned earlier, most previous studies have reported that a sprite tends to occur by intense +CGs in the MCS stratiform region. The relationships between sprite production and convective intensity, the microphysical structure of the stratiform region, and MCS organizational structure remain uncertain, as Lang et al. [27] mentioned. Thus, how precipitation particles inside parent thunderstorms evolve, organize, and trigger +CG-associated sprites is not well understood.
Six sprite events above the MCS in the northern part of Japan were observed on 22 July 2013 at the summit of Mt. Fuji. Five of the six sprite events were produced by +CGs in the MCS stratiform region, while one sprite event was produced by +CG in the convective region. In this paper, the evolution and structure of the parent thunderstorm system before and until these sprites were induced, and what storm situation triggered the sprite-producing +CGs, were examined in detail.
2. Observation and Data
2.1. TLE Observations from the Summit of Mt. Fuji
TLEs are usually observed from the ground. However, the success of TLE observation from the ground largely depends on the meteorological condition between the observer and the phenomena (clouds obscure the observer’s view). Thus, a high mountain is a better place to observe TLEs because of its higher viewpoints, greater atmospheric transparency, and better cloud conditions. During the EuroSprite campaign, TLEs were observed using a light-sensitive camera system mounted at the Observatory Midi-Pyrénées, on Pic du Midi in the French Pyrenees at an altitude of 2877 m above sea level [5,8,40]. The researchers detected many TLEs and demonstrated the merits of high mountain observation.
To increase the possibility of detecting TLEs and simultaneously capturing both TLEs and their production of lightning flashes, we mounted light-sensitive monochrome charge-coupled device cameras (CCD cameras) at the Mt. Fuji research station (formerly known as a weather station, operated by the Japan Meteorological Agency (JMA)) on the summit of Mt. Fuji, which is the highest point and an isolated mountain at an altitude of 3776 m above sea level in Japan, from 18 July to 11 August 2013. Figure 1 shows the configuration of the summer TLE observation for the 2013 Mt. Fuji campaign. The observatory offers a better viewpoint for detecting TLEs without being obscured by a low cloud. Further, it is expected that TLEs, their related optical cloud flashes (here defined as lightning flash light inside the cloud and scattering flash above the cloud captured by CCD cameras), and their parent thunderstorms can be detected in the same video movies. The CCD cameras were aimed above the north (focused on the Tohoku region in Japan) and operated during the night. The CCD camera (WAT910HX; Watec Co., Ltd., Yamagata, Japan) was equipped with a 4 mm lens (CBC Co., Ltd. (Tokyo, Japan) TG0412FCS-3, 1/3” f4.0mm F1.2; field of view (FOV): 83.49 (H) and 64.56 (V)). The WAT910HX was an ultrahigh light-sensitive dark-field CCD camera containing a 1/2-inch imager (minimum illumination: 0.000005 lx at F1.4; effective pixels: 0.38 M). Accurate coordinated universal time (UTC) synchronized with a global positioning system (GPS) was superimposed by a time imposer onto the video field every 16.7 ms. A de-interlaced video field was 16.7 ms, and the camera’s shutter speed was 1/60 s. The CCD cameras were operated from 9:00 to 20:00 UTC. Movies were captured within 5 s before and after the event, detected by motion-detection time-shifted video-recording software (UFO Capture V2; SonotaCo.com). An azimuth of sprite element was analyzed using dedicated software for UFO Capture (UFO analyzer; SonotaCo.com) and was calculated using a star field brighter than the 3rd magnitude star and camera’s FOV. To analyze azimuths of sprite, a constellation (in this case, e.g., Cassiopeia) inside of the FOV was used.

Figure 1.
Configuration of the summer TLE observation for the 2013 Mt. Fuji campaign. The shadow denotes the detectable area (FOV: field of view) for TLEs from the summit of Mt. Fuji (black triangle: ▲) using CCD cameras. The bold line indicates the border of the prefecture in the Tohoku region.
2.2. Radar Data
The C-band radar network in Japan was operated by the JMA, and radars observed full-volume three-dimensional (3D) reflectivity data every 5–10 min. Various routine radar data products were provided by the JMA. We used two-dimensional precipitation data, echo top altitude data, and 3D radar reflectivity data with longitude and latitude grids. The horizontal and vertical grid sizes were as follows: the precipitation (mm/h) data near the ground at an altitude of 2 km with a resolution of 1 km × 1 km in the horizontal; the echo top altitude data with a resolution of 2.5 km × 2.5 km in the horizontal (nine level; km in height); and three-dimensional radar reflectivity (dBZ) data with a resolution of 1 km × 1 km in the horizontal and at an altitude between 1 and 15 km and a resolution of 1 km.
2.3. Lightning Data
The lightning detection network (LIDEN) operated by JMA was used to investigate the properties of CGs and intra-cloud lightning. The LIDEN was a hybrid system comprising interferometry and time-of-arrival (TOA) measurements based on the data of very-high-frequency (VHF) and low-frequency (LF) lightning-origin signals received at 30 sites in Japan. The LF and VHF signal sources were discriminated as CG and in-cloud lightning locations, respectively [41,42]. The locations of the VHF radiation sources generated within clouds were triangulated by at least two VHF sites. The two-dimensional locations of the CGs were detected by several LF detectors and estimated using TOA measurements. The properties of lightning, such as type of lightning (CG and in-cloud), two-dimensional location, event time, CG polarity, and peak current amplitude, were recorded.
2.4. Upper Air Sounding Data
For upper air wind and vertical wind speed (vertical velocity of precipitation) data, a wind profiler (Wind profiler Network and Data Acquisition System: WINDAS) operated by JMA was employed [43]. This system consisted of 33 wind profiler sites at the 1.3 GHz band inland of Japan. Vertical resolution was approximately 300 m, and 10 min average winds and vertical velocity were observed every 10 min above the wind profiler. The maximum vertical detection range of the data was less than 12 km in height. The wind profiler provided upper air horizontal wind direction, wind speed, vertical wind speed (updraft and downdraft), vertical wind shear, and reflectivity at different altitudes.
3. Results
3.1. Overview of Sprites, Their Producing +CGs, and the Parent MCS on 22 July 2013
Figure 2 shows all sprite events with enlarged images on the same day. Six sprites were observed on 22 July 2013 from the summit of Mt. Fuji, and they were produced by +CGs in the MCS located in the Tohoku region 200–400 km north of Mt. Fuji.
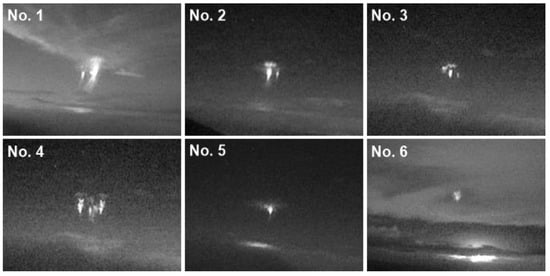
Figure 2.
All sprite events on 22 July 2013 were observed from the summit of Mt. Fuji. The images are enlarged.
Table 1 shows the properties of the sprites, optical cloud flash, and sprite-producing +CGs, and the relationship between the +CGs and the sprite events. The times and maximum durations of the sprites and optical cloud flashes were identified from a series of successive images from the video movies. Note that the identification of end times in optical flash included an error of reading (one or two frames) because the flash light was very weak and its behavior was similar to that of thermal noise.

Table 1.
Properties of sprites and optical cloud flash observed from the summit of Mt. Fuji and sprite-producing +CGs on 22 July 2013.
As shown in detail later, we found that five of the six sprites occurred above +CGs generated by the MCS stratiform region and the sixth sprite occurred above +CG generated by the MCS convective region. An overview of the sprite events, sprite-producing +CGs, the parent MCSs, and the relationships among them are discussed in this section.
In reference to the surface weather chart around Japan (Figure 3a), the BAIU stationary front, which often appears in the Japanese rainy season, lay from the middle of Japan to China, and a low-pressure system was located in the northern part of the Sea of Japan at 12 UTC on 22 July 2013. The cloud band was located along the BAIU front (Figure 3b). The cloud band associated with the BAIU front extended to the east side and went through the southern part of the Tohoku region at 12 UTC on the same day. The sprite’s parent MCS was located at the east part of the BAIU front (Figure 3b,c).

Figure 3.
(a) JMA surface weather chart, (b) satellite image (JMA MTsat2) at 12 UTC, and (c) at 15 UTC associated with sprites. The red lines show the azimuths of sprite elements from the summit of Mt. Fuji. White rectangles show the sprite-producing MCSs.
The parent MCS of the five sprites moved from the Sea of Japan and was located in the middle of the Tohoku region when the five sprites occurred. The stratiform region was located on the east side of the MCS convective lines, where the five sprite-producing +CGs occurred. Four of the five sprite events had multiple sprite elements, and all included carrot-type sprites, although some sprites were difficult to categorize because they were very small in the video images. About 2.5 h after five of the sprites were produced, the MCS convective region reached the south part of the Tohoku region, where Sprite 6 occurred on the same day. Sprite 6 with a single element was observed at 1424 UTC; however, its morphology could not be delineated (although it looked like a small carrot). The peak current amplitude of the one-sprite-producing +CG was +89 kA. The value was the smallest among the sprite-producing +CGs observed on that day, although its time delay was the longest (101 ms) among all the events. The duration of its optical cloud flash was at least 400 ms.
Figure 4 shows the time sequence of lightning counts and sprite emissions. The +CGs were almost constant, and the −CGs were not so large in number during all the periods, but there was an in-cloud lightning increasing period before the sprites. Sprites occurred when the −CG activity was in a lull. An MCS produces many sprite events in an order of 10–100 (e.g., [4,8,27]); however, we observed only six sprites, and the parent MCSs described in this paper were very small sprite population cases.
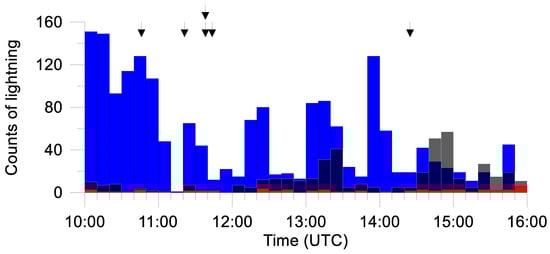
Figure 4.
Time sequence of all sprite events and lightning activity every 10 min on 22 July 2013. The arrows indicate sprite occurrence times. The blue, gray, and red bars are counts of in-cloud lightning locations (VHF sources), −CGs, and +CGs, respectively.
3.2. Five Sprite Events above the MCS Stratiform Region
3.2.1. Evolution of the Five Sprites’ Parent MCS
Figure 5 shows the time evolution of five sprites’ parent MCS at 2 h from Sprite 1 to just after from Sprite 5. Echo tops are categorized as convective echo tops from an altitude of >14 km (red) and stratiform echo tops from an altitude of >11 km (yellow and green).

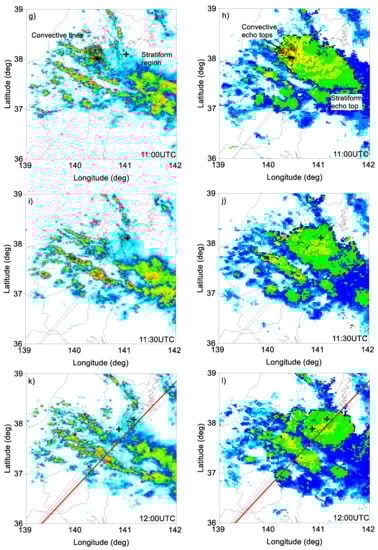
Figure 5.
Sprites’ parent MCS and lightning locations. Left panels (a,c,e,g,i,k) show precipitation at an altitude of 2 km every 30 min. Right panels (b,d,f,h,j,l) show radar echo top height. Open squares show the lightning locations (±CGs and intra-cloud lightning locations) during the 30 min period. Plus signs (+) indicate the location of sprite-producing +CGs. The dashed line presents the stratiform echo top at an altitude of roughly 11 km. Arrows indicate clusters of lightning locations in the stratiform region. Arrow heads (triangles and inverted triangles) show lightning locations in the stratiform region. The red lines in k and l indicate the azimuth of Sprite 5, but no CG was detected in association with it.
Several convective lines were located on the west side of weak precipitation (stratiform precipitation) (Figure 5a). The lightning clusters were located in the middle of the longest convective line (Figure 5a) under a fan-shaped echo top region (Figure 5b). The fan-shaped stratiform echo top region was ~12,300 km2. The convective echo top was embedded in the joint of the fan-shaped stratiform echo top. The lightning clusters occurred at and around the convective echo top region, located at the west part of the fan-shaped stratiform echo top. Comparing Figure 5a with Figure 5b, the eastern part of the echo top of the convective lines (east side of lightning clusters) was higher than the west part of those lines (west side of lightning clusters). This indicates that convective cells generated in the western part of the convective lines developed and then decayed in their eastern part.
The strong precipitation region in the convective line also decreased, while the amount of precipitation in the stratiform precipitation region over the sea gradually increased (Figure 5c). Several lightning locations were spread out on the east side of lightning clusters associated with the convective echo top region, while the lightning activities of the clusters had decayed in this period. Newly born convections appeared at the northwest side of the convective echo top region, and lightning had begun in the northwest side of the convective echo top region (Figure 5d). The stratiform echo top region extended more eastward, but the echo top height in the northern part of the stratiform echo top region decreased slightly. The total area of the stratiform echo top region was maintained at almost the same size (~12,000 km2).
The total number of lightning locations increased. The intensity of precipitation had been increasing greatly in the sea east of the coastline. The lightning clustered on the longest convective line, and the two small lightning clusters (arrows) also occurred in the west part of the stratiform precipitation region (Figure 5e). The arc of the fan-shaped echo top extended more toward the east and the fan shape was transformed into a flattened oval shape (Figure 5f), while the stratiform echo top region was almost the same size as in the previous period (~11,400 km2). Several lightning locations (boxes pointed by arrow heads in Figure 5f) and two small lightning clusters in the stratiform precipitation region were located far from the convective lines, suggesting that charge generation and accumulation occurred in the stratiform precipitation region during this period.
Sprite 1 was observed at 1046:03.437 UTC. Most lightning locations were clustered at almost the same places as in the previous period (from comparing Figure 5e with Figure 5g). The Sprite-1-producing +CG occurred in the weak precipitation area, which was located at the west part of the stratiform precipitation region, near the coastline (Figure 5g). The +CG was ~40 km from the lightning cluster in the convective echo top and located at the middle of the oval-shaped echo top area, which was ~11,500 km2 (Figure 5h).
Sprite 2 was observed at 1121:06.371 UTC. We found that the area and echo top of the stratiform region rapidly decreased, and the convective line and stratiform region started decaying after this period. The Sprite-2-producing +CG and several instances of in-cloud lightning occurred at almost the same place, while precipitation in there had increased more than that in the previous period (Figure 5i). Convective echo top decayed and looked like a cut-off from the stratiform echo top region in this period; that is, convective echo top was left at the same place, whereas the stratiform echo top region moved toward the east. The area of the stratiform echo top region remarkably decreased from the previous period (~9800 km2).
Sprites 3–5 were produced at 1138:11.320, 1138:11.520, and 1143:37.944 UTC, respectively. The convective line was continuously decaying, and the lightning activity also had a lull. Sprite-producing +CGs and different in-cloud lightning were located around the small, moderate, cell-like precipitation area in the northwest part of the stratiform precipitation region (Figure 5k). The convective echo top region had already decayed, whereas the oval-shaped stratiform echo top region was still maintained and moved further east. Lightning locations were extensively spread out in the oval-shaped stratiform echo top region, whereas lightning activity was very low. The Sprites-3-and-4-producing +CGs occurred under the oval-shaped stratiform echo top region in the short interval, in spite of the fact that the oval-shaped stratiform echo top region was already separated from the convective line at the upwind side, and its area was further decreased to ~5900 km2 (Figure 5k). As shown in Figure 5j,l, it is noteworthy that the echo top in the convective line already decreased after the convective echo top region had been cut off from the stratiform echo top region; nevertheless, the Sprites-2–5-producing +CGs occurred in the stratiform echo top region. This may suggest that the causative charge of the sprite was in the stratiform region.
3.2.2. Vertical Structure of the MCS Stratiform Region When a Sprite Occurred
Figure 6 shows the horizontal reflectivity and vertical cross-section of reflectivity along the longitude and latitude of the Sprite-1-producing +CG and locations of sprite elements at 1046:03.437 UTC. There were lightning clusters in the convective echo area on the west side of sprite-producing +CG, while there were a few lightning locations near the sprite-producing +CG (Figure 6a). The thick, well-developed stratiform region more than 7 km in depth extended at the east side of the deep convective region. The lightning clusters occurred in deep convection, and their echo top exceeded 15 km in height. Sprite-producing +CG was located under the stratiform region, where the top height exceeded 10 km.

Figure 6.
The horizontal and vertical cross-sections of the parent MCS with respect to the first sprite at 1046:03.437 UTC. (a) Open square (□) and bold plus (+) signs show in-cloud lightning locations and sprite-producing +CG during a 10 min period before 1050 UTC; the dashed lines indicate the longitude and latitude lines at +CG; plus within square sign shows the location of wind profiler at Sendai; the solid line shows the azimuth of sprite elements from Mt. Fuji; and radar reflectivity at an altitude of 2 km is displayed. Vertical cross-sections of reflectivity along the longitude (b) and latitude (c) at the sprite-producing +CG location are shown. The arrows are sprite-producing +CG points. The bars on the top axis (c) indicate the intersections between the longitude line at the +CG point and the azimuth of sprite elements from the summit of Mt. Fuji.
Figure 7 shows the Sprite-2-producing +CG and its parent MCS. The stratiform region was maintained and well-developed, and its echo top altitude was higher than 10 km, and the depth of its weak (blue) echo was at least 7 km (Figure 7b,c). The moderate echo layer was extensively located at altitudes of 7–9 km. This altitude range was found to correspond to −20–30 °C from Akita upper air sounding station data (not shown).

Figure 7.
The horizontal and vertical cross-sections of the parent MCS with respect to Sprite 2 at 1121:06.371 UTC. The descriptions (a–c) are the same as in Figure 6.
Figure 8 shows Sprites-3-and-4-producing +CG and their parent MCS. Two sprites occurred in short intervals within 200 ms. Sprites 3 and 4 occurred above +CGs produced by the same echo 15–20 min after Sprite 2 (compare Figure 7a with Figure 8a). For the three sprite-producing +CGs (Sprites 2–4), the peak current amplitude of the first (second) was almost two times larger than that of the second (third) (Sprite 2: +312 kA; Sprite 3: +180 kA; Sprite 4: +97 kA). Lightning activity in the convective region was close to termination, and the stratiform region was completely removed from the convective region. There were only a few in-cloud instances of lightning located in the stratiform region, except for Sprites-3-and-4-producing +CGs.

Figure 8.
The horizontal and vertical cross-sections of the parent MCS with respect to the third and fourth sprites at 1138:11.320 and 1138:11.520 UTC. The descriptions (a–e) are the same as in Figure 6.
The Sprites-3-and-4-producing +CGs occurred under weak echo intensity in the stratiform region, while the stratiform region was occupied by moderate echo, and the echo reached the ground (Figure 8d,e). A flat-topped deep moderate echo layer at the east side of +CG formed inside the stratiform region, and the layer was not only a well-developed high altitude but some area also reached the ground under there. The depth of the moderate echo layer was ~10 km (Figure 8d). This suggests that precipitation particles were well-developed in the stratiform region. Unfortunately, we cannot explain the cause of this observation because we have no electric data, such as electric field, which would have indicated the charge structure inside the MCS.
Sprite 5 was not analyzed because the Sprite-5-producing +CG was not detected by LIDEN. However, as we already depicted by the red line in Figure 5k,l, it is likely that Sprite 5 also occurred above the same stratiform region.
3.2.3. Time Sequence of Wind Velocity inside the MCS Stratiform Region
Figure 9 shows the time sequence of the upper profile measured by a wind profiler at Sendai, Miyagi (see the location of the wind profiler at Sendai in Figure 4, Figure 5 and Figure 6). Fortunately, the wind profiler at Sendai was located near the sprite-producing +CGs. This is the first observation with respect to vertical and horizontal winds inside the MCS stratiform region with sprites in Japan. The wind profiler was located under the same part of the stratiform region, accompanied by sprites. The northern part of the stratiform region of the sprite’s parent MCS passed over the wind profiler. The wind speeds in the stratiform region were between 35 and 55 kt above the wind profiler when the sprites occurred. The prevailing wind direction was from the west to the northwest. A range of vertical wind velocity with precipitation particles was recorded between −0.04 and −0.23 m/s (downdraft) during the sprite periods (1040–1150 UTC). The vertical wind velocity in the lower part was larger than that in the upper part. The reflectivity in the lower part was stronger than that in the higher part (not shown, reflectivity observed by the wind profiler). The increase of vertical wind velocity and reflectivity in the lower part indicate the growth of precipitation particles within the stratiform region (see numbers inside the colored blocks above 6 km in height (<−5 °C from Akita upper air sounding data)). The depth between 0 (~4.6 km in height) and −20 °C (~7.6 km) was 3 km, and that below −20 °C (>~7.6 km) was 4 km. The precipitation particles in the lower part of the stratiform region would have been snow or snow aggregated from the larger reflectivity and weak downdraft.

Figure 9.
Time sequence of the upper wind profile of 10 min averaged horizontal wind speed, vertical velocity, and vertical wind shear measured by a wind profiler at Sendai, Miyagi. Horizontal wind speed and direction are indicated by wind barb in knots every 10 min on average. The number in the colored square shows the vertical speed of the precipitation particles (m/s). The colored squares indicate vertical wind shear (kt/1000 ft) between two adjacent altitudes (the altitude difference is approximately 300 m) of the wind speed observed (m/s). Arrows depicted in the upper part are the event times of the sprites. Dashed lines roughly trace the upper and bottom boundaries of the stratiform region observed by the wind profiler. The period in white shows the sprite occurrence period.
Wind speed shears inside the stratiform region were weak (almost 0–5 kt/1000 ft: pale cyan and white). However, vertical wind shears of more than 10 kt/1000 ft (yellow and brown) were observed near the bottom boundary of the stratiform region between 1050 and 1120 UTC, and no +CGs occurred during the same period. The vertical wind shears near the bottom boundary of the stratiform region were less than 8.2 kt/1000 ft when the sprites occurred, although the vertical wind shear near the top boundary did not exceed 7 kt/1000 ft (0.8–6.8) between 1040 and 1150 UTC. It seems that the sprites and sprite-producing +CGs occurred when vertical wind shears near the top and bottom boundaries of the stratiform region were roughly less than 7–8 kt/1000 ft (cyan and pale green).
3.3. One Sprite Event above the MCS Convective Region
3.3.1. Evolution of One Sprite Parent MCS
Figure 10 shows the time evolution of the MCS from one hour before Sprite 6. The parent MCSs of Sprites 1–5 were located at the north side of the one sprite parent convective line. However, the parent MCSs of Sprites 1–5 had dissipated by 1230 UTC, and the Sprite 6 parent convective line developed. The total counts of lightning locations increased to 324 during this period, from 93 between 1230 and 1300 UTC.
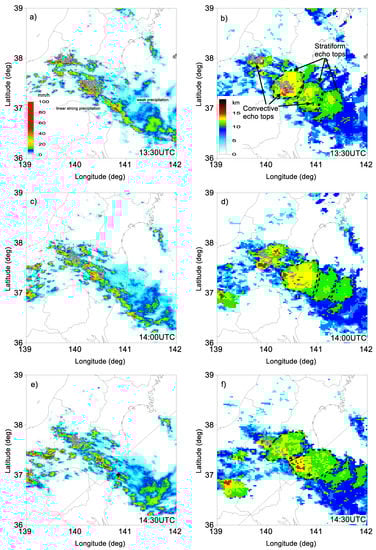
Figure 10.
Time evolution of one sprite parent thunderstorm from one hour before Sprite 6. The descriptions (a–f) are the same as in Figure 5.
Many strong precipitation cells (warm color) aligned linearly and formed a long convective line, and the long convective line ran from the northwest to the southeast (Figure 10a). The long convective line contained short convective lines. A weak precipitation region (cold color) was located at the northeast side of the long convective line.
Some individual oval-shaped echo tops can be roughly identified easily due to weak merging with each other (Figure 10b). Convective echo tops were located at the south part of the oval-shaped echo tops. In this period, oval-shaped echo top heights and areas located on the east side were gradually lower and smaller than those on the west side. Most lightning locations were clustered into convective echo tops, while some in-cloud lightning locations were extensively spread out in the oval-shaped echo top after the convective echo tops were decayed. These characteristics suggest that convective cells with different life stages evolved along the convective line. Convective cells were initiated at the most west side of the long convective line, and the convective cells with development moved toward the southeast and then finally dissipated in the most southeast part of the convective line. The convective line stayed at the same location (Figure 10c). The area higher than 13 km of the oval-shaped echo top became larger than that in the previous period; however, the area of convective echo top decreased (Figure 10d).
At the west part of the convective line, new convective cell generation had been maintained; however, the connection of the convective line had been weaker than in the previous period, and the line had been broken intermittently (Figure 10e). The azimuthal line of Sprite 6 was located at the east end of the convective echo top and was displaced from the sprite-producing +CG to the west side, where five sprite-producing +CGs were located on the azimuthal line of sprite elements or inside the azimuthal range between sprite elements (see Figure 5). Sprite 6 was different in this regard compared to Sprites 1–5. The stratiform echo top region was ~4000 km2 when the sprite occurred, and the area was three to four times smaller than that of the five-sprite-producing MCS. The convective echo top was redeveloped, and their areas extended (red area increased) (Figure 10f). At 15 min after Sprite 6 emission, lightning activity began again, and lightning counts increased rapidly within a 30 min period in the convective echo top (not shown).
3.3.2. Vertical Structure of the MCS Convective Region When a Sprite Occurred
The lightning activities were very low, except when the Sprite-6-producing +CG occurred, with only two in-cloud lightning locations observed at 2 s before the sprite emissions were located near the azimuthal line of the sprite element (Figure 11a). There were numerous convective echo cells with high echo tops in the convective line, while the stratiform echo top region looked smaller than Sprites 1–5 parent MCS (Figure 10b,c). The azimuthal line of the sprite element was displaced from sprite-producing +CG to the west side.
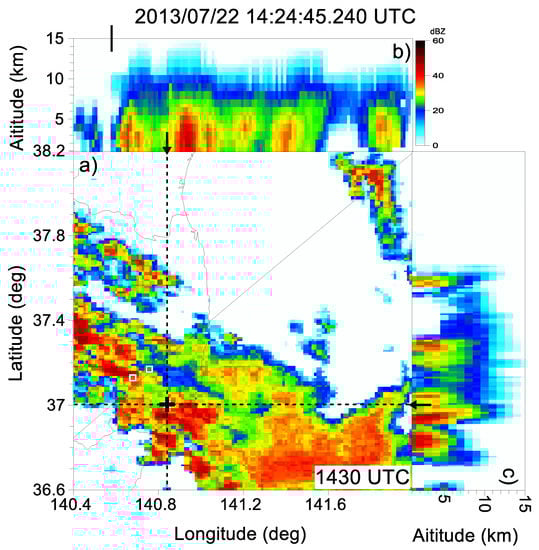
Figure 11.
The horizontal and vertical cross-sections of the parent MCS with respect to Sprite 6 at 1424:45.240 UTC. The descriptions (a–c) are the same as in Figure 6.
3.3.3. Time Sequence of Optical Cloud Flash with Sprite in MCS Convective Line
Sprite 6 and its producing optical lighting flash were captured in the same video images. Figure 12 shows the time series of the optical cloud flash images and the sprite image every 16.7 ms. As described earlier, the sixth-sprite-producing +CG with a peak current amplitude of 89 kA was identified at 1424:45.1388 UTC. However, from the series of images, a weak optical cloud flash was found to start at 1424:45.106 UTC (Figure 12a), and the time was 34 ms earlier than the sprite-producing +CG observed. The brightness of the optical cloud flash increased at 1423:45.140 UTC (Figure 11b,c). The flash light repeated temporally with strong and weak intensities until Figure 12f. Thereafter, the brightness of the optical flash increased (Figure 12g) and became the brightest (Figure 12h), followed by Sprite 6 (Figure 12i). After the sprite emission, the optical cloud flash continued for ~430 ms in total, and in particular, the optical cloud flash from the initiation to a period of ~130 ms would have contributed to Sprite 6 emission.
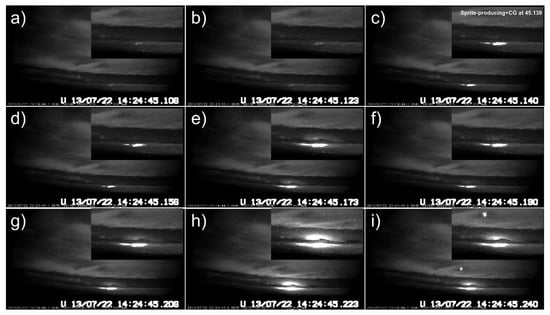
Figure 12.
Time series of optical cloud flash associated with sixth sprite and enlarged images every 16.7 ms (a–i).
4. Discussion
4.1. MCS Stratiform Region and +CGs with the Five Sprites
From the time sequence of radar echo tops, convective echo top regions were embedded in the west part of the stratiform echo top regions until Sprite 1 occurred (Figure 5b,d,f,h). The lightning locations clustered in the convective echo top regions, while a few lightning locations spread out outside the clusters when Sprite 1 occurred (Figure 5h). Vertical cross-sections of radar echoes above sprite-producing +CGs also showed that the stratiform region extended extensively from the convective region, and the structure (Figure 6b) is similar to the linear MCS presented by many previous researchers (e.g., [44]). The horizontal distances between the east edge of the lightning cluster in the convective region and the first sprite-producing +CG were approximately 50 km. As mentioned earlier, sprites would be caused by an intense +CG and a removal of a large amount of positive charge from the parent thunderstorm (e.g., [4,8,20,27,32,33,34]). The charging mechanisms in the stratiform region are considered to result from (i) advection into the stratiform region from the convective region and (ii) local (in situ) generation of charge in the stratiform region [45]. Advection (i) contributes charges to the stratiform region within 30–60 km of the convective region [46], and local generation (ii) in the stratiform region dominates at distances greater than 60 km [45]. As for the Sprites-1–5-producing +CGs, it is difficult to consider that the sprites caused by positive charges were advected from the convective region to the stratiform region without additional charge generation because the distances between the convective and the Sprites-1–5-producing +CGs were far (~50 km). However, Sprites 2–5 parent MCS stratiform region had unique characteristics. Convective echo top regions with active lightning rapidly decreased and were cut off from the stratiform echo top region; nevertheless, the stratiform echo top height was maintained, and surprisingly, the Sprites-2–6-producing +CGs occurred in the stratiform echo top region after the cut-off from the convective echo top region (Figure 5j,l). Hence, these sprites occurred after the stratiform echo top region left the convective echo top region, whereas some in-cloud lightning spread out within ~100 km in diameter in the stratiform echo top region around the sprite-producing +CGs (see black triangles in Figure 5e,f,k,l), and the stratiform echo region was extended above the sea far more than 100 km from the coast. Therefore, the causative positive charge of the sprite could have extended more extensively than the area of lightning locations spread out. Considering the primary charging mechanisms above, it would be difficult to maintain a sufficient positive charge to produce sprites without additional charging after long advection because charge density due to precipitation particles would diffuse and decrease, especially in the situation after the convective region decayed. As Lang et al. [27] described, if most sprite-producing +CGs initiate within the stratiform region, sprite production may depend on in situ charging therein, and thus would depend on significant microphysical development within the stratiform region. MCS stratiform region had a vertically thick depth, and a moderate (green) radar echo layer appeared (Figure 7b) or spread (Figure 6b) in the middle part of the stratiform region. In particular, moderate radar echo predominated there (Figure 8d) when the third and fourth sprites occurred. As radar reflectivity from ice crystals was generally smaller than rain, graupel or aggregated gradation of radar reflectivity in the vertical cross-section in Figure 5 and Figure 6 indicates that snow and ice particles aggregated and grew in the middle part of the stratiform region (e.g., Figure 8b), melted, and converted to rain in the lower part of the stratiform region (e.g., Figure 7b and Figure 8b). Moreover, from the wind profiler at Sendai, located under the same MCS stratiform region, reflectivity gradually increased from the top to the bottom boundary (not shown). The range of vertical wind velocity between the top and bottom boundary was from −0.04 to −0.23 m/s (downdraft) and also the vertical wind velocities in the lower part were also higher than those in the upper part of the stratiform region (that is, the vertical wind velocity increased near the bottom boundary) (Figure 9). Similarly, Cifelli and Rutledge [47] showed vertical motion structure in MCS using a wind profiler, and the averaged vertical motions in three regions; that is, convective, transition, and stratiform regions, were compared with results reported in previous studies. We showed that the convective region was almost occupied by an up motion. Three cases of transition region dominated a weak down motion in almost all levels, with up to ~1.0 m/s, but two cases had an up motion in the middle to upper level. The upper part of the stratiform region had a weak up motion, but the lower part had a weak down motion, with both motion magnitudes ranging up to 0.5 m/s. The vertical motion profile of our stratiform region is similar to that of the transition region they indicated.
As for charge generation and separation in the thunderstorm, Williams [35] described the collision of different-sized ice particles, the selective transfer of one sign to the larger particle, and the selective separation of charge by gravity-driven differential motions. The range of vertical wind speed and upper air temperature in the stratiform region suggested that ice crystals grew into snow and that the snow aggregated in the stratiform region. The non-inductive charge separation mechanism generated by ice particle collision in the low supercooled liquid water in the stratiform region works in this temperature range. Under such a condition, the charge structure becomes the “inverted” structure, with an upper negative part and a lower positive part. A sprite may be produced by the stratiform region with such a charge structure [26]. Five sprite-producing +CGs occurred at almost the same part of the large stratiform region, which had been a horizontally extensively extended stratiform echo top and a vertically deep stratiform region and had been maintained for a long time, and lightning locations in this region were widely spread out. Moreover, the second to fifth sprite-producing +CGs also occurred in the stratiform region after being left from the convective echo top. Azambuja [48] also found a time delay of 80–90 min between the most lightning-active phase and the time at which sprites initiated by energetic positive ground flashes were prevalent. The time delay is consistent with the descent of ice crystals from the upper troposphere to the lower portion of the stratiform region. It is expected that charging in the stratiform region will be slower than that of the convective region. This may be one of the reasons that peak current amplitudes became smaller than the preceding sprite-producing +CGs (Sprite 4 < Sprite 3 < Sprite 2).
Unfortunately, the altitude and extent of the positive charges that caused our sprites could not be determined in this study because of the lack of an electrical upper profile. However, some studies have reported that sprite-producing +CG was initiated in the stratiform region and developed there [27,29,49]. Our observational results suggest that the extensively extended local charge (in situ) generation in the stratiform region is the most plausible interpretation.
We showed the first observational result with respect to vertical wind shear near the top and bottom boundaries of the MCS stratiform region near the sprite-producing +CGs. Considering that vertical wind shear would be related to the mixing, the vertical wind shear in the top and bottom boundary of the stratiform region associated with sprites was roughly less than 7–8 kt/1000 ft. Krehbiel et al. [50] suggested that mixing of the screening charge at the cloud top with the upper-level storm charge impedes the triggering of blue jets but encourages bolt from the blue and gigantic jet-type discharges. Strong mixing in the upper boundary of the storm seems to be the norm, as demonstrated by the occurrence of bolts from the blue discharges. The authors did not show the value or criteria of strong mixing, and the mixing condition near the cloud boundary during the generation of sprites was not shown. Hence, our results cannot be directly compared with those of Krehbiel et al. [50] with respect to the top and bottom boundary conditions of the stratiform region. However, vertical wind shears near the top and bottom boundaries did not exceed ~8 kt/1000 ft when the sprites occurred. By contrast, no CG occurred when the vertical wind shear exceeded more than 10 kt/1000 ft. It seems that sprites and their producing +CGs were generated in a relatively weak vertical wind shear condition near the top and bottom boundaries.
Contiguous sprites occurring in short time intervals were observed over the MCS stratiform region. Sprites 3 and 4 occurred within short intervals at ~200 ms. Peak current amplitude of the third sprite-producing +CG was 180 kA, while that of the sprite-4-producing +CG was two times smaller (97 kA). +CG points were close to each other (see Figure 8). This is a unique characteristic because there was also a sprite with a small peak current after a large peak current. Asano et al. [51] offered a suitable explanation for this outcome. They investigated the effects of the M component, which surges superimposed on lightning continuing currents, by computer simulation and indicated that a small amplitude but fast-varying M component increased the probability of sprite initiation. This suggests that sprites can occur even if +CG peak currents are smaller than the criteria of sprite emission, if a continuing current with the M component occurs and exceeds the criteria during the remaining electrical effect of the preceding +CG. A similar explanation was presented by Yashunin et al. [52].
4.2. MCS Convective Region and +CGs with One Sprite
The characteristics of Sprite 6, its producing +CG, and the parent MCS convective region are very interesting. The lightning activity in the convective region was lulled when the sprite occurred. The peak current amplitude of sprite-producing +CG was the smallest (89 kA) in all sprite-producing +CGs on the same day, whereas the time delay between the sprite event and sprite-producing +CG was the longest (101 ms). The observational results with respect to this event revealed why long-term delayed sprites can be produced by +CG in the MCS convective region. That is, the brightness of the optical cloud flash intensity after +CG was repeatedly strong and weak before sprite emission (Figure 12). The long-term luminescence and brightness change of optical cloud flash indicated M components, and continuing current occurred in the cloud. These observational results may indicate that the sprite can be produced by a continuing current that removes a large amount of sufficient positive charge. In that case, M components may also play an important role in producing sprites, although lightning M components are perturbations or transient enhancements in the continuing current [53]. Rakov et al. [54] speculated that M-component-type processes in positive lightning may play a role in the initiation of so-called delayed sprites, which occur many tens of milliseconds after a return stroke. Yashunin et al. [52] pointed out with simulation that the M components in return strokes may be the primary producer of delayed sprites. The occurrence of an M component increases the likelihood of the initiation of sprites horizontally displaced with respect to the lightning channel axis. Asano et al. [51,53] also described the time delay and displacement between sprites and their sprite-producing +CG using computer simulations. They indicated that when a return stroke is not strong enough, but not so weak, the occurrence characteristics of M components seem to control the delay of a sprite [51]. The position of a sprite is shifted from the position of its parent vertical channel in response to the length of the horizontal channel [53]. Lightning channels could not be directly observed in our study; however, the luminosity change of the optical cloud flash was observed after the return stroke and before the sprite emission. Additionally, the position of the sprite element was shifted from the sprite-producing +CG (Figure 11 and Figure 12). If we suppose that the luminous change in optical cloud flash was caused by charge distributed to the lightning channel and that it was related to the M component, the reasons for a +CG with relatively low peak current amplitude producing a sprite, Yashunin et al.’s [52] and Asano et al.’s explanations [51,53] for the time delay and displacement between a sprite and its CG would be plausible.
Generally, negative ground flashes are usually associated with the convective region in MCSs, while a smaller number of positive ground flashes occur in the stratiform region [55,56,57]. The stratiform region is not the only region of an MCS in which positive ground flashes can dominate ground flash activity [45]. Some positive ground strikes have been observed within deep convective regions, but they usually account for only a small fraction of the ground strikes there [58]. Lyons et al. [4] reported that sprites above the convective region are extremely rare. Sprite 6 was produced by +CG in the convective region. As shown in the previous section, some studies have also reported sprite-producing +CGs that were initiated from the convective region traveling into the stratiform region, and finally occurring near the convective region [27,29,49]. The MCS structure resembles the MCSs described in these reports. If we suppose that the causative positive charge of the sprite was located in the stratiform region, a plausible explanation for the Sprite-6-producing +CG may be that the +CG lightning was initiated from the convective region and developed into the stratiform region; eventually, the causative positive charge of the sprite was removed by sprite-producing +CG occurring near the convective region. In such situations, charge advection from the convective line and in situ charge generation may play an important role in CG production [27,37].
5. Conclusions
We succeeded in detecting six sprite events and their sprite-producing +CGs on 22 July 2013 with high-sensitivity CCD cameras from the summit of Mt. Fuji. We found that five of the six sprites occurred over the +CGs in the MCS stratiform region, and one sprite occurred above the +CG in the MCS convective line. Our conclusions regarding the sprites’ parent MCSs are as follows:
(1) Five sprite-producing +CGs and the parent MCS stratiform region
The MCS had a large stratiform region with approximately ~15,000 km2. After the MCS stratiform echo top was cut off from the convective echo top, the sprite-producing +CGs occurred in the stratiform region. The depth of the stratiform region was more than 7 km, and moderate echoes, which indicate higher precipitation particle growth, appeared above 5 km in height. Downdraft prevailed inside the stratiform region and the range of vertical wind speed between the top and bottom boundary in the stratiform region was from 0.04 to 0.23 m/s. The descending speeds and reflectivity were larger toward the bottom. Moreover, sprite-producing +CGs and some in-cloud lightning locations were extensively spread out in the stratiform echo top region (the extent was ~100 km in diameter). These findings suggest that the local (in situ) charge generation in the MCS stratiform region extended extensively and that sufficient charges to produce sprites were accumulated.
(2) One sprite-producing +CG and the parent MCS convective region
The MCS convective region was covered with the identifiable oval-shaped stratiform echo top area with ~4000 km2 when Sprite 6 occurred. Sprite-6-producing +CG was located in the convective region. The parent MCS structure resembles a case in which +CG is initiated from the convective region and developed into the stratiform region, eventually occurring near the convective region [27,29,49]. In such cases, we suspect that both charge advection from the convective to stratiform region and in situ charge generation in the stratiform region play an important role in CG production [31,37]. Moreover, the optical cloud flash associated with sprite-producing +CG in the video images continued for ~150 ms before the sprite appeared and had repeatedly alternated between strong and weak intensities. It is suggested that the Sprite-6-producing +CG was accompanied by a continuing current.
From our observational results, we found that sprite-producing +CG occurred both in the MCS stratiform and convective regions. Moreover, we showed the internal radar echo structures of the MCS stratiform and convective region above sprite-producing +CGs. However, there remains much uncertainty with respect to how distributed positive charges cause sprites. We did not find how positive charges with sprites spatially extended into the MCS stratiform region and convective region or how sufficient positive charges were generated and gathered from the inside of the MCS to produce sprites. In particular, the altitudes of positive charges removed from the MCS stratiform and convective regions to produce sprites remain unclear. Charge generation mechanisms would become clearer if the charge distribution were revealed. Therefore, more studies and observations with respect to the amount and spatial locations of charge inside the thunderstorm before and after lightning activities are important to reveal these issues.
Author Contributions
Conceptualization, M.K. and T.S.; data curation, T.S., H.F. and S.H.; formal analysis, T.S.; funding acquisition and project administration, M.K.; investigation T.S., M.K. and H.F.; validation, T.S., M.K. and H.F.; visualization, T.S.; supervision, M.K.; writing—original draft preparation, T.S.; writing—review and editing, M.K., H.F. and S.H. All authors have read and agreed to the published version of the manuscript.
Funding
This research was supported by JSPS KAKENHI, 20H02419, 2020–2022, JSPS KAKENHI, 15K12372, 2015–2017, and Hoso Bunka Foundation GRANTS, 2014.
Institutional Review Board Statement
Not applicable.
Informed Consent Statement
Not applicable.
Data Availability Statement
The data examined were provided by the Japan Meteorological Agency. The data are available at a cost from http://www.jmbsc.or.jp/en/index-e.html (accessed on 6 September 2022).
Acknowledgments
This work was performed during the period when the facilities were maintained by the NPO Valid Utilization of Mt. Fuji Weather Station. We thank Y. Suzuki of Tokyo Gakugei University for observation at Mt. Fuji and Kenichi Kusunoki of the Meteorological Research Institute for much cooperation and support.
Conflicts of Interest
The authors declare no conflict of interest.
References
- Franz, R.C.; Nemzek, R.J.; Winckler, J.R. Television image of a large upward electrical discharge above a thunderstorm system. Science 1990, 249, 48–51. [Google Scholar] [CrossRef] [PubMed]
- Sentman, D.D.; Wescott, E.M. Observations of upper atmospheric optical flashes recorded from an aircraft. Geophys. Res. Lett. 1993, 20, 2857–2860. [Google Scholar] [CrossRef]
- Sentman, D.D.; Wescott, E.M.; Osborne, D.L.; Hampton, D.L.; Heavner, M.J. Preliminary results from the Sprites94 aircraft campaign: 1. Red sprites. Geophys. Res. Lett. 1995, 22, 1205–1208. [Google Scholar] [CrossRef]
- Lyons, W.A. Sprite observations above the U.S. High Plains in relation to their parent thunderstorm systems. J. Geophys. Res. 1996, 101, 29641–29652. [Google Scholar] [CrossRef]
- Neubert, T.; Allin, T.H.; Stenbaek-Nielsen, H.; Blanc, E. Sprites over Europe. Geophys. Res. Lett. 2001, 28, 3585–3588. [Google Scholar] [CrossRef]
- Pinto, O., Jr.; Tavares, F.S.S.; Naccarato, K.; Solorzano, N.N.; Pautet, P.D.; Holzworth, R.H.; Saba, M.M.F.; Pinto, I.R.C.A.; Taylor, M.J. Thunderstorm and lightning characteristics associated with sprites in Brazil. Geophys. Res. Lett. 2004, 31, L13103. [Google Scholar] [CrossRef]
- Su, H.-T.; Hsu, R.-R.; Chen, A.B.-C.; Lee, Y.-J.; Lee, L.-C. Observation of sprites over the Asian continent and over oceans around Taiwan. Geophys. Res. Lett. 2002, 29, 1044. [Google Scholar] [CrossRef]
- Van der Velde, O.A.; Mika, Á.; Soula, S.; Haldoupis, C.; Neubert, T.; Inan, U.S. Observations of the relationship between sprite morphology and in-cloud lightning processes. J. Geophys. Res. 2006, 111, D15203. [Google Scholar] [CrossRef]
- Williams, E.R.; Lyons, W.A.; Hobara, Y.; Mushtak, V.C.; Asencio, N.; Boldi, R.; Bór, J.; Cummer, S.A.; Greenberg, E.; Hayakawa, M.; et al. Ground-based detection of sprites and their parent lightning flashes over Africa during the 2006 AMMA campaign. Q. J. R. Meteorol. Soc. 2010, 136, 257–271. [Google Scholar] [CrossRef]
- Kuo, C.-L.; Huang, T.-Y.; Hsu, C.-M.; Sato, M.; Lee, L.-C.; Lin, N.-H. Resolving Elve, Halo and Sprite Halo Images at 10,000 Fps in the Taiwan 2020 Campaign. Atmosphere 2021, 12, 1000. [Google Scholar] [CrossRef]
- Kuo, C.-L.; Williams, E.; Adachi, T.; Ihaddadene, K.; Celestin, S.; Takahashi, Y.; Hsu, R.-R.; Frey, H.U.; Mende, S.B.; Lee, L.-C. Experimental validation of N2 emission ratios in altitude profiles of observed sprites. Front. Earth Sci. 2021, 9, 687989. [Google Scholar] [CrossRef]
- Adachi, T.; Fukunishi, H.; Takahashi, Y.; Sato, M.; Ohkubo, A.; Yamamoto, K. Characteristics of thunderstorm systems producing winter sprites in Japan. J. Geophys. Res. 2005, 110, D11203. [Google Scholar] [CrossRef]
- Ganot, M.; Yair, Y.; Price, C.; Ziv, B.; Sherez, Y.; Greenberg, E.; Devir, A.; Yaniv, R. First detection of transient luminous events associated with winter thunderstorms in the eastern Mediterranean. Geophys. Res. Lett. 2007, 34, L12801. [Google Scholar] [CrossRef]
- Hayakawa, M.; Nakamura, T.; Hobara, Y.; Williams, E. Observation of sprites over the Sea of Japan and conditions for lightning-induced sprites in winter. J. Geophys. Res. 2004, 109, A01312. [Google Scholar] [CrossRef]
- Soula, S.; Van Der Velde, O.; Palmieri, J.; Chanrion, O.A.; Neubert, T.; Montanyà, J.; Gangneron, F.; Meyerfeld, Y.; Lefeuvre, F.; Lointier, G. Characteristics and conditions of production of transient luminous events observed over a maritime storm. J. Geophys. Res. 2010, 115, D16118. [Google Scholar] [CrossRef]
- Suzuki, T.; Hayakawa, M.; Matsudo, Y.; Michimoto, K. How do winter thundercloud systems generate sprite-inducing lightning in the Hokuriku area of Japan? Geophys. Res. Lett. 2006, 33, L10806. [Google Scholar] [CrossRef]
- Takahashi, Y.; Miyasato, R.; Adachi, T.; Adachi, K.; Sera, M.; Uchida, A.; Fukunishi, H. Activities of sprites and elves in the winter season, Japan. J. Atmos. Sol.-Terr. Phys. 2003, 65, 551–560. [Google Scholar] [CrossRef]
- Bell, T.F.; Reising, S.C.; Inan, U.S. Intense continuing currents following positive cloud-to-ground lightning associated with red sprites. Geophys. Res. Lett. 1998, 25, 1285–1288. [Google Scholar] [CrossRef]
- Boccippio, D.J.; Williams, E.R.; Heckman, S.J.; Lyons, W.A.; Baker, I.T.; Boldi, R. Sprites, ELF transients, and positive ground strokes. Science 1995, 269, 1088–1091. [Google Scholar] [CrossRef]
- Lyons, W.A.; Nelson, T.E.; Williams, E.R.; Cummer, S.A.; Stanley, M.A. Characteristics of sprite-producing positive cloud-to-ground lightning during the 19 July 2000 STEPS mesoscale convective systems. Mon. Weather Rev. 2003, 131, 2417–2427. [Google Scholar] [CrossRef]
- Stanley, M.A. Sprites and Their Parent Discharges. Ph.D. Thesis, New Mexico Institute of Mining and Technology, Socorro, NM, USA, 2000. [Google Scholar]
- Lyons, W.A.; Cummer, S.A.; Stanley, M.A.; Huffines, G.R.; Wiens, K.C.; Nelson, T.E. Supercells and sprites. Bull. Am. Meteorol. Soc. 2008, 89, 1165–1174. [Google Scholar] [CrossRef]
- Suzuki, T.; Hayakawa, M.; Michimoto, K. Small winter thunderstorm with sprites and strong positive discharge. IEEJ Trans. Fundam. Mater. 2011, 131, 723–728. [Google Scholar] [CrossRef]
- Pasko, V.P.; Inan, U.S.; Bell, T.F.; Taranenko, Y.N. Sprites produced by quasi-electrostatic heating and ionization in the lower ionosphere. J. Geophys. Res. 1997, 102, 4529–4561. [Google Scholar] [CrossRef]
- Rodger, C.J. Red sprites, upward lightning, and VLF perturbations. Rev. Geophys. 1999, 37, 317–336. [Google Scholar] [CrossRef]
- Williams, E.R. The positive charge reservoir for sprite-producing lightning. J. Atmos. Sol.-Terr. Phys. 1998, 60, 689–692. [Google Scholar] [CrossRef]
- Lang, T.J.; Lyons, W.A.; Rutledge, S.A.; Meyer, J.D.; MacGorman, D.R.; Cummer, S.A. Transient luminous events above two mesoscale convective systems: Storm structure and evolution. J. Geophys. Res. 2010, 115, A00E22. [Google Scholar] [CrossRef]
- Lang, T.J.; Lyons, W.A.; Cummer, S.A.; Fuchs, B.R.; Dolan, B.; Rutledge, S.A.; Krehbiel, P.; Rison, W.; Stanley, M.; Ashcraft, T. Observations of two sprite-producing storms in Colorado. J. Geophys. Res. 2016, 121, 9675–9695. [Google Scholar] [CrossRef]
- Lu, G.; Cummer, S.A.; Li, J.; Zigoneanu, L.; Lyons, W.A.; Stanley, M.A.; Rison, W.; Krehbiel, P.R.; Edens, H.E.; Thomas, R.J.; et al. Coordinated observations of sprites and in-cloud lightning flash structure. J. Geophys. Res. 2013, 118, 6607–6632. [Google Scholar] [CrossRef]
- Suzuki, T.; Matsudo, Y.; Asano, T.; Hayakawa, M.; Michimoto, K. Meteorological and electrical aspects of several winter thunderstorms with sprites in the Hokuriku area of Japan. J. Geophys. Res. 2011, 116, D06205. [Google Scholar] [CrossRef]
- Stolzenburg, M.; Rust, W.D.; Smull, B.F.; Marshall, T.C. Electrical structure in thunderstorm convective regions: 1. Mesoscale convective systems. J. Geophys. Res. 1998, 103, 14059–14078. [Google Scholar] [CrossRef]
- Soula, S.; Iacovella, F.; van der Velde, O.; Montanyà, J.; Füllekrug, M.; Farges, T.; Bór, J.; Georgis, J.-F.; NaitAmor, S.; Martin, J.-M. Multi-instrumental analysis of large sprite events and their producing storm in southern France. Atmos. Res. 2014, 135–136, 415–431. [Google Scholar] [CrossRef]
- van der Velde, O.A.; Montanyà, J.; Soula, S.; Pineda, N.; Bech, J. Spatial and temporal evolution of horizontally extensive lightning discharges associated with sprite-producing positive cloud-to-ground flashes in northeastern Spain. J. Geophys. Res. 2010, 115, A00E56. [Google Scholar] [CrossRef]
- Yang, J.; Qie, X.; Feng, G. Characteristics of one sprite-producing summer thunderstorm. Atmos. Res. 2013, 127, 90–115. [Google Scholar] [CrossRef]
- Williams, E. Lightning activity in winter storms: A meteorological and cloud microphysical perspective. IEEJ Trans. Power Energy 2018, 138, 364–373. [Google Scholar] [CrossRef]
- Soula, S.; Defer, E.; Fullekrug, M.; Van Der Velde, O.; Montanyà, J.; Bousquet, O.; Mlynarczyk, J.; Coquillat, S.; Pinty, J.-P.; Rison, W.; et al. Time and space correlation between sprites and their parent lightning flashes for a thunderstorm observed during the HyMeX campaign. J. Geophys. Res. 2015, 120, 11552–11574. [Google Scholar] [CrossRef]
- Carey, L.D.; Murphy, M.J.; McCormick, T.L.; Demetriades, N.W.S. Lightning location relative to storm structure in a leading-line, trailing-stratiform mesoscale convective system. J. Geophys. Res. 2005, 110, D03105. [Google Scholar] [CrossRef]
- Ely, B.L.; Orville, R.E.; Carey, L.D.; Hodapp, C.L. Evolution of the total lightning structure in a leading-line, trailing-stratiform mesoscale convective system over Houston, Texas. J. Geophys. Res. 2008, 113, D08114. [Google Scholar] [CrossRef]
- Lang, T.J.; Rutledge, S.A.; Wiens, K.C. Origins of positive cloud-to-ground lightning flashes in the stratiform region of a mesoscale convective system. Geophys. Res. Lett. 2004, 31, L10105. [Google Scholar] [CrossRef]
- Neubert, T.; Allin, T.H.; Blanc, E.; Farges, T.; Haldoupis, C.; Mika, A.; Soula, S.; Knutsson, L.; van der Velde, O.; Marshall, R.A.; et al. Co-ordinated observations of transient luminous events during the EuroSprite2003 campaign. J. Atmos. Sol.-Terr. Phys. 2005, 67, 807–820. [Google Scholar] [CrossRef]
- Suzuki, T.; Hayakawa, M.; Hobara, Y.; Kusunoki, K. First detection of summer blue jets and starters over Northern Kanto area of Japan: Lightning activity. J. Geophys. Res. 2012, 117, A07307. [Google Scholar] [CrossRef]
- Ishii, K.; Hayashi, S.; Fujibe, F. Statistical analysis of temporal and spatial distributions of cloud-to-ground lightning in Japan from 2002 to 2008. J. Atmos. Electr. 2014, 34, 79–86. [Google Scholar] [CrossRef]
- Ishihara, M.; Kato, Y.; Abo, T.; Kobayashi, K.; Izumikawa, Y. Characteristics and performance of the operational wind profiler network of the Japan Meteorological Agency. J. Meteorol. Soc. Jpn. Ser. II 2006, 84, 1085–1096. Available online: https://www.jstage.jst.go.jp/article/jmsj/84/6/84_6_1085/_article/-char/en (accessed on 14 July 2022). [CrossRef]
- Biggerstaff, M.I.; Houze, R.A., Jr. Kinematics and Microphysics of the Transition Zone of the 10–11 June 1985 Squall Line. J. Atmos. Sci. 1993, 50, 3091–3110. [Google Scholar] [CrossRef]
- MacGorman, D.R.; Rust, W.D. The Electrical Nature of Storms; Oxford University Press: Oxford, NY, USA, 1998; pp. 277, 281–282. [Google Scholar]
- Rutledge, S.A.; Williams, E.R.; Petersen, W.A. Lightning and electrical structure of mesoscale convective systems. Atmos. Res. 1993, 29, 27–53. [Google Scholar] [CrossRef]
- Cifelli, R.; Rutledge, S.A. Vertical motion structure in maritime continent mesoscale convective systems: Results from a 50-MHz Profiler. J. Atmos. Sci. 1994, 51, 2631–2652. [Google Scholar] [CrossRef]
- Azambuja, R. Thunderstorms Producing Sprites in South America. Ph.D. Thesis, Instituto Nacional de Pesquisas Espaciais, Sao Jose dos Campos, Brazil, 2013. [Google Scholar]
- Van der Velde, O.A.; Montanyà, J.; Soula, S.; Pineda, N.; Mlynarczyk, J. Bidirectional leader development in sprite-producing positive cloud-to-ground flashes: Origins and characteristics of positive and negative leaders. J. Geophys. Res. 2014, 119, 12755–12779. [Google Scholar] [CrossRef]
- Krehbiel, P.R.; Riousset, J.; Pasko, V.P.; Thomas, R.J.; Rison, W.; Stanley, M.A.; Edens, H.E. Upward electrical discharges from thunderstorms. Nat. Geosci. 2008, 1, 233–237. [Google Scholar] [CrossRef]
- Asano, T.; Suzuki, T.; Hiraki, Y.; Mareev, E.; Cho, M.G.; Hayakawa, M. Computer simulations on sprite initiation for realistic lightning models with higher-frequency surges. J. Geophys. Res. 2009, 114, A02310. [Google Scholar] [CrossRef]
- Yashunin, S.A.; Mareev, E.A.; Rakov, V.A. Are lightning M components capable of initiating sprites and sprite halos? J. Geophys. Res. 2007, 112, D10109. [Google Scholar] [CrossRef]
- Asano, T.; Suzuki, T.; Hayakawa, M.; Cho, M.G. Three-dimensional EM computer simulation on sprite initiation above a horizontal lightning discharge. J. Atmos. Sol.-Terr. Phys. 2009, 71, 983–990. [Google Scholar] [CrossRef]
- Rakov, V.A.; Crawford, D.E.; Rambo, K.J.; Schnetzer, G.H.; Uman, M.A.; Thottappillil, R. M-component mode of charge transfer to ground in lightning discharges. J. Geophys. Res. 2001, 106, 22817–22831. [Google Scholar] [CrossRef]
- Rutledge, S.A.; MacGorman, D.R. Cloud-to-ground lightning activity in the 10–11 June 1985 mesoscale convective system observed during the Oklahoma–Kansas PRE-STORM Project. Mon. Weather Rev. 1988, 116, 1393–1408. [Google Scholar] [CrossRef]
- Rutledge, S.A.; Lu, C.; MacGorman, D.R. Positive cloud-to-ground lightning in mesoscale convective systems. J. Atmos. Sci. 1990, 47, 2085–2100. [Google Scholar] [CrossRef]
- Holle, R.L.; Watson, A.I.; López, R.E.; Macgorman, D.R.; Ortiz, R.; Otto, W.D. The life cycle of lightning and severe weather in a 3–4 June 1985 PRE-STORM Mesoscale Convective System. Mon. Weather Rev. 1994, 122, 1798–1808. [Google Scholar] [CrossRef]
- Makowski, J.A.; MacGorman, D.R.; Biggerstaff, M.I.; Beasley, W.H. Total lightning characteristics relative to radar and satellite observations of Oklahoma mesoscale convective systems. Mon. Weather Rev. 2013, 141, 1593–1611. [Google Scholar] [CrossRef]


Publisher’s Note: MDPI stays neutral with regard to jurisdictional claims in published maps and institutional affiliations. |
© 2022 by the authors. Licensee MDPI, Basel, Switzerland. This article is an open access article distributed under the terms and conditions of the Creative Commons Attribution (CC BY) license (https://creativecommons.org/licenses/by/4.0/).