Article

Properties and Atmospheric Oxidation of Norpinic Acid Aerosol

1
Department of Environmental Engineering, Democritus University of Thrace, 67100 Xanthi, Greece
2
Department of Chemical Engineering, Carnegie Mellon University, Pittsburgh, PA 15213, USA
3
Institute of Chemical Engineering Sciences, ICE-HT, 26504 Patras, Greece
4
Institute of Physical Chemistry, Polish Academy of Sciences, 01-224 Warsaw, Poland
5
Department of Chemical Engineering, University of Patras, 26504 Patras, Greece
*
Author to whom correspondence should be addressed.
Atmosphere 2022, 13(9), 1481; https://doi.org/10.3390/atmos13091481
Submission received: 18 August 2022 / Revised: 3 September 2022 / Accepted: 8 September 2022 / Published: 13 September 2022
(This article belongs to the Section Air Pollution Control)

Abstract

:
Norpinic acid is a major semi-volatile oxidation product of α-pinene and β-pinene, two of the most important biogenic atmospheric volatile organic compounds. In this study we characterized the physicochemical properties of norpinic acid aerosol using a variety of techniques, and we investigated its reaction with OH radicals. The Aerosol Mass Spectrometer (AMS) spectrum of norpinic acid was characterized by a pronounced peak at m/z 82 (C5H6O+), which can be used as its chemical signature. The measured density of norpinic acid particles was 1.3 g cm−3. Its saturation concentration at 298 K was estimated to be equal to 8.9 μg m−3 using thermodenuder measurements and 12.8 μg m−3 using isothermal dilution. Its vaporization enthalpy was equal to 71 kJ mol−1. After reaction with OH radicals for an equivalent atmospheric period of 0.6–5 days under UV radiation and low RH, there were no noticeable changes in the AMS spectrum of the particles, while the wall-loss corrected mass concentration slightly decreased. This suggests that the atmospheric aging products of norpinic acid particles are quite similar to the parent molecule when measured by the AMS, and the aging reactions lead to a small change in particle mass concentration.

1. Introduction

Secondary organic aerosol (SOA) is one of the most important components of ambient organic aerosol (OA) [1]. On a global scale, the biogenic SOA contribution is estimated to be as much as 90% of the total SOA mass concentration [2]. Monoterpenes and, especially, α- and β-pinene are important biogenic SOA precursors [1,3,4]. Numerous studies, e.g., [5,6,7,8,9], have shown that the monoterpene SOA yield is high under typical atmospheric conditions, reaching values up to 30%. Previous studies have focused on the first-generation products of α- and β-pinene reactions, identifying pinic acid, pinonaldehyde, pinonic acid, nopinone, norpinic acid, etc. as some of the most important products in this system [10,11,12,13,14]. These first-generation products are semi-volatile with a wide range of volatilities. For example, the saturation concentrations of pinic and norpinic acid range between 0.9–23 μg m−3 and 6.2–21 μg m−3, respectively, for temperatures in the 290–310 K range [15], while nopinone and pinonaldehyde are more volatile with saturation concentrations in the range of 175–535 μg m−3 (for 290–310 K) [16] and 200 μg m−3 at 303 K [17], respectively. These first-generation products can further react to form second- and third-generation products and potentially increase the SOA yield of the parent VOC during a process called chemical aging. Aging of pinonic acid leads to 3-methyl-1,2,3-butanetricarboxylic acid (MBTCA) formation [14,18], while aging of nopinone leads to terpenylic acid production [14], which further reacts with OH radicals, forming terebic acid [19]. Pinonaldehyde oxidation by OH can produce a considerable amount of SOA in certain reaction pathways, but there also several reaction pathways that lead to fragmentation of the precursor carbon backbone and therefore an increase of volatility and evaporation of the corresponding organic aerosol [20].
Norpinic acid (C8H12O4) has been found in α-pinene SOA [12,21,22,23,24,25,26] and is also one of the β-pinene SOA components [12,13,14,21]. Norpinic acid has also been measured in the gas phase in laboratory α- and β-pinene oxidation experiments by Yu et al. [21] and it is clearly a semi-volatile SOA component. The norpinic acid yields decrease as NO2 increases [24].
In addition, norpinic acid has been measured in forests (boreal, spruce, tropical, etc.) in the high Arctic and in urban areas, e.g., [27,28,29,30,31,32,33,34]. In those studies, particulate concentrations ranged between 11 pg m−3 and 86 ng m−3. The lower concentrations of particulate norpinic acid were observed in the High Arctic (Canada), (11–153 pg m−3) and interestingly its mass concentration was lower in the summer compared to winter [30]. Most studies did not observe a significant diurnal variation, except Fu et al. [32] who reported an increase of norpinic acid as light intensity and temperature increased. In forested areas (e.g., Hyytiälä, Indian tropical forests, etc.) norpinic acid particulate mass concentration ranged between zero and 1.6 ng m−3 [27,28,31,32]. Studies in the boreal forest at Hyytiälä during the summer have reported a wide range of average concentrations varying from 4.3 to 56 ng m−3 [29]. Li et al. [34] measured norpinic acid concentrations in the summer in a forest in west China up to 86 ng m−3, while at the same period the norpinic acid concentration in a nearby city was lower and less than 30 ng m−3.
Despite the fact that norpinic acid has been detected both in laboratory scale studies and in field campaigns, there are limited studies about its physicochemical properties. Bilde et al. [15] measured, for the first time, the vapor pressure of trans-norpinic acid and reported a value of 11 ± 5.5 μg m−3 at 300 K. The melting point of trans-norpinic acid in the same study was 410 K. Kołodziejczyk et al. [35] measured the physicochemical properties of cis-norpinic acid such as its melting point (440.7 K), enthalpy of fusion (14.8 kJ mol−1), heat capacity at the fusion temperature (33.5 J mol−1 K−1), and intrinsic solubility (0.043 mmol dm−3). The water solubility of norpinic acid allows it to contribute to the ability of biogenic SOA particulate matter to act as cloud condensation nuclei. Kołodziejczyk et al. [35] also reported that cis-norpinic acid has a solid–solid phase transition at 338 K with an enthalpy of transition equal to 15.6 kJ mol−1.
Previous studies proposed that norpinic and norpinonic acid derive from further oxidation of the first generation (aldehydic) products of the pinenes [10,11]. Yasmeen et al. [36] proposed norpinic acid as a potential tracer for aged α-pinene SOA through degradation of pinic acid. However, Ma et al. [24] suggested that norpinic acid could be also formed as a direct product of α-pinene ozonolysis. After its formation, norpinic acid may react heterogeneously or via gas-phase reactions, forming dimers with extremely low volatility [37]. According to the Master Chemical Mechanism predictions [38,39] norpinic acid reacts with OH radicals with an estimated reaction constant of 6.6 × 10⁻¹² cm3 molecule−1 s−1 (based on a structural-activity relationship, SAR) losing atoms of oxygen, while further reactions lead to open ring products. Yasmeen et al. [19] proposed as products the open ring compounds C3H4O2 (MW = 72) and C5H8O2 (MW = 100). The corresponding lifetime of norpinic acid in the gas phase due to the reaction with OH (assuming OH levels of 1 × 10⁶ molecule cm−3) is approximately 1.8 days.
In this work, we used two different atmospheric simulation chambers together with online instrumentation for the characterization of the physicochemical properties of pure norpinic acid aerosol. We measured its aerosol mass spectrometer (AMS) spectrum, and we estimated its density, saturation concentration, and vaporization enthalpy. In addition, we explored the chemical aging of norpinic acid, through its reaction with OH radicals, and the mass spectrum of its products.

2. Experimental Approach and Methods

Pure norpinic acid was synthesized in the Laboratory of Environmental Chemistry in the Institute of Physical Chemistry (Warsaw, Poland), as described in the Supplementary Materials. Briefly, the synthesis took place in two stages, using verbenone as a starting point. The first step was the oxidative cleavage of the double C = C bond using RuCl3 × H2O, whereas the second one entailed the haloform reaction using bromine and sodium hydroxide (Figure S1). The nuclear magnetic resonance (NMR) spectra of the synthesized norpinic acid is depicted in Figure S2.

2.1. Experimental Set Up

The experiments were conducted in a 10 m3 Teflon reactor in Patras (FORTH/ICE-HT environmental chamber) and in a similar reactor in Carnegie Mellon University (Figure S3). The use of the two different chambers helps assure that any artifacts related to the walls of the chambers are negligible for the purposes of this work. The RH in the chambers was always kept below 20%. An atomizer (TSI, model 3076) was used to generate aerosol through the corresponding aqueous solutions. Norpinic acid and ammonium sulfate aerosols were introduced into the chamber either from the same solution, or as separate solutions (3–4 g L−1 for each compound). Before entering the chamber, the droplets were dried by passing through a diffusion dryer.
OH radicals were produced by HONO photolysis under UV illumination (JNO2 = 0.59 min−1 and 0.20 min−1 for FORTH/ICE-HT and CMU chambers respectively), following the same procedure as described in Kostenidou et al. [40]. A HONO aqueous solution was prepared by mixing a fresh sulfuric acid solution (4.9 g L−1) with a fresh sodium nitrate solution (6.9 g L−1) and HONO was introduced into the chamber through a bubbler. Before the photolysis 80–180 ppb of butanol-d9 (98%, Cambridge Isotope Laboratories, Inc.) was introduced into the chamber as an OH tracer [41]. The experimental parameters are shown in Table 1.
The experiments covered a wide range of initial concentrations of norpinic acid aerosol and exposures to OH. In some experiments we used pure norpinic acid to avoid any artifacts from the introduction of seeds on its characterization, in some others we introduced the seeds and the norpinic acid aerosol (externally mixed particles) separately, and we also performed experiments with mixed ammonium sulfate/norpinic acid aerosol (internally mixed). The use of both inert seeds and norpinic acid particles allows a more accurate characterization of the particle losses to the walls of the chamber during the experiment. The use of mixed particles allowed us to estimate the volatility of the norpinic acid at room temperature based on the change of the particle composition.
The mass concentration and the chemical composition were measured by an Aerodyne high-resolution time-of-flight aerosol mass spectrometer (HR-ToF-AMS) sampling at approximately 0.1 L min−1 [42]. The size number and volume distributions were provided by a scanning mobility particle sizer (SMPS, classifier model 3080, DMA model 3081, CPC model 3775, TSI) sampling at 0.5 L min−1.
A thermodenuder [43] was employed for the mass fraction remaining (MFR) measurement of norpinic acid. The thermodenuder used in this study has been described elsewhere [40,44]. The aerosol was passing alternatively either through the thermodenuder, or through a bypass line every 3 min. Each line was analyzed by the HR-AMS and the SMPS. The thermodenuder was operated at temperatures between 25 and 160 °C. The centerline residence time was 14 s.
A Proton Transfer Reaction Mass Spectrometer (PTR-MS, Ionikon Analytik) monitored the gas phase for 47 different m/z’s with a resolution of 10 s. The inlet tube and the reaction chamber were set at 60 °C. The drift tube pressure was 2.2 mbar and the voltage applied was 600 V.

2.2. Data Analysis

To analyze the raw HR-AMS data, we used the standard HR-AMS software SQUIRREL v1.60A and PIKA v1.20A with Igor Pro 6.37 (Wavemetrics). OH levels were calculated based on the butanol-d9 decay (following the signal at m/z 66 in PTR-MS) and using a reaction rate constant with OH of 3.4 × 10⁻¹² cm3 molecule−1 s−1 [41]. For the particle losses calculation inside the thermodenuder, we used the procedure described in Louvaris et al. [44].
The OA volatility was estimated using the dynamic mass transfer model of Riipinen et al. [45]. The model simulates the particle vaporization inside the thermodenuder and predicts the MFR. We estimated both the OA saturation concentration (C*) at 298 K and its effective vaporization enthalpy (ΔHvap) by minimizing the discrepancy between the measurements and the model predictions. For our simulations, we assumed a mass accommodation coefficient equal to unity.
For the particle wall losses in the experimental chamber, we applied a size-dependent particle correction following the approach suggested by Wang et al. [46]. For the characterization of the wall-loss rate constant, k, dry polydisperse ammonium sulfate particles were used either before or after each experiment. The wall-loss rate constant was quite stable and similar for all the experiments (Figure S4).
For the estimation of the elemental ratios, we applied the method of Canagaratna et al. [47] together with the fragmentation table of Aiken et al. [48], as described in Kostenidou et al. [40]. The approach takes advantage of the high-resolution spectra measured by the AMS, finds the carbon and oxygen content of each m/z signal, and then combines them to calculate the overall O:C for the aerosol. The density of the norpinic acid particles and the collection efficiency (CE) of the AMS were estimated by matching the AMS mass distributions with the SMPS volume distributions using the algorithm of Kostenidou et al. [49]. The conversion of the AMS total mass size distribution to an aerosol volume distribution requires the CE of the AMS and also the unknown density of the OA. The algorithm finds the values of these two parameters that lead to an AMS aerosol volume distribution that is consistent with that measured by the SMPS.
PMF analysis [50,51] was applied to HR-ToF-AMS organic mass spectra in an effort to separate them into fresh and aged norpinic acid aerosol. We followed the procedure of Ulbrich et al. [52].

3. Results and Discussion

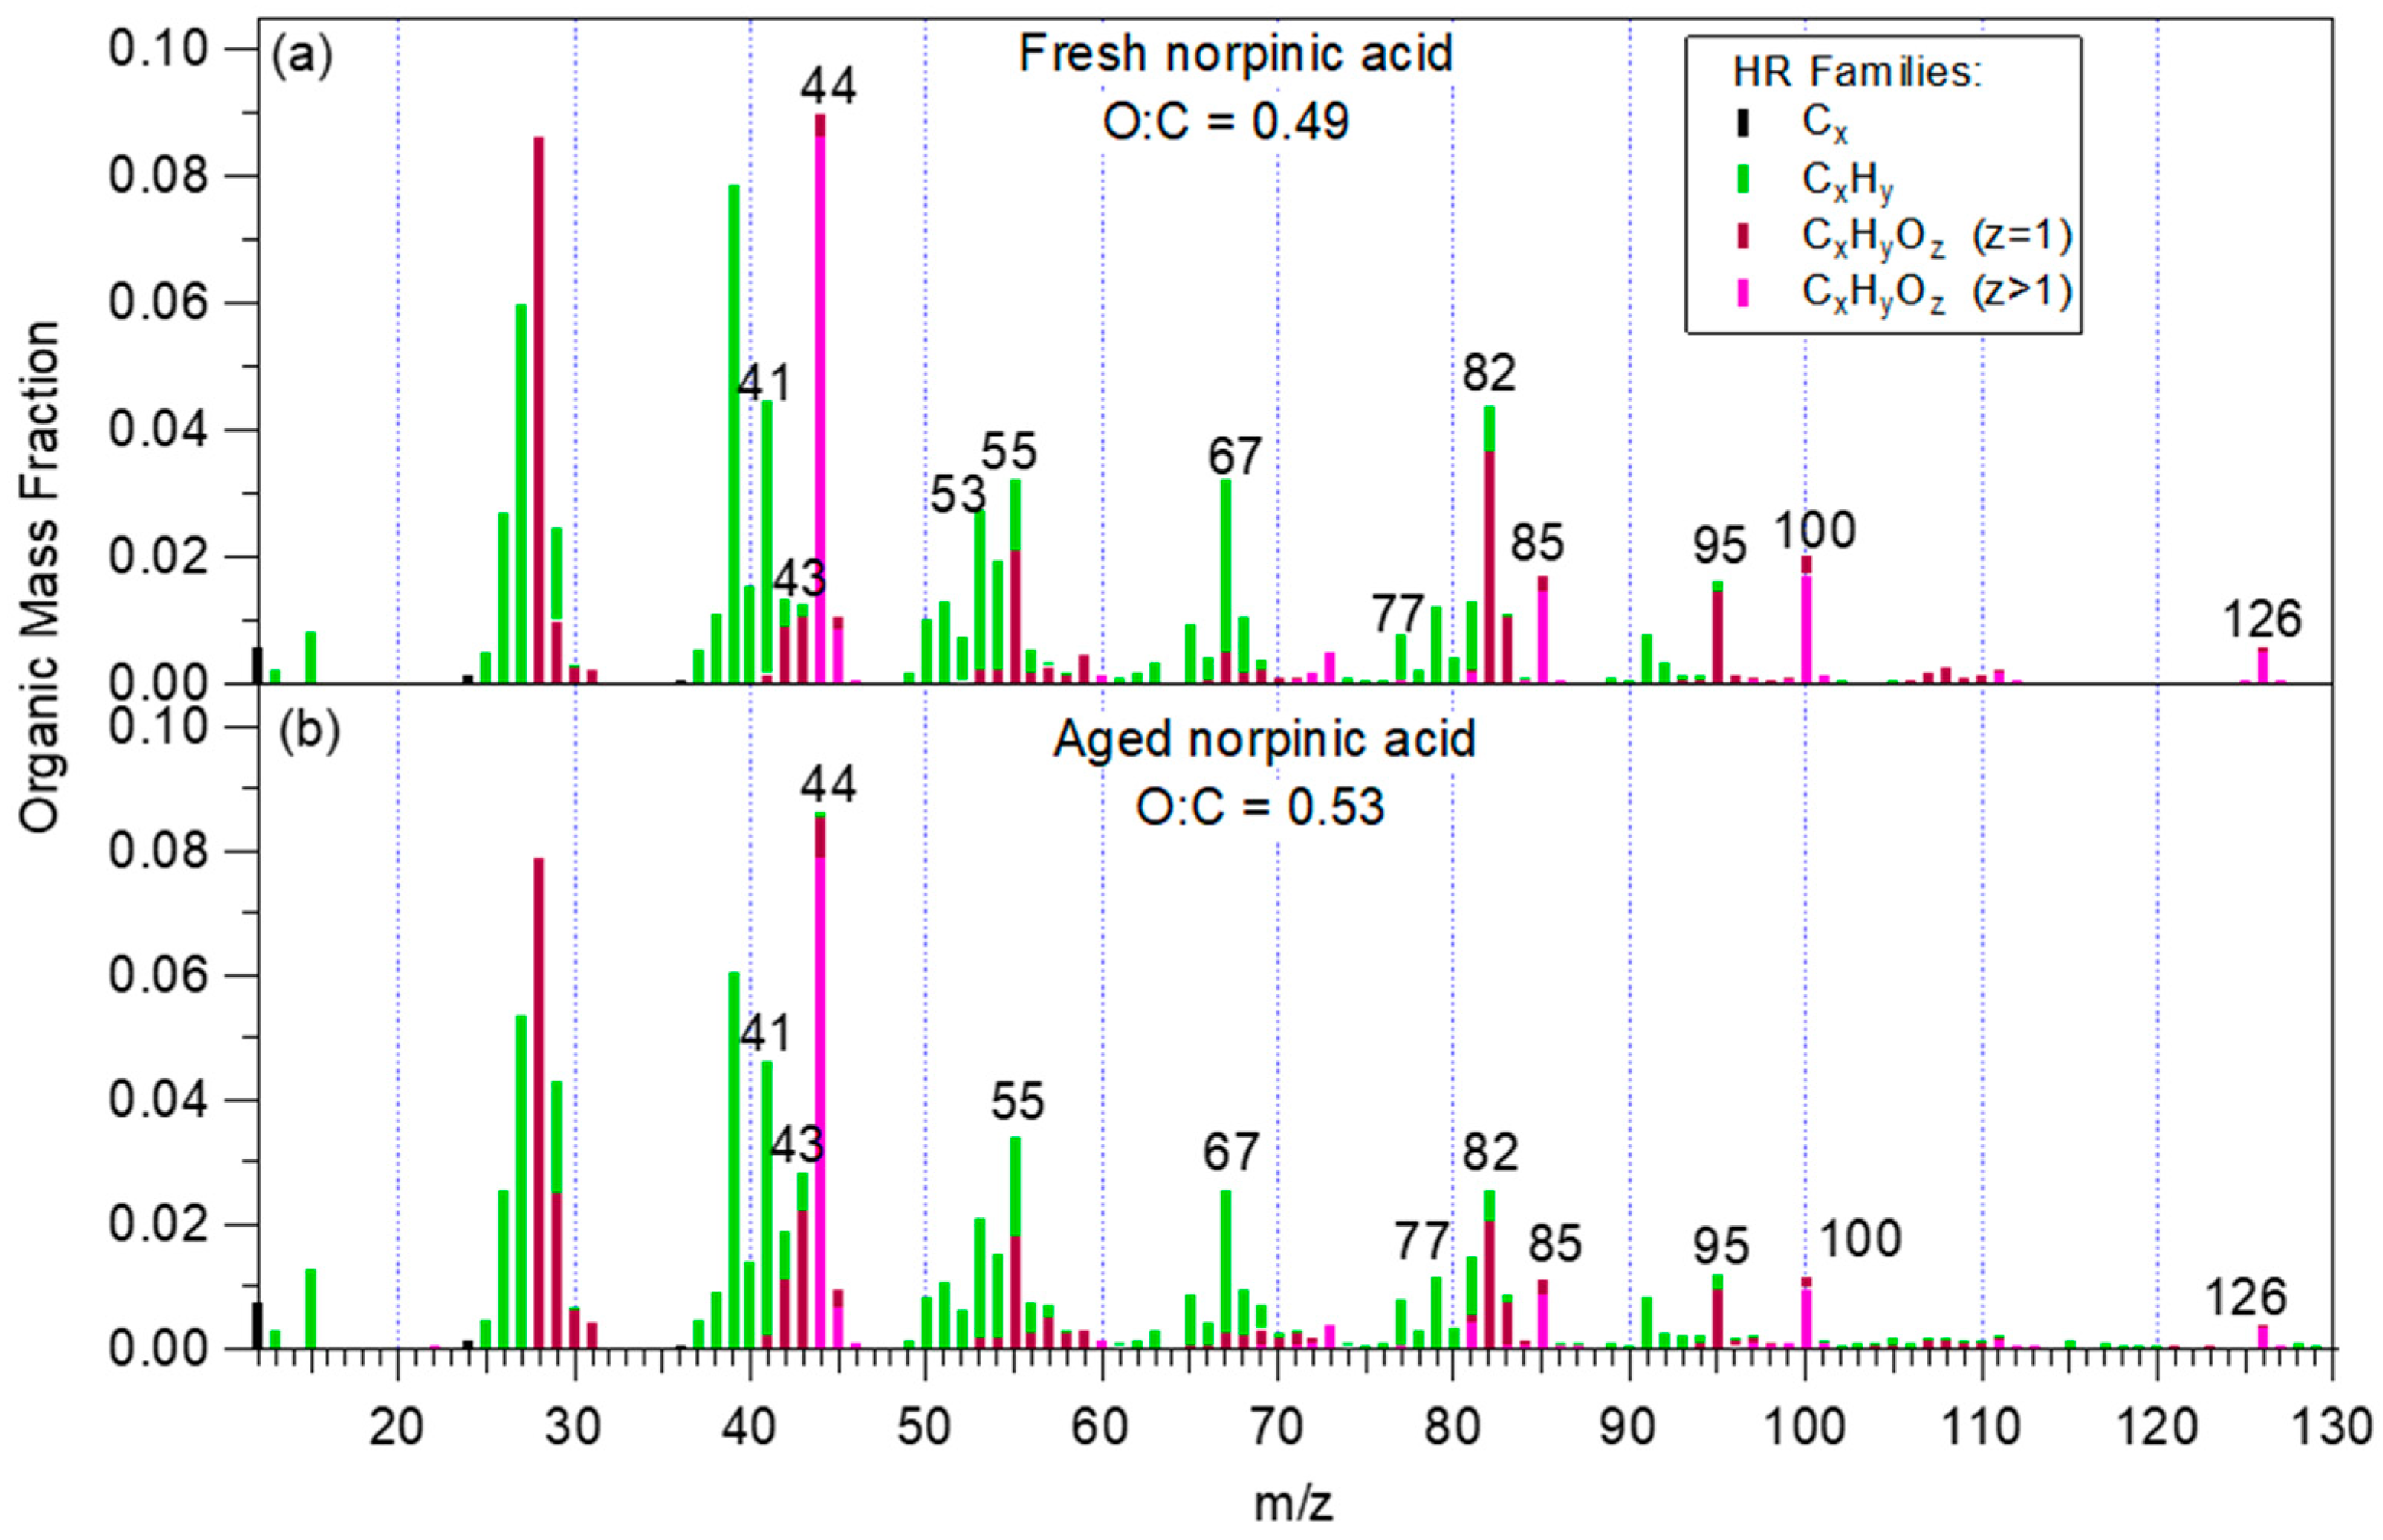
3.1. HR-ToF-AMS Mass Spectrum and Elemental Ratios

The average high-resolution AMS spectrum of norpinic acid is depicted in Figure 1. The average unit resolution mass spectrum is shown in Figure S5; the differences between the mass spectra of each individual experiment and the average mass spectrum were small, as their R2 ranged between 0.972 and 0.994 (or they had an angle theta between 4 and 12 degrees); the angle theta is described in Kostenidou et al. [53]. The most important characteristic m/z ratios were 59, 65, 67, 68, 73, 77, 79, 82, 83, 85, 95, 100, 108, 111 and 126. Most of them were dominated by oxygenated fragment ions with one or two oxygens. The signal at m/z 82 was quite distinct and mainly due to C5H6O+. The m/z 82 fragment has also been reported in ambient Positive Matrix Factorization (PMF) biogenic-OA related sources, for example in Borneo, Malaysia [54], at a rural area in Ontario, Canada [55], in tropical rainforests in the central Amazon Basin [56] and at a suburban site in Patras, Greece [57]. In other studies, PMF factors with a characteristic m/z 82 have been attributed to isoprene epoxydiols (IEPOX) OA [58,59,60] due to the isoprene presence and because IEPOX reactive uptake products have a characteristic peak at m/z 82 [61]. However, since m/z 82 is also present in the norpinic acid mass spectrum, the ambient PMF sources containing the m/z 82 should not be attributed only to IEPOX OA but also to monoterpene products. Table 2 shows the correlation (expressed in both R2 and angle theta) between the norpinic acid mass spectrum and the mass spectra of biogenic ambient factors, terpenes SOA and MBTCA. The best correlation was observed for the MBTCA spectrum [40], the biogenic OA factor found in the area of Patras [57] and the α-pinene ozonolysis SOA [46].
The estimated O:C and H:C ratios were 0.49 ± 0.01 and 1.56 ± 0.01 practically the same with the expected values for C8H12O4.
The AMS spectra of norpinic acid particles passing through the TD give us an opportunity to investigate any potential changes in the particles as they are exposed to higher temperatures, at least from the AMS limited point of view. After heating the particles up to 60 °C, the AMS spectra were similar to those measured at room temperature with angles theta lower than 3 degrees (Figure S6). At 65 °C, 80% of the norpinic acid had evaporated and the AMS spectrum of the remaining material had an angle of 8° compared to the one measured at room temperature. At 70 °C, with 14% of the material remaining, the corresponding angle θ increased to 20° (Figure S6). This unexpected behavior could be due to different reasons. First, it could be due to impurities in the particles introduced by the aerosol production system. Comparing the mass spectrum of the aerosol produced after the atomization of the water used for our experiments and the TD mass spectra at 70 °C and 90 °C, we found similarities as the angles were relatively low (19 and 15 degrees correspondingly) (Figure S7). This implies that at TD temperatures higher than 65 °C most of the norpinic acid had evaporated and the remaining particles were mainly composed of water impurities. A second explanation could be possible impurities during the synthesis of the norpinic acid. Based on NMR spectrum analysis (Figure S2), these impurities were less than 1–3%, therefore the purity of norpinic acid was 97–99%, which makes this hypothesis unlikely. Another explanation could be reactions taking place in the TD at these higher temperatures and thus changing the norpinic acid. The estimated O:C ratio of the aerosol at 70 °C was 0.62 and its H:C was 1.60. At 70 °C the m/z’s 39, 55, 67, 82, 85, 95 and 100 were lower, while the m/z 44 was higher compared to the AMS spectrum at ambient temperature. This implies that the contribution of some reactions during heating of the aerosol is also possible.

3.2. Density and AMS Collection Efficiency

For the experiments conducted in the ICE-HT smog chamber, the norpinic acid particle density at room temperature was equal to 1.3 ± 0.01 g cm−3, while the CE was 0.37 ± 0.05. Using the equation of Kuwata et al. [64], which is based on the elemental ratios, the estimated norpinic acid density was 1.3 g cm−3, in excellent agreement with the value estimated by the algorithm of Kostenidou et al. [49]. This supports the applicability of this equation for similar compounds. The CE of the aerosol going through the TD was the same as that of the aerosol going through the bypass line, so there was no need for corrections of the AMS mass concentrations related to different CE values between the heated and non-heated particles.

3.3. Norpinic acid Volatility

3.3.1. Using the Thermodenuder Measurements

The norpinic acid mass fraction remaining (MFR) corrected for particle losses in the TD and calculated based on the AMS measurements is depicted in Figure 2. The corresponding MFR calculated from the SMPS measurements using the temperature-dependent density (Figure S8) was within 10% of that calculated from the AMS measurements.
Following the modelling approach described in Riipinen et al. [45], we used as inputs the corrected AMS MFR data and we estimated a saturation concentration of 8.9 μg m−3 and a vaporization enthalpy of 71 kJ mol−1. Our estimated saturation concentration was only slightly higher, but quite similar to the previous estimate of C* = 9 μg m−3 reported by Bilde and Pandis [15] for norpinic acid at 298 K. In addition, our ΔHvap was at the upper part of the range of Bilde and Pandis [15], who suggested a ΔHvap = 42 ± 51 kJ mol−1.

3.3.2. Isothermal Evaporation of Norpinic Acid in the Chamber

The norpinic acid aerosol introduced in the simulation chamber filled with clean air evaporates partially to establish equilibrium with the gas phase. This evaporation can be used to estimate its saturation concentration at room temperature. The simplest approach is to estimate this saturation concentration, Cnorp, as the difference of the initial concentration of norpinic acid aerosol, OA(t0), and its concentration at equilibrium (corrected for wall losses), OA(teq):
C n o r p = O A ( t 0 ) O A ( t e q )  
The difference in these concentrations is the amount that has been evaporated from the particles and moved to the gas phase. The challenge in this simple approach is that the determination of the two concentrations is not straightforward. First, the aerosol is not well mixed for several minutes after its introduction in the chamber, and therefore the initial concentration of the norpinic acid aerosol, OA(t0), is quite uncertain. One could, for example, use the peak value, which for Exp. 2 was 86.1 μg m−3 (Figure 3a). However, this is probably an upper estimation because it corresponds to a period in which the introduced norpinic acid has not mixed well throughout the chamber. This is supported by the fact that the sulfate concentration (corrected for wall losses) is decreasing, suggesting that the system is still getting mixed. So, the difference of 86.1 − 46.9 = 39.2 μg m−3 is probably significantly overestimating the saturation concentration of norpinic acid.
In experiments in which the norpinic acid is produced together with ammonium sulfate from the same solution, the particles contain both the nonvolatile (at room temperature) sulfate and the evaporating norpinic acid. If all particles had the same composition and there was no norpinic acid evaporation, then the OA to sulfate ratio would remain constant with time and would be equal to the mass ratio of the two compounds in the solution that was atomized to produce the particles; however, this is not the case, as shown in Figure 3b. Using the ratio of the OA to sulfate, the saturation concentration of norpinic acid Cnorp can be calculated from the equation below:
C n o r p = S u l f ( t e q ) [ O A S u l f ] 0 exp ( k w t e q ) O A ( t e q ) k w 0 t e q O A ( t ) d t  
where [OA/Sulf]0 is the OA to sulfate concentration ratio at time zero (the time at which the injection of the aerosol in the chamber has been completed) and OA(teq) and Sulf(teq) are the corresponding concentrations at a time teq at which the system has equilibrated. The average wall-loss rate constant is kw and the measured concentration of OA as a function of time is OA(t). In Equation (2) the first term is equal to the concentration of the OA at time zero (before evaporation started), the second is the concentration that remained after evaporation and losses on the walls took place, and the last term is the amount that deposited on the walls. We applied this approach to experiments 2, 5 and 6 and we estimated a saturation concentration of 12.8 ± 4.8 μg m−3, which is in good agreement with the value estimated from the thermodenuder measurements. This supports the use of this simple isothermal dilution approach for the estimation of the saturation concentration of the compound of interest.

3.4. Chemical Aging

OH radicals were introduced into the chamber with norpinic acid particles during four experiments (exp. 2, 3, 5 and 6) under UV irradiation. The equivalent OH exposure varied from 0.6 days in experiment 5 to five days in experiment 2, assuming a daily average OH concentration equal to 106 molecule cm−3 [65].
The resulting changes in the norpinic acid aerosol concentration were small and could be equal to zero, taking into account the uncertainty due to the wall-loss corrections. For example, during experiment 2 we estimated a decrease of 6% of the organic aerosol concentration based on the AMS data after several hours of exposure to OH (Figure 3a). Based on the SMPS data, the total aerosol volume (which includes the ammonium sulfate) decreased by 3% (Figure 3c), a result consistent with that of the AMS. Experiment 3 showed the same behavior (Figure S9a,b), with the wall-loss corrected organic mass concentration decreasing by 10%, while the wall-loss corrected volume concentration decreased by 5%. The chemical aging due to exposure to OH radicals in experiments 5 and 6 also resulted in a small decrease in the wall-loss corrected total organic mass concentration (10% and 2%, respectively). These results suggest that there was no rapid or large net production of secondary organic aerosol as the norpinic acid particles and vapor reacted with the OH radicals in our experiments. If anything, there could be some small reduction of the particle mass concentration, but this change was within the limits of experimental uncertainty.
In addition, the O:C of the organic aerosol remained practically constant during these aging experiments, changing less than 0.8% in all experiments (Figure 3d and Figure S8c). The small observed change was always an increase.
The theta angle between the mass spectra of the fresh norpinic acid aerosol and the mass spectra after OH exposure and UV irradiation was less than 4.5 degrees for all four aging experiments, even after an OH exposure of approximately five days (Figure 4). These small changes were due to increases in the fragments with m/z 43.018 (C2H3O+), 57.034 (C3H5O+), 69.034 (C4H5O+), 71.049 (C4H7O+), etc. when OH was introduced into the chamber. Figure S10 illustrates some of the fragments that increased with aging during experiment 2. During experiment 5 we did not observe any significant increase for any m/z during the exposure to OH radicals. This experiment had the shortest exposure to OH (0.6 days of equivalent exposure) and a net decrease of the OA concentration (approximately 10% after correcting for wall losses). This may suggest that the reactions in this experiment resulted in fragmentation and evaporation of a small fraction of the norpinic acid aerosol without any significant addition of new secondary material from the gas phase. In experiment 6, most m/z values remained quite stable after the OH addition (Figure S11). Taking into account that there is evidence of some small decreases of the wall-loss corrected total organic mass concentration by 3%, we conclude that slow fragmentation was likely the only significant process during this experiment as well. Unfortunately, during experiment 6 the OH concentration could not be estimated due to a malfunction of the PTR-MS.
Performing PMF analysis for experiment 2, two factors were extracted. The first factor corresponded to the fresh norpinic acid with an O:C equal to 0.49 (Figure 5a). When the chemical aging started, the mass concentration of the fresh norpinic acid factor started decreasing (Figure 6), reaching 60% of the total organic mass after 17 h. The second factor was probably related to the aged norpinic acid aerosol. It had almost zero mass concentration when the UV lights were off, and it started increasing as soon as the aerosol was exposed to OH (Figure 6). The aged norpinic acid aerosol AMS spectrum had an O:C ratio equal to 0.53 (Figure 5b), very close to that of the fresh. This similarity of the O:C values could explain the fact that the total O:C did not practically change over chemical aging. The compounds produced by the norpinic acid aging had a similar AMS mass spectrum with the fresh norpinic acid (angle theta = 12.5°, R2 = 0.948), with only a slightly higher O:C ratio.
The results of the PMF analysis of the other three aging experiments provided little useful information, as the AMS spectra of the fresh and the aged aerosol were quite similar to each other. This is probably due to the smaller OH exposure in these experiments (compared to experiment 2) that did not allow the PMF algorithm to separate the fresh and aged components.

4. Conclusions

In this work we investigated the physicochemical properties of norpinic acid aerosol and its aging potential in two environmental chambers. The saturation concentration (at 298 K) was estimated to be equal to 8.9 μg m−3 using thermodenuder measurements and 12.8 μg m−3 using isothermal dilution. This suggests that this biogenic secondary organic aerosol component is semi-volatile and will exist in both gas and particulate phases under typical atmospheric conditions. Its vaporization enthalpy was 71 kJ mol−1, while its density was 1.3 g cm−3.
A characteristic peak at m/z 82.042 (C5H6O+), which was observed in the AMS spectrum, can serve as a fingerprint for norpinic acid. Upon chemical aging with OH radicals, which corresponded to an exposure of 0.6–5 days at low RH levels, the wall-loss corrected total organic mass concentration had only a slight net decrease (2–10%). However, these changes were similar in magnitude to the uncertainty of the wall-loss corrections of our measurements. The O:C ratio of the organic aerosol also remained approximately constant (changing by less than 1%) during the exposure to OH. Applying PMF analysis to the AMS data, two factors were determined: one linked to fresh and a second one related to aged norpinic acid. The aged norpinic acid had only a slightly higher O:C ratio (0.53) compared to the fresh, with a rather similar mass spectrum. This may imply that the norpinic acid products have a similar chemical signature on the AMS, and thus it will be quite difficult to distinguish them from the fresh norpinic acid in the ambient atmosphere using this technique. Our results also suggest that the chemical aging of norpinic acid with OH does not result in drastic change of either the secondary organic aerosol concentration or its AMS signature during the timescales and conditions investigated in this study.
The use of particles consisting of both ammonium sulfate and norpinic acid allowed us to measure the saturation concentration of norpinic acid at room temperature using the change of the aerosol composition measured by the AMS. This easy-to-implement technique can be used as a complimentary approach to thermodenuding or other saturation concentration measurement approaches for organic aerosol.
The results of this study can be used to constrain the biogenic SOA contribution to ambient organic aerosol levels using norpinic acid concentration measurements, and they can also provide valuable insights about the simulation of the later-generation chemistry and corresponding SOA production for monoterpenes.

Supplementary Materials

The following supporting information can be downloaded at: https://www.mdpi.com/article/10.3390/atmos13091481/s1, Figure S1: Synthesis of cis-norpinic acid; Figure S2: NMR spectra of cis-norpinic acid; Figure S3: Smog chamber setup; Figure S4: Wall-loss rates (k) profiles; Figure S5: Average UMR mass spectrum of pure norpinic acid particles; Figure S6: Bypass and thermodenuded AMS mass spectra for 60 and 70 °C and angle theta between bypass and thermodenuded AMS mass spectra; Figure S7: Comparison between water mass spectra and thermodenuded AMS mass spectra for 70 and 90 °C; Figure S8: VFR and MFR; Figure S9: Particle wall-loss corrected time series of volume concentration and organic mass concentration and O:C ratio; Figure S10: Fragments that increased with chemical aging during experiment 2; Figure S11: Fragments that remained stable after OH addition during experiment 6.

Author Contributions

Experimental work, E.K., S.J., K.F. and A.K.; conceptualization, S.N.P. and R.S.; methodology, E.K., J.K.K., R.S. and S.N.P.; data analysis: E.K., S.J., K.F., J.K.K. and A.K.; writing—original draft preparation, E.K. writing—review and editing; all authors. All authors have read and agreed to the published version of the manuscript.

Funding

We acknowledge the support of this work by the EU H2020 project “Sustainable Access to Atmospheric Research Facilities (ATMO-ACCESS)” (grant number 101008004) and by the project “PANhellenic infrastructure for Atmospheric Composition and climatE chAnge” (MIS 5021516) which is implemented under the Action “Reinforcement of the Research and Innovation Infrastructure”, funded by the Operational Programme “Competitiveness, Entrepreneurship and Innovation” (NSRF 2014–2020) and co-financed by Greece and the European Union (European Regional Development Fund).

Institutional Review Board Statement

Not applicable.

Informed Consent Statement

Not applicable.

Data Availability Statement

The data presented in this study are available on request from the corresponding author.

Conflicts of Interest

The authors declare no conflict of interest.

References

  1. Kanakidou, M.; Seinfeld, J.H.; Pandis, S.N.; Barnes, I.; Dentener, F.J.; Facchini, M.C.; Van Dingenen, R.; Ervens, B.; Nenes, A.; Nielsen, C.J.; et al. Organic aerosol and global climate modelling: A review. Atmos. Chem. Phys. 2006, 5, 1053–1123. [Google Scholar] [CrossRef]
  2. Hallquist, M.; Wenger, J.C.; Baltensperger, U.; Rudich, Y.; Simpson, D.; Claeys, M.; Dommen, J.; Donahue, N.M.; George, C.; Goldstein, A.H.; et al. The formation, properties and impact of secondary organic aerosol: Current and emerging issues. Atmos. Chem. Phys. 2009, 9, 5155–5236. [Google Scholar]
  3. Andersson-Sköld, Y.; Simpson, D. Secondary organic aerosol formation in Northern European model study. J. Geophys. Res. 2001, 106, 7357–7374. [Google Scholar] [CrossRef]
  4. Seinfeld, J.H.; Pankow, J.F. Organic atmospheric particulate material. Ann. Rev. Phys. Chem. 2003, 54, 121–140. [Google Scholar] [CrossRef]
  5. Lee, A.; Goldstein, A.H.; Keywood, M.D.; Gao, S.; Varutbangkul, V.; Bahreini, R.; Ng, N.L.; Flagan, R.C.; Seinfeld, J.H. Gas-phase products and secondary aerosol yields from the ozonolysis of ten different terpenes. J. Geophys. Res. 2006, 111, 1–18. [Google Scholar] [CrossRef]
  6. Pathak, R.K.; Stanier, C.O.; Donahue, N.M.; Pandis, S.N. Ozonolysis of α-pinene at atmospherically relevant concentrations: Temperature dependence of aerosol mass fractions (yields). J. Geophys. Res. 2007, 112, 1–8. [Google Scholar] [CrossRef]
  7. Shilling, J.E. Particle mass yield in secondary organic aerosol formed by the dark ozonolysis of α-pinene. Atmos. Chem. Phys. 2008, 8, 2073–2088. [Google Scholar] [CrossRef]
  8. Kristensen, K.; Jensen, L.N.; Glasius, M.; Bilde, M. The effect of sub-zero temperature on the formation and composition of secondary organic aerosol from ozonolysis of alphα-pinene. Environ. Sci. Process. Impacts 2017, 19, 1220–1234. [Google Scholar] [CrossRef]
  9. Friedman, B.; Farmer, D.K. SOA and gas phase organic acid yields from the sequential photooxidation of seven monoterpenes. Atmos. Environ. 2018, 187, 335–345. [Google Scholar] [CrossRef]
  10. Yu, J.; Flagan, R.C.; Seinfeld, J.H. Identification of products containing -COOH, -OH, and –C=O in atmospheric oxidation of hydrocarbons. Environ. Sci. Technol. 1998, 32, 2357–2370. [Google Scholar] [CrossRef]
  11. Jang, M.; Kamens, R.M. Newly characterized products and composition of secondary aerosols from the reaction of α-pinene with ozone. Atmos. Environ. 1999, 33, 459–474. [Google Scholar] [CrossRef]
  12. Glasius, M.; Lahaniati, M.; Calogirou, A.; Di Bella, D.A.; Jensen, N.R.; Hjorth, J.; Kotzias, D.; Larsen, B.R. Carboxylic acids in secondary aerosols from oxidation of cyclic monoterpenes by ozone. Environ. Sci. Technol. 2000, 34, 1001–1010. [Google Scholar] [CrossRef]
  13. Jaoui, K.; Kamens, R.M. Mass balance of gaseous and particulate products from β-pinene/O3/air in the absence of light and β-pinene/NOx/air in the presence of natural sunlight. J. Atmos. Chem. 2003, 43, 101–141. [Google Scholar] [CrossRef]
  14. Sato, K.; Jia, T.; Tanabe, K.; Morino, Y.; Kajii, Y.; Imamura, T. Terpenylic acid and nine-carbon multifunctional compounds formed during the aging of β-pinene ozonolysis secondary organic aerosol. Atmos. Environ. 2016, 130, 127–135. [Google Scholar] [CrossRef]
  15. Bilde, M.; Pandis, S.N. Evaporation rates and vapor pressures of individual aerosol species formed in the atmospheric oxidation of α-pinene. Environ. Sci. Technol. 2001, 35, 3344–3349. [Google Scholar] [CrossRef]
  16. Steitz, B. Experimental Determination of the Partitioning Coefficient of Nopinone as a Marker Substance in Organic Aerosol. Ph.D. Thesis, Fakultät für Mathematik und Naturwissenschaften, Fach Physik, Bergischen Universität Wuppertal, Wuppertal, Germany, 2012. [Google Scholar]
  17. Tillmann, R.; Hallquist, M.; Jonsson, Å.M.; Kiendler-Scharr, A.; Saathoff, H.; Iinuma, Y.; Mentel, T.F. Influence of relative humidity and temperature on the production of pinonaldehyde and OH radicals from the ozonolysis of α-pinene. Atmos. Chem. Phys. 2010, 10, 7057–7072. [Google Scholar] [CrossRef]
  18. Müller, M.; Graus, M.; Wisthaler, A.; Hansel, A.; Metzger, A.; Dommen, J.; Baltensperger, U. Analysis of high mass resolution PTR-TOF mass spectra from 1,3,5-trimethylbenzene (TMB) environmental chamber experiments. Atmos. Chem. Phys. 2012, 12, 829–843. [Google Scholar] [CrossRef]
  19. Yasmeen, F.; Vermeylen, R.; Szmigielski, R.; Iinuma, Y.; Böge, O.; Herrmann, H.; Maenhaut, W.; Claeys, M. Terpenylic acid and related compounds: Precursors for dimers in secondary organic aerosol from the ozonolysis of α- and β-pinene. Atmos. Chem. Phys. 2010, 10, 9383–9392. [Google Scholar] [CrossRef]
  20. Chacon-Madrid, H.J.; Henry, K.M.; Donahue, N.M. Photo-oxidation of pinonaldehyde at low NOx: From chemistry to organic aerosol formation. Atmos. Chem. Phys. 2013, 13, 3227–3236. [Google Scholar] [CrossRef]
  21. Yu, J.; Cocker, D.R.; Griffin, R.J.; Flagan, R.C.; Seinfeld, J.H. Gas-phase ozone oxidation of monoterpenes: Gaseous and particulate products. J. Atmos. Chem. 1999, 34, 207–258. [Google Scholar] [CrossRef]
  22. Kückelmann, U.; Warscheid, B.; Hoffmann, T. On-line characterization of organic aerosols, formed from biogenic precursors using atmospheric pressure chemical ionization mass spectrometry. Anal. Chem. 2000, 72, 1905–1912. [Google Scholar] [CrossRef]
  23. Iinuma, Y.; Boge, O.; Gnauk, T.; Herrmann, H. Aerosol-chamber study of the α-pinene/O3 reaction: Influence of particle acidity on aerosol yields and products. Atmos. Environ. 2004, 38, 761–773. [Google Scholar] [CrossRef]
  24. Ma, Y.; Russell, A.T.; Marston, G. Mechanisms for the formation of secondary organic aerosol components from the gas-phase ozonolysis of α-pinene. Phys. Chem. Chem. Phys. 2008, 10, 4294–4312. [Google Scholar] [CrossRef] [PubMed]
  25. Camredon, M.; Hamilton, J.F.; Alam, M.S.; Wyche, K.P.; Carr, T.; White, I.R.; Monks, P.S.; Rickard, A.R.; Bloss, W.J. Distribution of gaseous and particulate organic composition during dark α-pinene ozonolysis. Atmos. Chem. Phys. 2010, 10, 2893–2917. [Google Scholar] [CrossRef]
  26. Geddes, S.; Nichols, B.; Todd, K.; Zahardis, J.; Petrucci, G.A. Near-infrared laser desorption/ionization aerosol mass spectrometry for measuring organic aerosol at atmospherically relevant aerosol mass loadings. Atmos. Meas. Tech. 2010, 3, 1175–1183. [Google Scholar] [CrossRef]
  27. Boy, M.; Petäjä, T.; Dal Maso, M.; Rannik, Ü.; Rinne, J.; Aalto, P.; Laaksonen, A.; Vaattovaara, P.; Joutsensaari, J.; Hoffmann, T.; et al. Overview of the field measurement campaign in Hyytiälä, August 2001 in the framework of the EU project OSOA. Atmos. Chem. Phys. 2004, 4, 657–678. [Google Scholar] [CrossRef]
  28. Plewka, A.; Gnauk, T.; Bruggemann, E.; Herrmann, H. Biogenic contributions to the chemical composition of airborne particles in a coniferous forest in Germany. Atmos. Environ. 2006, 40, S103–S115. [Google Scholar] [CrossRef]
  29. Kourtchev, I.; Ruuskanen, T.M.; Keronen, P.; Sogacheva, L.; Dal Maso, M.; Reissell, A.; Chi, X.; Vermeylen, R.; Kulmala, M.; Maenhaut, W.; et al. Determination of isoprene and α-/β-pinene oxidation products in boreal forest aerosols from Hyytiälä, Finland: Diel variations and possible link with particle formation events. Plant Biol. 2008, 10, 138–149. [Google Scholar] [CrossRef]
  30. Fu, P.; Kawamura, K.; Chen, J.; Barrie, L.A. Isoprene, monoterpene, and sesquiterpene oxidation products in the High Arctic aerosols during late winter to early summer. Environ. Sci. Technol. 2009, 43, 4022–4028. [Google Scholar] [CrossRef]
  31. Fu, K.; Kawamura, K.; Pavuluri, C.M.; Jing, C.; Swaminathan, T. Contributions of isoprene, α/β-pinene and β-caryophyllene to secondary organic aerosol in tropical India. Low Temp. Sci. 2010, 68, 79–88. [Google Scholar]
  32. Fu, K.; Kawamura, K. Diurnal variations of polar organic tracers in summer forest aerosols: A case study of a Quercus and Picea mixed forest in Hokkaido, Japan. Geochem. J. 2011, 45, 297–308. [Google Scholar] [CrossRef]
  33. Yasmeen, F.; Szmigielski, R.; Vermeylen, R.; Gomez-Gonzalez, Y.; Surratt, J.D.; Chan, A.W.H.; Seinfeld, J.H.; Maenhaut, W.; Claeys, M. Mass spectrometric characterization of isomeric terpenoic acids from the oxidation of α-pinene, β-pinene, d-limonene and Δ3-carene in fine forest aerosol. J. Mass. Spectrom. 2011, 46, 425–442. [Google Scholar] [CrossRef]
  34. Li, L.; Dai, D.; Deng, S.; Feng, J.; Zhao, M.; Wu, J.; Liu, L.; Yang, X.; Wu, S.; Qi, H.; et al. Concentration, distribution and variation of polar organic aerosol tracers in Ya’an, a middle-sized city in western China. Atmos. Res. 2013, 120, 29–42. [Google Scholar] [CrossRef]
  35. Kołodziejczyk, A.; Pyrcz, P.; Pobudkowska, A.; Błaziak, K.; Szmigielski, R. Physicochemical properties of pinic, pinonic, norpinic, and norpinonic acids as relevant α-pinene oxidation products. J. Phys. Chem. B 2019, 123, 8261–8267. [Google Scholar] [CrossRef]
  36. Yasmeen, F.; Vermeylen, R.; Maurin, N.; Perraudin, E.; Doussin, J.F.; Claeys, M. Characterisation of tracers for aging of α-pinene secondary organic aerosol using liquid chromatography/negative ion electrospray ionisation mass spectrometry. Environ. Chem. 2012, 9, 236–246. [Google Scholar] [CrossRef]
  37. Kenseth, C.M.; Huang, Y.; Zhao, R.; Dalleska, N.F.; Hethcoxa, J.C.; Stoltz, B.M.; Seinfeld, J.H. Synergistic O3 + OH oxidation pathway to extremely low-volatility dimers revealed in β-pinene secondary organic aerosol. PNAS 2018, 115, 8301–8306. [Google Scholar] [CrossRef] [PubMed]
  38. Jenkin, M.E.; Saunders, S.M.; Pilling, M.J. The tropospheric degradation of volatile organic compounds: A protocol for mechanism development. Atmos. Environ. 1997, 31, 81–104. [Google Scholar] [CrossRef]
  39. Saunders, S.M.; Jenkin, M.E.; Derwent, R.G.; Pilling, M.J. Protocol for the development of the Master Chemical Mechanism, MCM v3 (Part A): Tropospheric degradation of non-aromatic volatile organic compounds. Atmos. Chem. Phys. 2003, 3, 161–180. [Google Scholar] [CrossRef]
  40. Kostenidou, E.; Karnezi, E.; Kołodziejczyk, A.; Szmigielski, R.; Pandis, S.N. Physical and chemical properties of 3-methyl-1,2,3-butanetricarboxylic acid (MBTCA) aerosol. Environ. Sci. Technol. 2018, 52, 1150–1155. [Google Scholar] [CrossRef]
  41. Barmet, P.; Dommen, J.; DeCarlo, P.F.; Tritscher, T.; Praplan, A.P.; Platt, S.M.; Prevot, A.S.H.; Donahue, N.M.; Baltensperger, U. OH clock determination by proton transfer reaction mass spectrometry at an environmental chamber. Atmos. Meas. Tech. 2012, 5, 647–656. [Google Scholar] [CrossRef]
  42. DeCarlo, P.F.; Kimmel, J.R.; Trimborn, A.; Northway, M.J.; Jayne, J.T.; Aiken, A.C.; Gonin, M.; Fuhrer, K.; Horvath, T.; Docherty, K.; et al. Field-deployable, high-resolution, time-of-flight aerosol mass spectrometer. Anal. Chem. 2006, 78, 8281–8289. [Google Scholar] [CrossRef] [PubMed]
  43. An, W.J.; Pathak, R.K.; Lee, B.H.; Pandis, S.N. Aerosol volatility measurement using an improved thermodenuder: Application to secondary organic aerosol. J. Aerosol Sci. 2007, 38, 305–314. [Google Scholar] [CrossRef]
  44. Louvaris, E.E.; Karnezi, E.; Kostenidou, E.; Kaltsonoudis, C.; Pandis, S.N. Estimation of the volatility distribution of organic aerosol combining thermodenuder and isothermal dilution measurements. Atmos. Meas. Tech. 2017, 10, 3909–3918. [Google Scholar] [CrossRef]
  45. Riipinen, I.; Pierce, J.R.; Donahue, N.M.; Pandis, S.N. Equilibration time scales of organic aerosol inside thermodenuders: Evaporation kinetics versus thermodynamics. Atmos. Environ. 2010, 44, 597–607. [Google Scholar] [CrossRef]
  46. Wang, N.; Jorga, S.D.; Pierce, J.R.; Donahue, N.M.; Pandis, S.N. Particle wall-loss correction methods in smog chamber experiments. Atmos. Meas. Tech. 2018, 11, 6577–6588. [Google Scholar] [CrossRef]
  47. Canagaratna, M.R.; Jimenez, J.L.; Kroll, J.H.; Chen, Q.; Kessler, S.H.; Massoli, P.; Hildebrandt Ruiz, L.; Fortner, E.; Williams, L.R.; Wilson, K.R.; et al. Elemental ratio measurements of organic compounds using aerosol mass spectrometry: Characterization, improved calibration, and implications. Atmos. Chem. Phys. 2015, 15, 253–272. [Google Scholar] [CrossRef]
  48. Aiken, A.C.; Decarlo, P.F.; Kroll, J.H.; Worsnop, D.R.; Huffman, J.A.; Docherty, K.S.; Ulbrich, I.M.; Mohr, C.; Kimmel, J.R.; Sueper, D.; et al. O/C and OM/OC ratios of primary, secondary, and ambient organic aerosols with High Resolution Time-of-Flight Aerosol Mass Spectrometry. Environ. Sci. Technol. 2008, 42, 4478–4485. [Google Scholar] [CrossRef]
  49. Kostenidou, E.; Pathak, R.K.; Pandis, S.N. An algorithm for the calculation of secondary organic aerosol density combining AMS and SMPS data. Aerosol Sci. Technol. 2007, 41, 1002–1010. [Google Scholar] [CrossRef]
  50. Paatero, P.; Tapper, U. Positive matrix factorization – a nonnegative factor model with optimal utilization of error-estimates of data values. Environmetrics 1994, 5, 111–126. [Google Scholar] [CrossRef]
  51. Lanz, V.A.; Alfarra, M.R.; Baltensperger, U.; Buchmann, B.; Hueglin, C.; Prévôt, A.S.H. Source apportionment of submicron organic aerosols at an urban site by factor analytical modelling of aerosol mass spectra. Atmos. Chem. Phys. 2007, 7, 1503–1522. [Google Scholar]
  52. Ulbrich, I.M.; Canagaratna, M.R.; Zhang, Q.; Worsnop, D.R.; Jimenez, J.L. Interpretation of organic components from Positive Matrix Factorization of aerosol mass spectrometric data. Atmos. Chem. Phys. 2009, 9, 2891–2918. [Google Scholar] [CrossRef]
  53. Kostenidou, E.; Lee, B.H.; Engelhart, G.J.; Pierce, J.R.; Pandis, S.N. Mass spectra deconvolution of low, medium and high volatility biogenic secondary organic aerosol. Environ. Sci. Technol. 2009, 43, 4884–4889. [Google Scholar] [CrossRef] [PubMed]
  54. Robinson, N.H.; Hamilton, J.F.; Allan, J.D.; Langford, B.; Oram, D.E.; Chen, Q.; Docherty, K.; Farmer, D.K.; Jimenez, J.L.; Ward, M.W.; et al. Evidence for a significant proportion of secondary organic aerosol from isoprene above a maritime tropical forest. Atmos. Chem. Phys. 2011, 11, 1039–1050. [Google Scholar]
  55. Slowik, J.G.; Brook, J.; Chang, R.Y.W.; Evans, G.J.; Hayden, K.; Jeong, C.H.; Li, S.M.; Liggio, J.; Liu, P.S.K.; McGuire, M.; et al. Photochemical processing of organic aerosol at nearby continental sites: Contrast between urban plumes and regional aerosol. Atmos. Chem. Phys. 2011, 11, 2991–3006. [Google Scholar] [CrossRef] [Green Version]
  56. Chen, Q.; Farmer, D.K.; Rizzo, L.V.; Pauliquevis, T.; Kuwata, M.; Karl, T.G.; Guenther, A.; Allan, J.D.; Coe, H.; Andreae, M.O.; et al. Submicron particle mass concentrations and sources in the Amazonian wet season (AMAZE-08). Atmos. Chem. Phys. 2015, 15, 3687–3701. [Google Scholar]
  57. Kostenidou, E.; Florou, K.; Kaltsonoudis, C.; Tsiflikiotou, M.; Vratolis, S.; Eleftheriadis, K.; Pandis, S.N. Sources and chemical characterization of organic aerosol during the summer in the eastern Mediterranean. Atmos. Chem. Phys. 2015, 15, 11355–11371. [Google Scholar] [CrossRef]
  58. Budisulistiorini, S.H.; Canagaratna, M.R.; Croteau, P.L.; Marth, W.J.; Baumann, K.; Edgerton, E.S.; Shaw, S.L.; Knipping, E.M.; Worsnop, D.R.; Jayne, J.T.; et al. Real-time continuous characterization of secondary organic aerosol derived from isoprene epoxydiols in downtown Atlanta, Georgia, using the Aerodyne Aerosol Chemical Speciation Monitor. Environ. Sci. Technol. 2013, 47, 5686–5694. [Google Scholar] [CrossRef]
  59. Xu, L.; Guo, H.; Boyd, C.M.; Klein, M.; Bougiatioti, A.; Cerully, K.M.; Hite, J.R.; Isaacman-VanWertz, G.; Kreisberg, N.M.; Knote, C.; et al. Effects of anthropogenic emissions on aerosol formation from isoprene and monoterpenes in the Southeastern United States. PNAS 2015, 112, 37–42. [Google Scholar] [CrossRef]
  60. Milic, A.; Mallet, M.D.; Cravigan, L.T.; Alroe, J.; Ristovski, Z.D.; Selleck, P.; Lawson, S.J.; Ward, J.; Desservettaz, M.J.; Paton-Walsh, C.; et al. Biomass burning and biogenic aerosols in northern Australia during the SAFIRED campaign. Atmos. Chem. Phys. 2017, 17, 3945–3961. [Google Scholar] [CrossRef]
  61. Lin, Y.H.; Zhang, Z.; Docherty, K.S.; Zhang, H.; Budisulistiorini, S.H.; Rubitschun, C.L.; Shaw, S.L.; Knipping, E.M.; Edgerton, E.S.; Kleindienst, T.E.; et al. Isoprene epoxydiols as precursors to secondary organic aerosol formation: Acid-catalyzed reactive uptake studies with authentic compounds. Environ. Sci. Technol. 2011, 46, 250–258. [Google Scholar] [CrossRef]
  62. Wang, N.; Kostenidou, E.; Donahue, N.M.; Pandis, S.N. Multi-generation chemical aging of α-pinene ozonolysis products by reactions with OH. Atmos. Chem. Phys. 2018, 18, 3589–3601. [Google Scholar] [CrossRef]
  63. Tasoglou, A.; Pandis, S.N. Formation and chemical aging of secondary organic aerosol during the β-caryophyllene oxidation. Atmos. Chem. Phys. 2015, 15, 6035–6046. [Google Scholar] [CrossRef]
  64. Kuwata, M.; Zorn, S.R.; Martin, S.T. Using elemental ratios to predict the density of organic material composed of carbon, hydrogen, and oxygen. Environ. Sci. Technol. 2012, 46, 787–794. [Google Scholar] [CrossRef] [PubMed]
  65. Prinn, R.; Huang, J.; Weiss, R.; Cunnold, D.; Fraser, P.; Simmonds, P.; McCulloch, A.; Harth, C.; Reimann, S.; Salameh, P.; et al. Evidence for variability of atmospheric hydroxyl radicals over the past quarter century. Geophys. Res. Lett. 2005, 32, L07809. [Google Scholar] [CrossRef] [Green Version]
Figure 1. Mass spectrum of pure norpinic acid particles. The most important characteristic m/z ratios were 59, 65, 67, 68, 73, 77, 79, 82, 83, 85, 95, 100, 108, 111 and 126.
Atmosphere 13 01481 g001
Figure 2. Mass fraction remaining (MFR) after the TD based on AMS measurements. All values have been corrected for size temperature dependent particle losses. The error bars correspond to one standard deviation. The modeled MRF has been calculated using the centerline residence time. The shadow area represents the minimum and the maximum MFRs of the solutions within 2% of the best solution.
Atmosphere 13 01481 g002
Figure 3. (a) Particle size-dependent wall-loss corrected time series of organics, sulfate and ammonium for experiment 2 (sulfate and norpinic acid were nebulized from the same aqueous solution). (b) Organics to sulfate ratio. (c) Particle size-dependent wall-loss corrected time series of volume concentration obtained from the SMPS. (d) Time series of O:C; Period (A) corresponds to an ambient exposure of around 5 days. The bars in (a,c) correspond to the uncertainty from the experimental calculation of the wall-loss rates (k) in Figure S4. Two shots of HONO were injected for this experiment.
Atmosphere 13 01481 g003
Figure 4. Comparison of the mass spectra of fresh norpinic acid aerosol (taken while the UV lights were off) and the mass spectrum from the period (A) as indicated in Figure 3.
Atmosphere 13 01481 g004
Figure 5. The mass spectrum of the: (a) fresh and (b) aged norpinic acid aerosol derived from the PMF analysis of the AMS measurements in experiment 2.
Atmosphere 13 01481 g005
Figure 6. Time series of fresh (black line) and aged (red line) norpinic acid mass concentrations extracted by PMF from experiment 2.
Atmosphere 13 01481 g006
Table 1. Experimental parameters. Experiments 1–4 were conducted in the ICE-HT chamber, while experiments 5 and 6 took place in the CMU chamber.
FacilityICE-FORTHCMU
Exp. 1Exp. 2Exp. 3Exp. 4Exp. 5Exp. 6
Initial norpinic acid (μg m−3)73.384.311.633.14741
Initial (NH4)2SO4
(μg m−3)
31.6 a82 bNANA44 b34 b
AMS Collection Efficiency0.38 ± 0.050.4 ± 0.030.4 ± 0.030.24 ± 0.030.6 ± 0.070.75 ± 0.12
Density (g cm−3)1.29 ± 0.021.32 ± 0.031.3 ± 0.021.29 ± 0.02ΝAΝA
Butanol-d9 (ppb)082182 17NA
Equivalent OH exposure (days) c05200.6NA
T (°C)20.7 ± 0.529.1 ± 0.722.8 ± 3.723.6 ± 1.327.3 ± 1.828.1 ± 1.4
RH (%)11 ± 0.39.6 ± 0.712.8 ± 3.516.5 ± 5.35 ± 0.86 ± 0.9
a Ammonium sulfate and norpinic acid were introduced by different solutions. b Ammonium sulfate and norpinic acid were introduced by the same solution. c Assuming a daily average OH concentration of 1 × 10⁶ molecule cm−3 [1].
Table 2. Comparison between the pure norpinic acid mass spectrum and reference mass spectra of ambient biogenic sources as well as mass spectra of biogenic SOA formed in environmental chambers.
Angle Theta in Degrees (R2)Reference
Factor 8248.6 (0.35)Robinson et al. [54]
IEPOX OA73.5 (0.01)Budisulistiorini et al. [58]
Isoprene-OA31.9 (0.69)Xu et al. [59]
Biogenic OA26.3 (0.78)Kostenidou et al. [57]
MBTCA24.3 (0.82)Kostenidou et al. [40]
α-pinene + O3 SOA27.7 (0.76)Wang et al. [62]
β-carryophylene + O3 SOA33.8 (0.65)Tasoglou et al. [63]
Publisher’s Note: MDPI stays neutral with regard to jurisdictional claims in published maps and institutional affiliations.

