Article

Mass Absorption Efficiency of PM1 in Mexico City during ACU15

1
Posgrado en Ciencias de la Tierra, Universidad Nacional Autónoma de México, Mexico City 04510, Mexico
2
Instituto de Ciencias de la Atmósfera y Cambio Climático, Universidad Nacional Autónoma de México, Mexico City 04510, Mexico
3
Facultad de Ciencias, Universidad Nacional Autónoma de México, Mexico City 04510, Mexico
4
Unidad Multidisciplinaria de Docencia e Investigación Juriquilla Facultad de Ciencias, Universidad Nacional Autónoma de México, Queretaro 76230, Mexico
*
Author to whom correspondence should be addressed.
Atmosphere 2023, 14(1), 100; https://doi.org/10.3390/atmos14010100
Submission received: 17 October 2022 / Revised: 20 December 2022 / Accepted: 27 December 2022 / Published: 3 January 2023
(This article belongs to the Special Issue Atmospheric Aerosol Optical Properties)

Abstract

:
From January to March 2015, an atmospheric aerosol measurement campaign, “Aerosoles en Ciudad Universitaria 2015” (ACU15), was carried out in Mexico City to determine the particles’ optical properties and chemical composition. Two photoacoustic spectrometers measured the scattering and absorption coefficient at two different wavelengths. The average absorption coefficient at 532 nm was 12.71 ± 9.48 Mm−1 and at 870 nm was 10.35 ± 7.36 Mm−1. The average scattering coefficient was 65.63 ± 47.12 Mm−1 (532 nm) and 21.12 ± 14.24 Mm−1 (870 nm). The chemical composition was determined via an aerosol chemical speciation monitor. The organic aerosol fraction represented 53% of the total PM1 and was made up of 63% low volatile (4.64 µg m−3), 22% hydrogenated (1.90 µg m−3), and 15% semi-volatile organics (1.54 µg m−3). The correlation coefficient of chemical species (NO3, NH4+, SO42−, low-volatile, and semi-volatile organics) and optical properties was 0.92. The multilinear regression showed a good agreement among chemical species and optical properties (r > 0.7). The mass absorption coefficient calculated for the measuring site at 870 nm was MAE870 = 5.8 m2 g−1, instead of the default 4.74 m2 g−1. Furthermore, based on the median AAE, the 532 nm MAE532 resulting from the multiple linear regression (MLR) showed the following coefficients: 7.70 m2 g−1 (eBC), 0.22 m2 g−1 (HOA), and 0.16 m2 g−1 (LV–OOA). The coefficients of MLR were: 7.08 m2 g−1 (eBC), 5.83 m2 g−1 (NO3), 5.69 m2 g−1 (low volatile organic aerosol), 2.78 m2 g−1 (SO42−), 2.40 m2 g−1 (hydrocarbon-like organic aerosol), and 1.04 m2 g−1 (semi volatile organic aerosol).

1. Introduction

Particulate matter (PM) affects the Earth’s radiative balance due to its ability to absorb and scatter sunlight, causing changes in the climate, air quality, and the environment. PM acts as a cloud condensation nucleus, modifying visibility and affecting human health [1,2,3,4]. It is known that optical properties and chemical composition are related to the PM concentration, shape, size, hygroscopicity, and the state of the mixture [5,6,7,8,9,10]. In urban areas such as Mexico City (MC), PM with an aerodynamic diameter less than 2.50 µm (PM2.5) contains carbon compounds and large amounts of metals derived from vehicle emissions as well as considerable amounts of oxidized compounds from combustion gases and other products from aging processes in the atmosphere [11,12,13,14,15].
Black carbon (BC) is a common species in urban aerosols; it is a component that absorbs sunlight in the visible region and impacts terrestrial radiative forcing [16,17,18,19]. Another frequent chemical species in urban environments is organic aerosol (OA), a mixture of primary organic compounds (POA) emitted directly by the source and secondary organic compounds (SOA) formed by gas–particle conversion [20,21,22,23]. OA can absorb light in the visible spectral region, and the absorption of certain types of organic carbon (OC), knows as brown carbon (BrC), increases in the near-UV region [24,25]. Although the light absorption of OA is lower than that of BC, it could become as significant as BC or even exceed it at lower wavelengths if its concentration is high enough [26]. OA and secondary inorganic aerosol (SIA) (i.e., sulfates, ammonium, nitrates) are significant contributors to light scattering [7,27,28].
The atmosphere of MC has been widely studied and, like many urban atmospheres, contains high concentrations of PM with different mixtures of organic and inorganic compounds. The rate of SOA formation is fast, so internal mixing occurs within a few hours after emission [27,29,30,31,32]. Many studies on the optical properties of aerosols in MC focus on light absorption by BC or BrC. However, only a few describe light scattering by organic and inorganic compounds [33,34]. In addition, the instruments that measure the absorption coefficient of absorbing particles result in a mass concentration of an equivalent black carbon “eBC” using a conversion constant known as the mass absorption efficiency (MAE) that often changes and makes it difficult to compare results from one instrument to another.
Certain studies in Mexico City measured the optical properties of PM for short periods and estimated an MAE for BC of 10.80 m2 g−1 at 550 nm. In the scientific campaign MILAGRO, Doran et al. [35] analyzed the evolution of MAE for BC at two sites in MC and reported values ranging from 8 to 9 m2 g−1 for one site and 5 to 18 m2 g−1 for the other (both at 870 nm). Marley et al. [32] measured the optical properties of fine aerosols and reported an MAE for BC ranging from 3.00 to 12.20 m2 g−1 and from 2.70 to 12.30 m2 g−1 at 550 nm. As part of the ACU15 campaign, Pavia [36] found that the data set of MAE for BC had a poor linear response (r2 < 0.30 at both 532 nm and 870 nm) due to the large variability in the EC concentrations.
Instead of associating the optical contribution with one species, this study aimed to find the contribution of the chemical species in PM1 (including eBC, the inorganic compounds, and the organic fraction factors) in the extinction of light at 532 nm to determine which chemical species govern the optical properties of the particle in a sampling site considered an aerosol receptor in the southern quadrant of Mexico City [17,18,37,38,39,40,41].

2. Materials and Methods

We carried out the measurement campaign from January 19 to March 20, 2015, at the Institute of Atmosphere and Climate Change Sciences (ICACC) of the National Autonomous University of Mexico (UNAM). The measurement site is in the southern quadrant of Mexico City, surrounded by green areas and residential and commercial zones. Around 300 m southeast of the building, there is a subway station. The sampling point was on the roof of the building, 15 m above the ground, to avoid the collection of resuspended material, and 2 m above the treetops. The study was part of the Aerosols at UNAM, 2015 (ACU15) campaign and the Air Quality Study Project in Central Mexico. The optical instruments were connected to a TSI flow splitter which was connected to a 2.50 µm URG cyclone and the ACSM had its own 2.50 µm URG cyclone. There was no control of or reduction in humidity, so the air samples entered the instruments directly from the atmosphere. An Air Pointer (Mlu-Recordum Environmental Monitoring Solutions, Wiener Neudorf, Austria) recorded the meteorological data (wind speed, wind direction, temperature, pressure, and relative humidity) with a resolution of 5 min.
All measured data were averaged in 30-min intervals and reported in local time, corresponding to Coordinated Universal Time (UTC) minus 6 h. Before any data analysis, the database was cleaned of negative values, incoherent readings, and gaps in the time sequence.

2.1. Aerosol Chemical Speciation

We measured the chemical characterization of species in non-refractory submicron particulate matter (NR-PM1, i.e., organic matter, sulfate, nitrate, and ammonium) using an Aerodyne Aerosol Chemical Speciation Monitor (ACSM, Aerodyne Research Inc., Billerica, MA, USA). NR-PM1 was calculated as the total sum of NO3, NH4+, SO42−, and organics. The input system used by the ACSM is optimized for maximum particle transmission in the vacuum aerodynamic diameter (Dva) range, from 40 to 1000 nm, with 50% transmission at 75 and 650 nm [42,43]. It analyses particle air samples every 30 min. A positive matrix factorization (PMF) was applied to determine the nature of the organic aerosol fraction (OA) in Salcedo et al. [44] Hydrocarbon-like organic aerosols (HOA), semi-volatile oxygenated organic aerosol (SV–OOA), and low-volatility oxygenated organic aerosol (LV–OOA) are the three main contributors to OA. All details on the operation of the ACSM and the PMF model for OA were described in Salcedo et al. [44] (Section 2.2 and Section 3.4).
Species and factors were correlated with optical properties to determine the apportionment of each species in the extinction coefficient. SV–OOA and LV–OOA correspond to the fraction of oxygenated organic aerosol (OOA). SV–OOA is associated with fresh secondary organic aerosols (SOA), and LV–OOA (more oxidized) is related to aged aerosols. Therefore, OOA is a surrogate for SOA and is easily formed in urban environments such as Mexico City [20,21]. HOA is related to organic emissions from vehicular traffic and other primary urban sources [21,45,46]. The diurnal trend of HOA coincides with eBC and other gases associated with the combustion of fossil fuels, such as CO and NO [44,47].
We applied multiple linear regression (MLR) and calculated the coefficient of determination (r2) and the correlation coefficient (r) to assess the fit of the regressions and the correspondence between the data.

2.2. Particle Optical Properties

We use two photoacoustic spectrometers (PAS and PAX) to measure aerosols’ absorption and dispersion coefficients. Both instruments used a sample flow rate of 1.00 L min−1 measured with a time resolution of 5 min which was then averaged over 30 min. We connected both spectrometers to a TSI flow splitter and an additional pump to reach the optimal operational flow of the 2.50 µm URG cyclone.
The University of Colorado in Nevada built the PAS with a laser operating at a wavelength of 532 nm and an acoustic resonator to record the sound pressure generated by the light absorption of aerosols [48,49]. Arnott and Lack et al. [49,50] provided a description of PAS. The PAX is a commercial model made by Droplet Measurement Technologies with a laser operating at 870 nm. Both instruments measure the absorption coefficient (babs), the scattering coefficient (bsca), the extinction coefficient (bext), and the single scattering albedo (SSA). We compared the measurements of PAS and PAX to verify the linear response of the instruments (r2 = 0.92). The following equations show the optical parameters of particles [37]:
b ext ,   λ = b abs ,   λ +   b sca , λ  
SSA λ = b sca ,   λ b ext ,   λ
where λ represents the instrument’s wavelength. Both spectrometers have a nephelometer to measure the scattering coefficient (bsca) and a photoacoustic resonator to measure the absorption coefficient (babs). Liñán et al. [51] and other authors [48,52] reported the calibration procedure using incense and kerosene. We assumed the optical properties of PM1 rules in PM2.5 [44].
The absorption Ångström exponent (AAE) is an optical property that describes the wavelength variation in aerosol absorption of light and is often used in aerosol characterization studies. BC used to have an AAE close to one when it is derived from fossil fuels [53]. The scattering Ångström exponent (SAE) is applied to the scattering material in a similar manner to AAE. We used the following equations to calculate AAE and SAE, considering the operational wavelengths of spectrometers [54]:
AAE λ 1 λ 2 = ln b abs ,   λ 1 b abs ,   λ 2 ln   λ 1 λ 2
SAE λ 1 λ 2 = ln b sca ,   λ 1 b sca ,   λ 2 ln   λ 1 λ 2
where λ1 and λ2 are 532 nm and 870 nm, respectively. The mass absorption efficiency (MAE) represents the ratio of the absorption coefficient and the concentration of light-absorbing material. The mass scattering efficiency (MSE) corresponds to the scattering coefficient and the concentration of the scattering material [37,55,56]. We calculated the MAE870 with the following equations:
MAE λ 2 = MAE λ 0 λ 0 λ 2 AAE
The PAX has a default MAE of 4.74 m2 g−1 considering an AAE value of 1 and a reference MAE550 of 7.50 ± 1.20 m2 g−1, and λ0 equals 550 nm based on Bond and Bergstrom [54]. We calculated a new MAE870 using the median of AAE, and with the new MAE870, we calculated the concentration of eBC.

2.3. Multiple Linear Regression

Multiple linear regression (MLR) is a statistical technique that uses independent variables to predict the outcome of a dependent parameter. The observations must be independent, and the residuals must have a normal distribution. We assumed a linear relationship between the chemical variables and the optical parameters.
We determined both the MLR for the scattering coefficient and the absorption coefficient at 532 nm. We initially considered all chemical species and factors determined in PM1: eBC, NO3, NH4+, SO42–, HOA, LV–OOA, and SV–OOA. We subsequently discarded components based on their statistical significance and the results had a physically reasonable interpretation until a satisfactory model was reached. General MLR equations for light absorption and scattering are shown below:
b abs , λ 1   =   β 0 + β 1 eBC +   β 2 HOA + β 3 LV OOA +   β 4 SV OOA + β 5 NO 3 + β 5 SO 4 2 + β 5 NH 4 +
b bsca , λ 1   =   β 0 + β 1 eBC +   β 2 HOA + β 3 LV OOA +   β 4 SV OOA + β 5 NO 3 + β 5 SO 4 2 + β 5 NH 4 +
where β0 represents the intercept and β1…n are the contributions of each component to the mass optical efficiencies. Thus, we estimated the relative contributions of each chemical component to the absorption and scattering coefficient considering the MLR.

3. Results

Figure 1 shows the hourly average meteorological conditions during the ACU15 campaign.
The south of Mexico City is considered a receptor zone [44,57]. Nevertheless, during ACU15, the wind often changed direction without any predominance. The maximum wind speed measured in the campaign was 3.80 m s−1. However, the prevailing wind speed was below 1 m s−1. Between 0:00 and 7:30 (local time), the wind speed was lower than 0.20 m s−1, and from 8:00 to 14:00, it increased to 0.60 m s−1 (Figure 1a). So, measured particles were probably produced locally or transported from sources nearby [58]. After 7:30, the wind changed direction and often blew from S–SW. The average temperature was 15 °C, with a temperature range of 3–22 °C, and the average relative humidity was 68%. Around 15:00, the temperature reached its maximum (22 °C) and the relative humidity decreased to 25% (Figure 1b).

3.1. Aerosol Chemical Speciation

The PM1 fraction represented more than 90% of PM2.5 mass, [44,59] and the OA was 42% of PM1 mass, with an average concentration of 8.10 µg m−3. OA is made up of 57% LV–OOA (4.55 µg m−3), 24% HOA (1.90 µg m−3), and 19% SV–OOA (1.55 µg m−3). So, OOA represented 76% of OA, and the organic compounds signified almost half of the atmospheric aerosol mass [20,29,32,60].
Inorganic ions are common in urban atmospheres and can indicate particle oxidation processes [61]. Sulfates (SO42−) represented 24% (4.53 µg m−3), nitrates (NO3) 12 % (2.78 µg m−3), and ammonium (NH4+) 10% (1.92 µg m−3) of PM1 mass. Chlorides (Cl) were almost insignificant, with 0.30% of the particle mass, and the rest of the ions were in neglectable concentrations, representing half of the total inorganic concentration. Therefore, we did not include Cl and the minor species in further analyses. The average total concentration of species measured in PM1 was 19.03 µg m−3.

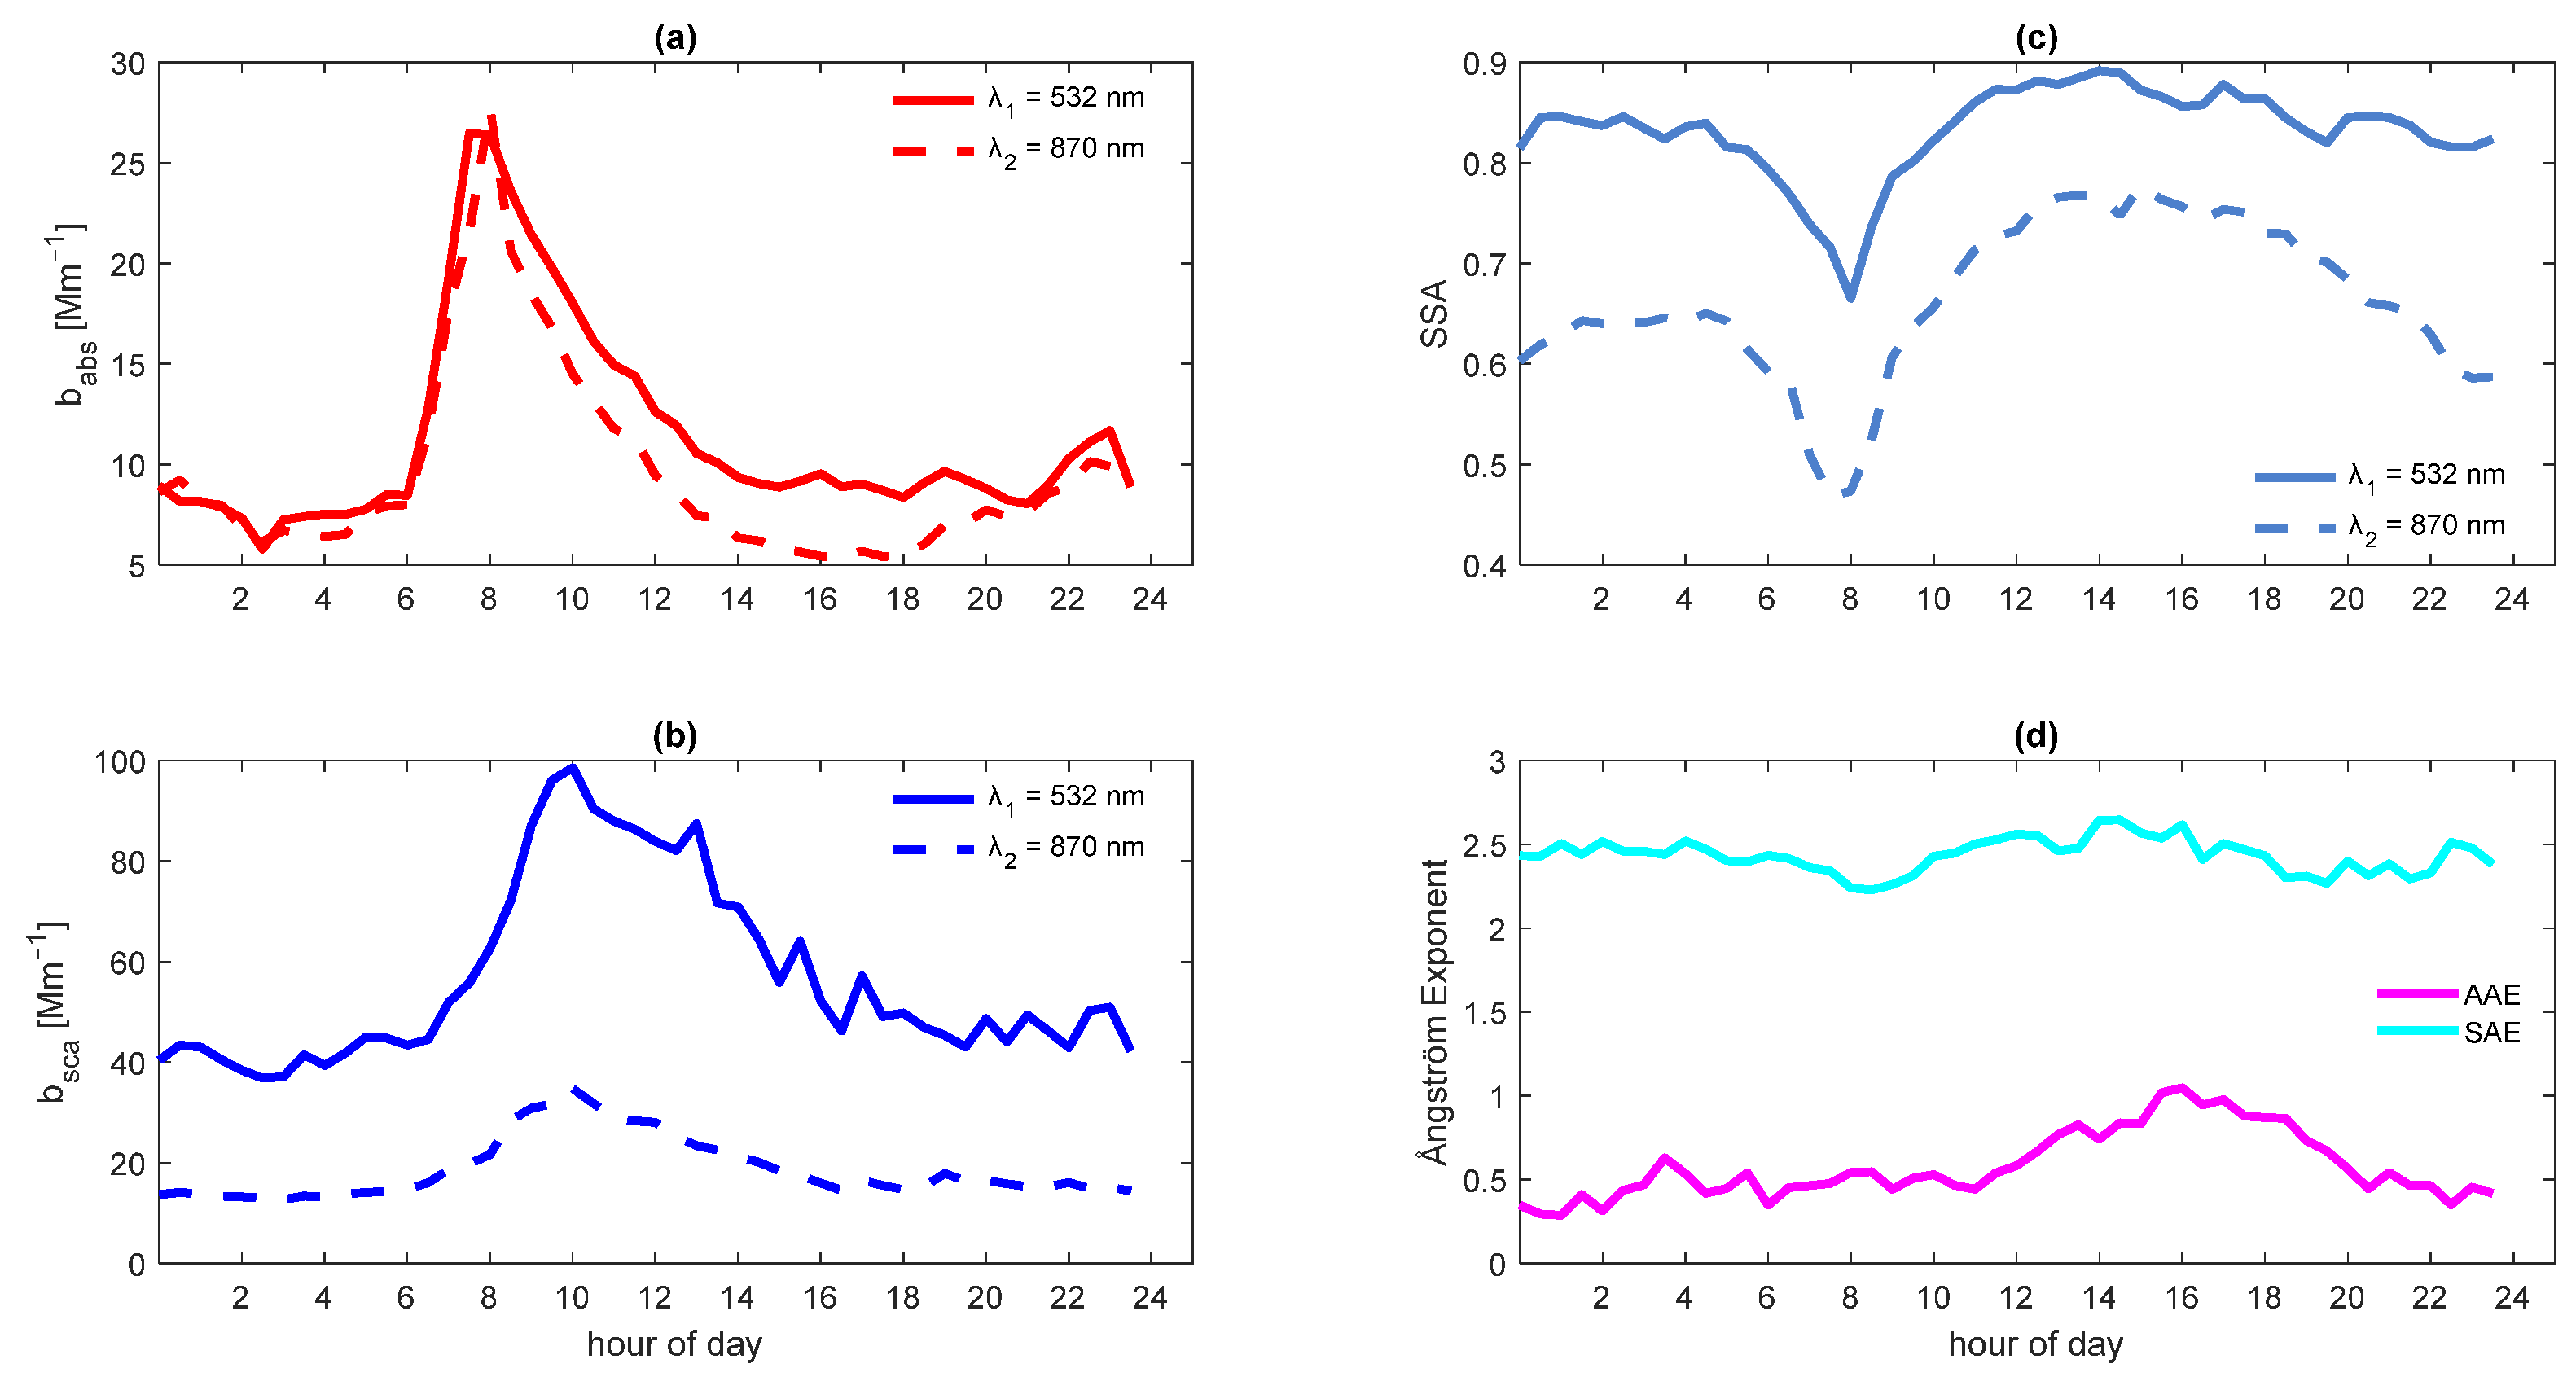
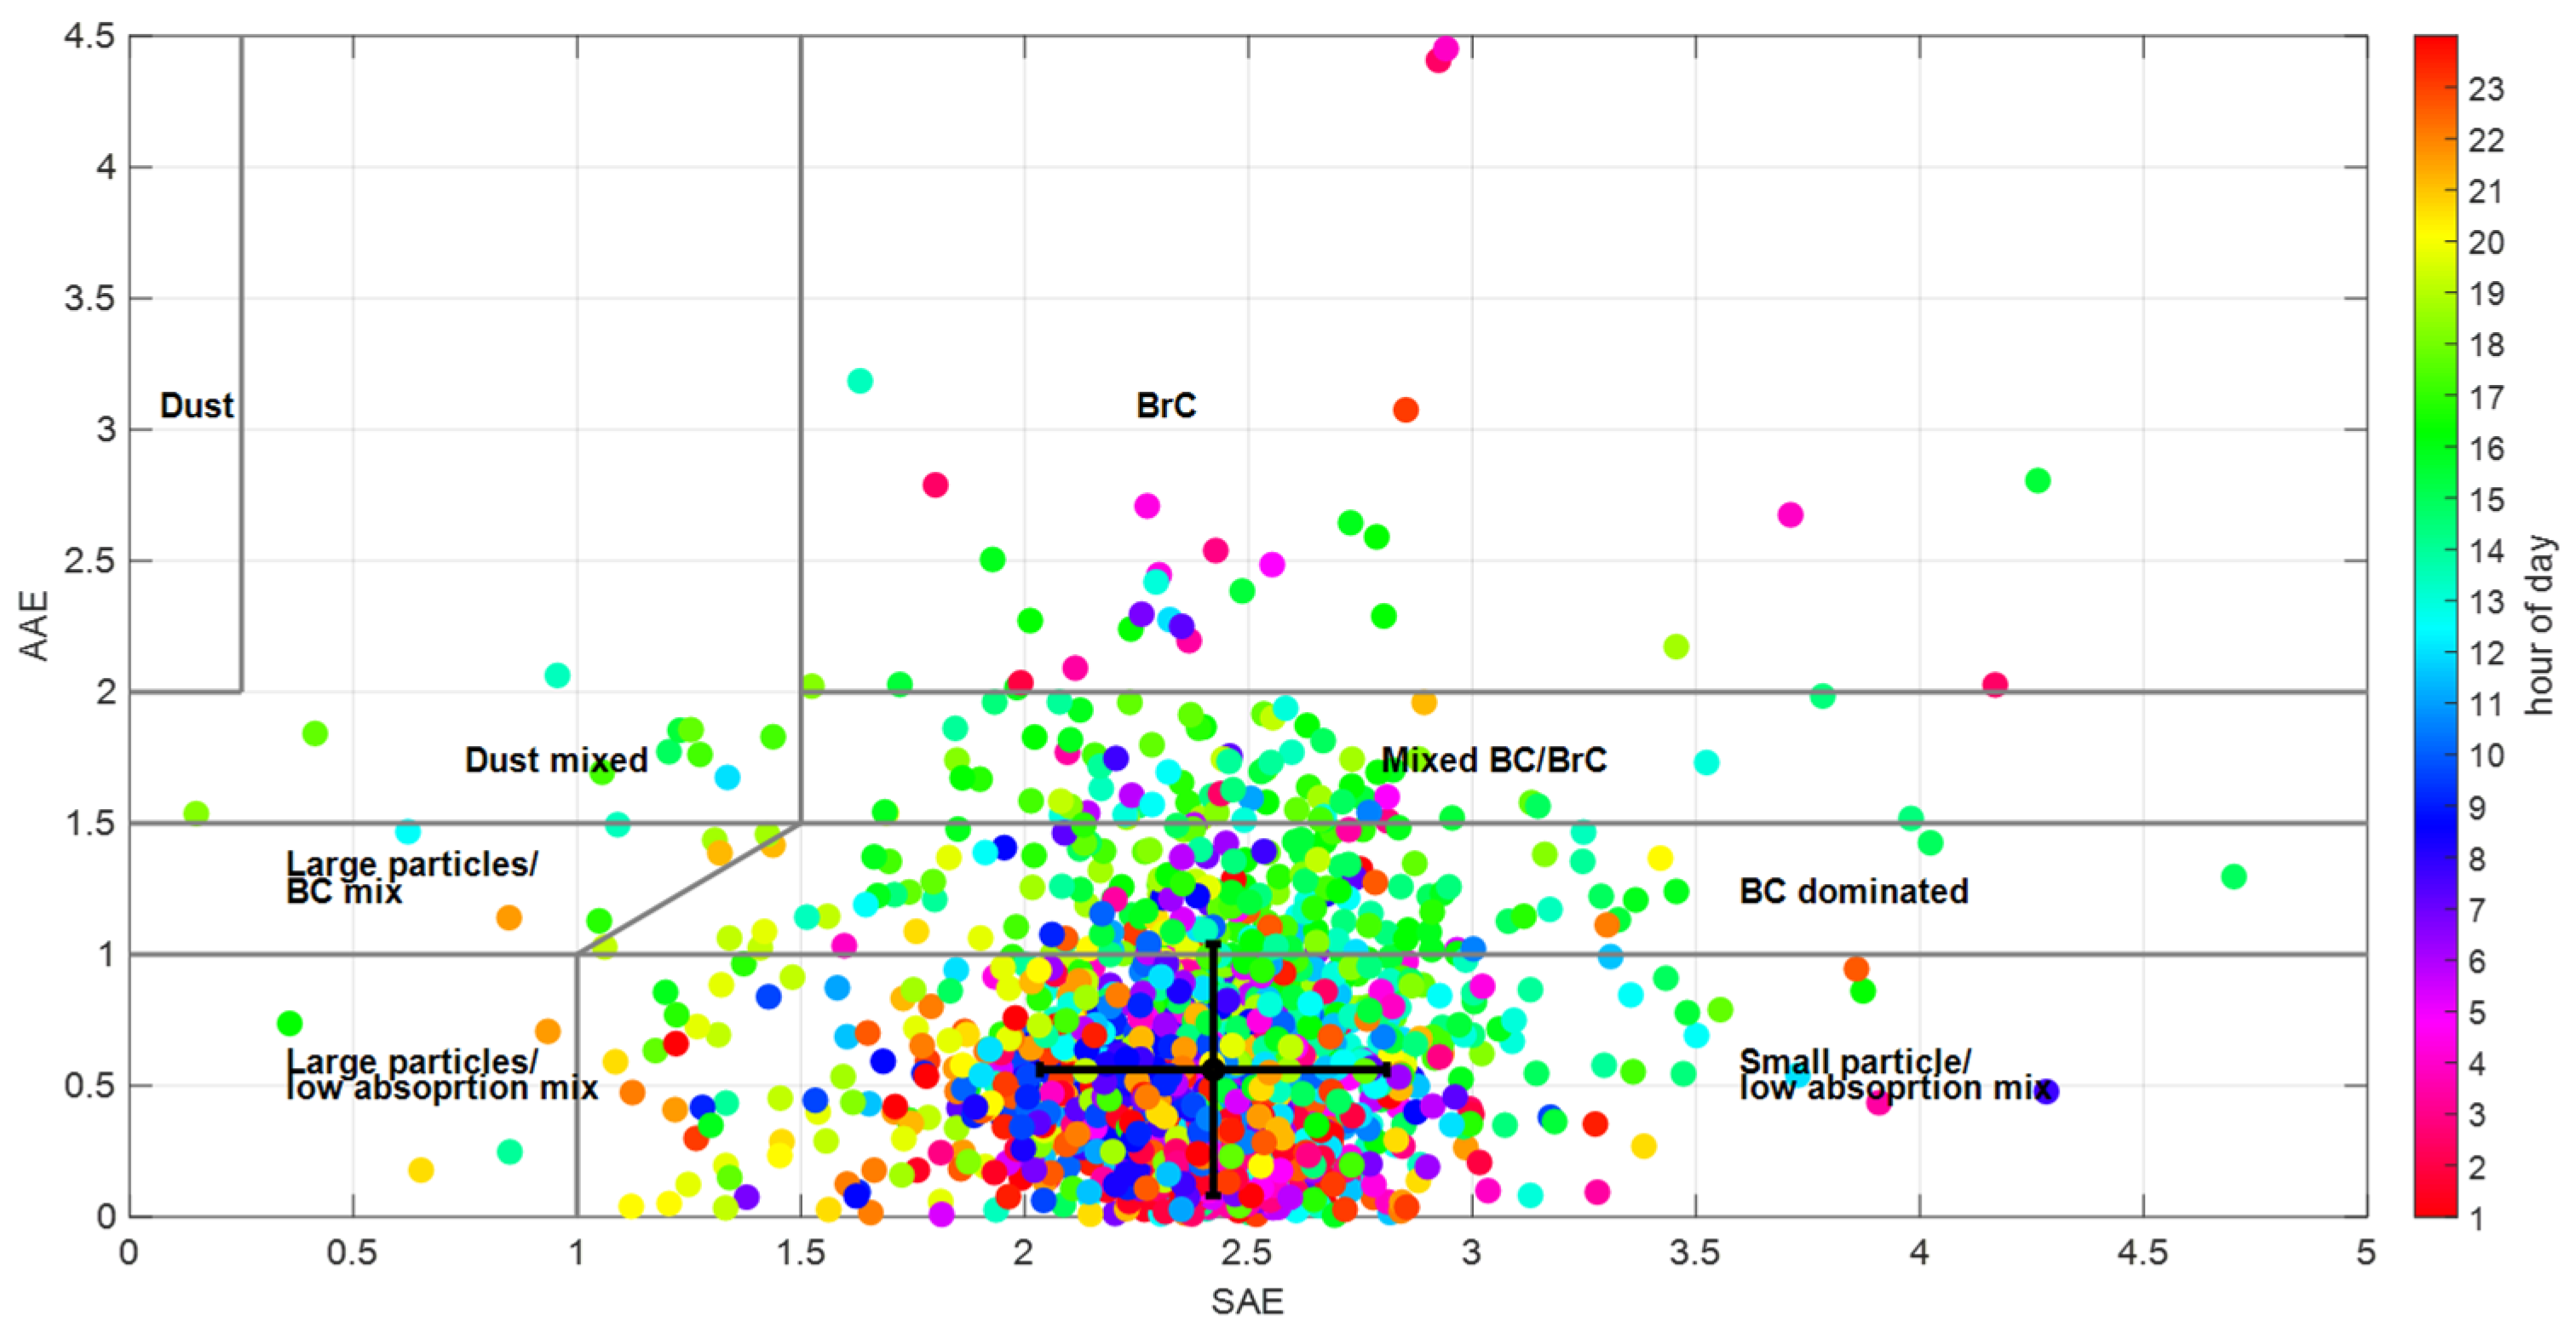
3.2. Particle Optical Properties

Table 1 shows the basic statistics of aerosol optical properties, and Figure 2 displays the diurnal evolution of optical properties.
The average absorption coefficient was 12.71 ± 9.48 Mm−1 at 532 nm and 10.35 ± 7.36 Mm−1 at 870 nm. The diurnal profiles of babs were similar at both wavelengths, reaching the maxima peaks around 8:00 (Figure 2a).
The scattering coefficient (bsca) at 532 nm was higher than that at 870 nm (Figure 2b). The average bsca was 65.63 ± 47.12 Mm−1 at 532 nm and 21.12 ± 14.24 Mm−1 at 870 nm (Table 1). At 532 nm, the bsca reached its maximum value (103 Mm−1) at 11:00, three hours later than the babs its maximum. And at 870 nm, it reached its maximum (21 Mm−1) two hours later than the babs its maximum (at 10:00). The shifting of bsca peaks is attributable to particle evolution since more scattering material sensitive to lower wavelengths is incorporated into particles and the number concentration decreases (i.e., there is a dilution). This competition between dilution and particle size growth ultimately causes the bsca to decline after reaching a lagged babs maximum.
In 1997, Eidels-Dubovoi [62] reported similar trends for babs and bsca in La Merced (Mexico City downtown) and Pedregal (southwest corner of Mexico City) at 530 nm, but with higher values: a maxima babs of 310 Mm−1 and a bsca of 650 Mm−1. Liñán-Abanto et al. [41] mentioned similar diurnal cycles of babs at 870 nm at the same measuring site, with these reaching the maximum peak between 7:00 and 8:00. They reported an average bsca of 31.90 ± 29.80 Mm−1 for a longer period. In 2003 and 2005, Baumgardner et al. [63] found similar behavior in optical properties at 550 nm, with a maximum bsca of 160 Mm−1 and a babs of 56 Mm−1.
The average SSA was 0.82 ± 0.09 at 532 nm and 0.66 ± 0.12 at 870 nm, suggesting the contribution of absorbing particles (Figure 2c) [54]. An SSA close to 1 indicates a predominantly light scattering aerosol, while one close to zero indicates a light absorbing aerosol. Therefore, aerosols with an SSA value > 0.95 will have a cooling effect, while an SSA < 0.85 will result in general warming in the atmosphere due to an increase in light absorption [64]. Liñán et al. [41] reported an SSA of 0.66 (at 870 nm), and Paredes-Miranda et al. [27] mentioned an SSA range of 0.60–0.85 for a site north of Mexico City.
The growth of the boundary layer promotes the dilution of primary emissions, and the coating of particles with SOA increases the scattering of light. At 532 nm, the SSA achieved its minimum at 8:00, and at 870 nm, this occurred around 7:30, when the light absorption almost produced by the emission of fresh dark particles with light absorbing carbon reached its maximum. At that moment, the light attenuation due to scattering showed a slight increase (Figure 2c). Between 13:30–14:00, the maximum SSA occurred, with values of 0.87 at 532 nm and 0.76 at 870 nm. Both maxima occurred when more scattering material was incorporated into particles, covered by different compounds, and other material produced by aging processes decreased light absorption [27]. The hourly average AAE ranged between 0.30–1.04, and the hourly average SAE appears to have been constant throughout the day, with this ranging between 2.22–2.65 (Figure 2d).
The classification matrix of AAE vs. SAE for the identification of aerosol type for the ACU15 campaign data set is shown in Figure 3 [65,66,67,68]. Overall AAE values ranged between 0.12 and 4.50. Values between 0.80–1.10 are characteristic of fossil fuel combustion, while values of 0.90–3.50 are from biomass burning [68,69]. Absorbing organic carbon, dust mineral, particles with BC cores, and non-absorbing coating particles contribute to light absorption, yielding an AAE greater than 1. On the other hand, the overall SAE values ranged between 0.40 and 5.10. SAE has been used as an indicator of the average particle size distribution. In general, greater values in terms of SAE are associated with fine mode and smaller values in terms of SAE with coarse mode [65]. An SAE lower than one signifies coated large particles [67]. The optical properties of aerosols are displayed in color according to the hour of the day. Primary aerosols peaked between 7:00 and 10:00, mainly in the small particle/low absorption mixture region. While the secondary aerosols which prevailed between 14:00 and 16:00 are also found in the BC-dominated and BC/BrC-mixed regions. These two areas appear to dominate in the Ångström matrix. The error bars show the medians of AAE and SAE and their standard deviations. We calculated the median for AAE (0.56) and SAE (2.42) and used that AAE to calculate a new MAE870 of 5.80 m2 g−1 (Table 1).

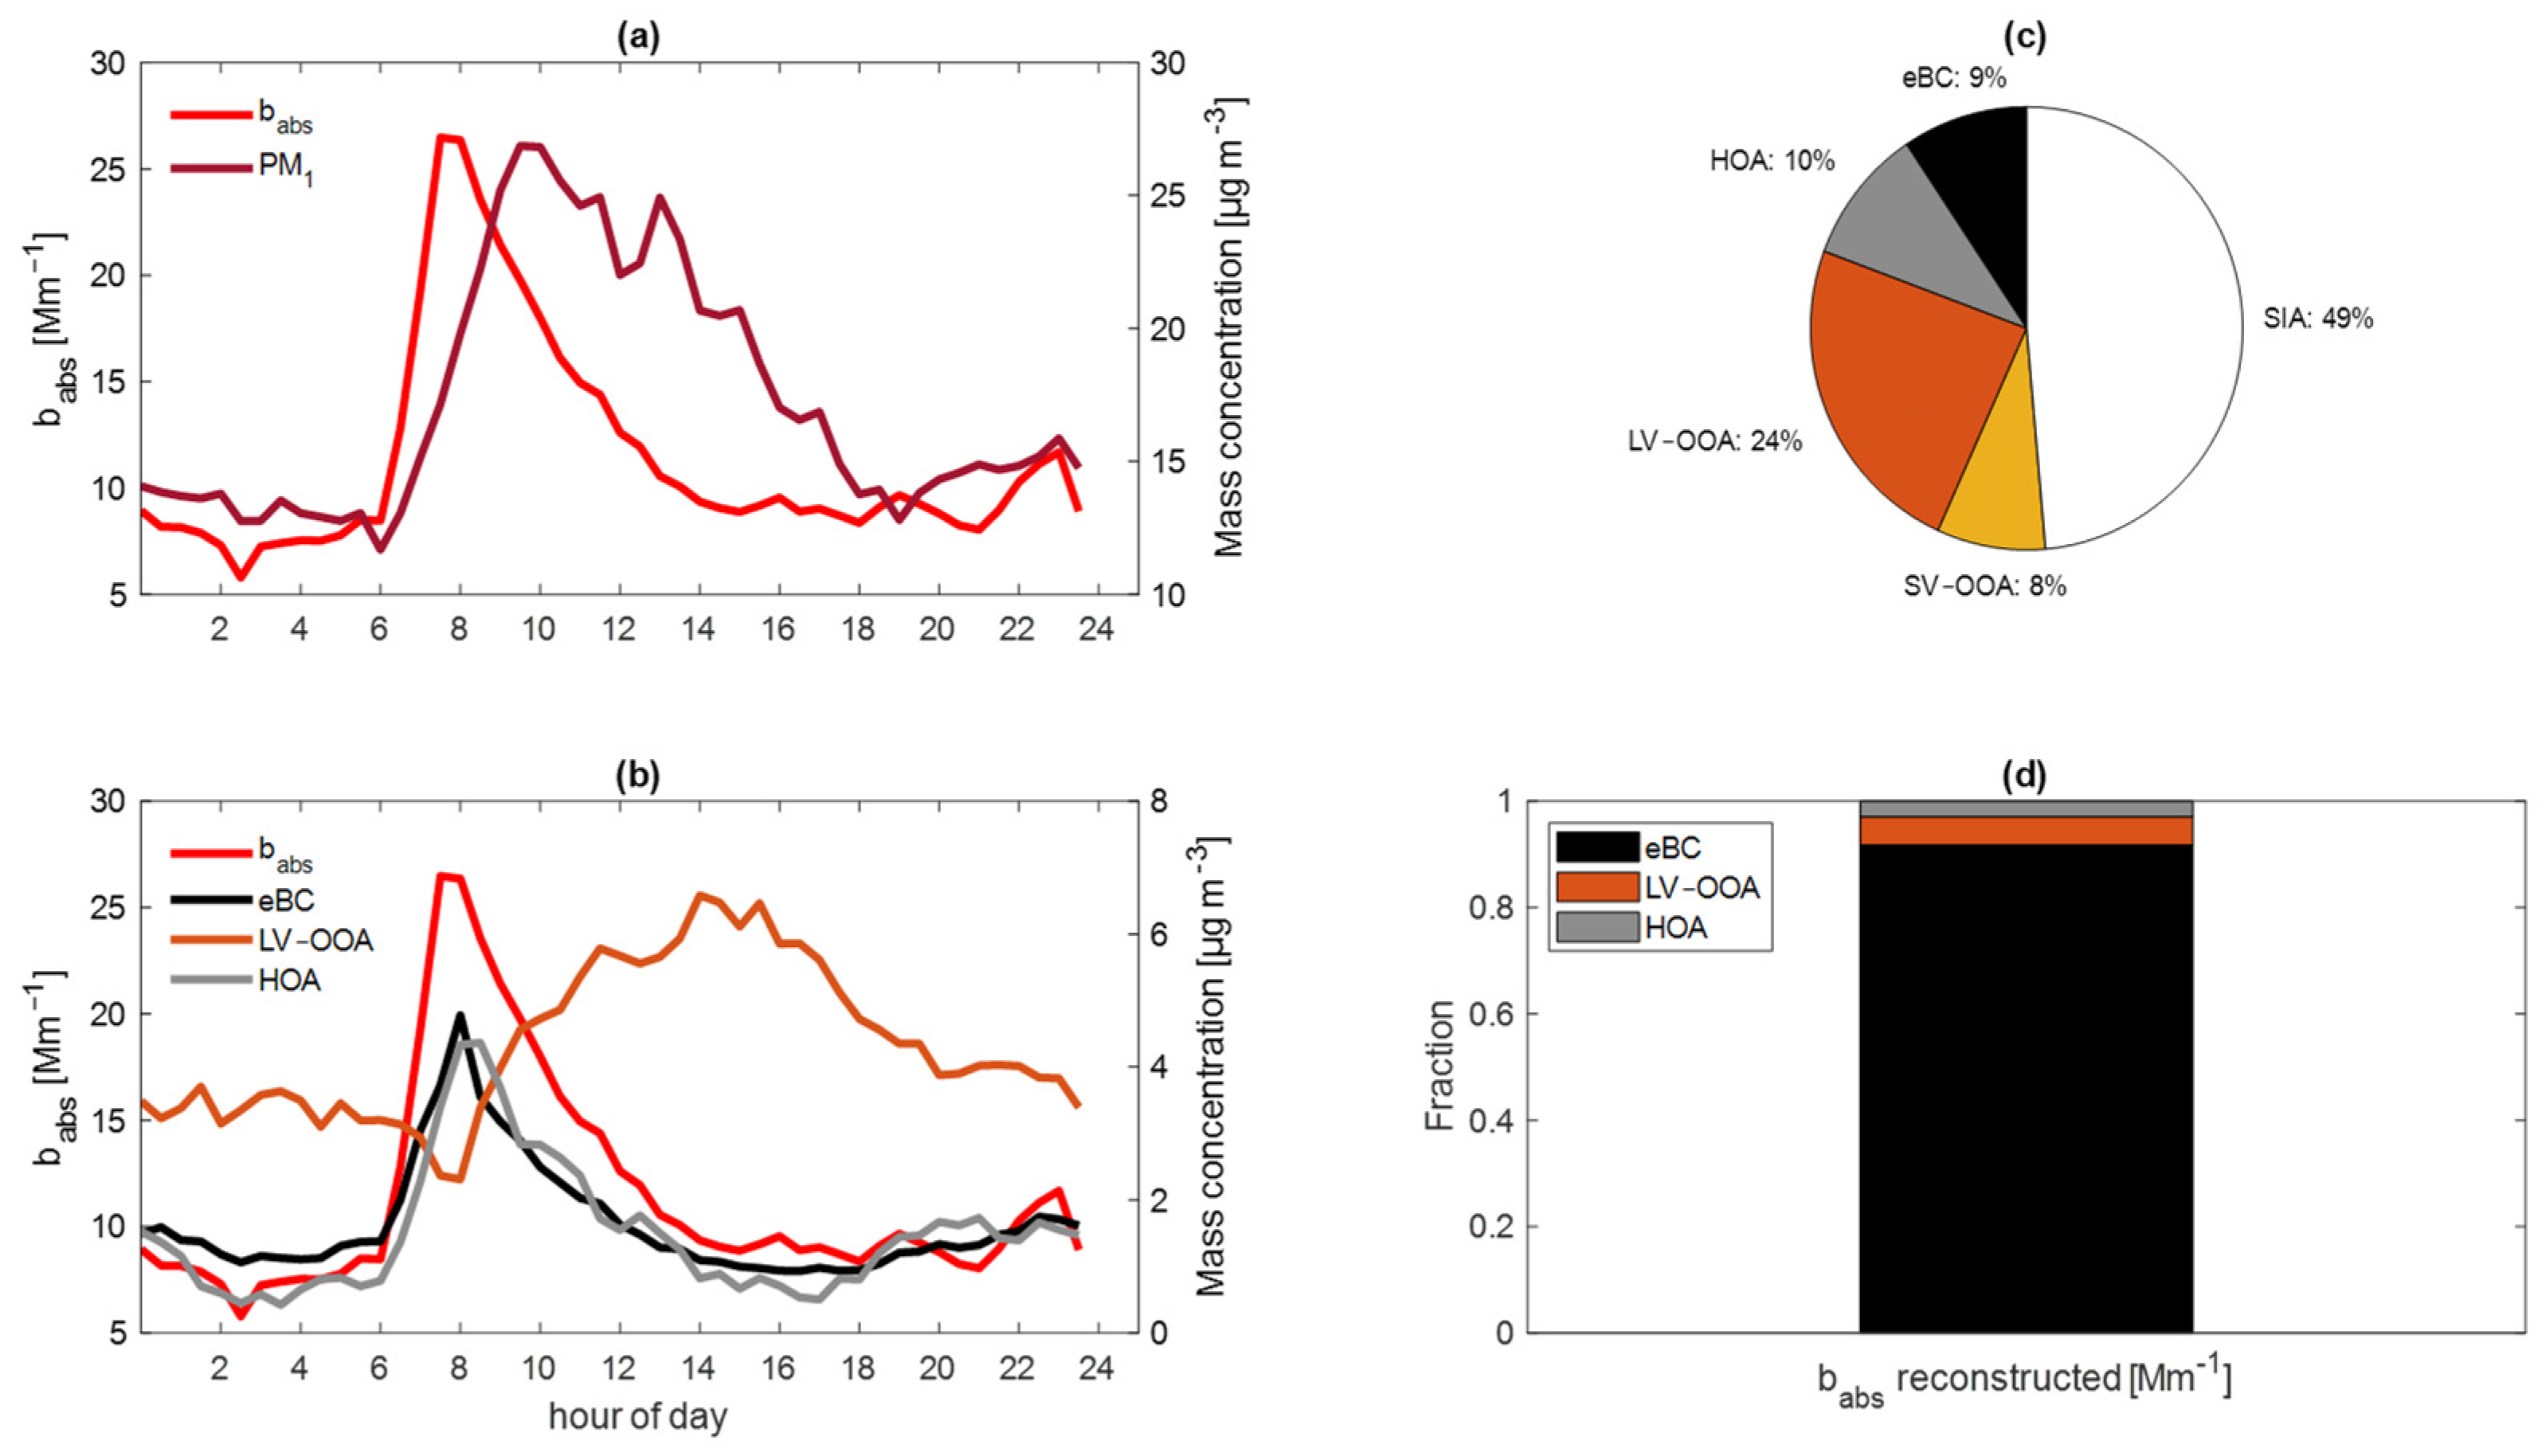
3.3. Mass Absorption Efficiency

Figure 4 shows the average diurnal profiles of babs and PM1 and the species that contribute to the light absorption, the composition of PM1, and the contribution of each species according to the reconstructed babs. At 532 nm, the babs and PM1 values peaked at different hours (Figure 4a) and were poorly correlated (r2 = 0.22). babs had a good correlation with primary organic aerosols: eBC and HOA. However, LV–OOA was different, especially during the maximum light absorption of particles, between 7:00 and 8:00, because LV–OOA is a secondary component (Figure 4b).
The multiple linear regressions considered an external mixing of aerosol particles, and the chemical composition did not provide information about the mixing state; we therefore considered the notion that only the aged aerosol presented a considerable fraction of internally mixed particles and assumes an external mix. Based on the MLR, the most relevant species in the multilinear regression were eBC, HOA, and LV–OOA.
Inorganic species, such as sulfates and nitrates, do not absorb any solar radiation. Therefore, inorganic species and SV–OOA showed unsignificant coefficients statistically (p–Value < 0.05).
The MAE532 for eBC was 7.12 m2 g−1. In contrast, the HOA and LV–OOA factors had lower contributions to the babs, with 0.22 m2 g−1 and 0.16 m2 g−1, respectively (r2 = 0.92). eBC was responsible for 91% of the absorption at 532 nm. However, the MAE of HOA was higher than that of LV–OOA, with the latter contributing more to the light absorption because it is found in greater abundance in PM1 (Figure 4c,d).
BC, HOA, and LV–OOA are good proxies of light absorbing carbon since they accurately describe light absorption [26,70]. Our results are partially consistent with those obtained by Retama et al. [69] for Mexico City during the dry-cold season (December 2018–February 2019). They estimated that HOA and the oxidized compounds of the organic fraction contribute to the total absorption of the light and identified the main contributor to light absorption was an additional biomass burning factor.
Barnard et al. [71] suggested that OA contributes significantly to the light absorption in the visible wavelength region, with 10.50 m2 g−1 at 300 nm. And at a higher wavelength, it decreases and approaches zero. We found HOA and LV–OOA to be the only organic factors contributing to light absorption.
With 1817 data in terms of BC and HOA measured every 30 min, we calculated the multiple linear regressions (MLR). The regression had a determination coefficient of 0.92.

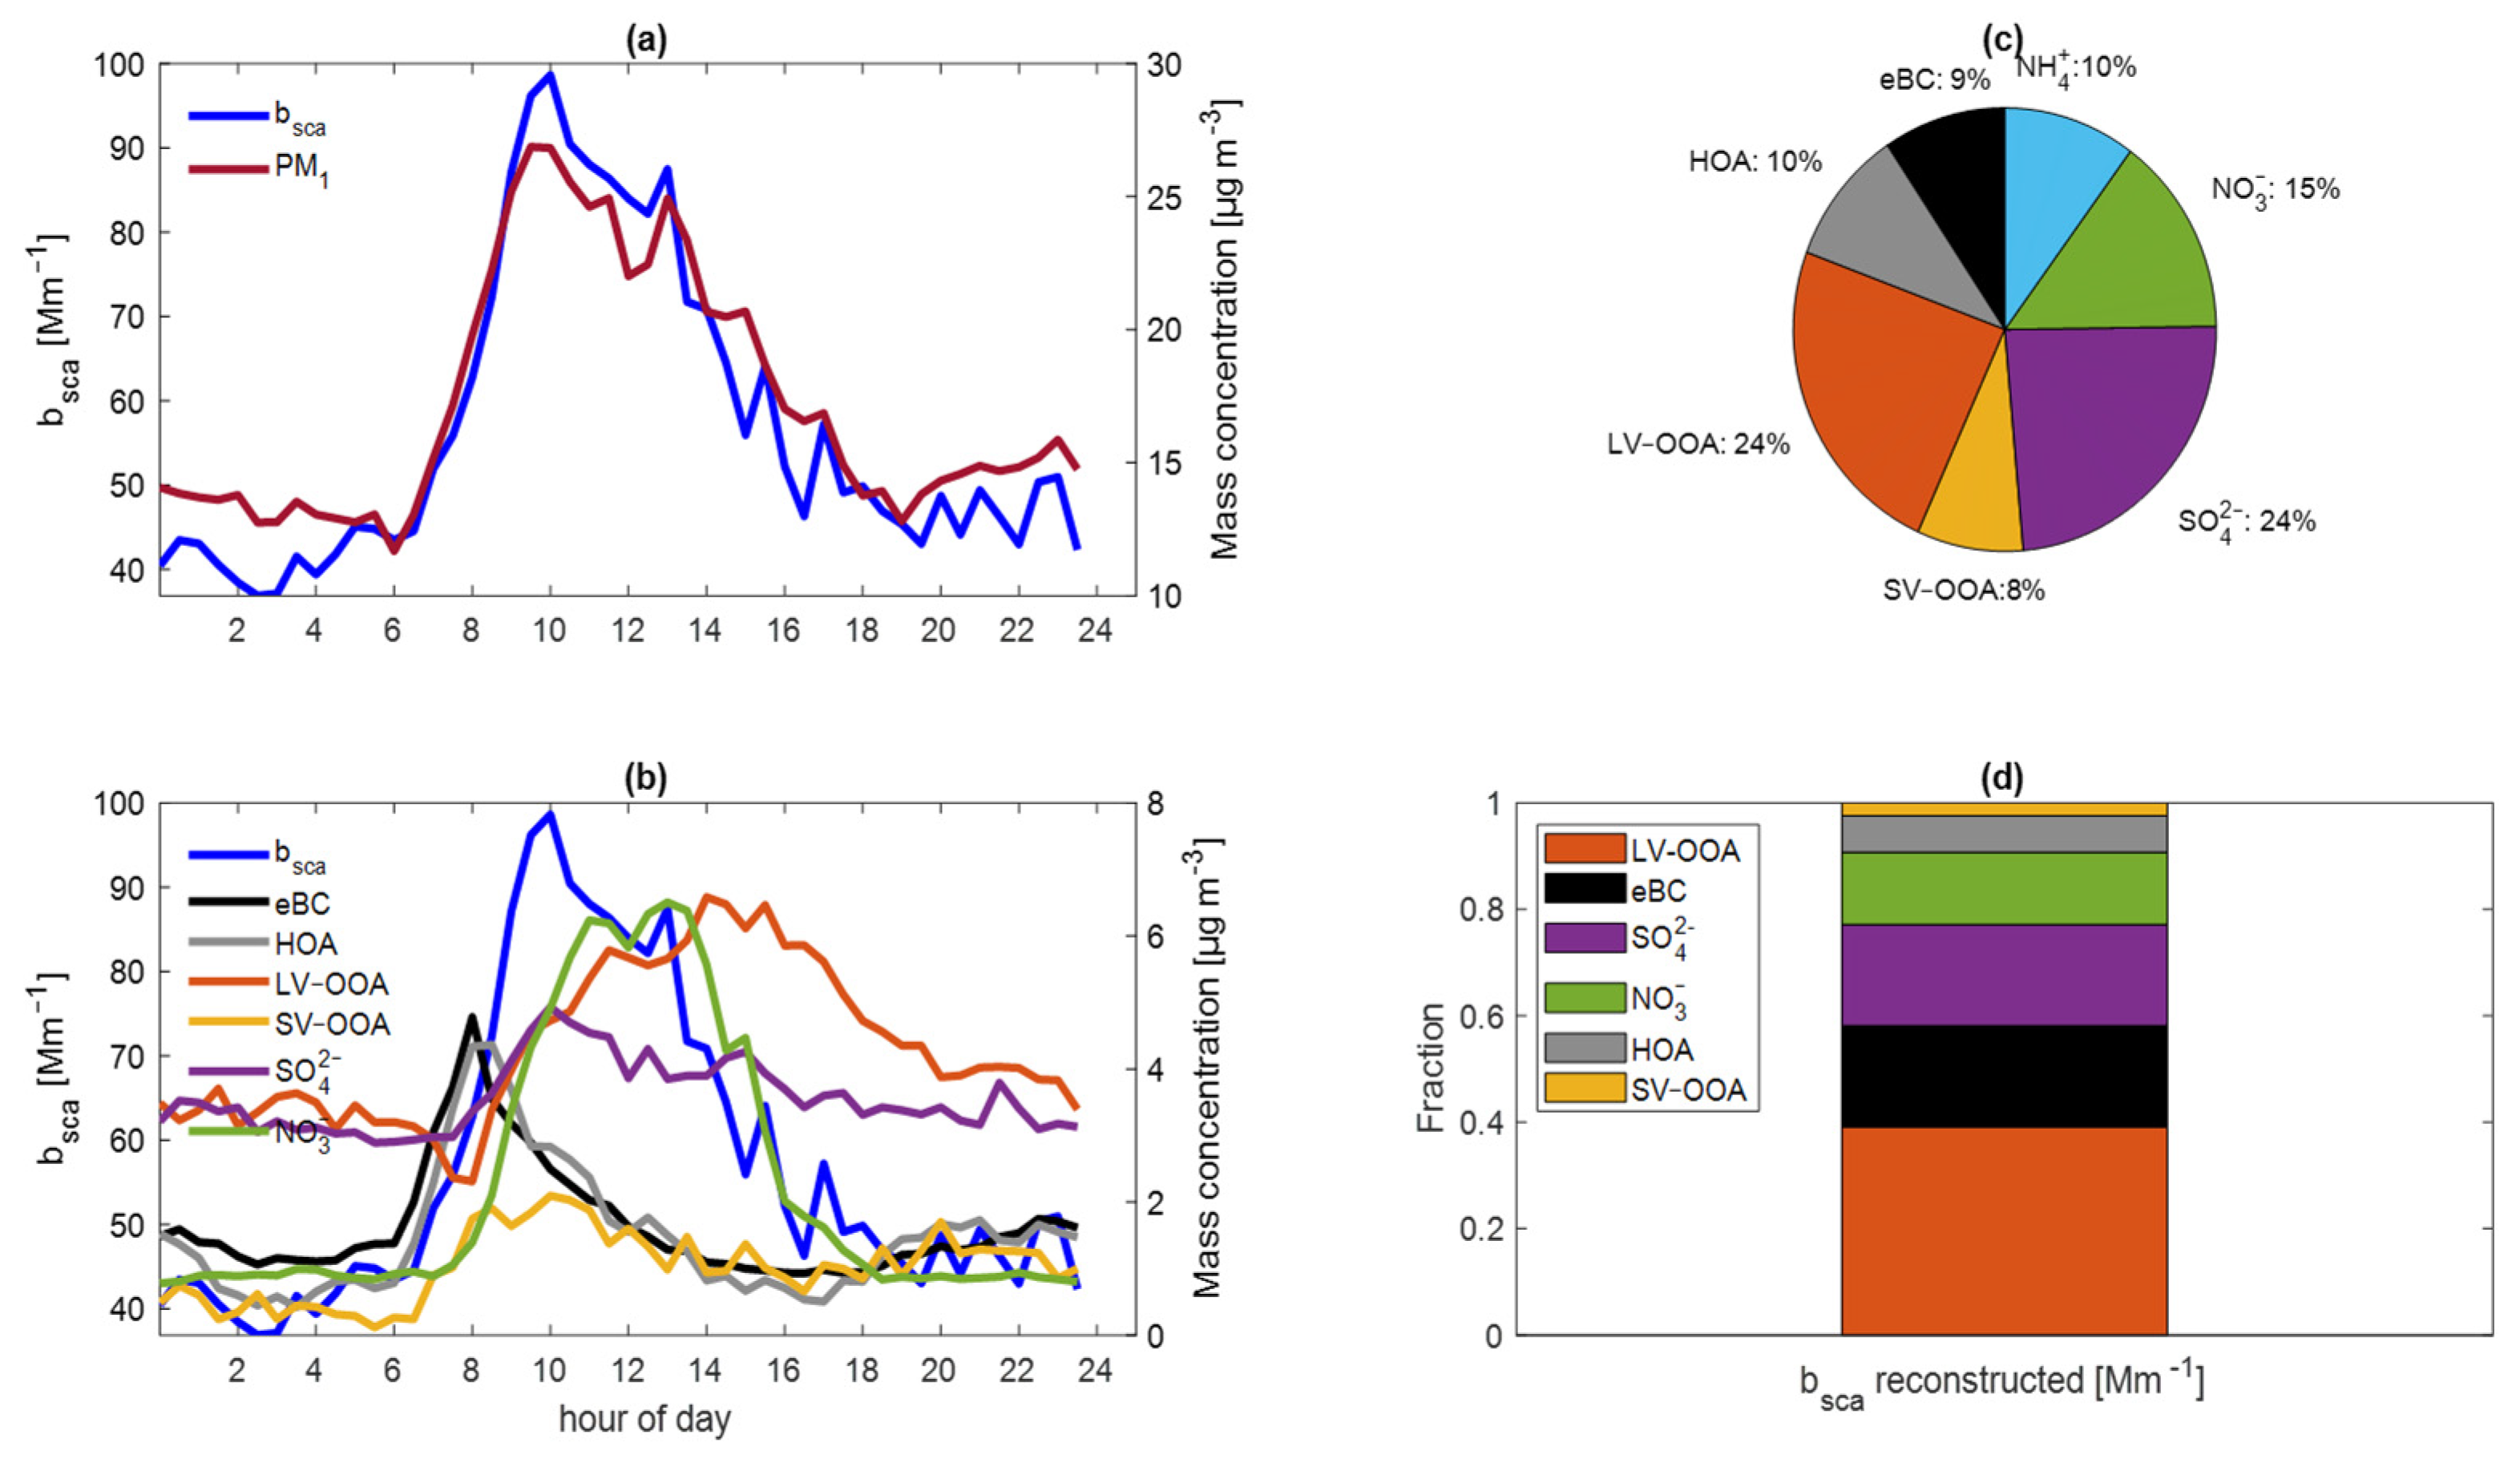
3.4. Mass Scattering Efficiency

Figure 5 shows the diurnal profile of the bsca and PM1, the percentage of species that contribute to light scattering, the composition of PM1, and the involvement of each species according to the reconstructed bsca.
We also calculated the linear regression of bsca as a function of PM1, and the MLR of the bsca as a function of NO3, SO42−, LV–OOA, SV–OOA, and eBC. We used 1819 observations.
The diurnal profiles between the bsca and PM1 were similar and reported a strong correlation, with a determination coefficient of 0.74 (Figure 5a). The MSE532 of PM1 was 3.60 m2 g−1. Paredes-Miranda et al. [27] calculated an MSE532 of 3.80 m2 g−1 for PM1 at 532 nm in March 2006 in an urban area northeast of Mexico City.
The average diurnal trend of secondary components in PM1 (inorganic ions and oxygenated components of the organic fraction) was different from the primary components (HOA, eBC). Nitrates and ammonium have similar behavior, suggesting that they are produced by close photochemical processes. In contrast, SV–OOA and LV–OOA reach their maxima at different times due to the time taken for oxidation (Figure 5b).
The MLR considered all the species in PM1. There was not enough ammonium to neutralize the inorganic anions [19,34], so it had a negative MSE532 and a p–Value > 0.05. eBC had the highest MSE532, 7.08 m2 g−1. The MSE532 of LV–OOA, HOA, and SV–OOA were 5.69 m2 g−1, 2.40 m2 g−1, and 1.04 m2 g−1, respectively. Light absorbing carbon particles scatter light depending on their size. Additionally, studies have found that secondary organic aerosols scatter more light than primary organic aerosols [68,72].
Table 2 summarizes the statistical data of multiple linear regressions for MAE532 and MSE532. The MSE532 of NO3 and SO42− were 5.83 and 2.80 m2 g−1, respectively. Although the MSE532 of NO3 is higher than that of SO42−, the contribution of SO42− to light scattering is higher because of its relative abundance (Figure 5c,d). Gelencsér et al. [37] determined an MSE for SO42− of 5 m2 g−1. The 3.0 m2 g−1 value is common for sulfates in PM2.5 [73].

4. Discussion

The diurnal trend of the optical properties (bsca, babs, and SSA) appears to have been similar since 1997. However, the maximum values in terms of babs and bsca have decreased since 1997. bsca had a diminution of 47% and babs 76%. The SSA has also lessened, suggesting that particles’ absorption capacity has augmented.
The HOA percentage is lower than that of Retama et al. [69] for the north of MC, but the percentages of secondary species such as sulfates and LV–OOA are higher. Therefore, it can be assumed that the aerosols in this part of MC [44] are aged aerosols.
Furthermore, atmospheric particles at the measurement site are not uniform in composition, and there are likely several different emission sources nearby, not continuous in time, with weak prevailing wind speeds allowing the particulate matter to stagnate.
The mean SSAs of 0.82 (at 532 nm) and 0.66 (at 870 nm) indicate the presence of light-absorbing aerosol materials contributing to local warming, specifically around 07:30–08:00, when it reached the lowest value.
Cruz-Nunez et al. [74] suggested the presence of novel aerosols based on EPA estimates from satellite information. However, we calculated a mean AAE532–870 value of 0.56 and an SAE532–870 of 2.42, and only early in the morning did we measure fresh dark particles. After 10:00, the particles incorporated organic compounds associated with the absorption and scattering of light. In addition, the Ångström matrix (Figure 3) suggests that the presence of fine-mode aerosols with low light absorption predominates in the atmosphere. The organic fraction factors, HOA and LV–OOA, contributed less than 10% to the light absorption at 532 nm, although absorption tends to zero [71] at wavelengths > 300 nm. In the afternoons, the predominant particles were those composed of BC and a BC/BrC mixture. Therefore, the AAE is not reliable enough to assume the presence of fresh dark particles [75].
Secondary aerosols are usually associated with light scattering and are related to the mixed state of BC. Their double property is remarkable, as seen in the scattering MLR coefficients, where the LV–OOA has a coefficient of 5.68 m2 g−1. Nitrates and sulfates are also major contributors.
We measured aerosols with a large and thick coating of scattering material (organic and inorganic compounds). The OA represented 42% of the total mass in PM1 and probably affected the eBC light absorption through the lensing effect. This was also an indicator of secondary and aged compounds.
The eBC was the main contributor to light absorption at both 532 nm and 870 nm, but also to scattered light, contributing almost 20% to the particle scattering coefficient at 532 nm. The particle size, the organic coating, and the incident wavelength [76,77,78,79] promote light scattering, which is important in the context of radiation budget models, where eBC is considered only a light-absorbing material.

5. Conclusions

We have shown that the optical properties of particles are affected in a complex by their chemical composition because several of the species studied simultaneously scatter and absorb sunlight (i.e., eBC, HOA). It is probable that this optical duality is also related to the distribution of the species in the particle and to other factors such as the reactivity of the atmosphere, the rapid aging of the particle, and its incorporation of more species over time.
A new MAE870 value of 5.80 m2 g−1 is proposed which is better adjusted to the aerosol optical/chemical properties of the south of Mexico City than the default value of 4.74 m2 g−1 in order to determine equivalent black carbon. This new value for MAE implies that the black carbon concentration is overestimated up to 18% when using the PAX factor value for the MAE factor.

Author Contributions

Conceptualization, T.C., D.S., H.A.-O. and O.P.; methodology, O.P. and C.P.; software, C.P. and O.P.; validation, C.P.; formal analysis, C.P.; investigation, C.P. and O.P.; resources, O.P.; data curation, C.P., D.S. and H.A.-O.; writing—original draft preparation, C.P.; writing—review and editing, C.P. and O.P.; visualization, C.P.; supervision, O.P.; project administration, T.C., D.S., H.A.-O. and O.P. All authors have read and agreed to the published version of the manuscript.

Funding

This research was funded by Dirección General de Asuntos del Personal Académico, Universidad Nacional Autónoma de México: PAPIIT IN113416.

Institutional Review Board Statement

Not applicable.

Informed Consent Statement

Not applicable.

Data Availability Statement

Not applicable.

Acknowledgments

The authors thank Instituto de Ciencias de la Atmósfera y Cambio Climático staff (UNAM) for their help and material offered for this project. We also would like to thank María Isabel Saavedra and Ramsés Cordero for their help in the Atmospheric Aerosols Laboratory.

Conflicts of Interest

The authors declare no conflict of interest. The funders had no role in the design of the study; in the collection, analyses, or interpretation of data; in the writing of the manuscript, or in the decision to publish the results.

References

  1. Horvath, H. Estimation of the average visibility in central Europe. Atmos. Environ. 1995, 29, 241–246. [Google Scholar] [CrossRef]
  2. Boucher, O. Atmospheric Aerosols; Springer: Dordrecht, The Netherlands, 2015. [Google Scholar]
  3. Ren, R.; Li, Z.; Yan, P.; Wang, Y.; Wu, H.; Cribb, M.; Wang, W.; Jin, X.; Li, Y.; Zhang, D. Measurement report: The effect of aerosol chemical composition on light scattering due to the hygroscopic swelling effect. Atmos. Chem. Phys. 2021, 21, 9977–9994. [Google Scholar] [CrossRef]
  4. World Health Organization European Centre for Environment. WHO Global Air Quality Guidelines: Particulate Matter (PM2.5 and PM10), Ozone, Nitrogen Dioxide, Sulfur Dioxide and Carbon Monoxide; World Health Organization, Ed.; WHO: Bonn, Germany, 2021. [Google Scholar]
  5. Watson, J.G. Visibility: Science and Regulation. J. Air Waste Manag. Assoc. 2002, 52, 628–713. [Google Scholar] [CrossRef] [PubMed] [Green Version]
  6. Hand, J.L.; Malm, W.C. Review of aerosol mass scattering efficiencies from ground-based measurements since 1990. J. Geophys. Res. Earth Surf. 2007, 112, 008484. [Google Scholar] [CrossRef]
  7. Deng, J.; Zhang, Y.; Hong, Y.; Xu, L.; Chen, Y.; Du, W.; Chen, J. Optical properties of PM2.5 and the impacts of chemical compositions in the coastal city Xiamen in China. Sci. Total Environ. 2016, 557–558, 665–675. [Google Scholar] [CrossRef]
  8. Fu, X.; Wang, X.; Hu, Q.; Li, G.; Ding, X.; Zhang, Y.; He, Q.; Liu, T.; Zhang, Z.; Yu, Q.; et al. Changes in visibility with PM2.5 composition and relative humidity at a background site in the Pearl River Delta region. J. Environ. Sci. 2016, 40, 10–19. [Google Scholar] [CrossRef]
  9. Ma, Q.; Wu, Y.; Fu, S.; Zhang, D.; Han, Z.; Zhang, R. Pollution severity-dependent aerosol light scattering enhanced by inorganic species formation in Beijing haze. Sci. Total Environ. 2020, 719, 137545. [Google Scholar] [CrossRef]
  10. Szopa, S.; Naik, V.; Adhikary, B.; Artaxo, P.; Berntsen, T.; Collins, W.D.; Fuzzi, S.; Gallardo, L.; Klimont, Z.; Liao, H.; et al. Chapter 6: Short-Lived Climate Forcers. In Climate Change 2021: The Physical Science Basis. Contribution of Working Group I to the Sixth Assessment Report of the Intergovernmental Panel on Climate Change; Cambridge University Press: Cambridge, UK; New York, NY, USA, 2021; pp. 817–992. [Google Scholar] [CrossRef]
  11. Chow, J.C.; Watson, J.G.; Lowenthal, D.H.; Richards, L.W. Comparability between PM2.5 and particle light scattering measurements. Environ. Monit. Assess. 2002, 79, 29–45. [Google Scholar] [CrossRef]
  12. Querol, X.; Pey, J.; Minguillón, M.C.; Pérez, N.; Alastuey, A.; Viana, M.; Moreno, T.; Bernabé, R.M.; Blanco, S.; Cárdenas, B.; et al. PM speciation and sources in Mexico during the MILAGRO-2006 Campaign. Atmos. Chem. Phys. 2008, 8, 111–128. [Google Scholar] [CrossRef]
  13. Mugica, V.; Ortiz, E.; Molina, L.; De Vizcaya-Ruiz, A.; Nebot, A.; Quintana, R.; Aguilar, J.; Alcántara, E. PM composition and source reconciliation in Mexico City. Atmos. Environ. 2009, 43, 5068–5074. [Google Scholar] [CrossRef]
  14. Vega, E.; Ruiz, H.; Escalona, S.; Cervantes, A.; Lopez–Veneroni, D.; Gonzalez–Avalos, E.; Sanchez–Reyna, G. Chemical composition of fine particles in Mexico City during 2003–2004. Atmos. Pollut. Res. 2011, 2, 477–483. [Google Scholar] [CrossRef]
  15. Carabali, G.; Mamani-Paco, R.; Castro, T.; Peralta, O.; Herrera, E.; Trujillo, B. Optical properties, morphology and elemental composition of atmospheric particles at T1 supersite on MILAGRO campaign. Atmos. Chem. Phys. 2012, 12, 2747–2755. [Google Scholar] [CrossRef] [Green Version]
  16. Kirchstetter, T.W.; Novakov, T.; Hobbs, P.V. Evidence that the spectral dependence of light absorption by aerosols is affected by organic carbon. J. Geophys. Res. Atmos. 2004, 109, 004999. [Google Scholar] [CrossRef] [Green Version]
  17. Knox, A.; Evans, G.J.; Brook, J.R.; Yao, X.; Jeong, C.-H.; Godri, K.J.; Sabaliauskas, K.; Slowik, J.G. Mass Absorption Cross-Section of Ambient Black Carbon Aerosol in Relation to Chemical Age. Aerosol Sci. Technol. 2009, 43, 522–532. [Google Scholar] [CrossRef]
  18. Bond, T.C.; Doherty, S.J.; Fahey, D.W.; Forster, P.M.; Berntsen, T.; DeAngelo, B.J.; Flanner, M.G.; Ghan, S.; Kärcher, B.; Koch, D.; et al. Bounding the role of black carbon in the climate system: A scientific assessment. J. Geophys. Res. Atmos. 2013, 118, 5380–5552. [Google Scholar] [CrossRef]
  19. Guan, X.; Wang, M.; Du, T.; Tian, P.; Zhang, N.; Shi, J.; Chang, Y.; Zhang, L.; Zhang, M.; Song, X.; et al. Wintertime aerosol optical properties in Lanzhou, Northwest China: Emphasis on the rapid increase of aerosol absorption under high particulate pollution. Atmos. Environ. 2020, 246, 118081. [Google Scholar] [CrossRef]
  20. Aiken, A.C.; Salcedo, D.; Cubison, M.J.; Huffman, J.A.; Decarlo, P.F.; Ulbrich, I.M.; Docherty, K.S.; Sueper, D.; Kimmel, J.R.; Worsnop, D.R.; et al. Mexico City Aerosol Analysis during MILAGRO Using High Resolution Aerosol Mass Spec-trometry at the Urban Supersite (T0)-Part 1: Fine Particle Composition and Organic Source Apportionment. Atmos. Chem. Phys. 2009, 9, 6633–6653. [Google Scholar] [CrossRef] [Green Version]
  21. Holland, G.; Cassidy, M.; Ballentine, C.J. Meteorite Kr in Earth’s Mantle Suggests a Late Accretionary Source for the Atmosphere. Science 2009, 326, 1522–1525. [Google Scholar] [CrossRef]
  22. Hodzic, A.; Jimenez, J.L. Modeling anthropogenically controlled secondary organic aerosols in a megacity: A simplified framework for global and climate models. Geosci. Model Dev. 2011, 4, 901–917. [Google Scholar] [CrossRef]
  23. Gyawali, M.; Arnott, W.P.; Lewis, K.; Moosmüller, H. In situ aerosol optics in Reno, NV, USA during and after the summer 2008 California wildfires and the influence of absorbing and non-absorbing organic coatings on spectral light absorption. Atmos. Chem. Phys. 2009, 9, 8007–8015. [Google Scholar] [CrossRef] [Green Version]
  24. Bahadur, R.; Praveen, P.S.; Xu, Y.; Ramanathan, V. Solar absorption by elemental and brown carbon determined from spectral observations. Proc. Natl. Acad. Sci. USA 2012, 109, 17366–17371. [Google Scholar] [CrossRef] [PubMed] [Green Version]
  25. Andreae, M.O.; Gelencsér, A. Black Carbon or Brown Carbon? The Nature of Light-Absorbing Carbonaceous Aerosols. Atmos. Chem. Phys. 2006, 6, 3131–3148. [Google Scholar] [CrossRef] [Green Version]
  26. Sun, H.; Biedermann, L.; Bond, T.C. Color of brown carbon: A model for ultraviolet and visible light absorption by organic carbon aerosol. Geophys. Res. Lett. 2007, 34, 029797. [Google Scholar] [CrossRef]
  27. Paredes-Miranda, G.; Arnott, W.P.; Jimenez, J.L.; Aiken, A.C.; Gaffney, J.S.; Marley, N.A. Primary and Secondary Con-tributions to Aerosol Light Scattering and Absorption in Mexico City during the MILAGRO 2006 Campaign. Atmos. Chem. Phys. 2009, 9, 3721–3730. [Google Scholar] [CrossRef] [Green Version]
  28. Latimer, R.N.C.; Martin, R.V. Interpretation of measured aerosol mass scattering efficiency over North America using a chemical transport model. Atmos. Chem. Phys. 2019, 19, 2635–2653. [Google Scholar] [CrossRef] [Green Version]
  29. Salcedo, D.; Onasch, T.B.; Dzepina, K.; Canagaratna, M.R.; Zhang, Q.; Huffman, J.A.; DeCarlo, P.F.; Jayne, J.T.; Mortimer, P.; Worsnop, D.R.; et al. Characterization of ambient aerosols in Mexico City during the MCMA-2003 campaign with Aerosol Mass Spectrometry: Results from the CENICA Supersite. Atmos. Chem. Phys. 2006, 6, 925–946. [Google Scholar] [CrossRef] [Green Version]
  30. Doran, J.C.; Barnard, J.C.; Arnott, W.P.; Cary, R.; Coulter, R.; Fast, J.D.; Kassianov, E.I.; Kleinman, L.; Laulainen, N.S.; Martin, T.; et al. The T1-T2 study: Evolution of aerosol properties downwind of Mexico City. Atmos. Chem. Phys. 2007, 7, 1585–1598. [Google Scholar] [CrossRef] [Green Version]
  31. Adachi, K.; Buseck, P.R. Internally mixed soot, sulfates, and organic matter in aerosol particles from Mexico City. Atmos. Chem. Phys. 2008, 8, 6469–6481. [Google Scholar] [CrossRef] [Green Version]
  32. Marley, N.A.; Gaffney, J.S.; Castro, T.; Salcido, A.; Frederick, J. Measurements of aerosol absorption and scattering in the Mexico City Metropolitan Area during the MILAGRO field campaign: A comparison of results from the T0 and T1 sites. Atmos. Chem. Phys. 2009, 9, 189–206. [Google Scholar] [CrossRef]
  33. Dubovik, O.; Holben, B.; Eck, T.F.; Smirnov, A.; Kaufman, Y.J.; King, M.D.; Tanré, D.; Slutsker, I. Variability of Absorption and Optical Properties of Key Aerosol Types Observed in Worldwide Locations. J. Atmos. Sci. 2002, 59, 590–608. [Google Scholar] [CrossRef]
  34. Cheng, Z.; Jiang, J.; Chen, C.; Gao, J.; Wang, S.; Watson, J.G.; Wang, H.; Deng, J.; Wang, B.; Zhou, M.; et al. Estimation of Aerosol Mass Scattering Efficiencies under High Mass Loading: Case Study for the Megacity of Shanghai, China. Environ. Sci. Technol. 2014, 49, 831–838. [Google Scholar] [CrossRef] [PubMed]
  35. Doran, J.C.; Fast, J.D.; Barnard, J.C.; Laskin, A.; Desyaterik, Y.; Gilles, M.K. Applications of lagrangian dispersion modeling to the analysis of changes in the specific absorption of elemental carbon. Atmos. Chem. Phys. 2008, 8, 1377–1389. [Google Scholar] [CrossRef] [Green Version]
  36. Pavia, R. Eficiencia de Absorción de Masa de Carbono Elemental y Propiedades Ópticas de Partículas Atmosféricas PM2.5. Master’s Thesis, UNAM, Ciudad Universitaria, Ciudad de México, México, 2017. [Google Scholar]
  37. Gelencsér, A. Carbonaceous Aerosol, 1st ed.; Atmospheric and Oceanographic Sciences Library; Springer: Dordrecht, The Netherlands, 2004; Volume 30. [Google Scholar] [CrossRef]
  38. Kondo, Y.; Komazaki, Y.; Miyazaki, Y.; Moteki, N.; Takegawa, N.; Kodama, D.; Deguchi, S.; Nogami, M.; Fukuda, M.; Miyakawa, T.; et al. Temporal variations of elemental carbon in Tokyo. J. Geophys. Res. 2006, 111, 006257. [Google Scholar] [CrossRef]
  39. Zanatta, M.; Gysel, M.; Bukowiecki, N.; Müller, T.; Weingartner, E.; Areskoug, H.; Fiebig, M.; Yttri, K.E.; Mihalopoulos, N.; Kouvarakis, G.; et al. A European aerosol phenomenology-5: Climatology of black carbon optical properties at 9 regional background sites across Europe. Atmos. Environ. 2016, 145, 346–364. [Google Scholar] [CrossRef]
  40. Zhang, L.; Qiao, L.; Lan, J.; Yan, Y.; Wang, L. Three-years monitoring of PM2.5 and scattering coefficients in Shanghai, China. Chemosphere 2020, 253, 126613. [Google Scholar] [CrossRef]
  41. Liñán-Abanto, R.N.; Peralta, O.; Salcedo, D.; Ruiz-Suárez, L.G.; Arnott, P.; Paredes-Miranda, G.; Alvarez-Ospina, H.; Castro, T. Optical properties of atmospheric particles over an urban site in Mexico City and a peri-urban site in Queretaro. J. Atmos. Chem. 2019, 76, 201–228. [Google Scholar] [CrossRef]
  42. Liu, P.S.K.; Deng, R.; Smith, K.A.; Williams, L.R.; Jayne, J.T.; Canagaratna, M.R.; Moore, K.; Onasch, T.B.; Worsnop, D.R.; Deshler, T. Transmission Efficiency of an Aerodynamic Focusing Lens System: Comparison of Model Calculations and Laboratory Measurements for the Aerodyne Aerosol Mass Spectrometer. Aerosol Sci. Technol. 2007, 41, 721–733. [Google Scholar] [CrossRef]
  43. Ng, N.L.; Herndon, S.C.; Trimborn, A.; Canagaratna, M.R.; Croteau, P.L.; Onasch, T.B.; Sueper, D.; Worsnop, D.R.; Zhang, Q.; Sun, Y.; et al. An Aerosol Chemical Speciation Monitor (ACSM) for Routine Monitoring of the Composition and Mass Concentrations of Ambient Aerosol. Aerosol Sci. Technol. 2011, 45, 780–794. [Google Scholar] [CrossRef]
  44. Salcedo, D.; Alvarez-Ospina, H.; Peralta, O.; Castro, T. PM1 Chemical Characterization during the ACU15 Campaign, South of Mexico City. Atmosphere 2018, 9, 232. [Google Scholar] [CrossRef] [Green Version]
  45. Carbone, S.; Saarikoski, S.; Frey, A.; Reyes, F.; Reyes, P.; Castillo, M.; Gramsch, E.; Oyola, P.; Jayne, J.; Worsnop, D.R.; et al. Chemical Characterization of Submicron Aerosol Particles in Santiago de Chile. Aerosol Air Qual. Res. 2013, 13, 462–473. [Google Scholar] [CrossRef] [Green Version]
  46. El Haddad, I.; D’Anna, B.; Temime-Roussel, B.; Nicolas, M.; Boreave, A.; Favez, O.; Voisin, D.; Sciare, J.; George, C.; Jaffrezo, J.-L.; et al. Towards a better understanding of the origins, chemical composition and aging of oxygenated organic aerosols: Case study of a Mediterranean industrialized environment, Marseille. Atmos. Chem. Phys. 2013, 13, 7875–7894. [Google Scholar] [CrossRef] [Green Version]
  47. Pauraite, J.; Plauškaitė, K.; Dudoitis, V.; Ulevicius, V. Relationship between the Optical Properties and Chemical Composition of Urban Aerosol Particles in Lithuania. Adv. Meteorol. 2018, 2018, 1–10. [Google Scholar] [CrossRef] [Green Version]
  48. Arnott, W.P.; Moosmüller, H.; Walker, J.W. Nitrogen dioxide and kerosene-flame soot calibration of photoacoustic instruments for measurement of light absorption by aerosols. Rev. Sci. Instrum. 2000, 71, 4545–4552. [Google Scholar] [CrossRef]
  49. Arnott, W.P.; Moosmüller, H.; Rogers, C.F.; Jin, T.; Bruch, R. Photoacoustic spectrometer for measuring light absorption by aerosol: Instrument description. Atmos. Environ. 1999, 33, 2845–2852. [Google Scholar] [CrossRef]
  50. Lack, D.A.; Lovejoy, E.R.; Baynard, T.; Pettersson, A.; Ravishankara, A.R. Aerosol Absorption Measurement using Photoacoustic Spectroscopy: Sensitivity, Calibration, and Uncertainty Developments. Aerosol Sci. Technol. 2006, 40, 697–708. [Google Scholar] [CrossRef]
  51. Liñán Abanto, R.N. Propiedades Ópticas y Concentración de Carbono Negro de Partículas Atmosféricas En Zonas Urbanas y Rurales de México; UNAM: Mexico City, Mexico, 2019. [Google Scholar]
  52. DMT. Photoacoustic Extinctiometer (PAX) Operator Manual; DOC-3001 Rev D-6; DMT: Boulder, CO, USA, 2014. [Google Scholar]
  53. Liu, C.; Chung, C.E.; Yin, Y.; Schnaiter, M. The absorption Ångström exponent of black carbon: From numerical aspects. Atmos. Chem. Phys. 2018, 18, 6259–6273. [Google Scholar] [CrossRef] [Green Version]
  54. Bond, T.; Bergstrom, R.W. Light Absorption by Carbonaceous Particles: An Investigative Review. Aerosol Sci. Technol. 2006, 40, 27–67. [Google Scholar] [CrossRef]
  55. Malm, W.C.; Hand, J.L. An examination of the physical and optical properties of aerosols collected in the IMPROVE program. Atmos. Environ. 2007, 41, 3407–3427. [Google Scholar] [CrossRef]
  56. Titos, G.; Moreno, I.F.; Lyamani, H.; Querol, X.; Alastuey, A.; Alados-Arboledas, L. Optical properties and chemical composition of aerosol particles at an urban location: An estimation of the aerosol mass scattering and absorption efficiencies. J. Geophys. Res. Atmos. 2012, 117, 016671. [Google Scholar] [CrossRef] [Green Version]
  57. Amador-Muñoz, O.; Martínez-Domínguez, Y.; Gómez-Arroyo, S.; Peralta, O. Current situation of polycyclic aromatic hydrocarbons (PAH) in PM2.5 in a receptor site in Mexico City and estimation of carcinogenic PAH by combining non-real-time and real-time measurement techniques. Sci. Total Environ. 2019, 703, 134526. [Google Scholar] [CrossRef]
  58. Xu, X.; Zhao, W.; Qian, X.; Wang, S.; Fang, B.; Zhang, Q.; Zhang, W.; Venables, D.S.; Chen, W.; Huang, Y.; et al. The influence of photochemical aging on light absorption of atmospheric black carbon and aerosol single-scattering albedo. Atmos. Chem. Phys. 2018, 18, 16829–16844. [Google Scholar] [CrossRef] [Green Version]
  59. Guerrero, F.; Alvarez-Ospina, H.; Retama, A.; López-Medina, A.; Castro, T.; Salcedo, D. Seasonal Changes in the PM1 Chemical Composition North of Mexico City. Atmósfera 2017, 30, 243–258. [Google Scholar] [CrossRef] [Green Version]
  60. Moffet, R.C.; Qin, X.; Rebotier, T.; Furutani, H.; Prather, K.A. Chemically segregated optical and microphysical properties of ambient aerosols measured in a single-particle mass spectrometer. J. Geophys. Res. 2008, 113, 009393. [Google Scholar] [CrossRef] [Green Version]
  61. Castro, T.; Peralta, O.; Salcedo, D.; Santos, J.; Saavedra, M.I.; Espinoza, M.L.; Salcido, A.; Celada-Murillo, A.-T.; Carreón-Sierra, S.; Ospina, H.A.; et al. Water-soluble inorganic ions of size-differentiated atmospheric particles from a suburban site of Mexico City. J. Atmos. Chem. 2017, 75, 155–169. [Google Scholar] [CrossRef]
  62. Eidels-Dubovoi, S. Aerosol Impacts on Visible Light Extinction in the Atmosphere of Mexico City. Sci. Total Environ. 2002, 287, 213–220. [Google Scholar] [CrossRef] [PubMed]
  63. Baumgardner, D.; Kok, G.L.; Raga, G.B. On the diurnal variability of particle properties related to light absorbing carbon in Mexico City. Atmos. Chem. Phys. 2007, 7, 2517–2526. [Google Scholar] [CrossRef] [Green Version]
  64. Carabali, G.; Estévez, H.R.; Valdés-Barrón, M.; Bonifaz-Alfonzo, R.; Riveros-Rosas, D.; Velasco-Herrera, V.M.; Vázquez-Gálvez, F.A. Aerosol climatology over the Mexico City basin: Characterization of optical properties. Atmos. Res. 2017, 194, 190–201. [Google Scholar] [CrossRef]
  65. Cazorla, A.; Bahadur, R.; Suski, K.J.; Cahill, J.F.; Chand, D.; Schmid, B.; Ramanathan, V.; Prather, K.A. Relating aerosol absorption due to soot, organic carbon, and dust to emission sources determined from in-situ chemical measurements. Atmos. Meas. Tech. 2013, 13, 9337–9350. [Google Scholar] [CrossRef]
  66. Kaskaoutis, D.; Grivas, G.; Stavroulas, I.; Liakakou, E.; Dumka, U.; Gerasopoulos, E.; Mihalopoulos, N. Effect of aerosol types from various sources at an urban location on spectral curvature of scattering and absorption coefficients. Atmos. Res. 2021, 264, 105865. [Google Scholar] [CrossRef]
  67. Cappa, C.D.; Kolesar, K.R.; Zhang, X.; Atkinson, D.B.; Pekour, M.S.; Zaveri, R.A.; Zelenyuk, A.; Zhang, Q. Understanding the optical properties of ambient sub- and supermicron particulate matter: Results from the CARES 2010 field study in northern California. Atmos. Chem. Phys. 2016, 16, 6511–6535. [Google Scholar] [CrossRef] [Green Version]
  68. Ponczek, M.; Franco, M.A.; Carbone, S.; Rizzo, L.V.; dos Santos, D.M.; Morais, F.G.; Duarte, A.; Barbosa, H.M.J.; Artaxo, P. Linking the chemical composition and optical properties of biomass burning aerosols in Amazonia. Environ. Sci. Atmos. 2021, 2, 252–269. [Google Scholar] [CrossRef]
  69. Retama, A.; Ramos-Cerón, M.; Rivera-Hernández, O.; Allen, G.; Velasco, E. Aerosol optical properties and brown carbon in Mexico City. Environ. Sci. Atmos. 2022, 2, 315–334. [Google Scholar] [CrossRef]
  70. Pokhrel, R.P.; Wagner, N.L.; Langridge, J.M.; Lack, D.A.; Jayarathne, T.; Stone, E.A.; Stockwell, C.E.; Yokelson, R.J.; Murphy, S.M. Parameterization of single-scattering albedo (SSA) and absorption Ångström exponent (AAE) with EC/OC for aerosol emissions from biomass burning. Atmos. Chem. Phys. 2016, 16, 9549–9561. [Google Scholar] [CrossRef] [Green Version]
  71. Barnard, J.C.; Volkamer, R.; Kassianov, E.I. Estimation of the mass absorption cross section of the organic carbon component of aerosols in the Mexico City Metropolitan Area. Atmos. Chem. Phys. 2008, 8, 6665–6679. [Google Scholar] [CrossRef] [Green Version]
  72. Buffle, J.; van Leeuwen, H.P. Atmospheric Particles (IUPAC Series on Analytical and Physical Chemistry of Environmental Systems); Harrison, R.M., van Grieken, R.E., Eds.; Wiley: New York, NY, USA, 1998; Volume 5. [Google Scholar]
  73. Malm, W.C. Comparison of calculated sulfate scattering efficiencies as estimated from size-resolved particle measurements at three national locations. Atmos. Environ. 1997, 31, 1315–1325. [Google Scholar] [CrossRef]
  74. Cruz-Núñez, X. Black Carbon Radiative Forcing in South Mexico City. Atmósfera 2015, 32, 167–179. [Google Scholar] [CrossRef]
  75. Garg, S.; Chandra, B.P.; Sinha, V.; Sarda-Esteve, R.; Gros, V.; Sinha, B. Limitation of the Use of the Absorption Angstrom Exponent for Source Apportionment of Equivalent Black Carbon: A Case Study from the North West Indo-Gangetic Plain. Environ. Sci. Technol. 2015, 50, 814–824. [Google Scholar] [CrossRef]
  76. Harrison, R.M.; Van Grieken, R.E. Atmospheric Particles; John Wiley & Sons Ltd.: London, UK, 1998. [Google Scholar]
  77. Kou, L.B. Black Carbon: Atmospheric Measurements and Radiative Effect. Ph.D. Thesis, Dalhousie University Halifax, Nova Scotia, Canada, 1996. [Google Scholar]
  78. Zou, Y.; Cheng, S.; Zhang, H. The light scattering properties study of black carbon aerosols. In Proceedings of the International Conference on Electronics, Communications, and Control (ICECC), Ningbo, China, 9–11 September 2011; pp. 4015–4018. [Google Scholar] [CrossRef]
  79. Liu, F.; Yon, J.; Fuentes, A.; Lobo, P.; Smallwood, G.J.; Corbin, J.C. Review of recent literature on the light ab-sorption properties of black carbon: Refractive index, mass absorption cross section, and absorption function. Aerosol Sci. Technol. 2020, 54, 33–51. [Google Scholar] [CrossRef]
Figure 1. Meteorology. Average diurnal profile of (a) wind speed and direction, (b) temperature and relative humidity.
Atmosphere 14 00100 g001
Figure 2. Particle optical properties. Average diurnal profile of (a) babs at 532 and 870 nm, (b) bsca at 532 and 870 nm, (c) SSA at 532 and 870 nm, and (d) AAE and SAE between 532 and 870 nm.
Atmosphere 14 00100 g002
Figure 3. Scatter plot of SAE and AAE. Particle colors represent the hour of the day.
Atmosphere 14 00100 g003
Figure 4. The average diurnal profile of (a) the absorption coefficient and PM1 and (b) eBC, HOA, and LV–OOA. (c) Average percent mass composition of PM1. (d) Contribution of eBC, LV–OOA, and HOA to the light-absorption at 532 nm.
Atmosphere 14 00100 g004
Figure 5. The average diurnal profile of (a) the scattering coefficient and PM1 and (b) eBC, HOA, LV–OOA, SV–OOA, SO42−, and NO3. (c) Average percent composition of PM1. (d) Contribution of eBC, HOA, LV–OOA, SV–OOA, SO42−, and NO3 to the light scattering at 532 nm.
Atmosphere 14 00100 g005
Table 1. Statistical summary of PM2.5 optical properties for ACU15 Campaign.
Wavelength (nm)MeanSDMedianMinimumMaximum
babs (Mm−1)53212.719.4810.291.0372.75
babs (Mm−1)87010.357.368.461.0253.16
bsca (Mm−1)53265.6347.1253.283.70342.57
bsca (Mm−1)87021.1214.2417.401.00112.57
SSA5320.820.090.840.350.99
SSA8700.660.120.670.260.94
AAE532–8700.670.340.560.124.50
SAE532–8702.400.392.420.405.10
Table 2. Statistics of multiple linear regressions (MLR). r2 stands for determination coefficient.
Coefficients (m2 g−1)SEt Statp–Value
babs532 nm (r2 = 0.92)
Intercept−0.500.14−3.455.69 × 10−4
eBC7.120.0796.890
HOA0.220.044.851.35 × 10−6
LV–OOA0.160.027.042.79 × 10−12
bsca532 nm (r2 = 0.76)
Intercept−3.291.40−2.341.93 × 10−2
eBC7.080.6910.208.50 × 10−24
NO35.830.2522.913.00 × 10−102
LV–OOA5.690.2522.616.24 × 10−100
SO42–2.780.1716.363.31 × 10−56
HOA2.400.254.683.10 × 10−6
SV–OOA1.040.452.322.03 × 10−2
Disclaimer/Publisher’s Note: The statements, opinions and data contained in all publications are solely those of the individual author(s) and contributor(s) and not of MDPI and/or the editor(s). MDPI and/or the editor(s) disclaim responsibility for any injury to people or property resulting from any ideas, methods, instructions or products referred to in the content.

