Abstract
Atmospheric precipitation leads to the increase of moisture in the subgrade. The moisture and soil migration in subgrade is a key scientific problem in evaluating the service performance of the subgrade and resolving or preventing mud pumping. Using a self-developed testing system as well as a numerical simulation model, a detailed study of the dynamic hydraulic characteristics, water migration mechanism, fine soil migration mechanism, and mud pumping properties of the subgrade was conducted. The results showed that water migrated into the upper layer of the subgrade under traffic load. Meanwhile, a pressure gradient for the pore water was generated in the subgrade. This kind of pressure gradient is beneficial for the moisture and fine soil migration. With rising groundwater level and increasing traffic load, the porosity of the subgrade soil differs at different depths. The fine soil migration is caused by water migration, which causes new migration channel for water in the subgrade. Then, a circulating system of moisture and fine soil is formed in the subgrade under a traffic load. After that, the upper layer subgrade soil is nearly saturated under the action of traffic load. Then, the nearly saturated soil liquefies instantaneously, becoming mud, under the action of traffic load. However, as the loading time progresses, the moisture and fine soil in the subgrade continue to migrate upward, resulting in the mud being pumped into the ballast and the gradual disappearance of liquefied soils at different depths.
1. Introduction
With the development of the economy and the “Belt and Road” development strategy. China’s railways are gradually moving towards high-speed, heavy-duty development [1]. The subgrade bears and transmits track gravity and the dynamic action of traffic; hence the stability of the internal soil and rock foundation of railway subgrades have great significance for the safety of railway operation [2,3,4,5,6,7]. Meanwhile, due to the infiltration of atmospheric precipitation and the difficulty of drainage for fine soils, the water content in the subgrade increases. The subgrade is subjected to frequent dynamic traffic loading and erosion by rising groundwater levels, the soil in the subgrade is prone to dispersion, and problems such as mud pumping of the existing railway subgrade occur frequently [8,9,10,11,12,13,14]. Therefore, in-depth research is urgently needed on the relationship between water migration and fine soil migration under traffic load [15,16], and to clarify the process of water and soil migration.
Many heavy-haul railway lines have been built and are in rainy areas in China, such as Shuozhou-Huanghua, Datong-Qinhuangdao, and Beijing-Haerbin. Field monitoring and laboratory tests show that the soil of subgrade filling is mainly composed of sand and silt, that there are relatively few sticky particles, and that the particle size distribution is not uniform. The silt particles are the skeletons of sand particles that fill the pores and provide an excellent migration channel for fine soil–water migration. At the same time, the mechanism of subgrade mud pumping has evolved [17,18,19]. In recent years, a number of studies have been conducted on the migration mechanism of water and fine soil in subgrades under traffic loads. After extensive experiments and numerical simulations, Alobaidi et al. [20,21] established a correlation between the amount of fine soil migration and parameters such as the number of loading cycles, and showed that the development of hydraulic gradients under traffic loads leads to erosion channels inside the subgrade fill and promotes the pumping of fine soil. Abeywickrama et al. [22] found that the accumulation of pore water pressure is the main reason for migration of fine soil in the subgrade, which leads to erosion and damage of the subgrade and eventually blocks the pores in the coarse-grained soil of the base layer; they also studied the particle composition and hydraulic characteristics of sand and silt. The hydrodynamic properties of sand–silt under combined dynamic and static loading were investigated by Zhang et al. [23]. They used a hydrodynamic loading test system, showing that the dissipation of pore water pressure and migration of fine soil had a certain dynamic behavior. Duong et al. [24,25] believed that when the dry density of subgrade soil was sparse and close to saturation, the pore water pressure increased significantly under load, which led to the liquefaction of subgrade soil.
Previous studies have demonstrated the mechanical properties of soil and water migration in the subgrade, which is a guideline for analysis of water and soil migration in the subgrade of practical projects. However, the mechanism of subgrade problems under traffic load, the phase interference analysis of soil and water migration, and the intrinsic connections among water, soil migration, and mud pumping are not clear. Therefore, in this study, several model tests were conducted to study the mud pumping process and mechanism. Additionally, the effect of traffic loading on the water and fine soil migration was considered. The purpose was to systematically follow the kinetic behavior from the causative factor (water-force coupling) to the process (interaction of water migration and fine soil migration) to the result (mud pumping) and the change in subgrade stress. The numerical simulation of PFC-3D (Particle Flow Code) revealed and verified the mechanism of water migration and fine soil migration under a dynamic traffic load, and the intrinsic connection between water and fine soil migration.
2. Experimental and Numerical Tests
2.1. Experimental Setups
Figure 1 shows a schematic of the physical model with a 3D view. The system is based on the modular upgrading of existing equipment and is composed of four modules. It can simulate a combination of dynamic traffic load and water level. The following devices were installed.
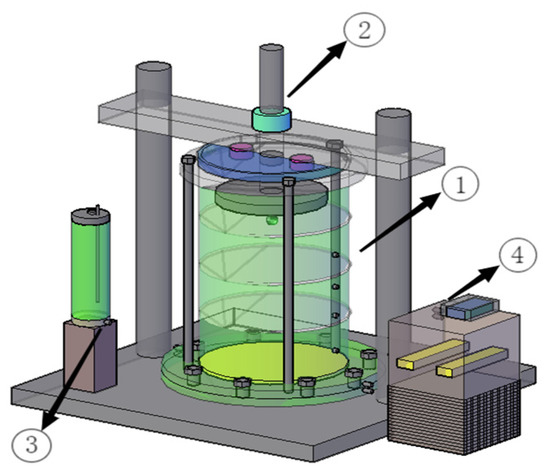
Figure 1.
Schematic of the experimental setup for measuring water and fine soil migration in subgrade soil: ①—Model box module; ②—Dynamic load module; ③—Water level control module; ④—Data acquisition and process tracking module.
2.1.1. Model Box Module
This module is composed of an acrylic cylindrical barrel, an alloy aluminum bottom plate, and fastening components. The model box is composed of an acrylic cylinder barrel and aluminum alloy base plate. The inner diameter of the cylinder barrel is 400 mm, the wall thickness is 20 mm, and the height is 650 mm. The model box is strong, wear resistant, and has a low boundary friction effect, and the transparent acrylic cylinder barrel is convenient for water intrusion, migration, fine soil migration, and visual tracking of mud pumping.
2.1.2. Dynamic Load Module
This module consists of a hydraulic actuator, hydraulic station, servo valve, and pipeline components. The loading actuator can impose multiple load types on the specimen and can impose linear and cyclic loads. The system can apply a maximum axial static load or a dynamic load amplitude of 20 kN and a dynamic loading frequency range of 0 to 10 Hz.
2.1.3. Water Level Control Module
This module is composed of a Markov bottle, an inlet/outlet hole, a valve, and a riser plate. The water level in the model box is accurately controlled by adjusting the height of the Markov bottle.
2.1.4. Data Acquisition and Process Tracking Module
The data acquisition module is composed of a water sensor, a pore water pressure gauge, a soil pressure sensor, and a data acquisition instrument to measure key parameters in real time. The pore water pressure gauge and soil pressure sensor have a measuring range of 0–200 kPa and an accuracy of ±0.0001 kPa. The process tracking involves the use of a high-precision industrial camera with a maximum resolution of 4112 × 3008 and a maximum frame rate of 7 fps and is of model MV-HS200GM2 for tracking water migration and mud pumping.
A Markov bottle fed water into the soil by connecting the bottom bath pedestal. The scale markers on the Markov bottle were used to calculate the water migrated into the soil. To simulate the process of groundwater eroding the soil in the subgrade, it is ensured that the external water replenishment of the Markov bottle has no pressure. The waterproof orifice plate was connected to a cold bath tray base to ensure that the external water source flows evenly into the subgrade soil.
2.2. Materials and Experimental Scheme
Subgrade soil from the Shuozhou–Huanghua heavy-haul railway subgrade was investigated in this study. The subgrade soils consisted of silty clay and sand, with 56.01% of the fine soils smaller than 0.25 mm, as shown in Figure 2. In addition, 42.45% of all particles had diameters less than 0.075 mm, and 25.63% of all particles had diameters less than 0.01 mm; their physical properties are listed in Table 1.
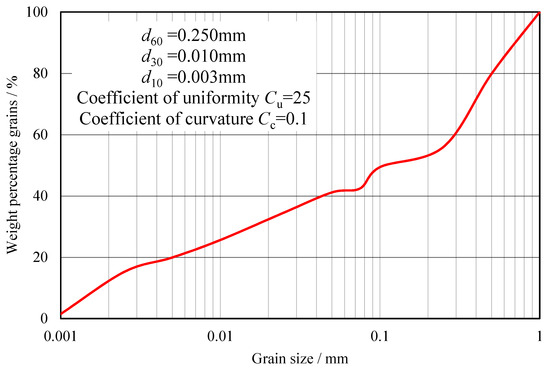
Figure 2.
Plot of particle-size distribution of the subgrade soil from the Shuozhou–Huanghua heavy haul railway subgrade.

Table 1.
Physical properties of the subgrade soil.
During the test, the soil and ballast in the cylindrical barrel were first filled (subgrade soil thickness 300 mm, ballast thickness 250 mm), the subgrade soil was dried and mixed evenly, and the wetting of soil sample was carried out for 24 h according to optimum water content and secondary mixing was performed. After full uniformity, a 90% compaction degree was used to control the dry density method to load the soil samples in four layers. At the same time, pore water pressure gauges and water and soil pressure sensors were placed at 0, 100, 200, and 300 mm depths of the subgrade soil. After each layer of soil and sensors were filled, and the ballast was compacted and covered. The water replenishment device was opened. By observing the change in the water sensor, the water replenishment was stopped when the whole sample reached a high saturation state. Subsequently, monotonic loading from 0 to 30 kPa at a rate of 5 kN/min, high-frequency cyclic loading from 30 to 120 kPa, and a 2.5 Hz cyclic loading for 100,000 cycles were applied. A frequency of 2.5 Hz represents the traffic circulation at 100 km/h as applied in Zhang [26]. Figure 3 shows the dynamic stress view of the entire loading process; the data were collected using a data logger. After the test, the subgrade soil was excavated and the fine soil of the subgrade at each depth was measured.

Figure 3.
Dynamic stress during loading.
2.3. Numerical Modelling
A calculation model for water migration, soil migration, and mud pumping was designed according to the indoor model test device. The calculation model has a length of 400 mm, a width of 400 mm, and a height of 550 mm, where the sub-soil height is 300 mm and the ballast height is 250 mm. The calculation model is composed of a double solid coupling model, fluid–solid coupling model, and cyclic load model. The fluid–solid coupling model and cyclic loading model were established to simulate the water replenishment process and loading process of the subsoil in laboratory tests. The structure of the double-solid coupling model has two layers: ballast layer and subgrade layer. The subsoil is composed of random arrangements of coarse particles ranging from 0.25 mm to 1.00 mm porosity and fine soils ranging from 0.00 mm to 0.25 mm porosity. Figure 4 shows the schematic of this model.
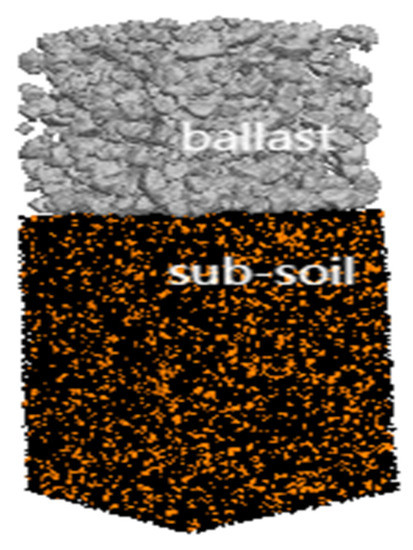
Figure 4.
Numerical model of ballasted railway subgrade.
To represent the fine soil migration process in the numerical simulation and monitor the variation in porosity with time in the subsoil during the water supplement and loading stages in the calculation model, five measuring units in the subgrade were used. Fluid–solid coupling and the porosity tracer equation use the following formulas [27,28,29].
where is the fluid density, is the porosity, is the pressure gradient, is the fluid velocity vector, is the viscous stress tensor, is the gravity acceleration vector, is the interaction force vector between solid and liquid in unit volume, is the coefficient between fluid and soil particles, is the dynamic viscosity coefficient of liquid, is the average velocity vector of soil particles, and is the average diameter of soil particle.
3. Experimental Results and Discussion
3.1. Water Migration of the Subgrade under Dynamic Load
Water supplement and dynamic load tests were conducted on the filled subgrade to study the behavior of water migration and evolution in the subgrade. Figure 5 shows the evolution of the water content of the subgrade from the bottom to the top. The water content of the subgrade was stabilized at 41.71%, 42.01%, 42.11%, and 42.14% at depths of 0, 100, 200, and 300 mm, respectively. With an increase in subgrade depth, the water content of the stabilized subgrade increased.
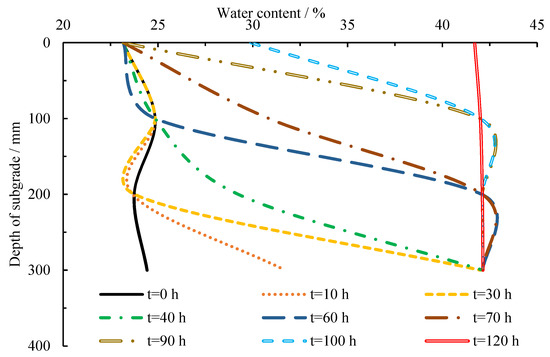
Figure 5.
Water content of subgrade soil at different depths during bottom recharge.
Figure 6 shows the water content curves of the subgrade soil at depth at different times under a dynamic traffic load. As presented in the figure, with the action of the dynamic traffic load, the water content at depths of 100, 200, and 300 mm in the subgrade decreases, and that at depth 0 mm in the subgrade increases significantly. This indicates that the water in the subgrade migrates sharply from deeper locations to shallower locations, as shown in Figure 7.
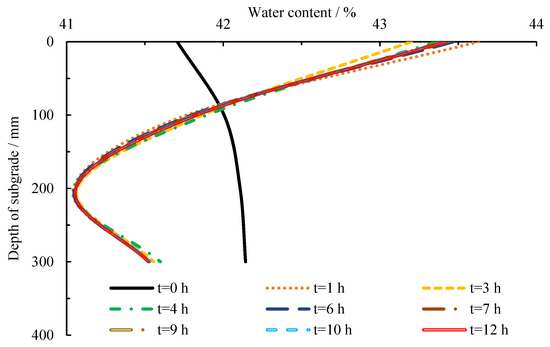
Figure 6.
Water content curve of subgrade soil at different depths with time under dynamic load.
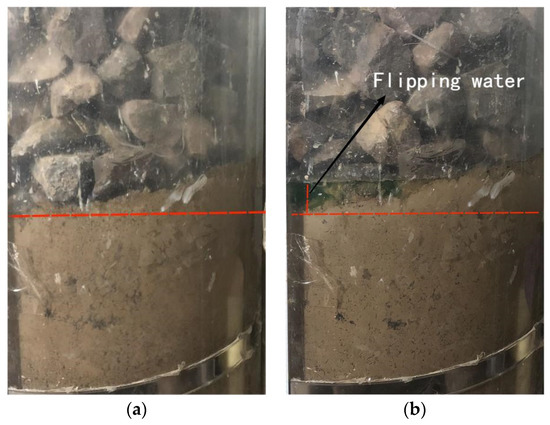
Figure 7.
Photographs of water migration. (a) After filling water at the bottom of the soil in the subgrade. (b) Subgrade after applying dynamic load.
From the analysis of water migration in the subgrade under traffic load, the “sum of layers method” was used to calculate the amount of water migration at different depths. Table 2 shows the changes of water in subgrade at different depths. The largest increase in water occurs at shallow points in the subgrade, near the loading of the top layer of soil. As the depth increases, there is less increase in water. The largest decrease in water occurs at the deepest point in the subgrade, and at shallower depths, the water decreases less. These situations indicate that with traffic loading, the deeper the level in the subgrade, the smaller the change in the amount of water, and that the effect of traffic loading on subgrade water migration is mainly concentrated in the shallower subgrade where there is less soil loading. The reason for the water migration analysis results may be because the porosity of the subgrade is low, the degree of compaction is high, and the internal sealing and the “suction” effect of the cyclic load on the subgrade migrate the water to the top of the subgrade. Similar phenomena were also reported by Han and Yang [30,31].
Table 2.
Water variation relationship of subgrade at different depths (%).
The mass water content of the subgrade soil was calculated by drying soil at different depths of the subgrade. Figure 8 shows the mass water content at different depths after cyclic traffic loading. The maximum mass water content was at a depth of 0 mm and the minimum mass water content of the subgrade soil was at a depth of 200 mm. This is consistent with the study of water migration in the subgrade soil from the bottom to the top.
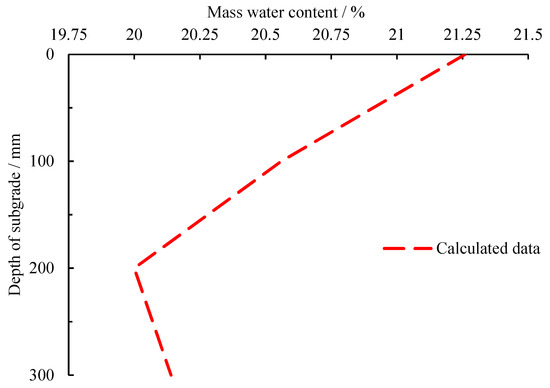
Figure 8.
Mass water content curve of subgrade soils under dynamic load.
The movement mechanism of water migration in the subgrade was also studied. Figure 9a shows the time history curve of pore water pressure in the subgrade. After water replenishment from the bottom of the subgrade, the pore water pressure at the maximum depth increased initially. As water replenishment continued, the pore water pressure of the whole subgrade increased, and the growth rate was small. More time is required for the pore water pressure to reach a stable state, which also characterizes the above test results; that is, the water content of the subgrade at a shallower depth is lower.
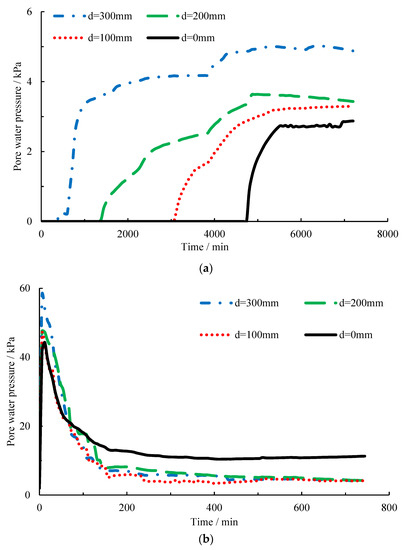
Figure 9.
Typical result of pore water pressure: (a) water supplement process at the bottom of the subgrade; (b) dynamic subgrade loading process.
Cyclic dynamic traffic loading was applied to the rehydrated subgrade. Figure 9b shows the pore water pressure of subgrade soil at different depths with loading time. This evolution indicates that after applying loading, the pore water pressure of subgrade soil at different depths undergoes varying degrees of abrupt changes. With loading time, the pore water pressure appears to decrease and then tends toward a certain stable state. For the subgrade fill at different depths after the application of dynamic traffic load, the pore water pressure of the subgrade soil at a depth of 300 mm has the most significant sharp abrupt increase, and at shallower depths, the abrupt increase in pore water pressure of the subgrade soil shows a decreasing trend. However, with an increase in loading time, the pore water pressure at shallower depths of the subgrade soil decreases at a slower rate, and finally tends to be stable. The pore water pressure of the 0 mm subgrade soil located at the shallowest depth is the largest and most significant relative to other depths. This indicates that different pore water pressure gradients were formed at different depths in the subgrade under traffic loading. However, the pore water pressure showed a dissipation trend as the loading time continued to increase, and the pore water pressure gradients at different depths of the subgrade showed changes. Meanwhile, the numerical gradient of the pore water pressure dissipation change tended to be stable, which is same as the gradient of the water content of the roadbed at different depths after loading. This indicates that the pore water pressure promoted after the application of the dynamic load drives the water migration during the dissipation process.
3.2. Migration of Fine Soil inside the Subgrade under Dynamic Load
Considering that the mud migrating upwards in the subgrade is a semi-colloidal suspension of tiny fine soil and water, the upward migration of water in the subgrade at different depths under cyclic traffic load as well as the migration changes of fine soil in the subgrade need to be studied urgently. Therefore, the fine soil migration characteristics in the subgrade are proposed under the increasing groundwater erosion and traffic loading.
The relationship curves of the particle size distribution of the subgrade soil at different depths during water replenishment and loading are shown in Figure 10. As can be seen from the figure, the proportions of fine soil (silty clay with particle size less than 0.25 mm) before subgrade water replenishment with depths of 25, 75, 125, 175, 225, and 275 mm are 56.15%, 55.64%, 56.98%, 55.27%, 57.02%, and 56.98%, respectively. The particle gradation of the subgrade soil at different depths is somewhat different, which is mainly due to the large volume of the sample, and it is difficult to ensure uniformity between particles after layered loading. The proportion of the subgrade soil particle size at different depths has a certain error, but the error is within a reasonable range.
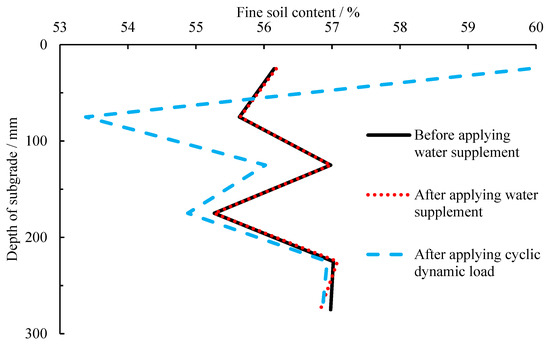
Figure 10.
Result of fine soils content during the test of the sub-soil.
After the groundwater recharge stage, the fine soil at different depths did not change significantly. This indicates that there are more powder and clay particles with particle size less than 0.075 mm in the subgrade soil during the test. However, for the subgrade soil that meets the actual compaction requirements of the project, there is no significant change in the migration of fine soil caused by groundwater erosion.
The change curves of fine soil in the subgrade at different depths and the groundwater recharge stage were compared. This comparison shows that when dynamic traffic loading is applied, the percentage of fine soil changes at different depths of subgrade. The depth of the shallower subgrade and near the traffic cycle load of 25 mm, fine soil mass accounted for a significant increase. However, the fine soil content is reduced to varying degrees for the relatively large depths of the subgrade, with the most pronounced reduction occurring at depths of 75 mm. With an increase in the depth of the subgrade, the change in the percentage of fine soil mass is less obvious, which indicates that the phenomenon of fine soil migration occurs inside the subgrade after the cyclic traffic load. The fine soil migration from the deeper subgrade to the shallower subgrade occurs, which indicates that cyclic traffic load has a greater effect on the migration of the particles at the shallower subgrade, and the phenomenon of fine soil migration is related to the traffic cycle load. The migration phenomenon of fine soils in the subgrade was the same as that of water migration in the subgrade. The reason for this experimental result is due to the “suction” effect of traffic cyclic loading on the subgrade, the pore water pressure gradient which is formed at different depths, and the “suction” effect on the pore water of the soil in the subgrade, which promotes the fine soil from the bottom to top layer of the subgrade. The results of this test are the same as those of tests on the migration of pulverized soils in sandy soils under traffic loads [23]. When there are large particle size differences and good grading in the subsoil, the dynamic traffic load can drive the migration of fine soils.
When considering the traffic cycle load, the fine soil migration and water migration at different depths of the subgrade are the same. Under the action of traffic cycle load, there is a specific migration of water and fine soil in the subgrade. This mechanism may be associated with the action of traffic load, different depths of the subgrade water along the pore space caused by the upward migration of different particle sizes of the subgrade soil, and water migration, driving the tiny fine soil in the subgrade. At the same time, the water migration promotes the tiny fine soil in the subgrade upward to the surface layer of the subgrade; the remaining volume space below this subgrade depth is filled with water in the next stage, forming a larger water migration channel. Under the traffic load caused by the pumping effect on the subgrade, more water in the lower layer migrates to the surface layer of the subgrade. Then, more fine soils migrate, forming a water-and-soil migration cycle system under traffic loading. This mechanism is different from the migration of water and soil in the underground recharge stage; in this stage, the traffic circulation load is applied, the water migration in the subgrade is relatively more intense, the channel of water migration is relatively larger, and the tiny fine soils in the subgrade can be migrated.
3.3. Evolution Mechanism of Mud Pumping in a Subgrade
Under the action of a cyclic traffic load, the water and fine soil migrate at different depths in the subgrade, and the overall structure of the subgrade is prone to change. Figure 11 shows the stress and depth relationship during the cyclic loading process of the subgrade. The subgrade soil stress showed a decreasing trend with increasing depth. Once the depth increased to a certain point, the reduction in soil stress slowed, showing an exponential attenuation relationship. The cyclic load has a significant influence on the subgrade surface soil stress, while the influence of deep subgrade soil is small, and the soil stress under cyclic load shows dissipation. Figure 12 shows the effective stress with cyclic traffic loading time under different depths. There is an instant negative impact of the effective stress, indicating that the liquefication of the subgrade soil occurs instantly, and mud appears in the subgrade [32]. As the loading time progresses, the effective stress at different depths increases gradually, and eventually appears to be positive. From the effective stress and loading time curve, the greater depths of subgrade soil, attainment of the positive value required a longer loading time, while the upper subgrade soils at 0 mm and 100 mm at shallower depths required a shorter loading time. This indicates that the liquefaction of the subgrade soil at different depths gradually disappeared, as did the mud in the subgrade. In addition, the shallower the depth, the faster the mud disappeared. The result of this experimental phenomenon was due to the disappearance of water and fine soil in the mud component of the subgrade. Under the action of dynamic traffic load, the water and fine soil in the deeper subgrade migrated to a shallower depth, and the effective stress of the deeper subgrade gradually increased. Since the upper layer of the subgrade was ballast and open, at shallower subgrade depths, the fine soil and water migrated into the ballast, and more mud appeared in the ballast (see Figure 13). Thus, at different depths under the subgrade, a mud pumping process occurs, and the effective stress gradually increases. At the same time, the effect of the dynamic traffic load differs at different depth. The shallower the subgrade depth, the more water and fine soil migration there is. This also causes the changing of effective stress of the subgrade soil at different depth, and the effective stress as the shallower depth means that less time is required for positive values to increase.
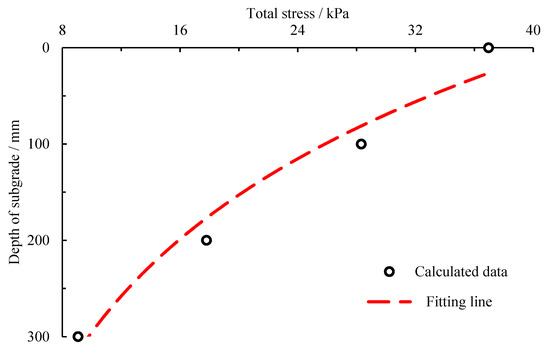
Figure 11.
Total stress under cyclic dynamic loading.
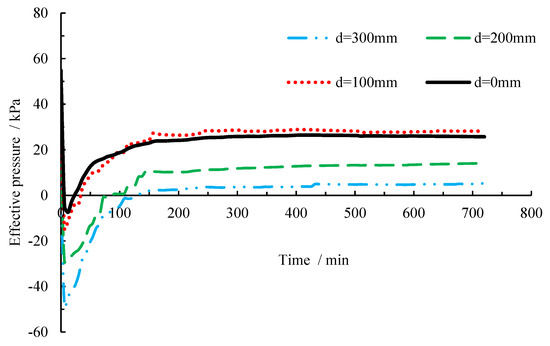
Figure 12.
Effective stress in subgrade soil.
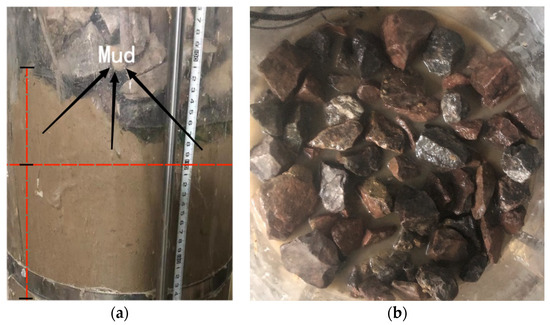
Figure 13.
Photograph showing the mud pumping of the subgrade: (a) Lateral view. (b) Vertical view.
From the indoor model test, under the action of dynamic traffic load, a large amount of water and fine soil migration occurs at different depths of subgrade soil, which has an important influence on the subsequent subgrade mud pumping problem. Therefore, analysis of water and fine soil migration in the subgrade under traffic load is crucial. However, it is difficult to analyze the change trend of fine soil in the subgrade with loading time in detail in the indoor model test; therefore, a numerical simulation analysis of fine soil migration in the subgrade under dynamic traffic load was performed.
4. Numerical Simulation Results and Discussion
4.1. Numerical Simulation of Fine Soil Migration in the Subgrade
A numerical simulation model of water and fine soil migration under traffic load was established to characterize the migration process of fine soil in the subgrade at different depths. Figure 14 shows the fine soil migration cloud diagram of the subgrade water replenishment and loading processes. In the subgrade water replenishment stage, the fine soils (grey particles in the figure) migrate with the upward movement of water. The fine soil migration channel was narrow, and the migration amount was small. Compared with the migration of fine soils during subsurface recharge in the indoor model test, there is a certain migration of fine soils in the numerical simulation, which is mainly due to the presence of certain suspended particles in the numerical model and the movement of suspended particles during the water flow.
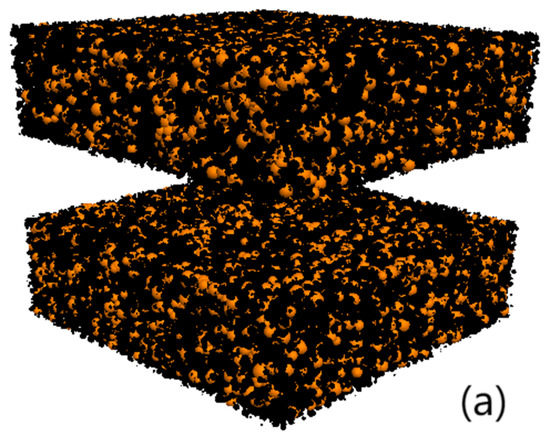
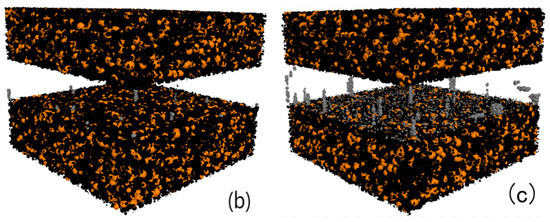
Figure 14.
Numerical simulation of fine soil migration in the subgrade at different stages: (a) before the water replenishment; (b) after the water replenishment; (c) after applying cyclic dynamic load.
In the loading stage, the amount of fine soil migration is significantly improved, and the migration channel in the water replenishment stage is enlarged. A new dense migration channel appears, which indicates that the difference in particle size distribution among the subgrade soil particles provides a flow channel for water migration. Water migration drives the migration of fine soil particles. As the subgrade loading stage progresses, the migration of fine soil driven by water migration continues to increase. This is because the migration of fine soil expands the water migration channel, resulting in a continuous replenishment process. This leads to a more intense migration of water under the next traffic cycle load, and the intense migration of water drives more migration of fine soil. A common cyclic migration effect is formed between water and fine soil, resulting in a significant increase in the migration of water and fine soil under dynamic load.
The numerical simulation results of fine soil migration in subgrades with different depths under dynamic traffic loads are shown in Figure 15. After the simulation of water replenishment under the subgrade, the fine soil in the deeper subgrade decreases, and the content of fine soil in the shallower subgrade increases. The fine soil in the subgrade migrates from a shallower depth to a deeper depth. In the subgrade loading stage, the fine soil in the subgrade at different depths changes significantly, and large-scale fine soil migration occurs in the subgrade at shallower depths. Compared with the model test, the migration percent of fine soil at different depths is between 3% and 8%, and the migration principle of fine soil is the same. This provides a basis for subsequent studies on the porosity of subgrade soils at different depths.
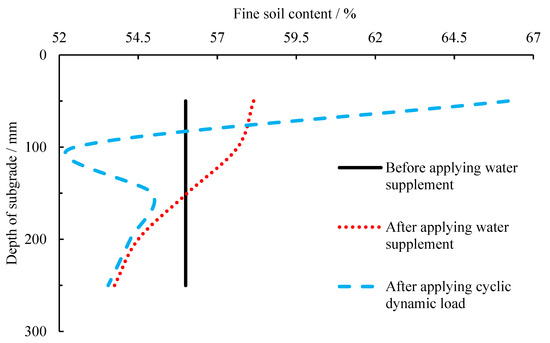
Figure 15.
Fine soils content of subgrade in numerical simulation.
4.2. Evolution Mechanism of Soil Porosity in the Subgrade
A numerical simulation model was used to study the porosity of the soil during the subgrade water replenishment and loading processes. Figure 16 shows the porosity variation of the subgrade soils with time at different depths in the numerical model of water and fine soil migrations.
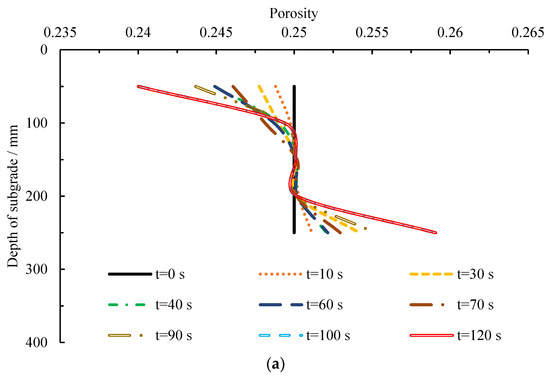
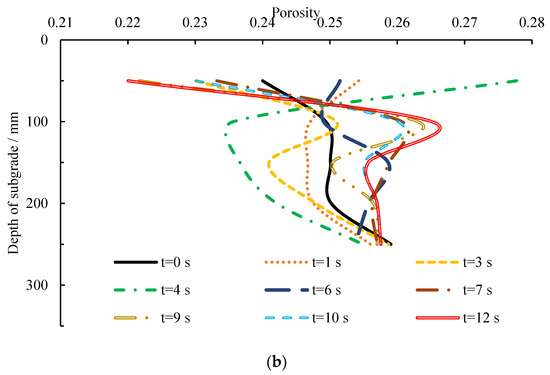
Figure 16.
Numerical simulation results of subgrade soil porosity in different stages: (a) after the water replenishment; (b) after applying cyclic dynamic load.
In the water replenishment stage, the porosity of the subgrade at different depths showed different degrees of change; the porosity of the subgrade at greater depths showed an increasing trend, while the porosity of the subgrade at smaller depths showed a decreasing trend. The porosity of the subgrade at depths of 150 mm and 200 mm did not change significantly, which indicates that in the numerical simulation process, the migration of fine soils occurs during the bottom-up recharge phase of the subgrade. This numerical result is the same as the migration cloud of fine soils in the subgrade, and its migration is due to the existence of suspended particles in the subgrade model. However, in the analysis of changes in the porosity of the subgrade at different depths, the porosity fluctuation was small, and the influence of suspended particles was small, which provided an idea for analyzing the porosity of the subgrade at different depths during loading. During the subgrade loading process, significant changes in subgrade porosity occurred at different depths. At shallower depths and near the loaded subgrade, the porosity change is most significant, but with increased depth, the trend of subgrade porosity decreases. This indicates that with the traffic cycle load applied, the depth of the upper subgrade layer of fine soils is more affected. In the subgrade porosity change trend analysis, for the initial loading, the subgrade porosity change fluctuated with the loading time, the subgrade porosity fluctuated less, and the subgrade porosity values at different depths appear to be stable values of development. This situation indicates that the role of traffic loading in the migration of fine soils within the subgrade was significant. With increased loading time, there was less migration of fine soils within the subgrade, but at different depths of the subgrade, porosity development of stable values can be seen (red part of the curve); in the shallowest subgrade, the porosity is lowest, whereas with increased depth, the porosity is relatively higher. Especially for the shallowest subgrade, the porosity of the subgrade is the highest, which indicates that the pores of the shallower upper subgrade are smaller, and the pores of the deeper subgrade are larger. Fine soils in the deeper subgrade migrate upward, more fine soils exist in the shallower subgrade, and the greater the depth, the smaller the migration of fine soils. This result also verifies the results of the indoor fine soil migration model test.
5. Conclusions and Outlook
This study developed a test system to evaluate the mechanisms of subgrade water and soil migration and mud pumping. The evolution mechanisms of water migration, fine soil migration, and mud pumping of the subgrade under traffic load were obtained and analyzed.
- (1)
- In the process of groundwater recharge, there is no obvious migration of fine soil in the subgrade, but with the application of load, gradient-type pore water pressure appears in the subgrade, and a dramatic increase in migration of water and fine soil occurs.
- (2)
- Under the action of traffic loads, a significant migration of water occurs in the subgrade, while carrying fine soils from the pores between coarse-grained soils. The migration of fine soils increases the pore space in the subgrade, and then promotes the migration of water in the subgrade, which triggers the migration of more fine soils.
- (3)
- The effect of traffic load on the shallow subgrade is significant, while that of the depth of the smaller upper layer of the subgrade water on fine soil migration is more dramatic. However, the effect on the water and fine soil migration is relatively small for larger depth.
- (4)
- Under traffic loading, the subgrade soil near the saturation state undergoes instant liquefaction and then forms mud. However, with the migration of water and fine soil, different depths of mud exhibit an upward pumping phenomenon, especially at the depth of the smaller roadbed. A large amount of mud is pumped into the ballast, and the effective stress of the subgrade soil gradually returns to positive values.
Author Contributions
Conceptualization and supervision, L.Z. and T.W.; funding acquisition, T.W.; writing—original draft preparation, L.W. and L.Z.; writing—review and editing, T.W.; methodology, software, validation, L.W., L.Z. and S.Z.; resources, data curation, L.W., L.Z. and S.Z.; All authors have read and agreed to the published version of the manuscript.
Funding
The National Natural Science Foundation of China (NSFC) under grant Nos. 51978426 and 51708369, the Natural Science Foundation of Hebei Province under grant No. E2021210007 and No. E2021210128.
Institutional Review Board Statement
Not applicable.
Informed Consent Statement
Not applicable.
Data Availability Statement
Not applicable.
Acknowledgments
This research was funded by the National Natural Science Foundation of China (NSFC) under grant Nos. 51978426 and 51708369, the Natural Science Foundation of Hebei Province under grant No. E2021210007 and No. E2021210128. The authors would like to thank the language editor for the English language editing.
Conflicts of Interest
The authors declare no conflict of interest.
References
- China Railway Publishing House. Code for Design of Railway Earth Structure; China Railway Publishing House: Beijing, China, 2017. [Google Scholar]
- Arivalagan, J.P.; Indraratna, B.H. Effectiveness of a Geocomposite-PVD system in preventing subgrade instability and fluidisation under cyclic loading. Geotext. Geomembr. 2022, 50, 607–617. [Google Scholar] [CrossRef]
- Kim, U.; Kim, D.S. Evaluation of Deformation Characteristic of Railway Subgrade Using Reinforced Rigid Walls with Short Reinforcement under Repetitive and Static Loads. Appl. Sci. 2021, 11, 3615. [Google Scholar] [CrossRef]
- Zhou, W.Q.; Leng, W.M. Critical dynamic stress and cumulative deformation characteristics of coarse-grained soil filler under cyclic load. J. China Railw. Soc. 2014, 36, 84–89. [Google Scholar]
- Kettil, P.; Lenhof, B. Coupled simulation of wave propagation and water flow in soil induced by high-speed trains. Int. J. Numer. Anal. Methods Geomech. 2008, 32, 1311–1319. [Google Scholar] [CrossRef]
- Ebrahimi, A.L.; Tinjum, J. Deformational behavior of fouled railway ballast. Can. Geotech. J. 2014, 52, 1–12. [Google Scholar] [CrossRef]
- Chen, R.P.; WANG, H.L. Effects of degree of compaction and fines content of the subgrade bottom layer on moisture migration in the substructure of high-speed railways. Proc. Inst. Mech. Eng. Part F J. Rail Rapid Transit 2018, 232, 10. [Google Scholar] [CrossRef]
- Abdollahi, M.; Vahedifard, F. Predicting Resilient Modulus of Unsaturated Subgrade Soils Considering Effects of Water Content, Temperature, and Hydraulic Hysteresis. Int. J. Geomech. 2022, 22, 04021259. [Google Scholar] [CrossRef]
- Chawla, S.; Shahu, J.T. Reinforcement and mud-pumping benefits of geosynthetics in railway tracks: Numerical analysis. Geotext. Geomembr. 2016, 44, 344–357. [Google Scholar] [CrossRef]
- Hudson, A.; Watson, G. Remediation of mud pumping on a ballasted railway track. Procedia Eng. 2016, 143, 1043–1050. [Google Scholar] [CrossRef]
- Zhu, Q.; Su, L.J. Study on permeability of wide-grade soil distribution under particle migration. Rock Soil Mech. 2021, 42, 125–134. [Google Scholar]
- Yang, D.H.; Wei, C.F. Experimental study on the influence of fine particle migration and composition changes on clay permeability. Chin. J. Geotech. Eng. 2019, 41, 2009–2017. [Google Scholar]
- Li, D.S.; Wen, Z. Slope failure induced by cold snap and continuous precipitation in the seasonal frozen area of Qinghai-Tibet Plateau. Sci. Total Environ. 2019, 694, 133547. [Google Scholar] [CrossRef] [PubMed]
- Qin, Y.; Bai, Y.F. The effects of soil freeze-thaw processes on water and salt migrations in the western Songnen Plain, China. Sci. Rep. 2021, 11, 3888. [Google Scholar] [CrossRef]
- Wong, R.; Choi, E. In Situ Pore Pressure Responses of Native Peat and Soil under Train Load: A Case Study. J. Geotech. Geoenviron. Eng. 2006, 132, 1360–1369. [Google Scholar] [CrossRef]
- Nie, R.S.; Leng, W.M. Detection test and condition evaluation of subgrade of existing heavy-duty railway. Trans. China Railw. Eng. Soc. 2014, 31, 20–24. [Google Scholar]
- Leng, W.M.; Zhou, W.Q. Dynamic characteristics and cumulative deformation analysis of coarse-grained soil filler of heavy-duty railway. Rock Soil Mech. 2016, 37, 728–736. [Google Scholar]
- Li, S.Y.; Lai, Y.M. Dynamic responses of Qinghai-Tibet railway embankment subjected to train loading in different seasons. Soil Dyn. Earthq. Eng. 2012, 32, 1–14. [Google Scholar] [CrossRef]
- Leng, W.M.; Su, Y. Analysis and evaluation of the physical state index of fine-grained soil prone to slurry and mud. J. China Railw. Soc. 2018, 40, 116–122. [Google Scholar]
- Alobaidi, I.; Hoare, D.J. Mechanisms of pumping at the subgrade-subbase interface of highway pavements. Geosynth. Int. 1999, 6, 241–259. [Google Scholar] [CrossRef]
- Alobaidi, I.; Hoare, D.J. Factors Affecting the Pumping of Fines at the Subgrade Subbase Interface of highway Pavements: A Laboratory Study. Geosynth. Int. 1994, 1, 221–259. [Google Scholar] [CrossRef]
- Abeywickrama, A.; Indraratna, B. Excess pore-water pressure generation and mud pumping in railways under cyclic loading. Lect. Notes Civ. Eng. 2019, 28, 371–383. [Google Scholar]
- Zhang, S.; Gao, F. Experiment on fine particle migration mechanism of sand-silt mixture under train load. Rock Soil Mech. 2020, 41, 1591–1598. [Google Scholar]
- Duong, T.V.; Tang, A.M. Effects of fines and water contents on the mechanical behavior of interlayer soil in ancient railway sub-structure. Soils Found. 2013, 53, 868–878. [Google Scholar] [CrossRef]
- Duong, T.V.; Cui, Y.J. Investigating the mud pumping and interlayer creation phenomena in railway sub-structure. Eng. Geol. 2014, 171, 45–58. [Google Scholar] [CrossRef]
- Zhang, D. Research on Stress Analysis and Design Method of Subgrade Bed of Heavy-Duty Railway. Master’s Thesis, China Academy of Railway Sciences, Beijing China, 2019. [Google Scholar]
- Jackson, R. The Dynamics of Fluidized Particles. Meas. Sci. 2001, 12, 755. [Google Scholar] [CrossRef]
- Burrow, M.; Bowness, D. A comparison of railway track foundation design methods. Proc. Inst. Mech. Eng. Part F J. Rail Rapid Transit 2007, 221, 1–12. [Google Scholar] [CrossRef]
- Chang, L.Y.; Cheng, Q. Particle flow numerical simulation of contact erosion between uniform particles. Chin. J. Geotech. Eng. 2016, S2, 6. [Google Scholar]
- Han, B.W.; Cai, G.Q. Research and development and application of ballast track subgrade slurry ejection model test system. Chin. J. Geotech. Eng. 2022, 44, 1406–1415. [Google Scholar]
- Yang, Z.H.; Yue, Z.R. Experimental study on water migration law in subgrade of unsaturated silt soil. Rock Soil Mech. 2020, 41, 2241–2251. [Google Scholar]
- Cai, Y.Q.; Yan, S.H. Mechanism test of slurry sludge extraction under traffic load. J. Jilin Univ. Eng. Sci. 2021, 51, 1742–1748. [Google Scholar]


Disclaimer/Publisher’s Note: The statements, opinions and data contained in all publications are solely those of the individual author(s) and contributor(s) and not of MDPI and/or the editor(s). MDPI and/or the editor(s) disclaim responsibility for any injury to people or property resulting from any ideas, methods, instructions or products referred to in the content. |
© 2023 by the authors. Licensee MDPI, Basel, Switzerland. This article is an open access article distributed under the terms and conditions of the Creative Commons Attribution (CC BY) license (https://creativecommons.org/licenses/by/4.0/).