Article

Heterogenous Canopy in a Lagrangian-Stochastic Dispersion Model for Particulate Matter from Multiple Sources over the Haifa Bay Area

1
Department of Applied Mathematics, Israel Institute for Biological Research, P.O. Box 19, Ness-Ziona 7410001, Israel
2
Department of Soil and Water Sciences, The Robert H. Smith Faculty of Agriculture, Food and Environment, The Hebrew University of Jerusalem, P.O. Box 12, Rehovot 7610001, Israel
*
Authors to whom correspondence should be addressed.
Atmosphere 2023, 14(1), 144; https://doi.org/10.3390/atmos14010144
Submission received: 16 November 2022 / Revised: 3 January 2023 / Accepted: 5 January 2023 / Published: 9 January 2023
(This article belongs to the Special Issue Computational Fluid Dynamics Simulations of Urban Airflow)

Abstract

:
The Haifa Bay area (HBA) is a major metropolitan area in Israel, which consists of high volume transportation routes, major industrial complexes, and the largest international seaport in Israel. These, which lie relatively near densely populated residential areas, result in a multitude of air pollution sources, many of whose emissions are in the form of particulate matter (PM). Previous studies have associated exposure to such PM with adverse health effects. This potential consequence serves as the motivation for this study whose aim is to provide a realistic and detailed three-dimensional concentration field of PM, originating simultaneously from multiple sources. The IIBR in-house Lagrangian stochastic pollutant dispersion model (LSM) is suitable for this endeavor, as it describes the dispersion of a scalar by solving the velocity fluctuations in high Reynolds number flows. Moreover, the LSM was validated in urban field experiments, including in the HBA. However, due to the fact that the multiple urban sources reside within the canopy layer, it was necessary to integrate into the LSM a realistic canopy layer model that depicts the actual effect of the roughness elements’ drag on the flow and turbulent exchange of the urban morphology. This was achieved by an approach which treats the canopy as patches of porous media. The LSM was used to calculate the three-dimensional fields of PM10 and PM2.5 concentrations during the typical conditions of the two workday rush-hour periods. These were compared to three air quality monitoring stations located downstream of the PM sources in the HBA. The LSM predictions for PM2.5 satisfy all acceptance criteria. Regarding the PM10 predictions, the LSM results comply with three out of four acceptance criteria. The analysis of the calculated concentration fields has shown that the PM concentrations up to 105 m AGL exhibit a spatial pattern similar to the ground level. However, it decreases by a factor of two at 45 m AGL, while, at 105 m, the concentration values are close to the background concentrations.

1. Introduction

The Haifa Bay area (HBA) is a primary economic hub in Israel which resides in the southern Zevulun valley [1] (Figure 1, within the blue border). Several major industrial facilities reside in this area, such as an oil refinery, a fuel storage farm, petrochemical and agrochemical plants, and a power plant (Figure 1, red polygons). This area also hosts light industry and employment areas, including pharmaceutical factories, printer houses, and garages [2,3] (Figure 1, green polygons). The HBA is the location of Israel’s largest capacity seaport, which involves shipments of goods, fuel, and chemicals, as well as passenger transportation (Figure 1, orange polygon). In addition, several main roads pass through the HBA, especially the intercity roads that connect this area to the south, to the north-east, and to the south-east [4] (Figure 1, yellow lines). The Krayot, a cluster of four small cities, Kiryat Atta, Kiryat Bialik, Kiryat Motzkin, and Kiryat Yam, also reside within the HBA. Added to these are two neighborhoods of Haifa, Kiryat Haim and Kiryat Shmuel (Figure 1, purple polygons). The overall population of these residential areas is 200,000.
The traffic, shipping operations, and industrial activity in the HBA were all found to serve as local sources of air pollution [3]. Among these are emissions of particulate matter (PM). There is evidence, supported by many studies, that exposure to inhalable PM, and explicitly coarse (PM10) and fine (PM2.5, diameter < 2.5   μ m ) particulates, may be associated with health hazards [5]. For example, exposure to PM2.5 in urban environments was found to be associated with increased risk of respiratory disease, such as chronic obstructive pulmonary disease and acute lower respiratory infections, as well as cardiovascular problems [6,7]. Long-term exposure to traffic-related PM10 was found to be associated with the risk of the development of asthma among children, and may also affect the regulation of the cardiovascular system [8,9]. Specifically in the HBA, it was found that chronic exposure to PM10 induced by industrial and traffic sources was associated with lung cancer among males [10]. The potential health hazard to the population in the HBA serves as the motivation for this study, whose aim is to provide a realistic and detailed three-dimensional concentration field of PM from the local PM sources in the HBA.
Most of the pollutant sources in an urban environment are situated within the canopy layer. Traffic-related emissions, in particular, are near-surface sources. The complex morphology of the urban terrain is characterized by various types of buildings, industrial installations, vegetation, bridges, and infrastructure that all are associated with different degrees of obstruction to the wind flow. However, in some cases, it is possible to model the transport and dispersion of a single near-surface source within an urban environment by simplistic models, whose results compare reasonably well to measurements [11,12,13]. This is achieved by carefully fitting an appropriate set of parameters, such as the wind direction, friction velocity, or the lateral and vertical displacement and plume width [11,12,14].
Quantitative modeling of pollutant dispersion in urban environments has been the focus of numerous studies in the last few decades (for an overview, see [15,16,17]). When an attempt to gain efficiency was the focus, the modeling approach is usually based on Lagrangian stochastic models (LSM) for transport and dispersion [18]. The LSM approach consistently describes the gas dispersion phenomena in rather complicated atmospheric scenarios, such as non-homogeneous turbulent regimes, complex terrain, and canopies [19], and is superior to advection–diffusion based approaches (see, e.g., [20,21]). The main methods included: computational fluid dynamics (CFD) simulations around hundreds to thousands of buildings (e.g., [15] and references therein), and the application of Reynolds-averaged Navier–Stokes equation (RANS) and large-eddy simulation (LES) complemented by LSM (e.g., [16,22,23]). A third approach is based on evaluating a diagnostic–empirical method [24], and using that to drive LSM [25,26,27]. This approach relies on a guess to the wind field, based on as many as needed urban canyon scale diagnostic–empirical estimates for the different buildings configurations. This within street resolution guess is then solved for mass consistency (mass conservation), a computationally demanding process due to the need to account for the excluded solid volumes of the buildings. This approach was shown to be successful for planar urban areas. The key limitations of the all the above, which account for the complex building structures, are that of excessive computational demand (leading to the use of substantial computational resources), and often difficulty in extending to more complex and general canopies such as a city scale over complex terrain and “mixed” urban canopies which include vegetative “green” areas.
While modelling dispersion from a single source can be appropriate for scenarios of a deliberate or accidental pollutant release, the multiple PM pollution sources in the HBA originate simultaneously. Under such conditions, simplistic models are not applicable, as these require specific fitting of parameters for each of the many sources. The challenge of modelling multiple and simultaneous sources can be answered by a Lagrangian stochastic particle dispersion model. Such a model generates many ‘marked’ particles and follows the trajectory of each such particle in the turbulent flow [19]. As the evolution of each particle is modeled independently of other particles, Lagrangian stochastic models can cope with complex scenarios [18] and specifically integrate particles emitted from the various PM sources. Instead of relying on a specific set of parameters for representing the urban morphology in the vicinity of each source, it is necessary to integrate into the LSM a realistic canopy layer model that depicts the actual effect of the roughness elements’ drag on the flow and the turbulent exchange of the urban morphology.
Modeling the flow and dispersion in the lowest layer of the urban atmosphere must take into account the particular nature of the flow in canopies, which violates many assumptions of the classical surface-layer simplifications. The transfer of momentum and scalars within and right above canopy environments is influenced by scales due to turbulent motions arising from large canopy-scale coherent eddies [28,29]. These turbulent eddies exhibit fast de-correlation time due to the highly inhomogeneous nature of the flow within the canopy, which results also in a Gaussian shape of velocity probability function distribution [30]. This allowed Shnapp et al. [30] also to assess the formulation of the simplest general form of LSM (compared to the full model as in [18], suitable for dispersion in canopy flow, with a turbulent kinetic energy (TKE) dissipation rate shown to be approximately constant throughout the canopy.
The aim of this study is to provide a realistic estimation of the PM concentration field in the HBA. This will be fulfilled by utilizing the IIBR in-house Lagrangian stochastic pollutant dispersion model (LSM) [31]. This model can describe the three-dimensional dispersion of a passive scalar under neutral, unstable, and weakly stable stratifications. It was validated against field data from the Haifa 2009 urban campaign according the acceptance criteria for urban dispersion models [32]. The values of the various measures (defined in the Appendix A) were F B = 0.4 ,   NMSE = 0.49 ,   FAC 2 = 0.44 ,   NAD = 0.23 for neutral stratification, and F B = 0.5 ,   NMSE = 1.03 ,   FAC 2 = 0.38 ,   NAD = 0.29 for convective stratification. Therefore, according to the urban acceptance criteria (described in detail in the Appendix A) the IIBR in-house LSM is well within the acceptance constraints [31]. In this study, the Shnapp et al. [30] formulation of LSM is used, which is suitable for dispersion in canopy flow, and which matches the form of equations and TKE dissipation parametrization of the Fattal [31] model. In order to be able to describe a scenario of simultaneous PM emission from multiple sources, the IIBR in-house LSM model was coupled with an efficient canopy layer model, based on double averaged (space–time) Navier–Stokes equation on the neighborhood-scale [33].

2. Methods

2.1. Modelling Approach

Lagrangian stochastic particle model for single-particle trajectories is by far the most accepted and established dispersion modeling approach for realistic atmospheric scenarios (e.g., [34]). This approach is based on the hydrodynamic equations of motion, as well as on the statistical theory of turbulence of Kolmogorov and Obukhov 1941, valid for large or infinite Reynolds numbers in the inertial-range [35]. The main theoretical advantage, and in particular for the adaptation of this approach for pollutant dispersion, is a dramatic simplification gained by the Markovian formulation [36]. This is because the nonlinear convective term of the Navier–Stokes equation dictates an interaction of all existing scales, while a stochastic Markovian process can be fully determined by taking into account only two adjacent scales [37]. This leads to the well known formulation via the Fokker–Plank equations for the evolution of the one-particle velocity probability distribution function (PDF), and its parallel generalized Langevin equations for ‘marked’ particles. Obukhov further determined the dissipative coefficient using the Kolmogorov–Obukhov theory [36].
This general framework for inhomogeneous turbulence was complemented by the addition of the well-mixed necessary criterion of Thomson [18] for determining the deterministic conditional mean acceleration (drift) term coefficient. Based on the Novikov’s [38] integral relation (which relates the Lagrangian and Eulerian PDFs) the well-mixed criterion constrains the Eulerian and Lagrangian statistics, generated by the model to be consistent, and assures consistency with the second law of thermodynamics. Pope has shown that a consistency requirement should be added, such that the averaged velocity should satisfy the continuity equation (termed also as mass consistency) [39]. Another step forward was the ‘zero-spin’ necessary condition [40,41] preventing the mean rotation of Lagrangian trajectories. Although the model is formally non-unique (except for the one-dimensional case), it was shown to be unique up to an error of a few percentage points in predicted dispersion statistics for shear-induced turbulence [42].
The Thomson formalism relies on a pre-assumed one-particle Eulerian (and therefore measurable) information on the velocity PDF of the background flow. Moreover, the turbulent stress tensor, as well as its kinetic energy dissipation rate, need also to be specified a priori, and are usually based on parametrizations (e.g., [4]). The form of the velocity PDF is deduced from theoretical considerations, as well as from measurements, and was shown to be a quadratic Gaussian for the near neutral atmosphere and a superposition of two such Gaussian PDFs for the convective cases [19].
It should be noted that while one-particle Markovian models are consistent with the Kolmogorov–Obukhov 1941 theory [36], at short times when turbulent intermittency effects are important, a model consistent with the Kolmogorov–Obukhov 1962 theory is required (e.g., [43]). Another point is the vanishing effect of molecular diffusivity on turbulent dispersion, which, except for near wall scenarios (in wall   units ,   below   values   of   y + < 50 ), is negligible for flows at high Reynolds numbers [44].
This approach is usually implemented numerically (for some particular cases, an analytical solution exists (e.g., [20])) via the generalized Langevin equations of the modeled scenario by initializing trajectories of ‘marked’ particles from a pollutant source or sources. These trajectories are integrated in time and are recorded as concentration, facilitated by counting the particles at each spatial sub volume for each time step. Statistical convergence is checked by increasing the number of particles such that a convergence to an ensemble average is reached.

2.2. The IIBR Lagrangian Stochastic Model

In this study, a mass-consistent Lagrangian stochastic model (LSM), which was developed at the Israeli Institute for Biological Research (IIBR) [31], has been utilized. This model was formulated for the urban canopy, including over complex terrain, and was validated against an urban atmospheric tracer release field campaign in the city of Haifa (on the Camel Mountain), exhibiting full compliance with all statistical acceptance criteria for urban dispersion models [31]. Following is a brief description of the model for the urban canopy under near neutral stratification (for more details see [33]).
The first-order Lagrangian stochastic process is formulated by calculating the Lagrangian trajectories of fluid parcels (referred to as ’particles’). The velocity perturbation u   u 1 , u 2 , u 3 = u , v , w :   along   wind , cross   wind   and   vertical   coordinate at the particle position x p x p 1 , x p 2 , x p 3 = x p , y p , z p , and time t about the local Eulerian mean velocity U E i can be written as U E i x p , t + u i x s , t ( x s is the source position). A ’new’ particle velocity is initiated as a Gaussian random variable of zero average and of variance 2 v i 2 . These passive ’particles’ are ‘marked’ at time zero, according to a velocity PDF, at the point or volume of the pollutant source. This leads to the following set of generalized Langevin equations (GLE) for particle displacement and velocity fluctuation/perturbation:
d x i = U E i + u i d t   d u i = a i u i , x i d t + b i j d W j t
where d W i is an increment of the Wiener process, i.e., Gaussian random variate with average d W i = 0 and variance d W i d W j = d t δ i j [45]. Using the Kolmogorov 1941 similarity theory, we obtain the following: d u i d u j = C 0 ϵ d t δ i j = b i 2 d t δ i j , where d u i d u j is the velocity structure function, ϵ is the average dissipation rate of the turbulent kinetic energy (TKE), and C 0 is the so-called Kolmogorov constant.
Recent direct Lagrangian measurements in highly inhomogeneous canopy flows (modeled at the IIBR environmental wind tunnel [46]) have shown the validity of the Kolmogorov 1941 velocity structure function scaling, despite an observed large-scale intermittency which affects the energetics of trajectories [47]. The value of C 0 is known to vary on a broad scale of values between 2 and 8 (for an overview, see [48], and for recent extension to canopy flow from direct Lagrangian measurements, see [30]). In order to avoid calibration, its specification must be based on relevant observations or modeling. In this study, we use C 0 = 3 , based on [49,50], and we also note that, as [49] shows, the mean concentrations are not very sensitive to small changes in C 0 .
The choice of the velocity PDF depends on the statistics of the flow. In an urban canopy, the flow is known to be highly inhomogeneous. Although some intermittent higher moments of momentum are present due to an ejection-sweep burst cycle (e.g., [51]), it was shown that when it is accompanied with highly inhomogeneous flow, there exists a rapid decorrelation of the Lagrangian time-scales, and the inhomogeneity dominates [30]. This was further shown to lead to a velocity probability function which is well approximated by a one-particle Gaussian Eulerian velocity-fluctuation PDF, P E as [30]:
P E = 1 2 π 3 / 2 d e t τ i j 1 / 2 e x p 1 2 u i S i j u j ,
where S i j = τ i j 1 and τ i j = u i u j ¯ are the stress tensor elements. By using the Fokker–Planck equation, P E may be considered to be a prescribed property of the turbulence, and therefore constrains a i via the well-mixed condition of Thomson [18]:
a i P E = 1 2 C 0 ϵ P E u i + ϕ x , u , t ;   ϕ i u i = P E t x i u i P E ,  
with ϕ i 0 as u . We use in this study the particular solution of Thomson, termed ‘simplest solution’, for the above Gaussian Eulerian velocity-fluctuation PE [52], which was found to be the simplest one to fulfil the ‘zero-spin’ criterion [40,41].
For near neutral stratification, the use of a Gaussian PDF of the form as in Equation (2) is known to be a good approximation [19]. In this case the non-diagonal elements of the stress tensor cannot be neglected, because the correlation between the vertical and horizontal wind fluctuations are crucial for the pollutant dispersion. Hence, the drift term for stationary non-isotropic and quasi-homogeneous turbulence, relative to the canopy spatial representative averaging scale, takes the form (consistent with [30]):
a u = 1 2 σ u 2 σ w 2 u * 4 b u 2 σ w 2 u + u * 2 w a v = 1 2 σ v 2 b v 2 v a w = 1 2 σ u 2 σ w 2 u * 4 b w 2 u * 2 u + σ u 2 w + 1 2 σ u 2 σ w 2 u * 4 u * 2 σ w 2 z u w + σ u 2 σ w 2 z w 2 + 1 2 σ w 2 z
where a transformation to along wind coordinates was used, i.e., taking the y coordinate as perpendicular to the averaged wind direction, U . u , v ,   w are the along wind, cross wind, and vertical components of the velocity fluctuations, σ i 2 i = u , v , w are the corresponding velocity variances, and b u , v , w 2 = C 0 ϵ , with ϵ is the TKE average dissipation rate.

2.3. Inertia Effects

Several studies have modelled the transport and dispersion of PM with a diameter less than 20 µm by a Lagrangian stochastic approach (e.g., [53,54,55,56]). Although there are studies that accounted for different physical and biological phenomena affecting the PM ([55,56]), most studies assume that the dispersal of these PM is not significantly different than the dispersal of a passive tracer. It should be noted that if the assumption about PM evolving as a passive scalar is relaxed (i.e., for larger particles), then the Generalize Langevin model of Equation (1) can be further generalized for the fluid velocity along the inertial particle trajectories, see, for example, [57,58,59].
The mean and range of dry deposition velocity measurements of ambient particulate elements is 1.7   0.1 11   cm / s   and 2   0.1 12   cm / s for PM2.5 and PM10, respectively [60]. When dealing with particles whose diameter is no greater than 10   μ m , which their typical dry deposition velocity is of a few centimeters per second, it can be argued that the effect of particles removal from the atmosphere due to deposition is less important than the role of turbulence. Therefore, when estimating the concentrations of PM10 and PM2.5, the removal effect by deposition can be neglected [61]. The results of Yuval and Broday [62] provide evidence for this argument. They have used an ordinary kriging interpolation scheme in order to calculate maps of three-years mean concentration of several pollutants in the HBA. Then, they compared the spatial patterns of each pair of pollutants by calculating the Pearson correlation over all corresponding grid points. The spatial pattern of PM10 concentrations in the HBA was found to be correlated with the pattern of a gaseous pollutant, N O x [62]. Regarding the time series of PM2.5 in the same area, it was found to be correlated with another gaseous pollutant, C O ,   S O 2 [3].
Traffic is a major contributor to the anthropogenic PM10 concentrations in the HBA. The density of such particles depends on the engine’s load, and ranges between 0.8   and   2   g / cm 3 [63]. The anthropogenic PM2.5 in the HBA consists mostly of particulate sulfates and nitrates [64]. The majority of sulfate species in the atmosphere are sulfur trioxide, sulfuric acid, ammonium bisulfate, and ammonium sulfate [65]. Particulate nitrates consist mostly of sodium nitrate and ammonium nitrate [66]. The density of these species ranges between 0.6   and   2   g / cm 3 . It can be shown theoretically, based on the fact that the maximal density of these species is 2   g / cm 3 , that the ratio of aerosol diffusion coefficient K z to gas diffusion coefficient K z g [67] is approximately unity (up to less than 0.1%), i.e., inertial effects are thus negligible.

2.4. Canopy Layer Model and Surface Layer Parametrizations

As a canopy model, based on [68,69], we adopt an approach by which the canopy is treated as patches of porous media, on the canopy sub-urban-block horizontal heterogeneity scale, to which the flow adjusts (for a detailed description, see [33]). This approach is based on a solution of the doubly averaged (time–space) one-dimensional Navier–Stokes (DANS) equation,
τ z F D = 0
where τ is the turbulent shear stress, F D = U 2 / L c the kinematic drag, L c = c d a 1 the average canopy-drag length scale with a dimensionless drag coefficient c d , and a being the effective frontal element-area per unit volume. L c is modeled based on the averaged morphological scales [68],
L c h c 1 λ p λ f
assuming constant c d 2 for urban canopy [70], where λ f is the frontal area density ratio, λ p the plan area density is the ratio of the occupied and total plan area, and h c is the plan area weighted average building height [71]. Thus, the effect of the canopy on the flow is as adding a drag force induced by the canopy’s roughness.
This approach can deal with inhomogeneous canopies. In real urban canopies, the averaged morphological statistical parameters ( h c , λ f , λ p ) change from area to area. In particular, each neighborhood is usually characterized by different statistical parameters. When the averaged characteristics of the canopy elements vary in space, the canopy length scale, L c , varies as well. Another issue is the distance of adjustment of sparser to denser urban canopy, i.e., the fetch needed for the wind to adjust to the canopy density. It was shown that the canopy adjust after a length-scale of the order x 0 = 3 L c ln K [70], with ln K K = U h / U h c / L c , and U h = U z = 0 being the mean wind speed at the top of the canopy, which depends on upwind conditions and less on local canopy parameters. x 0 can be seen as a dynamical definition of the size of a neighborhood [70].
We thus assume that the whole city is composed of many smaller patches, each being approximately homogeneous [72]. Accordingly, the horizontal averaging area has dimensions of L A × L A , where the length scale L A over which spatial averaging is performed must be larger than the building spacing, but less than the length scale x 0 over which the flow is evolving. In the following, we chose the sub-urban-block scale with the horizontal averaging length of L A = 250   m (for further discussion on the scales, see [33]).
According to the mixing layer hypothesis [28], the mean velocity profile has a characteristic inflection point at the canopy top, caused by the two co-flowing streams of different velocities (of the canopy and above it). As a result, the wind profile in the roughness sub-layer (RSL) consists of a logarithmic profile above the canopy and an exponential profile within the canopy, with an inflection point separating them (first proposed by [73]). Two different mixing lengths are involved: a constant mixing length within the canopy, and a mixing length proportional to z + d above the canopy [74], where d is the displacement height of the logarithmic profile, we obtain after mathematically matching both profiles:
U z = U h e β z l ,                             h c z 0 u * I S L β κ ln z + d z 0 ,                   0 z
where κ = 0.4 is the von Kármán constant, z 0 and d are the displacement height and surface roughness length respectively (calculated for each urban block patch following [75] parametrizations), U h = U z = 0 is the mean wind speed at the top of the canopy, u * I S L is the reference friction velocity in the inertial sub-layer (ISL), and l is the mixing length in the canopy (found to be approximately constant, even in canopies with significant vertical heterogeneity [75]). In addition, β = u * U h represents the momentum flux through the canopy, which is approximately 0.3 for closed uniform neutral canopy. Therefore, using Equation (7) requires the knowledge of two parameters—the mean speed at canopy height U h which will be discussed later, and the mixing length l .
The mixing length is calculated using a formulation, which relies on spatial averaging of the urban morphology, with the assumption that the canopy is laterally uniform on a scale much larger than the canopy elements. Hence, the mixing length can be related to the morphology of the city by
l = 2 β 3 L c = 2 β 3 h c 1 λ p λ f
The morphological parameters were calculated by analysing geographic information system (GIS) data for the relevant regime, in the following way: the space is divided into uniform square cells; for each cell, h c is calculated as the plan area weighted average building height. The calculation of λ p , for every cell, is performed directly from its definition as the ratio of the occupied and total plan area. Finally, the calculation of λ f is performed by averaging the frontal area of each building normal to the wind direction over all the buildings contained within the cell.
Turbulent structure in the inertial sublayer is usually described in terms of Monin–Obukhov similarity theory (MOST) based on its assumptions, namely: stationarity, horizontally homogeneity, and the existence of constant flux layer (within the range of 10–20% [76]). In addition, as stated above, we assumed a Gaussian velocity distribution function, so modeling is required only up to second order turbulent quantities, namely, velocity standard deviations, σ i , and the turbulent dissipation rate, ε z , required for the stochastic dissipative term.
In near neutral atmospheric stability conditions defined using the MOST stability parameter ζ = z d / L   a s   ζ 0.8 , (see, e.g., [77]), the vertical profiles of the wind velocity standard deviations σ i z i = u , v , w , can be calculated from the inertial sub-layer friction velocity u * I S L
σ u u * I S L = σ v u * I S L = 2.5 , σ w u * I S L = 1.25
We also assume (following [78]) some decline in the wind fluctuations, with height described by multiplication of the above wind fluctuations by a slowly descending function e 2 f c z / u * I S L , with f c = 0.0001   s 1 being the Coriolis parameter.
In the RSL based on [79], we further assume that the square root of the turbulent kinetic energy σ u 2 + σ v 2 + σ w 2 changes within and above canopy as a e b z / h c c 2 · z / h (i.e., for z < 2.5   h c , h c being the averaged buildings height), with the constants a = 0.8 ,   b = 0.9 ,   c = 0.7 taken as best fit to [79].
For the parameterization of the turbulent dissipation rate ε , we follow the parameterization of [78] for the Lagrangian correlation time using T L i = 2 σ i 2 C 0 ε , which was tested for flat urban canopy [80]:
T L u = T L v = T L w = 0.5 z σ w 1 + 15 2 f c z u * I S L  
We further assume that the turbulent dissipation rate is approximately constant within the canopy, as recently measured in direct Lagrangian measurements [30,46].

2.5. Input Fields

2.5.1. Canopy Model Parameters for Inhomogeneous Urban Area

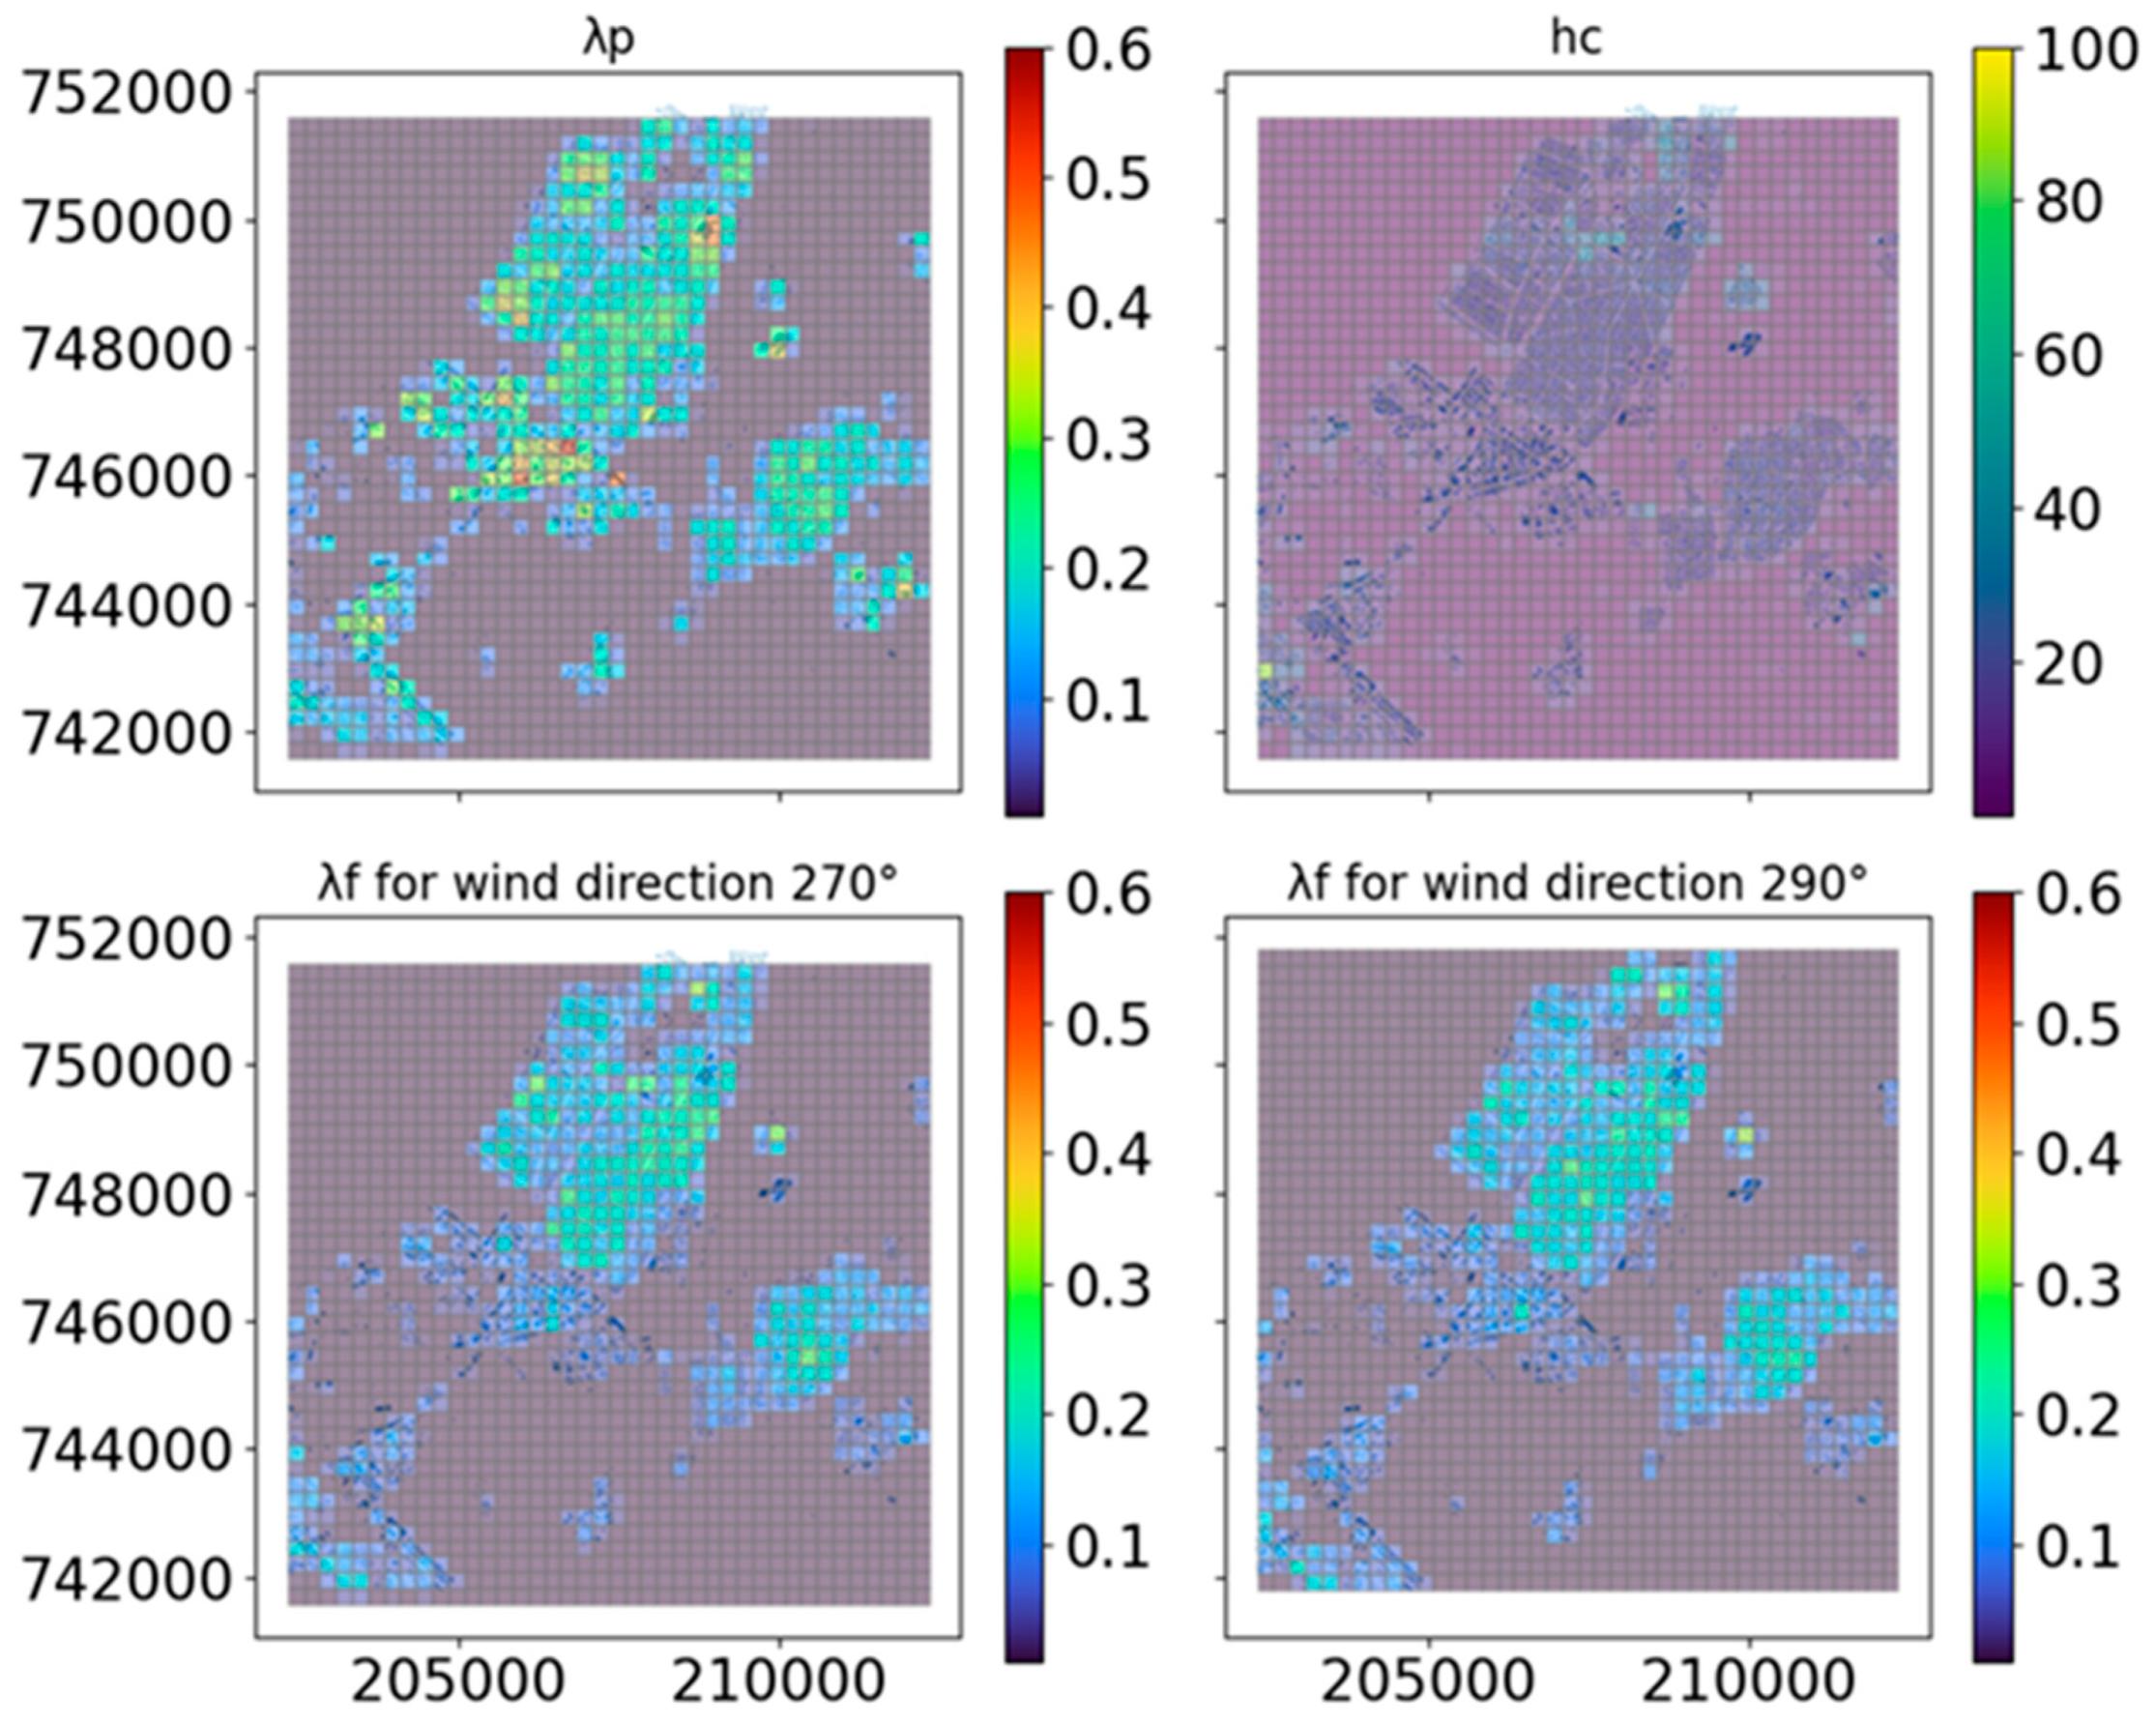
The morphological parameters were calculated for HBA for horizontal averaging length of L A = 250   m . In Figure 2, maps of λ f ,   λ p and h c are given for every 250   m × 250   m cell. As λ f depends on the wind direction, different maps are given for the two typical wind directions examined in this study, 270 ° and 290 ° (according to [4], see Section 3.1). h c is measured in meters, while the ratios, λ f and λ p are expressed as decimal numbers from 0 to 1. Since most of the impact on the dispersion comes from the close surroundings of the source position, the morphological parameters for every simulation were taken as the values of these parameters at the source position.

2.5.2. Pollutant Sources

This pollution sources data was provided by the Israel Ministry of Environmental protection. It consists of two datasets: hourly inventory of traffic air pollutants by road sections for 2019 [81], and hourly inventory of air pollutants, point sources, and other source types for 2018 [82]. The traffic air pollutants data [81] consists of a list of all traffic routes in a regime of interest (in our case, the HBA). For every route, the expected emission rate at rush hour was estimated based on its width and vehicle type composition. The hourly time dependency was introduced by multiplying this value with a factor which represents the statistical expected reduction of traffic volume relative to the rush hour. It should be noted that these datasets do not include any information regarding the degree of uncertainty associated with the given pollution quantities.
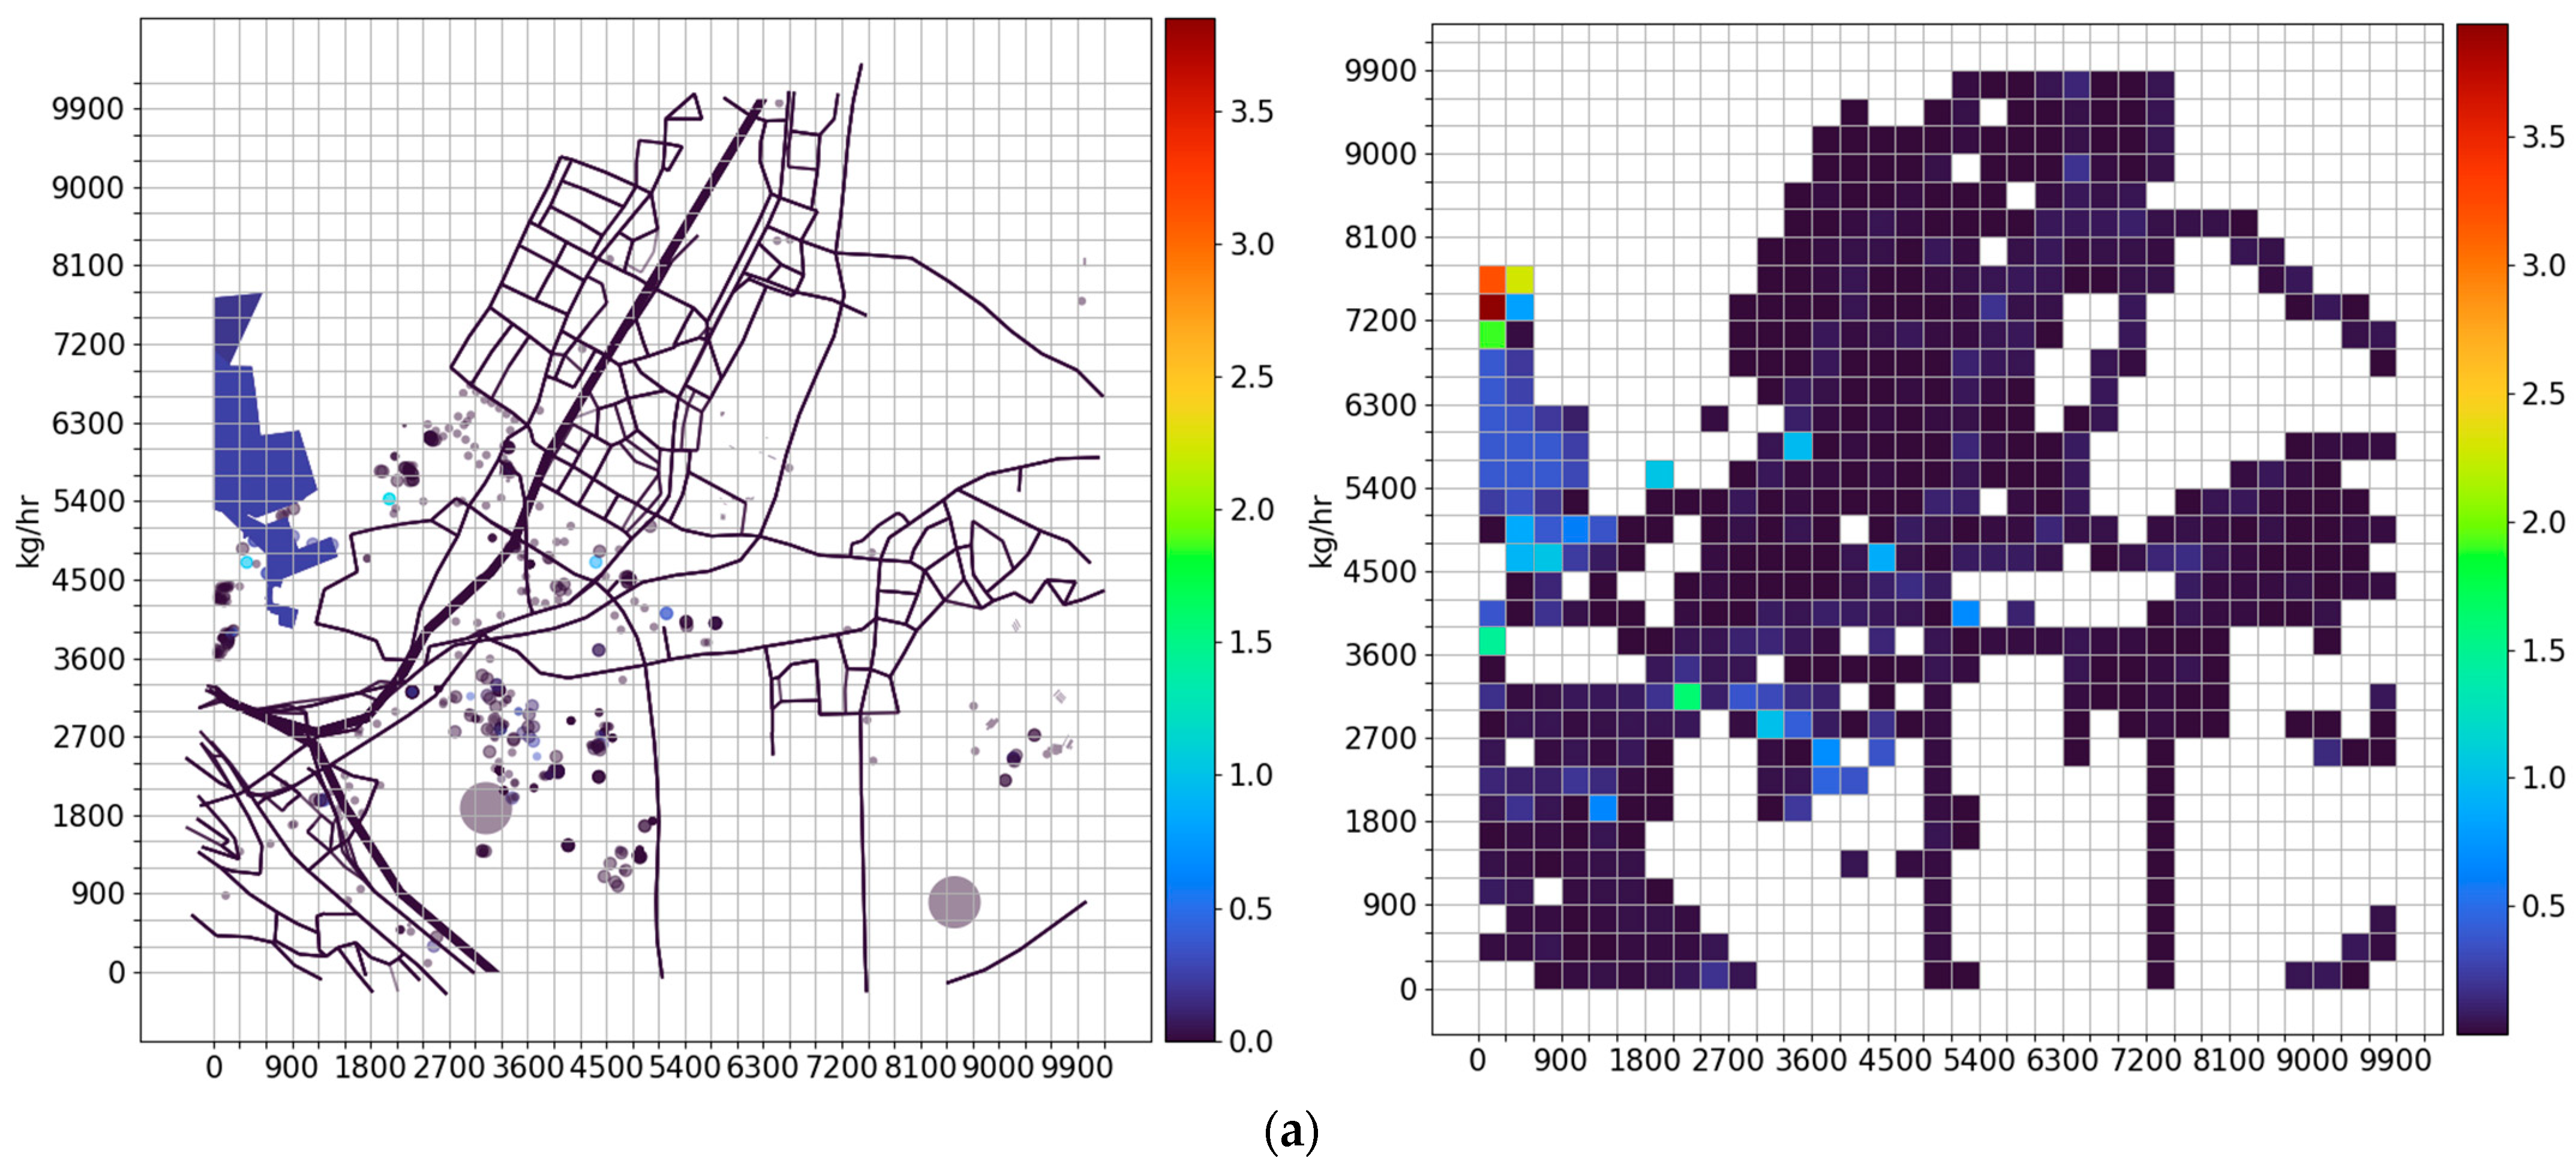
We have analyzed the traffic pollution in the HBA as areal sources for the LSM (see Section 2.2 regarding neglecting of inertial effects). All the relevant routes in the HBA are shown in the left panels of Figure 3 by blue lines. On the right panels: The area source map, constructed by summing all the pollution sources within every cell. The upper maps (Figure 3a) describe the PM10 sources, and the lower maps (Figure 3b) describe the PM2.5 sources. The overall area source maps of the PM10 and PM2.5 sources seem similar, however, on a closer look, it is possible to discern some differences. This result also applies to a comparison between the two rush-hour periods of the day, for a given particulate matter size. Although generally similar, some minor differences are apparent between the source maps during the morning (that are described in Figure 3) and evening (not shown here) rush-hour periods. Therefore, the LSM model was run for each of the combinations of particulate sizes and rush-hour period of day.

3. Results

3.1. Comparison of the PM Concentration Estimated by the LSM Model to Measurements

The LSM simulations were performed for the two rush-hour periods of the day, namely the morning period, between 0800 and 0900 h, and the evening period, between 1800 and 1900 h. During the day, the coastal area of Israel is governed by westerly winds, which are the result of the Mediterranean Sea breeze combined with the synoptic gradient winds, which usually dictate westerly forcing, especially during the summer season [83]. The reason the summer season was chosen as a test case for the model is the fact that during this season, the HBA, as part of the Eastern Mediterranean area, is rarely affected by dust storms, so anthropogenic PM sources are dominant [5,84]. These are mostly of local sources, but analysis of the chemical and mineralogical composition of PM10 and PM2.5 samples collected in Israel have provided evidence for long distance transport of anthropogenic PM from sources in Turkey, Greece, and Eastern Europe during the summer season [85,86,87].
This is opposed to the spring and winter seasons, during which the PM concentrations in Israel are higher and a considerable fraction of these are of natural PM sources. These are coarse biogenic pollen, as well as mineral dust transported from the Sahara and Arabian Peninsula deserts [84,88].
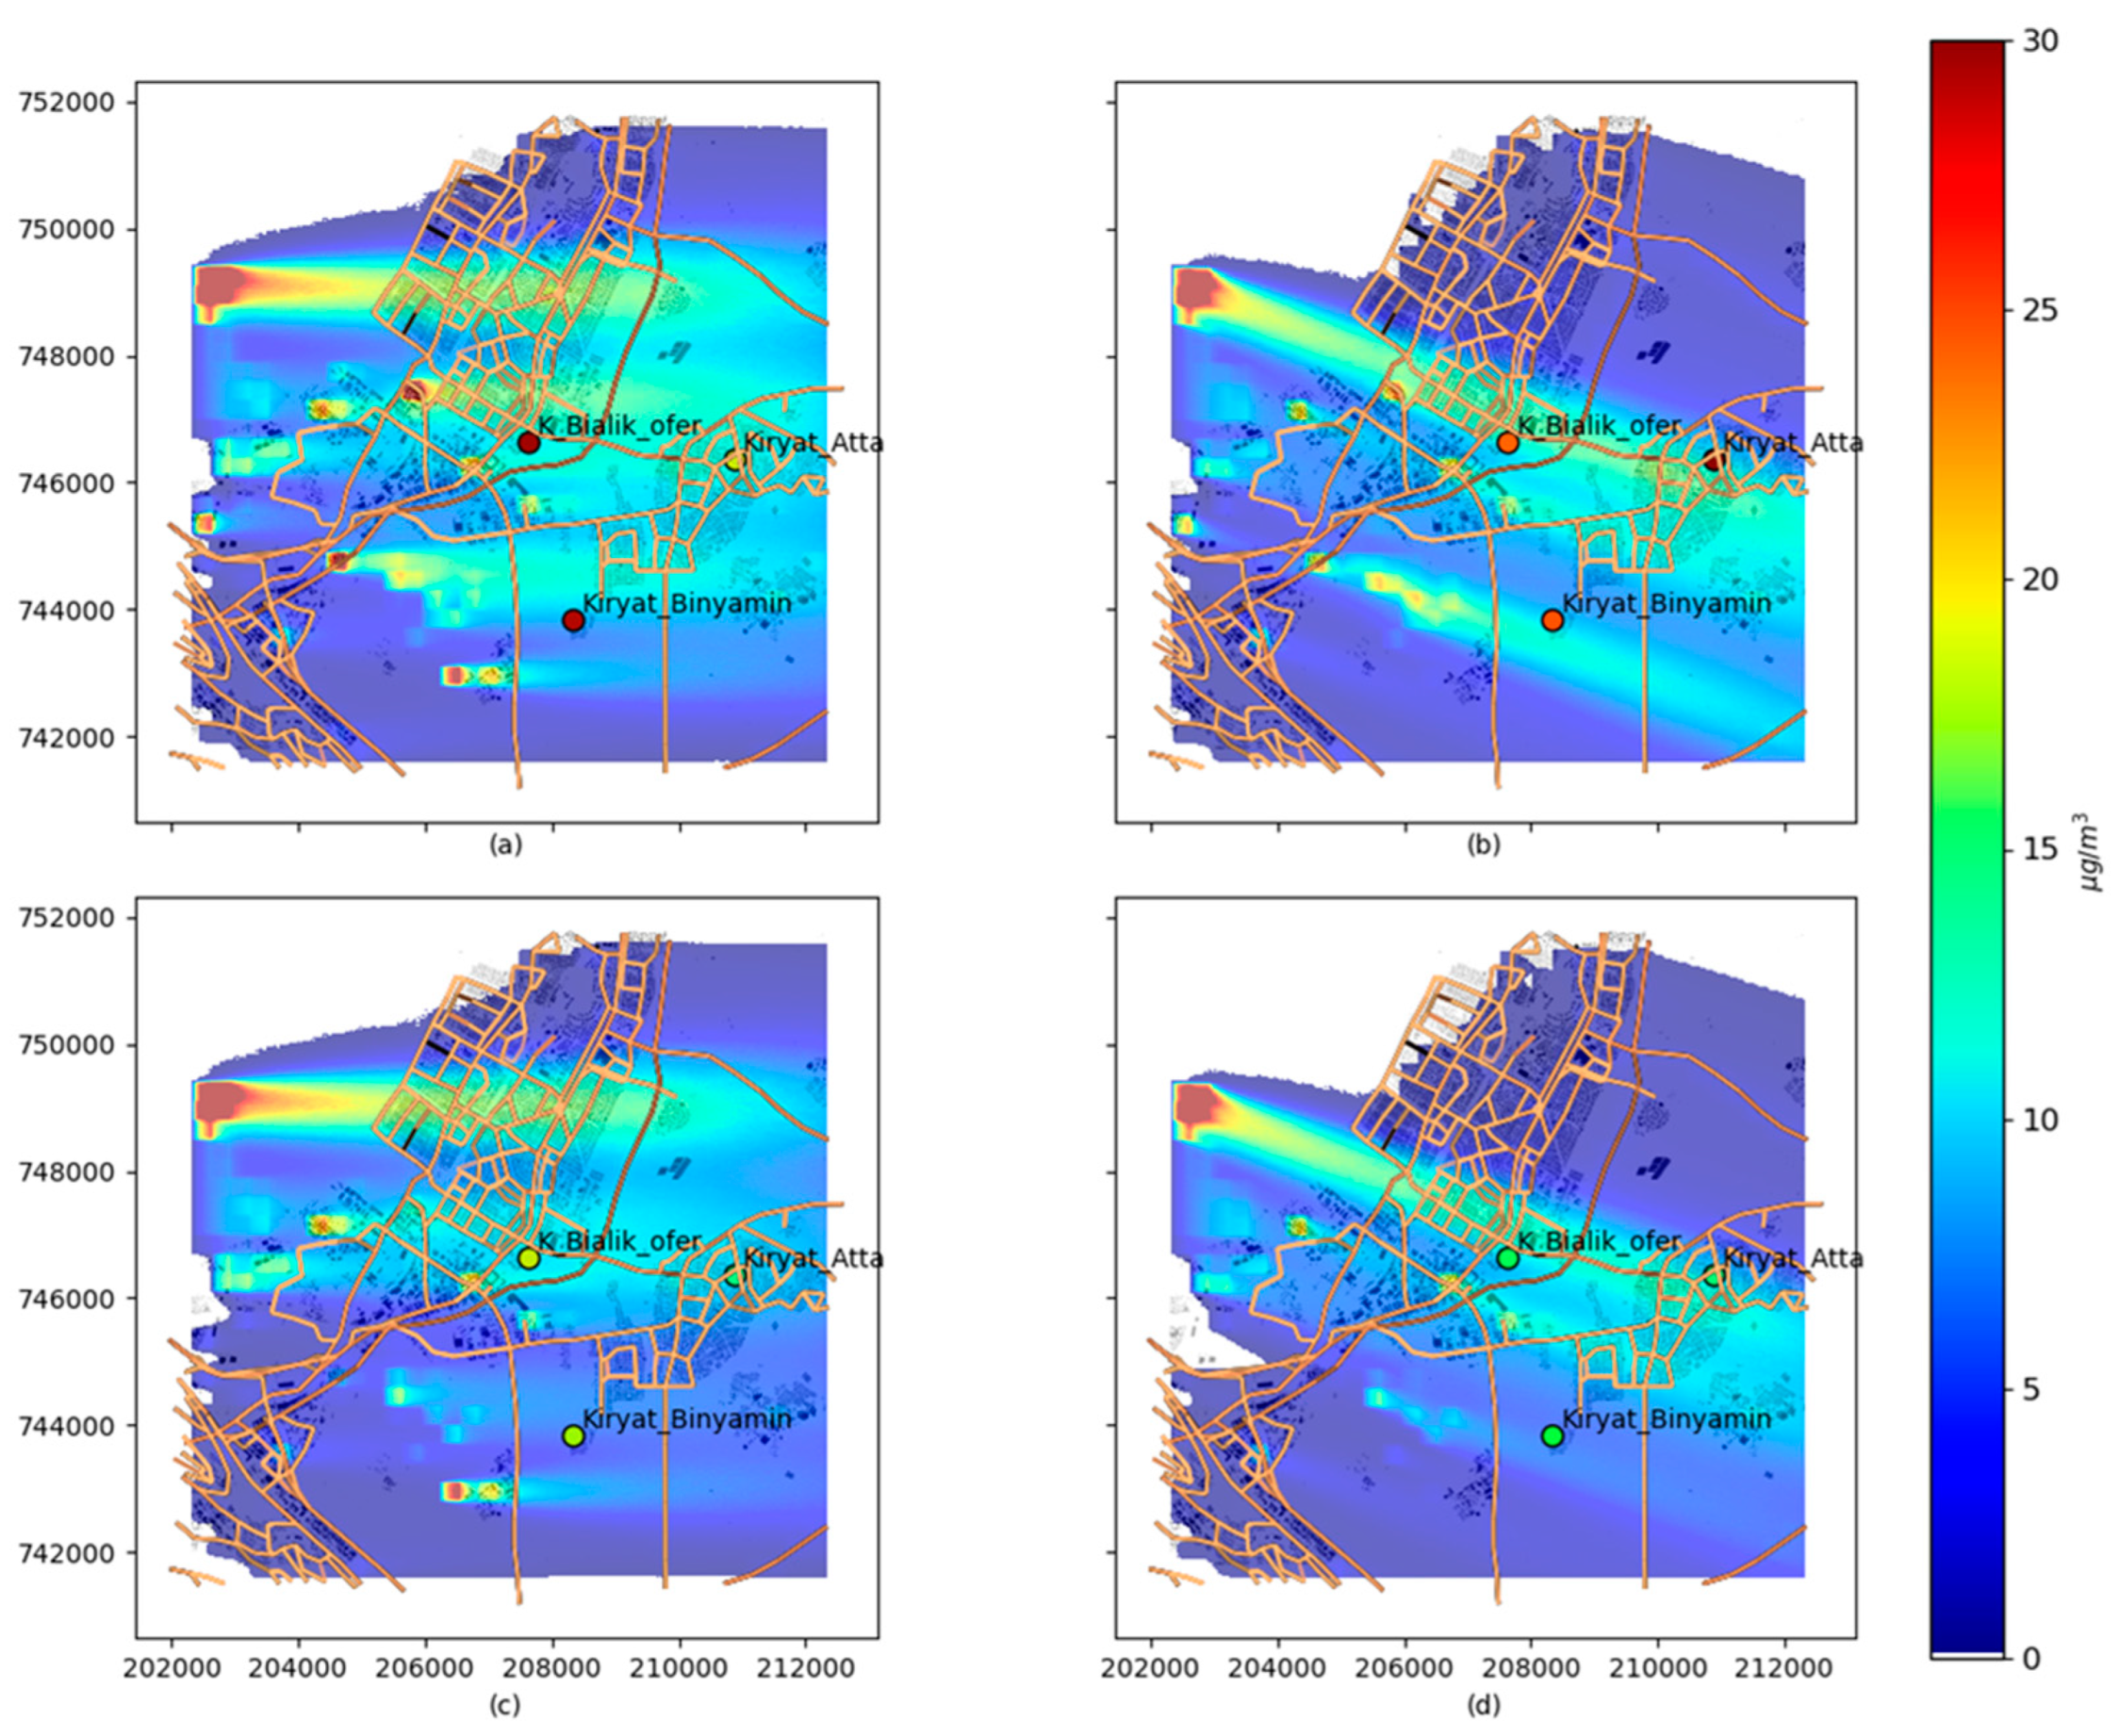
Therefore, a typical summer day in the HBA is characterized by a wind speed of 2   m / s and direction of 270° in the morning, and wind speed of 2.5   m / s and direction of 290° during the evening (Figure 4) [4].
Three air quality monitoring stations in the HBA are located downwind in the affected area of the PM sources in this area. These are located in Kiryat Binyamin, Kiryat Bialik, and Kiryat Atta (Figure 4). These stations provide 5 min measurements of the PM10 and PM2.5 concentration. In order to compare these measurements to the LST estimated concentrations, for each rush-hour period (0800–0900 h, and 1800–1900 h) an average PM concentration was calculated. The measurements were collected during June, a summer month, in the years 2017 (Kiryat Atta) and 2018 (Kiryat Binyamin and Kiryat Bialik). The average involved measurements collected during the workdays, which are Sunday to Thursday in Israel.
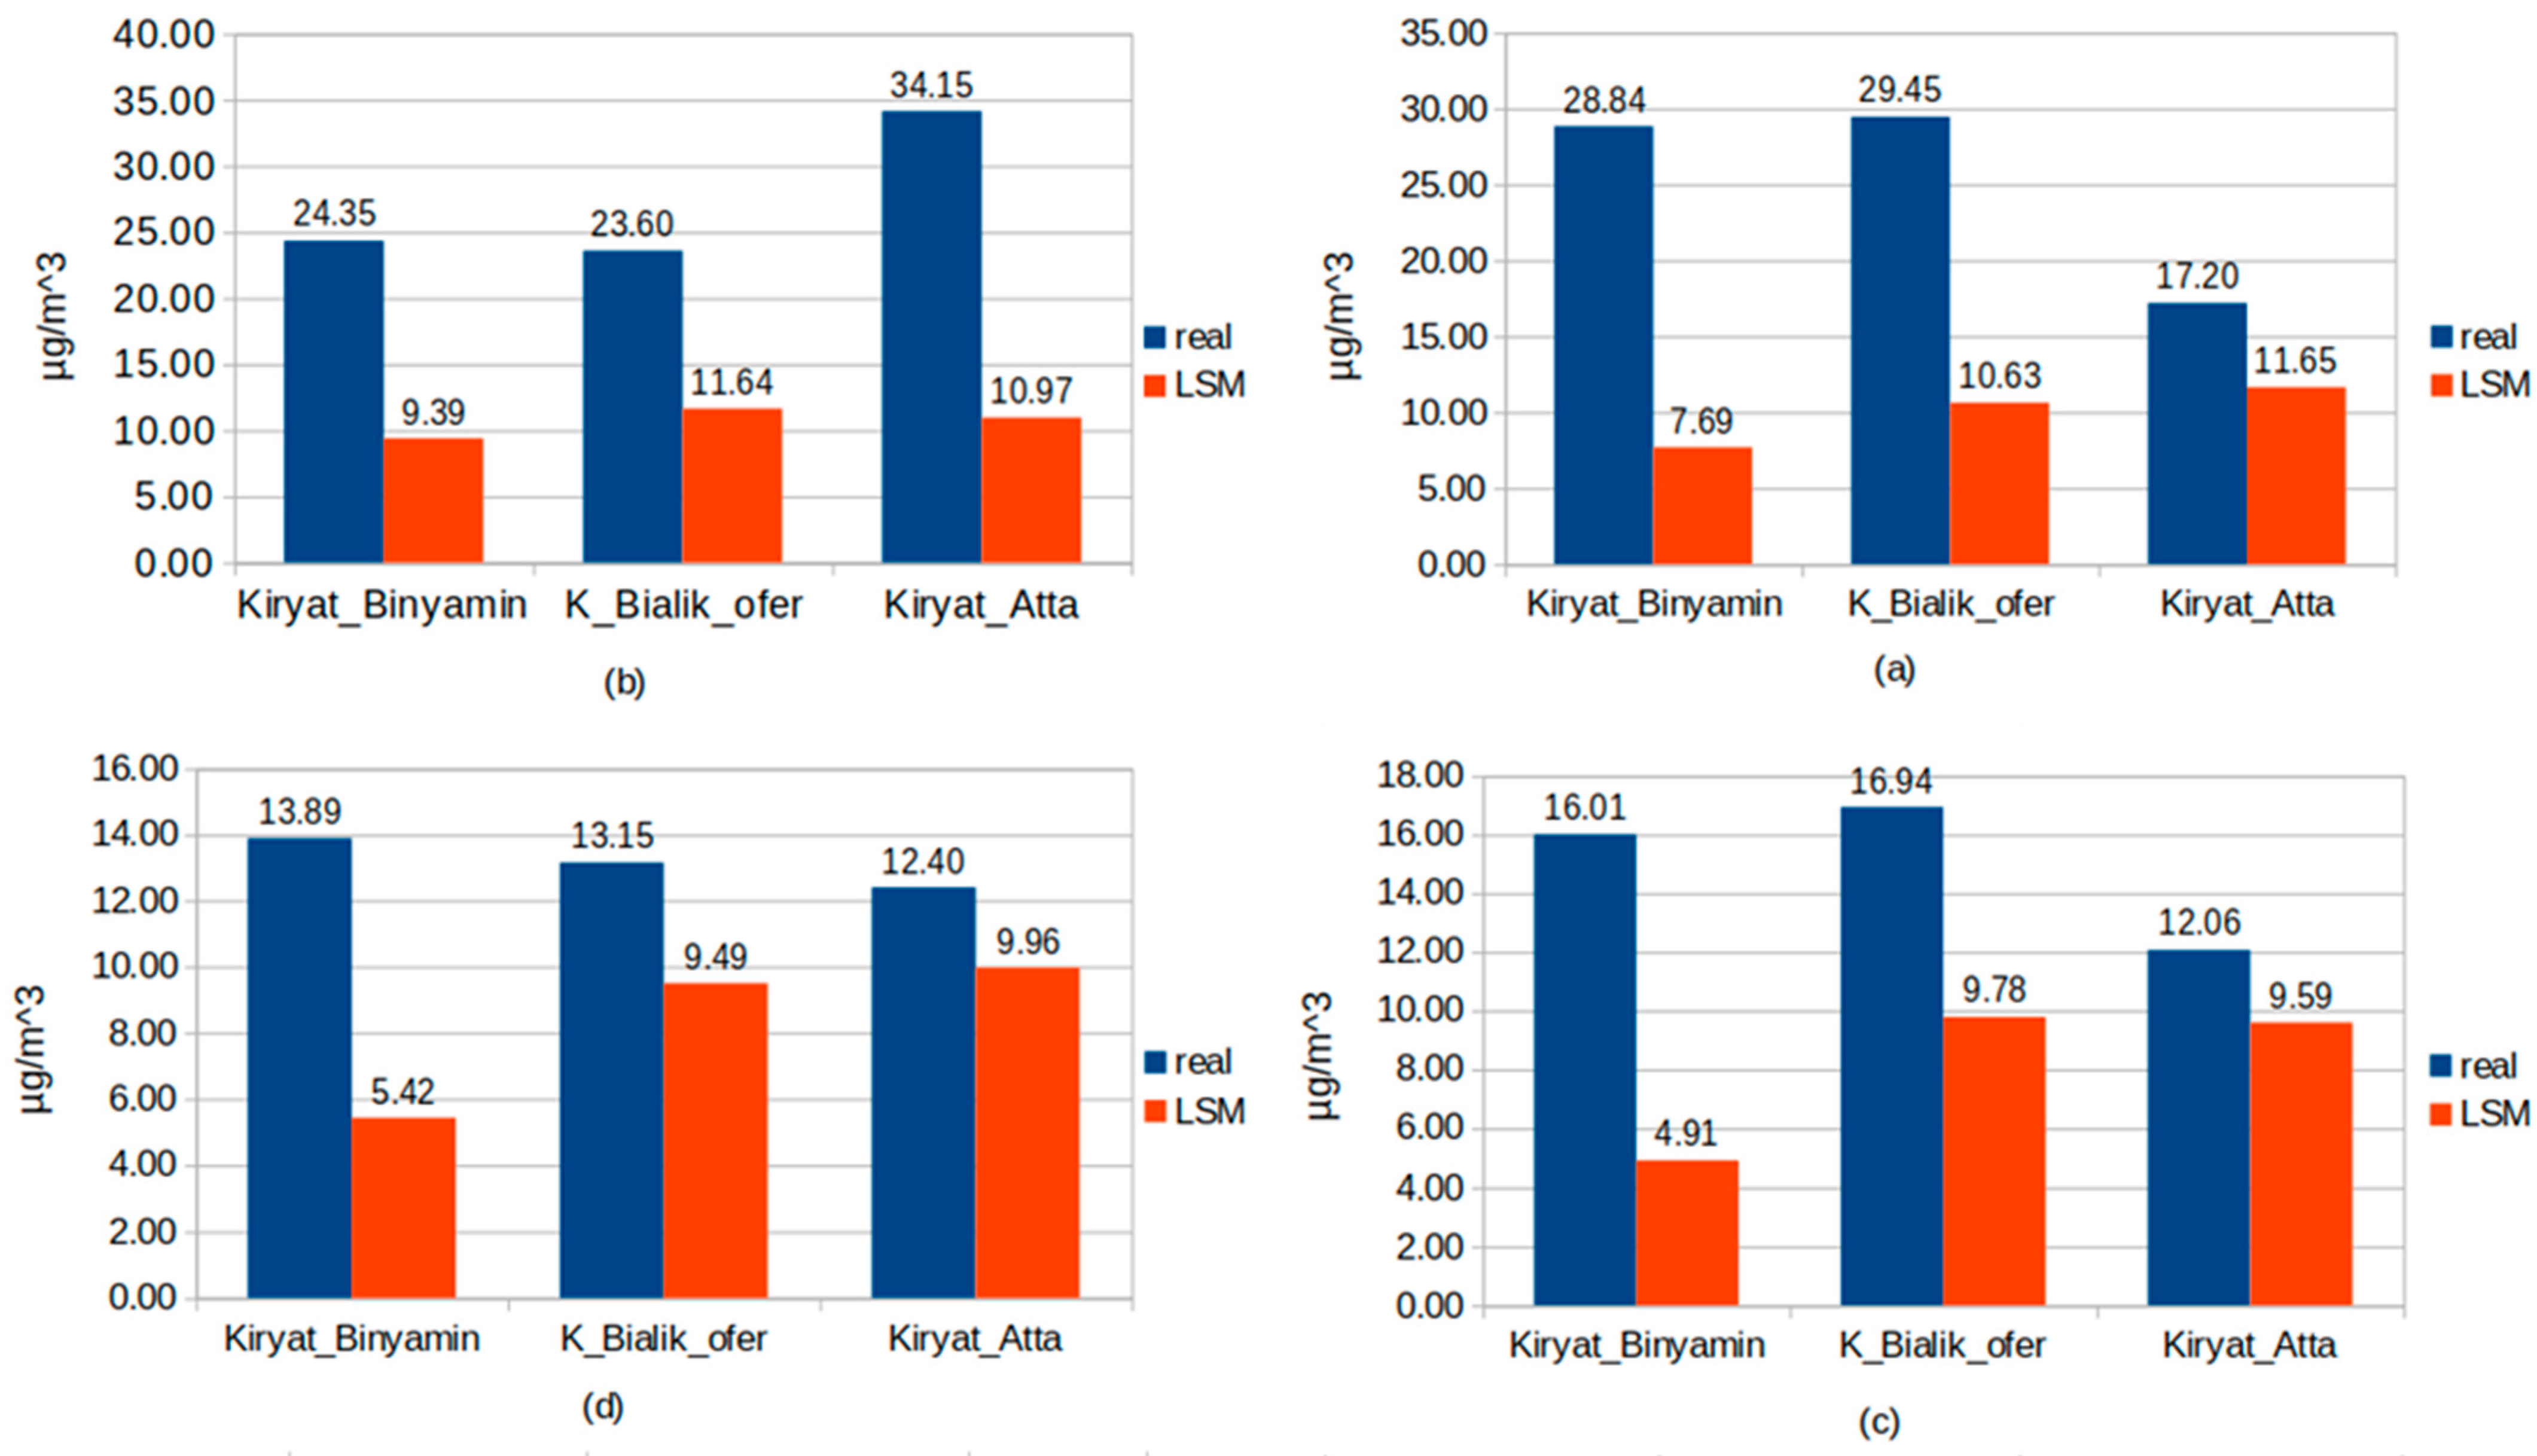
Comparison between the measured PM concentrations and the concentrations estimated via LSM result in relative differences that are smaller than a factor of two for PM2.5 in Kiryat Bialik and Kiryat Atta, and approximately a factor of three for Kiryat Binyamin (Figure 5c,d). Regarding the PM10 concentrations, relative differences of approximately a factor of two were observed in a single station, Kiryat Atta, in the morning, and Kiryat Bialik in the evening (Figure 5a,b). The other two stations resulted a relative difference of approximately factor of three, except Kiryat Binyamin in the morning, for which the relative difference was close to a factor of four. It should be noted that in both rush-hour periods and PM types, the LSM predictions were lower than the measured PM concentrations.
According to the acceptance criteria used to evaluate the performance measures of urban dispersion models ([32], see the Appendix A for the measures and criteria definitions), the normalized mean-square error, NMSE, and the normalized acceptance difference, NAD, should be no more than 6 and 0.5, respectively. This is indeed the case for all PM categories and rush hour periods (Table 1). Regarding the proportion of relative differences within a factor of two, FAC2, it is above 0.3 for all PM categories and for both rush hour periods in Table 1. The absolute fractional bias, F B , should be at most 0.67, as is the case regarding the PM2.5 predictions, but not those of the PM10 (Table 1). Therefore, it can be concluded that the LSM predictions for PM2.5 satisfy all acceptance criteria. Regarding the PM10 predictions, the LSM results comply with three out of four acceptance criteria.
The fact that better agreement was achieved for the smaller PM, the PM2.5 concentrations, cannot be explained by the effect of air chemical composition and meteorological conditions on aerosols’ sizes and masses, because the time required for particles to achieve gas–aerosol equilibrium depends on the particle’s size, where equilibrium time is shorter for smaller particles [89].
It should also be noted that the LSM results are a function of the local anthropogenic sources alone, e.g., traffic and industrial facilities, while the PM measurements in the HBA include also particulates from natural sources, as well as particulates of European anthropogenic origin arriving via long distance transport. While there are some studies that provided information regarding some unique chemical characteristics of particulates arriving to the HBA from Europe, it is difficult to separate the imported anthropogenic PM from the local ones [85,86,87]. Moreover, some studies have shown that a certain fraction of mineral dust, a particulate species that is generally considered as stemming from natural sources, originate from anthropogenic sources, and is actually fly ash produced by combustion processes [86,87]. Of the natural PM species, it was found that in seaside locations, marine aerosols and especially sea salt make a significant contribution to the overall PM10 mass concentration [90]. Such concentrations were found to range between 4   and   11   μ g / m 3 in Santa Barbara, California; 1 3   μ g / m 3 on the coast of Portugal; 3 7   μ g / m 3 in the area of Athens, Greece; and 5   μ g / m 3 in Dar es Salaam, Tanzania on the Indian Ocean coast [91,92,93,94]. Measurements in Haifa resulted in sea salt concentrations of 3.7   μ g / m 3 , which is in the range of the concentrations measured in other seaside locations [95]. With the deduction of the contribution of marine aerosols to the PM10 measurements, the absolute fractional bias, F B , decreases to 0.76 in the morning rush hour period and 0.73 for the evening period. The fact that the use of an estimated sea salt concentration drew the F B performance measure closer to the acceptance criterion of 0.67 demonstrates the importance of well-established quantitative information on the contribution of natural PM to applications that deal with local anthropogenic sources.

3.2. Modelled Three-Dimensional PM Fields in the HBA

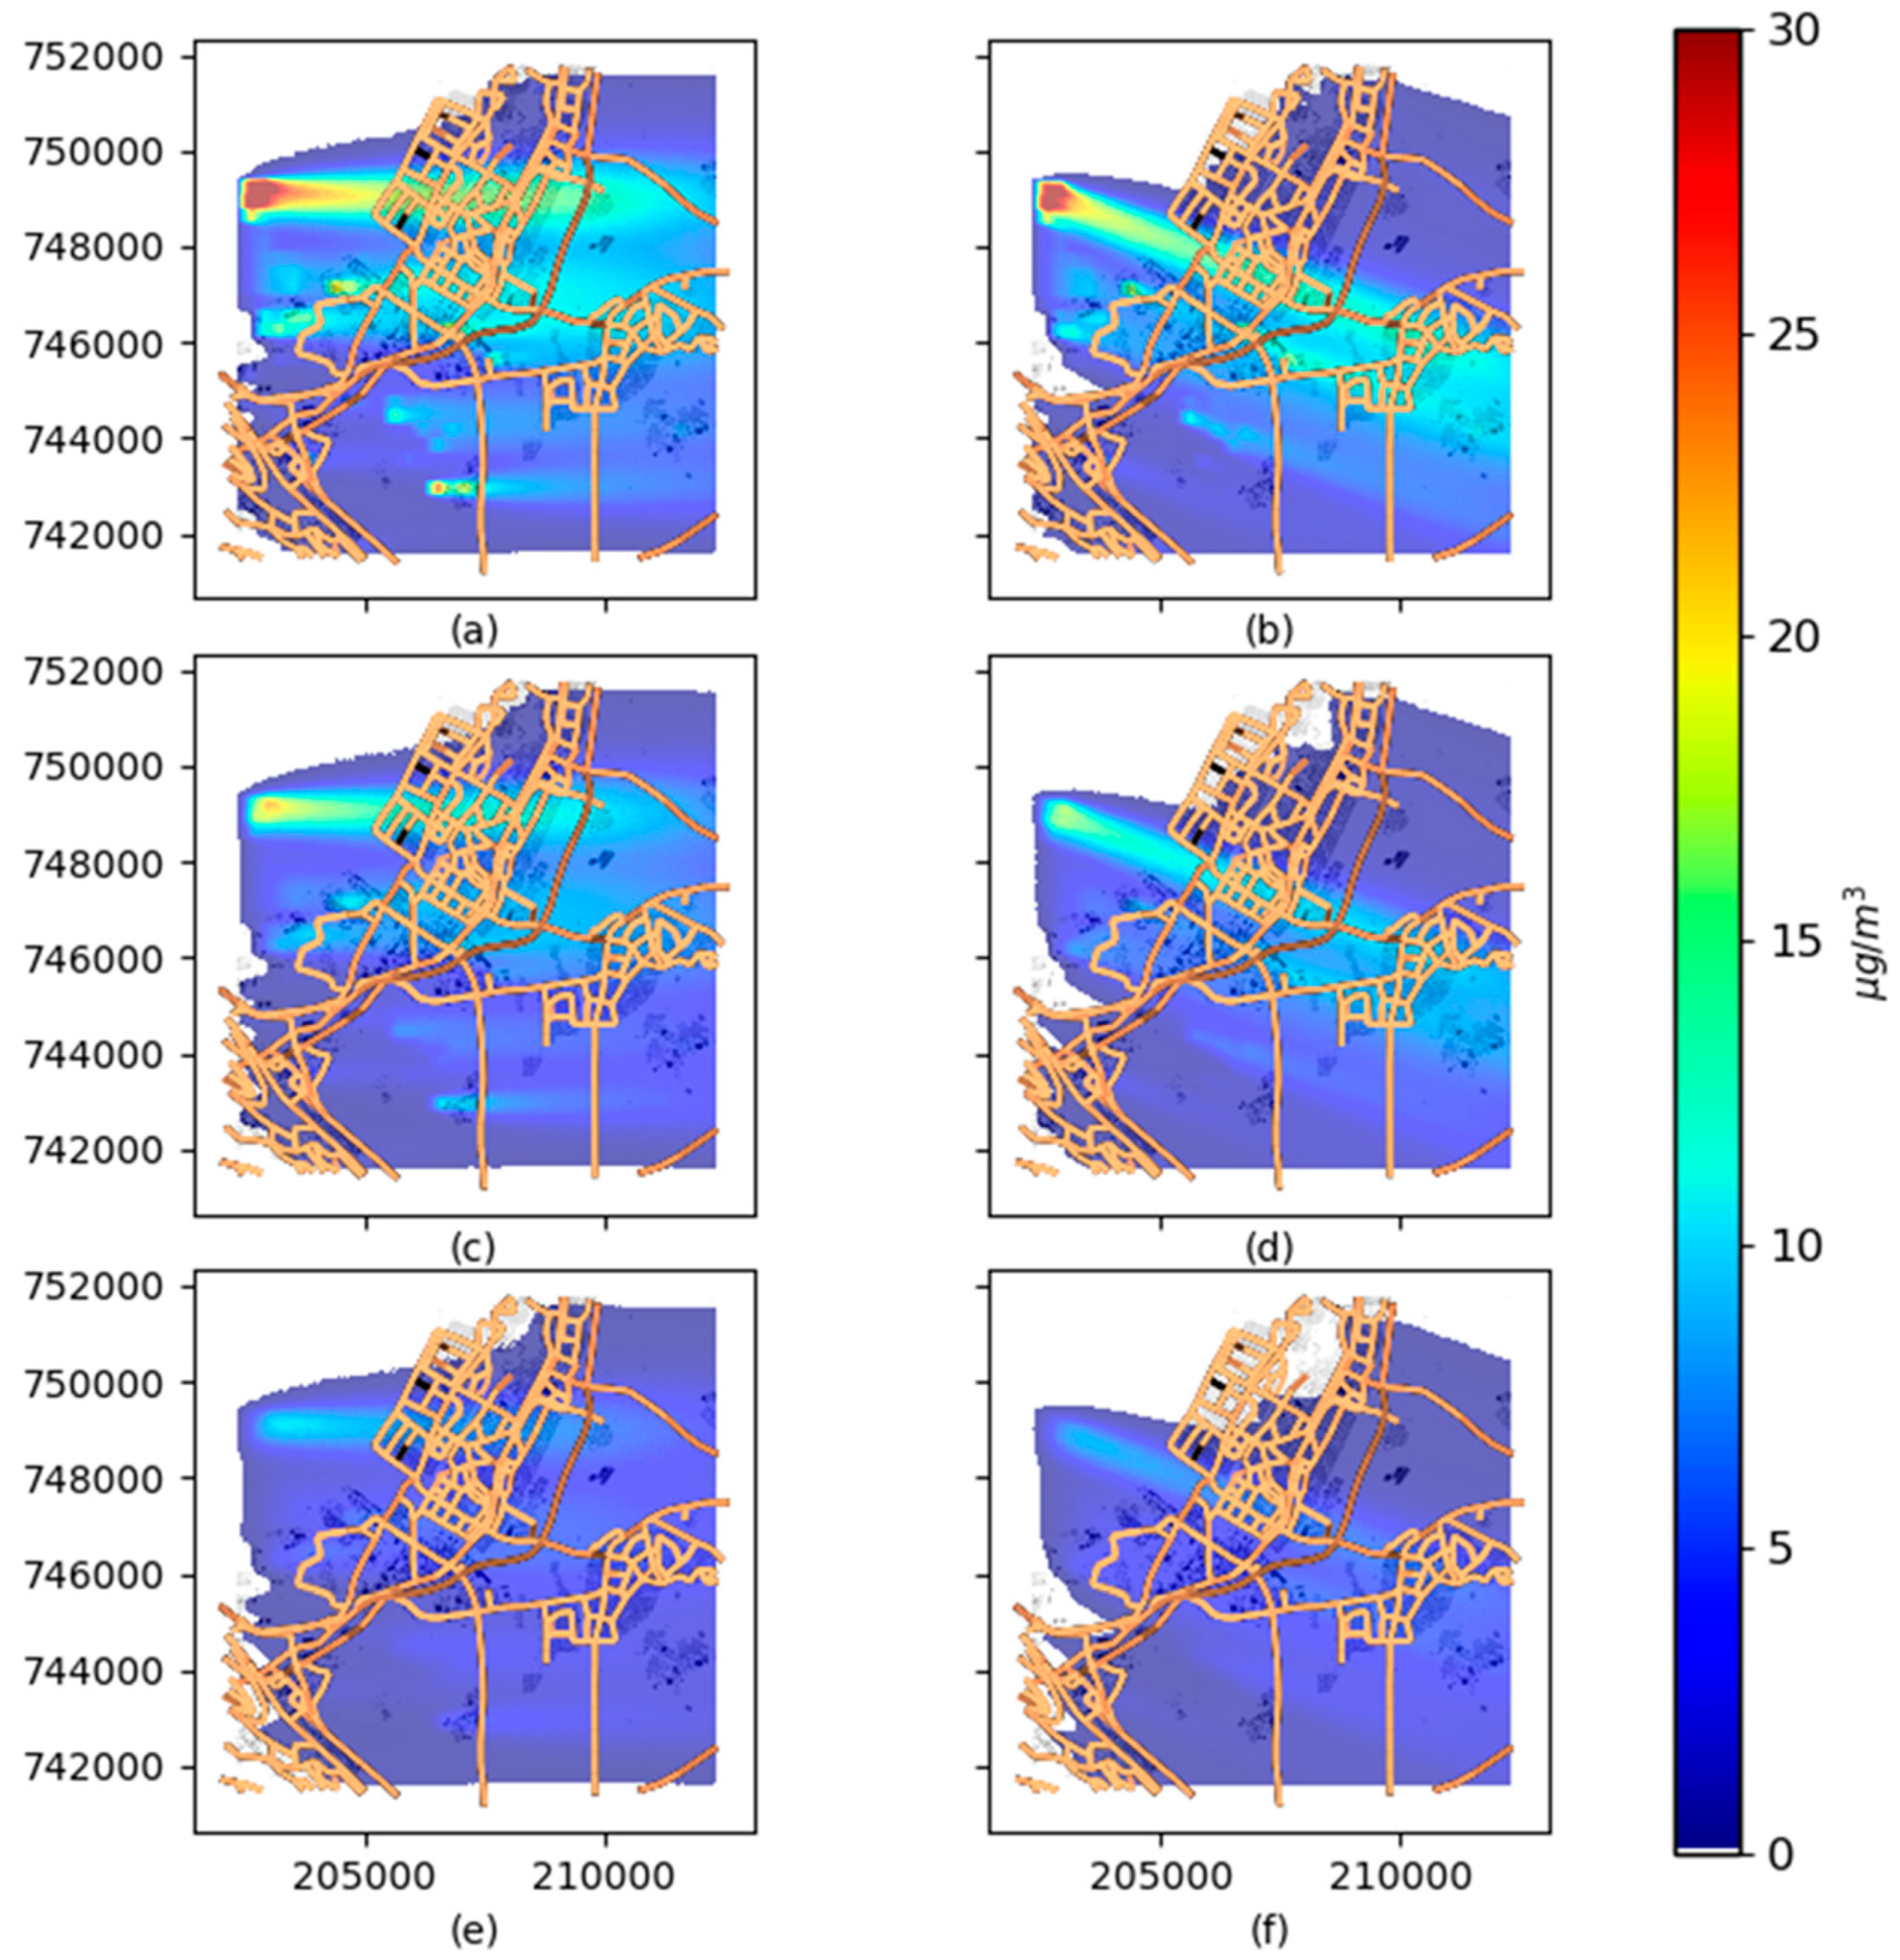
The LSM provides a simulation of three-dimensional concentration fields. In this section, the results of such simulations will be presented. As the previous section presented concentration maps at ground level (Figure 4), the height dimension will be described by several concentration maps describing the following heights: 15, 45, and 105 m AGL, above ground level (Figure 6 for PM2.5 and Figure S1 in the Supplementary Information for PM10).
The PM concentration maps at 15 m AGL (Figure 6a,b and Figure S1a,b) are very similar to the concentrations at ground level (Figure 4). According to the Israeli clean air regulations (2011 air quality values, 5 March 2022 update, https://www.nevo.co.il/law_html/law00/77858.htm, accessed on 13 November 2022), the maximal average concentration accepted for exposure of 24 h is 15   μ g / m 3 for PM2.5 and 45   μ g / m 3 for PM10. At ground and 15 m AGL, the PM2.5 hourly averaged concentration at the major source on the north-west of the HBA is about twice the threshold (Figure 6a,b), while the PM10 concentration is more approximately half of the 45   μ g / m 3 threshold (Figure S1a,b). This result applies to both rush-hour periods. Downwind from this source, as well as from the smaller sources in the west and south of the HBA, the concentrations are smaller, where the PM2.5 concentrations are on a similar level of the PM2.5 threshold. The PM10 are about third of the PM10 threshold.
The PM concentration maps at 45 m AGL (Figure 6c,d and Figure S1c,d) exhibit similar spatial pattern as the equivalent maps for the ground level and 15   m   AGL . However, the concentrations are smaller by approximately a factor of two. This also applies to the concentration maps at 105   m   AGL (Figure 6e,f and Figure S1e,f), however, though an overall pattern can be discerned, the concentration values are close to a concentration of approximately 5   μ g / m 3 . This concentration is similar to the lowest concentrations measured during days of low pollution in Israel [96,97].

4. Conclusions

The aim of this study is to expand the IIBR in-house Lagrangian stochastic pollutant dispersion model in order to be able to provide a detailed three-dimensional description of the transport of dispersion of particulate matter, PM, which originates simultaneously from various sources. This is a complicated task, due to several aspects. One challenging aspect is the heterogeneous turbulence, and another is the heterogeneous urban morphology. On top of these is the fact that the anthropogenic PM concentrations originate from multiple sources, composed of traffic and industrial facilities. Dealing with such a complex multi-source requires a detailed description of the whole region, and not only the area that is in close proximity to a single source.
The LSM simulations were performed for the anthropogenic pollution sources in the HBA during the two rush-hour periods of the day. It described the three-dimensional transport and dispersion of both the PM10 and PM2.5 concentrations. The LSM concentrations that were calculated for ground level were compared to three air quality monitoring stations that are located downstream in the affected area of the PM sources in the HBA. For PM2.5, the concentration measurements in two out of three monitoring stations were within a relative difference of a factor of two, compared to the LSM predictions. Regarding the PM10 concentrations, relative differences of approximately a factor of two were achieved in one out of three monitoring stations. Acceptance criterion for urban dispersion models requires that 30% of a model’s predictions should be within a factor of two. Therefore, the LSM estimation for the PM2.5 and PM10 concentrations can be considered in good agreement. Due to the fact that marine aerosols significantly contribute to the PM10 concentrations in seaside locations, it is reasonable to deduct this contribution from the PM10 measurements in the HBA. This leads to the measurements in at least two monitoring stations to be well within a factor of two of the LSM predictions. Therefore, it can be concluded that the LSM simulations provide a valid estimation of the concentrations of anthropogenic PM in the HBA.
The analysis of the three-dimensional concentration fields provided by the LSM has shown that the PM concentrations at 15   m   AGL (above ground level) are very similar to the concentrations at ground level. The concentrations at 45   m   AGL exhibit a similar spatial pattern as in lower altitudes, however, the nominal concentrations are smaller by approximately a factor of two. This also applied to the concentrations at 105   m   AGL , but while the overall pattern can be discerned, the concentration values are close to the background concentrations.

Supplementary Materials

The following supporting information can be downloaded at: https://www.mdpi.com/article/10.3390/atmos14010144/s1, Figure S1: PM10 concentrations (in μ g / m 3 ) calculated by the LSM for various heights above ground level. (a) and (b) refer 15 m. (c) and (d) to 45 m and (e) and (f) to 105 m. The left panels refer to morning conditions and the right to evening.

Author Contributions

Conceptualization, E.F., E.T. and Z.K.; methodology, E.F., H.D.-S., O.B. and Z.K.; software, E.F., H.D.-S. and O.B.; validation, E.F., H.D.-S. and Z.K.; formal analysis, E.F., H.D.-S. and Z.K.; resources, E.F. and Z.K.; data curation, H.D.-S.; writing—original draft preparation, E.F. and Z.K.; writing—review and editing, E.F. and Z.K.; visualization, E.F., H.D.-S. and Z.K.; supervision, E.F., E.T. and Z.K.; project administration, E.F., E.T. and Z.K.; funding acquisition, E.F., E.T. and Z.K. All authors have read and agreed to the published version of the manuscript.

Funding

This research was partially funded by the Israeli Ministry of Environmental Protection, grant number 162-4-2.

Institutional Review Board Statement

Not applicable.

Informed Consent Statement

Not applicable.

Data Availability Statement

Data obtained from the ongoing monitoring network of the HBUA (Haifa Bay Municipal Association for Environmental Protection) is available at http://www.envihaifa.net accessed on 13 November 2022.

Acknowledgments

The authors wish to thank Ilan Levy from the Israeli Ministry of Environmental Protection for providing the data and discussing the details of the traffic and other sources of air pollution.

Conflicts of Interest

The authors declare no conflict of interest. The funders had no role in the design of the study; in the collection, analyses, or interpretation of data; in the writing of the manuscript, or in the decision to publish the results.

Appendix A

In order to evaluate the performance of pollutant dispersion models, the models’ predictions are compared to observations. In order to quantify this comparison, quantitative measures are commonly used [98,99,100]. Four of these measures were ascribed to numerical constraints for urban and rural settings, based on comparison of several field experiments and dispersion models. In such a way, these measures can be used as acceptance criteria for the prediction of dispersion models for such scenarios [32]. These four acceptance criteria will be formulated herein, where C represents concentration and subscripts o and p refer to observed and predicted. As this study deals with an urban setting, the urban acceptable criterion for each measured will be brought here.
Fractional mean bias (FB):
F B = 2 C o C p ¯ / C o ¯ + C p ¯
FB, should satisfy the following constraint: F B 0.67 .
Normalized mean-square error (NMSE):
N M S E = C o C p 2 ¯ / C o ¯ × C p ¯
Acceptable NMSE should satisfy N M S E 6 .
Factor of 2 (FAC2):
F A C 2 = P r 1 2 C p C o 2
If the constraint of F A B 0.3 is satisfied, FAC2 is considered as acceptable.
Normalized absolute difference (NAD):
N A D = C o C p ¯ / C o ¯ + C p ¯
An acceptable NAD is N A D 0.5 .

References

  1. Federman, R.; Mendelson, A.; Romem, E.; Mor-Federman, T.; Lahav, C.; Ron, M.; Ramon, U. Zevulun Survey—Survey, Analysis and Evaluation of Nature, Landscape and Human Heritage; The Open Landscape Institute (OLI): Tel Aviv, Israel, 2015. [Google Scholar]
  2. Raz, R.; Yuval; Bar-Or, R.L.; Kark, J.D.; Sinnreich, R.; Broday, D.M.; Harari-Kremer, R.; Bentur, L.; Gileles-Hillel, A.; Keinan-Boker, L.; et al. Associations between Exposure to Industrial Air Pollution and Prevalence of Asthma and Atopic Diseases in Haifa Bay Area. Atmosphere 2021, 12, 516. [Google Scholar] [CrossRef]
  3. Yuval; Tritscher, T.; Raz, R.; Levi, Y.; Levy, I.; Broday, D.M. Emissions vs. Turbulence and Atmospheric Stability: A Study of Their Relative Importance in Determining Air Pollutant Concentrations. Sci. Total Environ. 2020, 733, 139300. [Google Scholar] [CrossRef] [PubMed]
  4. Klausner, Z.; Ben-Efraim, M.; Arav, Y.; Tas, E.; Fattal, E. The Micrometeorology of the Haifa Bay Area and Mount Carmel during the Summer. Atmosphere 2021, 12, 354. [Google Scholar] [CrossRef]
  5. Saaroni, H.; Levi, E.; Ziv, B. Particulate Matter in the Summer Season and Its Relation to Synoptic Conditions and Regional Climatic Stress—The Case of Haifa, Israel. Water. Air. Soil Pollut. 2018, 229, 313. [Google Scholar] [CrossRef]
  6. Karimi, A.; Shirmardi, M.; Hadei, M.; Birgani, Y.T.; Neisi, A.; Takdastan, A.; Goudarzi, G. Concentrations and Health Effects of Short- and Long-Term Exposure to PM2.5, NO2, and O3 in Ambient Air of Ahvaz City, Iran (2014–2017). Ecotoxicol. Environ. Saf. 2019, 180, 542–548. [Google Scholar] [CrossRef]
  7. Yunesian, M.; Rostami, R.; Zarei, A.; Fazlzadeh, M.; Janjani, H. Exposure to High Levels of PM2.5 and PM10 in the Metropolis of Tehran and the Associated Health Risks during 2016–2017. Microchem. J. 2019, 150, 104174. [Google Scholar] [CrossRef]
  8. Khreis, H.; Kelly, C.; Tate, J.; Parslow, R.; Lucas, K.; Nieuwenhuijsen, M. Exposure to Traffic-Related Air Pollution and Risk of Development of Childhood Asthma: A Systematic Review and Meta-Analysis. Environ. Int. 2017, 100, 1–31. [Google Scholar] [CrossRef] [Green Version]
  9. Meier-Girard, D.; Delgado-Eckert, E.; Schaffner, E.; Schindler, C.; Künzli, N.; Adam, M.; Pichot, V.; Kronenberg, F.; Imboden, M.; Frey, U.; et al. Association of Long-Term Exposure to Traffic-Related PM10 with Heart Rate Variability and Heart Rate Dynamics in Healthy Subjects. Environ. Int. 2019, 125, 107–116. [Google Scholar] [CrossRef]
  10. Eitan, O.; Yuval; Barchana, M.; Dubnov, J.; Linn, S.; Carmel, Y.; Broday, D.M. Spatial Analysis of Air Pollution and Cancer Incidence Rates in Haifa Bay, Israel. Sci. Total Environ. 2010, 408, 4429–4439. [Google Scholar] [CrossRef]
  11. Petrov, A.; Valente, J.; Bauman-Stantzer, K.; Batchvarova, E. Applicability of Gaussian Dispersion Models for Accidental Releases in Urban Environment-Results of the “Michelstadt” Test Case in Cost Action ES1006. Bulg. J. Meteorol. Hydrol. 2017, 22, 87–102. [Google Scholar]
  12. Pirhalla, M.; Heist, D.; Perry, S.; Tang, W.; Brouwer, L. Simulations of Dispersion through an Irregular Urban Building Array. Atmos. Environ. 2021, 258, 118500. [Google Scholar] [CrossRef] [PubMed]
  13. Efthimiou, G.C.; Bartzis, J.G.; Berbekar, E.; Hertwig, D.; Harms, F.; Leitl, B. Modelling Short-Term Maximum Individual Exposure from Airborne Hazardous Releases in Urban Environments. Part II: Validation of a Deterministic Model with Wind Tunnel Experimental Data. Toxics 2015, 3, 259–267. [Google Scholar] [CrossRef] [PubMed] [Green Version]
  14. Hanna, S.R.; Britter, R.E. Wind Flow and Vapor Cloud Dispersion at Industrial and Urban Sites; Center for Chemical Process Safety/AIChE: New York, NY, USA, 2002; ISBN 0-8169-0863-X. [Google Scholar]
  15. Hanna, S.R.; Brown, M.J.; Camelli, F.E.; Chan, S.T.; Coirier, W.J.; Hansen, O.R.; Huber, A.H.; Kim, S.; Reynolds, R.M. Detailed Simulations of Atmospheric Flow and Dispersion in Downtown Manhattan: An Application of Five Computational Fluid Dynamics Models. Bull. Am. Meteorol. Soc. 2006, 87, 1713–1726. [Google Scholar] [CrossRef] [Green Version]
  16. Neophytou, M.; Gowardhan, A.; Brown, M. An Inter-Comparison of Three Urban Wind Models Using Oklahoma City Joint Urban 2003 Wind Field Measurements. J. Wind Eng. Ind. Aerodyn. 2011, 99, 357–368. [Google Scholar] [CrossRef]
  17. Hanna, S.; White, J.; Trolier, J.; Vernot, R.; Brown, M.; Gowardhan, A.; Kaplan, H.; Alexander, Y.; Moussafir, J.; Wang, Y.; et al. Comparisons of JU2003 Observations with Four Diagnostic Urban Wind Flow and Lagrangian Particle Dispersion Models. Atmos. Environ. 2011, 45, 4073–4081. [Google Scholar] [CrossRef]
  18. Thomson, D.J. Criteria for the Selection of Stochastic Models of Particle Trajectories in Turbulent Flows. J. Fluid Mech. 1987, 180, 529–556. [Google Scholar] [CrossRef]
  19. Wilson, J.D.; Sawford, B.L. Review of Lagrangian Stochastic Models for Trajectories in the Turbulent Atmosphere. Bound.-Layer Meteorol. 1996, 78, 191–210. [Google Scholar] [CrossRef]
  20. Gavze, E.; Fattal, E. A Semi-Analytical Model for Short-Range Near-Ground Continuous Dispersion. Bound.-Layer Meteorol. 2018, 169, 297–326. [Google Scholar] [CrossRef]
  21. Wilson, J. Turbulent Transport within the Plant Canopy. In Estimationn of Areal Evapotranspiration; Black, T.A., Spittlehouse, D., Novak, M., Price, D.T., Eds.; International Association of Hydrological Sciences (IAHS): Wallingford, UK, 1989; pp. 43–80. [Google Scholar]
  22. Wilson, J.D.; Yee, E.; Ek, N.; D’Amours, R. Lagrangian Simulation of Wind Transport in the Urban Environment. Q. J. R. Meteorol. Soc. 2009, 135, 1586–1602. [Google Scholar] [CrossRef]
  23. Wang, C.; Li, Q.; Wang, Z.H. Quantifying the Impact of Urban Trees on Passive Pollutant Dispersion Using a Coupled Large-Eddy Simulation–Lagrangian Stochastic Model. Build. Environ. 2018, 145, 33–49. [Google Scholar] [CrossRef]
  24. Röckle, R. Bestimmung Der Stomungsver-Haltnisse Im Bereich Komplexer Bebauugsstruk-Turen Darmstadt. Ph.D. Thesis, Technischen Hochschule Darmstadt, Darmstadt, Germany, 1990. [Google Scholar]
  25. Kaplan, H.; Dinar, N. A Lagrangian Dispersion Model for Calculating Concentration Distribution within a Built-up Domain. Atmos. Environ. 1996, 30, 4197–4207. [Google Scholar] [CrossRef]
  26. Oldrini, O.; Armand, P.; Duchenne, C.; Olry, C.; Moussafir, J.; Tinarelli, G. Description and Preliminary Validation of the PMSS Fast Response Parallel Atmospheric Flow and Dispersion Solver in Complex Built-up Areas. Environ. Fluid Mech. 2017, 17, 997–1014. [Google Scholar] [CrossRef]
  27. Brown, M.J.; Gowardhan, A.; Nelson, M.; Williams, M.; Pardyjak, E.R. Evaluation of the Quic Wind and Dispersion Models Using the Joint Urban 2003 Field Experiment Dataset. AMS 8th Symp. Urban Environ. 2009, J19.4. [Google Scholar]
  28. Raupach, M.R.; Finnigan, J.J.; Brunei, Y. Coherent Eddies and Turbulence in Vegetation Canopies: The Mixing-Layer Analogy; Springer: Berlin/Heidelberg, Germany, 1996; Volume 78, pp. 351–382. [Google Scholar]
  29. Finnigan, J.J. Turbulence in Plant Canopies. Annu. Rev. Fluid Mech. 2000, 32, 519–571. [Google Scholar] [CrossRef]
  30. Shnapp, R.; Bohbot-Raviv, Y.; Liberzon, A.; Fattal, E. Turbulence-Obstacle Interactions in the Lagrangian Framework: Applications for Stochastic Modeling in Canopy Flows. Phys. Rev. Fluids 2020, 5, 094601. [Google Scholar] [CrossRef]
  31. Fattal, E. A Non-Homogenous Non-Gaussian Lagrangian Stochastic Model for Pollutant Dispersion in Complex Topography—Comparison to Haifa 2009 Urban Tracer Campaign; IIBR Sci. Report 2014/56/53/5614; Israel Institute for Biological Research: Ness Ziona, Israel, 2014. (In Hebrew) [Google Scholar]
  32. Hanna, S.; Chang, J. Acceptance Criteria for Urban Dispersion Model Evaluation. Meteorol. Atmos. Phys. 2012, 116, 133–146. [Google Scholar] [CrossRef]
  33. Fattal, E.; David-Saroussi, H.; Klausner, Z.; Buchman, O. An Urban Lagrangian Stochastic Dispersion Model for Simulating Traffic Particulate-Matter Concentration Fields. Atmosphere 2021, 12, 580. [Google Scholar] [CrossRef]
  34. Thomson, D.J.; Wilson, J.D. History of Lagrangian Stochastic Models for Turbulent Dispersion. In Lagrangian Modeling of the Atmosphere; Lin, J., Brunner, D., Gerbig, C., Stohl, A., Luhar, A., Webley, P., Eds.; American Geophysical Union: Washington, DC, USA, 2012; pp. 19–36. ISBN 978-0-87590-490-0. [Google Scholar]
  35. Pope, S.B. Turbulent Flows, 1st ed.; Cambridge University Press: London, UK, 2000; ISBN 0521598869. [Google Scholar]
  36. Obukhov, A.M. Description of Turbulence in Terms of Lagrangian Variables. In Advances in Geophysics, Volume 6; Frenkiel, F.N., Sheppard, P.A., Eds.; Academic Press: New York, NY, USA, 1959; pp. 113–116. ISBN 0120188066. [Google Scholar]
  37. Tutkun, M. Markovian Properties of Velocity Increments in Boundary Layer Turbulence. Phys. D Nonlinear Phenom. 2017, 351–352, 53–61. [Google Scholar] [CrossRef]
  38. Novikov, E.A. Relation between the Lagrangian and Eulerian Descriptions of Turbulence. J. Appl. Math. Mech. 1969, 33, 862–864. [Google Scholar] [CrossRef]
  39. Pope, S.B. Consistency Conditions for Random-Walk Models of Turbulent Dispersion. Phys. Fluids 1987, 30, 2374–2379. [Google Scholar] [CrossRef]
  40. Sawford, B.L. Rotation of Trajectories in Lagrangian Stochastic Models of Turbulent Dispersion. Bound. -Layer Meteorol. 1999, 93, 411–424. [Google Scholar] [CrossRef]
  41. Wilson, J.D.; Flesch, T.K. Trajectory Curvature as a Selection Criterion for Valid Lagrangian Stochastic Dispersion Models. Bound.-Layer Meteorol. 1997, 84, 411–425. [Google Scholar] [CrossRef]
  42. Brouwers, J.J.H. Statistical Description of Turbulent Dispersion. Phys. Rev. E Stat. Nonlinear Soft Matter Phys. 2012, 86, 1–14. [Google Scholar] [CrossRef] [PubMed] [Green Version]
  43. Faranda, D.; Pons, F.M.E.; Dubrulle, B.; Daviaud, F.; Saint-Michel, B.; Herbert, É.; Cortet, P.P. Modelling and Analysis of Turbulent Datasets Using Auto Regressive Moving Average Processes. Phys. Fluids 2014, 26, 105101. [Google Scholar] [CrossRef] [Green Version]
  44. Pope, S.B. The Vanishing Effect of Molecular Diffusivity on Turbulent Dispersion: Implications for Turbulent Mixing and the Scalar Flux. J. Fluid Mech. 1998, 359, 299–312. [Google Scholar] [CrossRef] [Green Version]
  45. Gardiner, C.W. Stochastic Methods: A Handbook for the Natural and Social Sciences, 4th ed.; Springer-Verlang: Berlin, Germany, 1997; ISBN 3-540-61634-9. [Google Scholar]
  46. Shnapp, R.; Shapira, E.; Peri, D.; Bohbot-Raviv, Y.; Fattal, E.; Liberzon, A. Extended 3D-PTV for Direct Measurements of Lagrangian Statistics of Canopy Turbulence in a Wind Tunnel. Sci. Rep. 2019, 9, 7405. [Google Scholar] [CrossRef] [Green Version]
  47. Shnapp, R. On Small-Scale and Large-Scale Intermittency of Lagrangian Statistics in Canopy Flow. J. Fluid Mech. 2021, 913, 1–13. [Google Scholar] [CrossRef]
  48. Poggi, D.; Katul, G.G.; Cassiani, M. On the Anomalous Behavior of the Lagrangian Structure Function Similarity Constant inside Dense Canopies. Atmos. Environ. 2008, 42, 4212–4231. [Google Scholar] [CrossRef]
  49. Du, S. Universality of the Lagrangian Velocity Structure Function Constant (C0) across Different Kinds of Turbulence. Bound.-Layer Meteorol. 1997, 83, 207–219. [Google Scholar] [CrossRef]
  50. Rizza, U.; Degrazia, G.A.; Mangia, C.; Filho, E.P.M. Estimation of the Kolmogorov Constant for the Lagrangian Velocity Spectrum and Structure Function under Different PBL Stability Regimes Generated by Les. Phys. A Stat. Mech. Appl. 2010, 389, 4009–4017. [Google Scholar] [CrossRef]
  51. Christen, A.; Vogt, R.; Rotach, M.W. Profile Measurements of Selected Turbulence Characteristics over Different Urban Surfaces. In Proceedings of the 4th International Conference on Urban Air Quality, Prague, Czech Republic, 22–24 July 2003; Volume 1, pp. 408–411. [Google Scholar]
  52. Flesch, T.K.; Wilson, J.D. A Two-Dimensional Trajectory-Simulation Model for Non-Gaussian, Inhomogeneous Turbulence within Plant Canopies. Bound.-Layer Meteorol. 1992, 61, 349–374. [Google Scholar] [CrossRef]
  53. Gloster, J.; Williams, P.; Doel, C.; Esteves, I.; Coe, H.; Valarcher, J.-F. Foot-and-Mouth Disease—Quantification and Size Distribution of Airborne Particles Emitted by Healthy and Infected Pigs. Vet. J. 2007, 174, 42–53. [Google Scholar] [CrossRef] [PubMed]
  54. Mayer, D.; Reiczigel, J.; Rubel, F. A Lagrangian Particle Model to Predict the Airborne Spread of Foot-and-Mouth Disease Virus. Atmos. Environ. 2008, 42, 466–479. [Google Scholar] [CrossRef]
  55. Garner, M.G.; Hess, G.D.; Yang, X. An Integrated Modelling Approach to Assess the Risk of Wind-Borne Spread of Foot-and-Mouth Disease Virus from Infected Premises. Environ. Model. Assess. 2006, 11, 195–207. [Google Scholar] [CrossRef]
  56. Klausner, Z.; Klement, E.; Fattal, E. Modeling Long Distance Dispersal of Airborne Foot-and-Mouth Disease Virus as a Polydisperse Aerosol—Application to the Emergence of a New Strain from Egypt to Israel. Atmos. Environ. 2015, 122, 332–342. [Google Scholar] [CrossRef]
  57. Pozorski, J. Models of Turbulent Flows and Particle Dynamics. In Particles in Wall-Bounded Turbulent Flows: Deposition, Re-Suspension and Agglomeration; Minier, J.-P., Pozorski, J., Eds.; Springer: Cham, Germany, 2017; pp. 97–150. ISBN 978-3-319-41566-6. [Google Scholar]
  58. Minier, J.P. On Lagrangian Stochastic Methods for Turbulent Polydisperse Two-Phase Reactive Flows. Prog. Energy Combust. Sci. 2015, 50, 1–62. [Google Scholar] [CrossRef]
  59. Wilson, J.D. Trajectory Models for Heavy Particles in Atmospheric Turbulence: Comparison with Observations. J. Appl. Meteorol. 2000, 39, 1894–1912. [Google Scholar] [CrossRef]
  60. Mamun, A.A.; Cheng, I.; Zhang, L.; Dabek-Zlotorzynska, E.; Charland, J.-P. Overview of Size Distribution, Concentration, and Dry Deposition of Airborne Particulate Elements Measured Worldwide. Environ. Rev. 2020, 28, 77–88. [Google Scholar] [CrossRef]
  61. Casal, J.; Planas-Cuchi, E.; Moresob, J.M.; Casal, J. Forecasting Virus Atmospherical Dispersion. Studies with Foot-and-Mouth Disease. J. Hazard. Mater. 1995, 43, 229–244. [Google Scholar] [CrossRef]
  62. Yuval; Broday, D.M. High-Resolution Spatial Patterns of Long-Term Mean Concentrations of Air Pollutants in Haifa Bay Area. Atmos. Environ. 2006, 40, 3653–3664. [Google Scholar] [CrossRef]
  63. Shi, J.P.; Mark, D.; Harrison, R.M. Characterization of Particles from a Current Technology Heavy-Duty Diesel Engine. Environ. Sci. Technol. 2000, 34, 748–755. [Google Scholar] [CrossRef]
  64. Yuval; Broday, D.M.; Alpert, P. Exploring the Applicability of Future Air Quality Predictions Based on Synoptic System Forecasts. Environ. Pollut. 2012, 166, 65–74. [Google Scholar] [CrossRef] [PubMed]
  65. Hazi, Y.; Heikkinen, M.S.A.; Cohen, B.S. Size Distribution of Acidic Sulfate Ions in Fine Ambient Particulate Matter and Assessment of Source Region Effect. Atmos. Environ. 2003, 37, 5403–5413. [Google Scholar] [CrossRef]
  66. Mehlmann, A.; Warneck, P. Atmospheric Gaseous HNO3, Particulate Nitrate, and Aerosol Size Distributions of Major Ionic Species at a Rural Site in Western Germany. Atmos. Environ. 1995, 29, 2359–2373. [Google Scholar] [CrossRef]
  67. Csanady, G.T. Turbulent Diffusion of Heavy Particles in the Atmosphere. J. Atmos. Sci. 1963, 20, 201–208. [Google Scholar] [CrossRef]
  68. Belcher, S.E.; Jerram, N.; Hunt, J.C.R. Adjustment of a Turbulent Boundary Layer to a Canopy of Roughness Elements. J. Fluid Mech. 2003, 488, 369–398. [Google Scholar] [CrossRef] [Green Version]
  69. Raupach, M.R.; Shaw, R.H. Averaging Procedures for Flow Canopies. Bound. -Layer Meteorol. 1982, 22, 79–90. [Google Scholar] [CrossRef]
  70. Coceal, O.; Belcher, S.E. A Canopy Model of Mean Winds through Urban Areas. Q. J. R. Meteorol. Soc. 2004, 130, 1349–1372. [Google Scholar] [CrossRef] [Green Version]
  71. Grimmond, C.S.B.; Oke, T.R. Aerodynamic Properties of Urban Areas Derived from Analysis of Surface Form. J. Appl. Meteorol. Clim. 1999, 38, 1262–1292. [Google Scholar] [CrossRef]
  72. Coceal, O.; Belcher, S.E. Mean Winds through an Inhomogeneous Urban Canopy. Bound.-Layer Meteorol. 2005, 115, 47–68. [Google Scholar] [CrossRef]
  73. Inoue, E. On the Turbulent Structure of Airflow within Crop Canopies. J. Meteorol. Soc. Japan. Ser. II 1963, 41, 317–326. [Google Scholar] [CrossRef] [Green Version]
  74. Finnigan, J.; Harman, I.; Ross, A.; Belcher, S. First-Order Turbulence Closure for Modelling Complex Canopy Flows. Q. J. R. Meteorol. Soc. 2015, 141, 2907–2916. [Google Scholar] [CrossRef]
  75. Harman, I.N.; Finnigan, J.J. A Simple Unified Theory for Flow in the Canopy and Roughness Sublayer. Bound.-Layer Meteorol. 2007, 123, 339–363. [Google Scholar] [CrossRef]
  76. Hicks, B.B.; Pendergrass, W.R.; Vogel, C.A.; Keener, R.N.; Leyton, S.M. On the Micrometeorology of the Southern Great Plains 1: Legacy Relationships Revisited. Bound.-Layer Meteorol. 2014, 151, 389–405. [Google Scholar] [CrossRef]
  77. Wilson, J.D. Monin-Obukhov Functions for Standard Deviations of Velocity. Bound.-Layer Meteorol. 2008, 129, 353–369. [Google Scholar] [CrossRef]
  78. Hanna, S.R. Applications in Air Pollution Modeling. In Atmospheric Turbulence and Air Pollution Modelling; Nieuwstadt, F.T.M., van Dop, H., Eds.; D. Reidel Publishing Company: Dordrecht, The Netherlands, 1982; pp. 275–310. ISBN 978-90-277-1807-5. [Google Scholar]
  79. Kastner-Klein, P.; Rotach, M.W. Mean Flow and Turbulence Characteristics in an Urban Roughness Sublayer. Bound.-Layer Meteorol. 2004, 111, 55–84. [Google Scholar] [CrossRef]
  80. Mortarini, L.; Ferrero, E.; Richiardone, R.; Falabino, S.; Anfossi, D.; Trini Castelli, S.; Carretto, E. Assessment of Dispersion Parameterizations through Wind Data Measured by Three Sonic Anemometers in a Urban Canopy. Adv. Sci. Res. 2009, 3, 91–98. [Google Scholar] [CrossRef] [Green Version]
  81. Israel Ministry of Environmental Protection. Israel’s Hourly Inventory of Traffic Air Pollutants by Road Sections for 2019; Received by Authors Request; Israel Ministry of Environmental Protection: Jerusalem, Israel, 2020.
  82. Israel Ministry of Environmental Protection. Israel’s Hourly Inventory of Air Pollutants, Point Sources and Other Source Types for 2018; Received by Authors Request; Israel Ministry of Environmental Protection: Jerusalem, Israel, 2020.
  83. Klausner, Z.; Fattal, E. An Objective and Automatic Method for Identification of Pattern Changes in Wind Direction Time Series. Int. J. Climatol. 2011, 31, 783–790. [Google Scholar] [CrossRef]
  84. Dayan, U.; Levy, I. The Influence of Meteorological Conditions and Atmospheric Circulation Types on PM 10 and Visibility in Tel Aviv. J. Appl. Meteorol. 2005, 44, 606–619. [Google Scholar] [CrossRef]
  85. Erel, Y.; Kalderon-Asael, B.; Dayan, U.; Sandler, A. European Atmospheric Pollution Imported by Cooler Air Masses to the Eastern Mediterranean during the Summer. Environ. Sci. Technol. 2007, 41, 5198–5203. [Google Scholar] [CrossRef]
  86. Kalderon-Asael, B.; Erel, Y.; Sandler, A.; Dayan, U. Mineralogical and Chemical Characterization of Suspended Atmospheric Particles over the East Mediterranean Based on Synoptic-Scale Circulation Patterns. Atmos. Environ. 2009, 43, 3963–3970. [Google Scholar] [CrossRef]
  87. Ganor, E.; Levin, Z.; Van Grieken, R. Composition of Individual Aerosol Particles above the Israelian Mediterranean Coast during the Summer Time. Atmos. Environ. 1998, 32, 1631–1642. [Google Scholar] [CrossRef]
  88. Freiman, M.T.; Hirshel, N.; Broday, D.M. Urban-Scale Variability of Ambient Particulate Matter Attributes. Atmos. Environ. 2006, 40, 5670–5684. [Google Scholar] [CrossRef]
  89. Meng, Z.; Seinfeld, J.H. Time Scales to Achieve Atmospheric Gas-Aerosol Equilibrium for Volatile Species. Atmos. Environ. 1996, 30, 2889–2900. [Google Scholar] [CrossRef]
  90. Levin, Z.; Teller, A.; Ganor, E. On the Interactions of Mineral Dust, Sea-Salt Particles, and Clouds: A Measurement and Modeling Study from the Mediterranean Israeli Dust Experiment Campaign. J. Geophys. Res. 2005, 110, D20202. [Google Scholar] [CrossRef] [Green Version]
  91. Athanasopoulou, E.; Tombrou, M.; Pandis, S.N.; Russell, A.G. The Role of Sea-Salt Emissions and Heterogeneous Chemistry in the Air Quality of Polluted Coastal Areas. Atmos. Chem. Phys. 2008, 8, 5755–5769. [Google Scholar] [CrossRef] [Green Version]
  92. Carvalho, A.R.; Gama, C.; Monteiro, A. Investigating the Contribution of Sea Salt to PM10 Concentration Values on the Coast of Portugal. Air Qual. Atmos. Health 2021, 14, 1697–1708. [Google Scholar] [CrossRef]
  93. Chow, J.C.; Watson, J.G.; Lowenthal, D.H.; Countess, R.J. Sources and Chemistry of PM10 Aerosol in Santa Barbara County, CA. Atmos. Environ. 1996, 30, 1489–1499. [Google Scholar] [CrossRef]
  94. Mkoma, S.L.; Maenhaut, W.; Chi, X.; Wang, W.; Raes, N. Characterisation of PM10 Atmospheric Aerosols for the Wet Season 2005 at Two Sites in East Africa. Atmos. Environ. 2009, 43, 631–639. [Google Scholar] [CrossRef]
  95. Herut, B.; Nimmo, M.; Medway, A.; Chester, R.; Krom, M.D. Dry Atmospheric Inputs of Trace Metals at the Mediterranean Coast of Israel (SE Mediterranean): Sources and Fluxes. Atmos. Environ. 2001, 35, 803–813. [Google Scholar] [CrossRef]
  96. Dayan, U.; Erel, Y.; Shpund, J.; Kordova, L.; Wanger, A.; Schauer, J.J. The Impact of Local Sources and Meteorological Factors on Nitrogen Oxide and Particulate Matter Concentrations: A Case Study of the Day of Atonement in Israel. Atmos. Environ. 2011, 45, 3325–3332. [Google Scholar] [CrossRef]
  97. Ganor, E.; Stupp, A.; Alpert, P. A Method to Determine the Effect of Mineral Dust Aerosols on Air Quality. Atmos. Environ. 2009, 43, 5463–5468. [Google Scholar] [CrossRef]
  98. Chang, J.C.; Hanna, S.R. Air Quality Model Performance Evaluation. Meteorol. Atmos. Phys. 2004, 87, 167–196. [Google Scholar] [CrossRef]
  99. Elbir, T. Comparison of Model Predictions with the Data of an Urban Air Quality Monitoring Network in Izmir, Turkey. Atmos. Environ. 2003, 37, 2149–2157. [Google Scholar] [CrossRef]
  100. Heist, D.; Isakov, V.; Perry, S.; Snyder, M.; Venkatram, A.; Hood, C.; Stocker, J.; Carruthers, D.; Arunachalam, S.; Owen, R.C. Estimating Near-Road Pollutant Dispersion: A Model Inter-Comparison. Transp. Res. Part D Transp. Environ. 2013, 25, 93–105. [Google Scholar] [CrossRef]
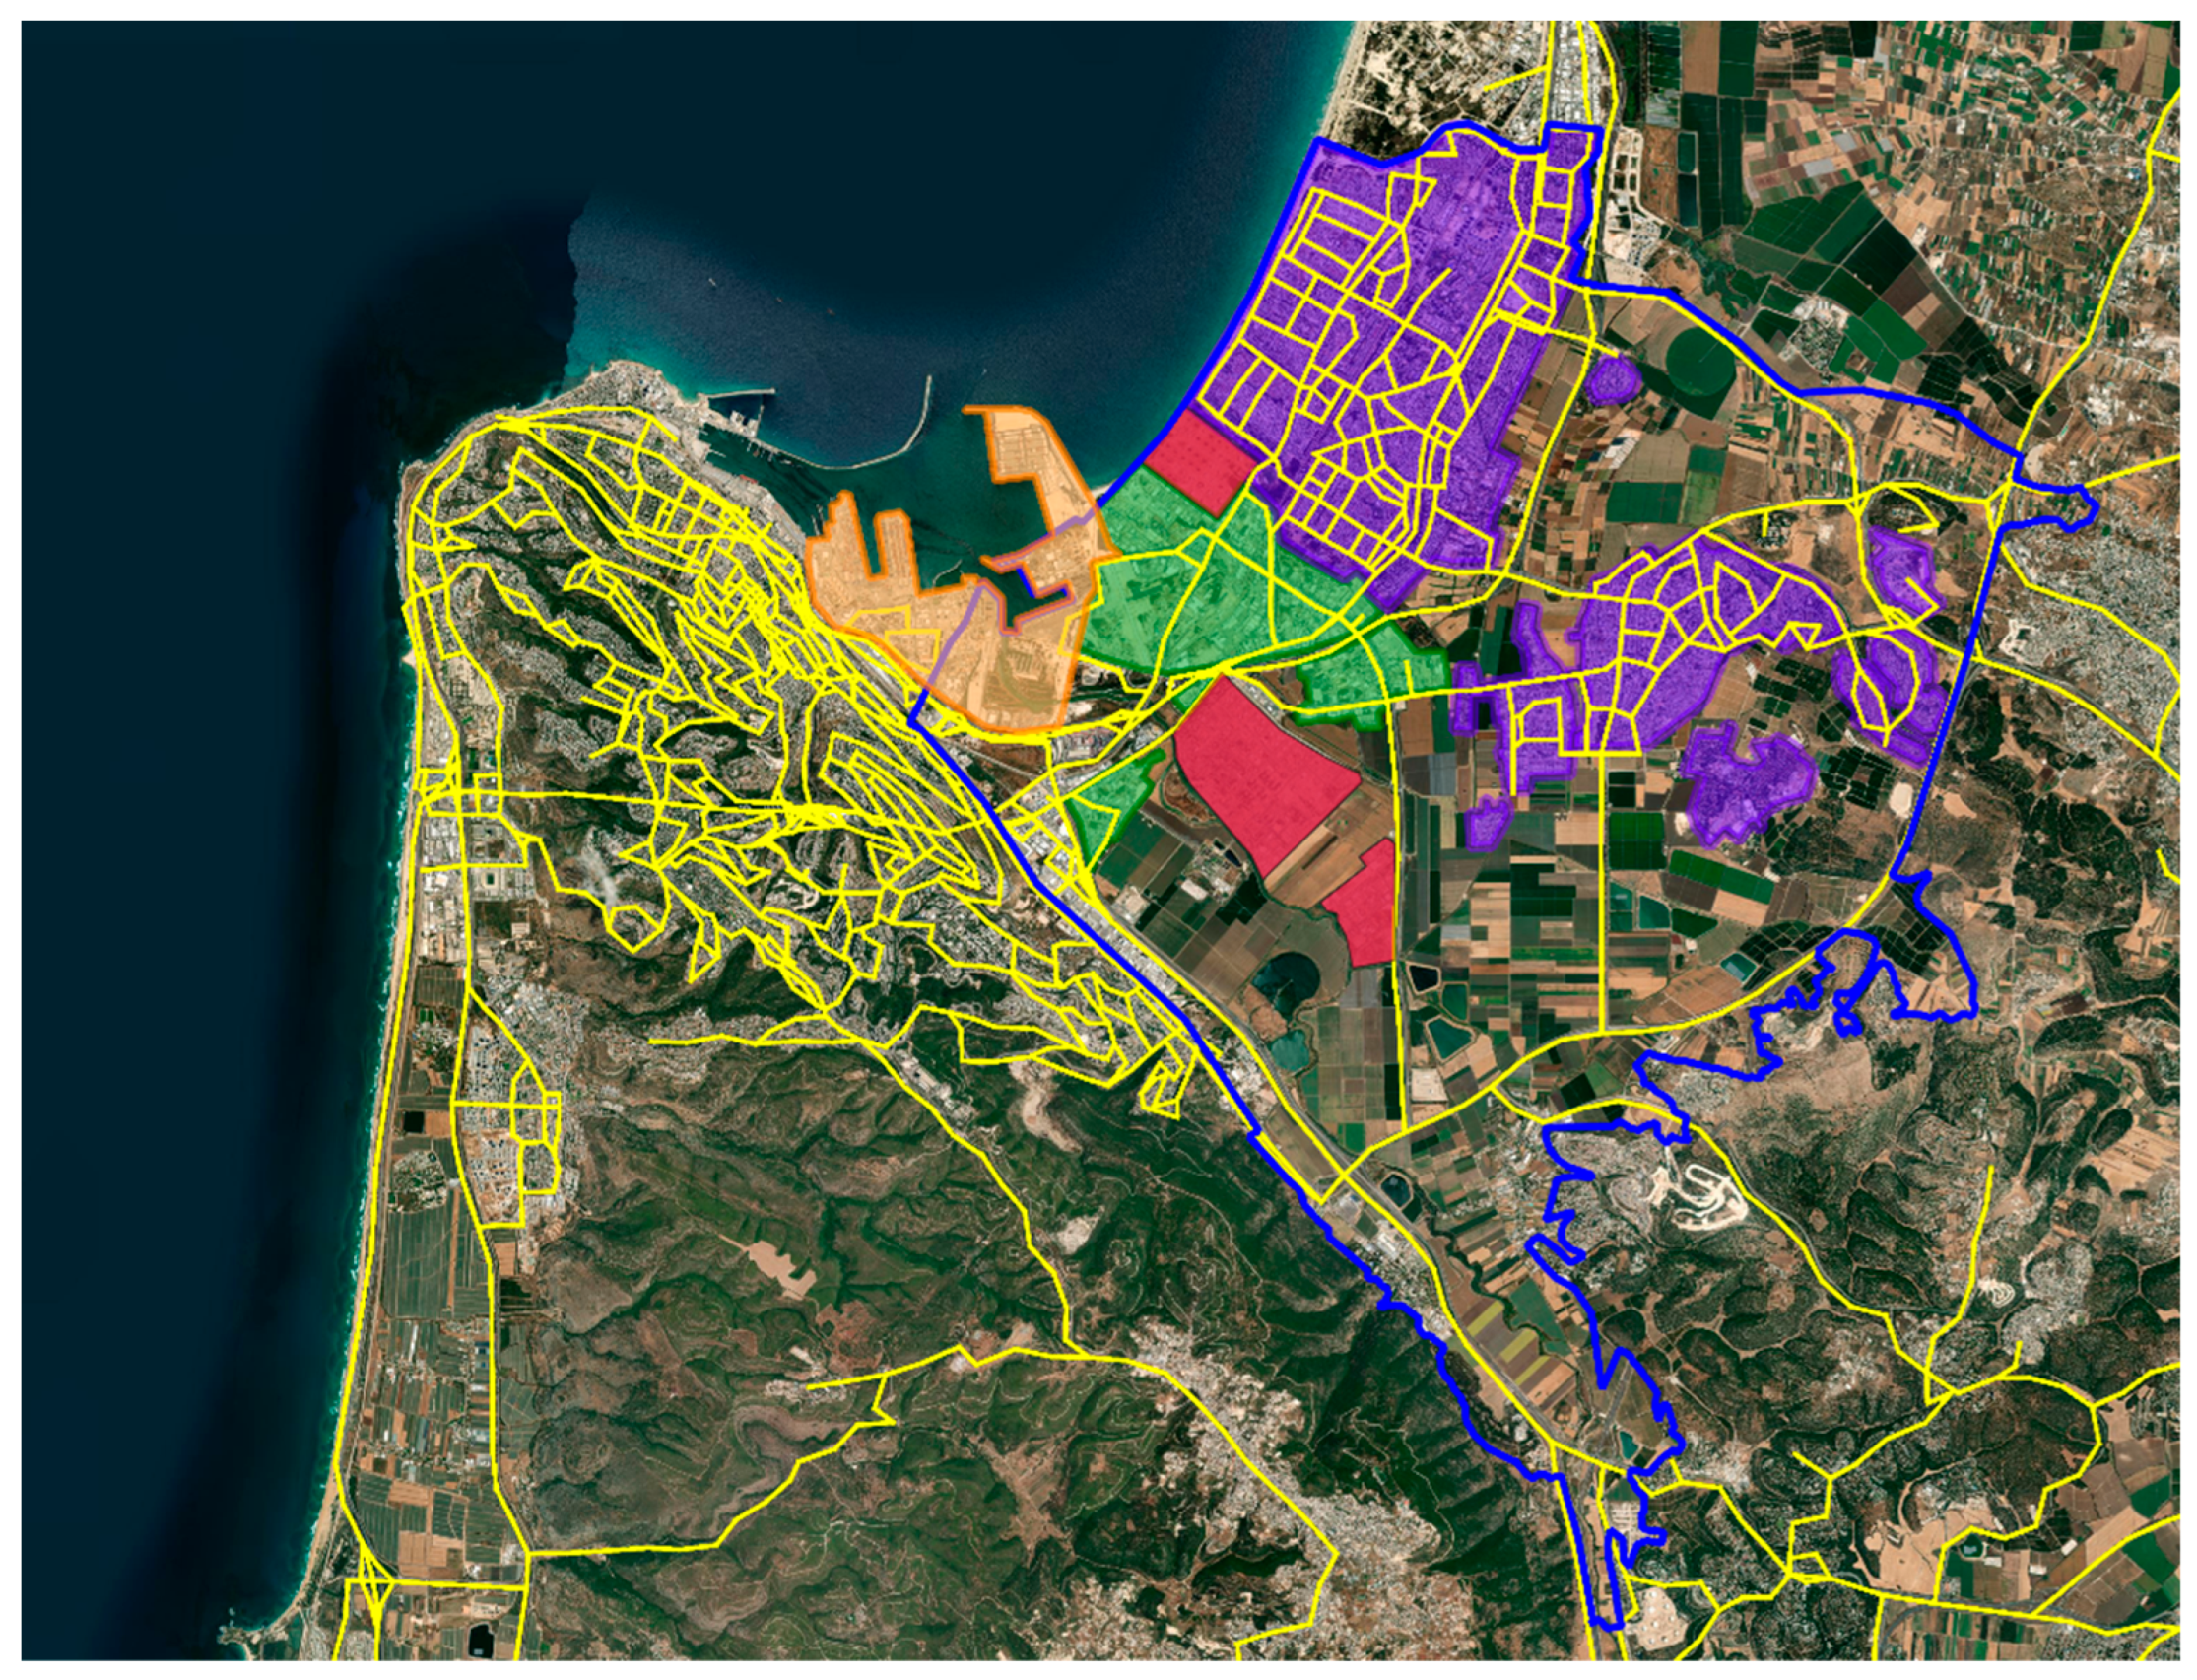
Figure 1. The Haifa Bay area (HBA). The blue border signifies the borders of southern Zevulun valley, which defines the Haifa Bay area. The colored polygons define various types of areas: major industrial facilities (red), light industry and employment areas (green), residential areas (purple), port (orange). Roads are marked by yellow lines.
Atmosphere 14 00144 g001
Figure 2. A map of the morphological parameters: the ratio of the occupied and total plan area, λ p [decimal number] (upper left panel), the plan area weighted average building height, h c [meters] (upper right panel) and the frontal area density ratio, λ f , for wind direction of 270 ° (lower left panel) and 290 ° (lower right panel). The map coordinates are expressed in ITM (the Israeli Transverse Mercator coordinate system).
Atmosphere 14 00144 g002
Figure 3. A map of the traffic routes and other pollution sources in the HBA area (left panel) and as areal sources (right panel). The upper (a) refer to the sources of PM10 and the lower (b) refer to sources of PM2.5.
Atmosphere 14 00144 g003aAtmosphere 14 00144 g003b
Figure 4. PM concentrations (in μ g / m 3 ) calculated by the LSM for the ground level. (a,b) refer to PM10 concentrations in typical morning and evening conditions, respectively. (c,d) are similar to (a,b) in terms of the meteorological conditions, but for PM2.5 concentrations. Measured PM concentrations appear in circles with color scale similar to the calculated concentrations. The map coordinates are expressed in ITM (the Israeli Transverse Mercator coordinate system).
Atmosphere 14 00144 g004
Figure 5. Comparison of the PM concentrations calculated by the LSM to measurements. (a,b) refer to PM10 concentrations in typical morning and evening conditions, respectively. (c,d) are similar to (a,b) in terms of the meteorological conditions, but for PM2.5 concentrations.
Atmosphere 14 00144 g005
Figure 6. PM2.5 concentrations (in μ g / m 3 ) calculated by the LSM for various heights above ground level. (a,b) refer 15 m, (c,d) to 45 m, and (e,f) to 105 m. The left panels refer to morning conditions and the right to evening. The map coordinates are expressed in ITM (the Israeli Transverse Mercator coordinate system).
Atmosphere 14 00144 g006
Table 1. Performance measures for the LSM estimations compared to measured PM concentrations.
Particle TypeRush Hour Period F B NMSEFAC2NAD
PM10Morning0.881.030.330.44
Evening0.861.10.330.43
PM2.5Morning0.450.280.670.23
Evening0.60.50.670.3
Disclaimer/Publisher’s Note: The statements, opinions and data contained in all publications are solely those of the individual author(s) and contributor(s) and not of MDPI and/or the editor(s). MDPI and/or the editor(s) disclaim responsibility for any injury to people or property resulting from any ideas, methods, instructions or products referred to in the content.