Article

Emission Characteristics of Particulate Matter from Boiling Food

1
College of Energy Engineering, Xi’an University of Science and Technology, Xi’an 710054, China
2
Key Laboratory of Western Mines and Hazards Prevention, Ministry of Education of China, Xi’an 710054, China
3
Shaanxi Coal Geology Group Co., Ltd., Xi’an 710021, China
4
HVAC Department, Zhongye Changtian International Engineering Co., Ltd., Changsha 410007, China
*
Author to whom correspondence should be addressed.
Atmosphere 2023, 14(1), 167; https://doi.org/10.3390/atmos14010167
Submission received: 21 November 2022 / Revised: 3 January 2023 / Accepted: 8 January 2023 / Published: 12 January 2023

Abstract

:
Cooking food in water or soup, such as hot pot, is a widely used cooking method in China. This type of cooking requires no oil and cooks at a lower temperature, but that does not mean it produces fewer pollutants or is less harmful. There are few research studies on the emission characteristics and mechanisms of particulate matter emissions when eating hot pot (the boiling process), which leads to the unreasonable design of ventilation systems for this kind of catering. In this paper, the effects of boiling different ingredients (including noodles, potatoes, fish, tofu, meatballs, and pork) on particle number concentration emissions were studied. The particle number concentration and particle size distribution of PM with diameters of 0.3 μm and less, 0.3–0.5 μm and 0.5–1.0 μm (PM0.3, PM0.3–0.5 and PM0.5–1.0, respectively) were measured in an experimental chamber. The food type and shape showed very little change in the PM emission characteristics of boiling. When the boiling state was reached, the number concentration, particle size distribution, and arithmetic mean diameter of particles all fluctuated within 60 s. The emission characteristics of particles produced by boiling water and heating oil were compared. Heating oil produced more small particles, and boiling water released more large particles. Transient and steady methods were used to calculate the emission rate of particles, and the steady-state calculation has a high estimation of the emission rate.

Graphical Abstract

1. Introduction

Indoor air pollution is responsible for millions of deaths every year [1]. One of the most important sources of air pollution (non-smoking) in buildings is cooking [2]. Cooking produces many substances, such as particulate matter, liquid oil droplets, water vapor, and gaseous pollutants [3]. The toxic pollutants in cooking particles can seriously damage the health of restaurant cooks and family members. Epidemiological studies have shown that exposure to cooking oil fumes increases the incidence of pneumonia, respiratory tract infections, lung cancer, kidney disease, asthma, cataracts, and cardiovascular diseases [4]. The oil fumes produced during frying at high temperatures have been classified as “probable carcinogens” by the International Agency for Research on Cancer [5]. As a result of long-term exposure to cooking fumes, chefs are more likely than the general population to develop diseases, such as nasopharyngeal, lung, and esophageal cancers [6]. Traditional Chinese cooking methods, such as stir-frying, frying, and boiling produce large amounts of pollutants. This is the reason for the high incidence of lung cancer among Chinese women, even though they rarely smoke [4,6].
Cooking fumes come from two parts: food cooking behavior and fuel combustion. Cooking materials, cooking methods, raw materials, cooking temperature, cooking tools, and other factors affect the composition of cooking fumes [7]. Cooking with water as the heating medium (boiling), such as hot pot, is prevalent among Chinese people and is an integral part of the Chinese catering industry. Hotpots involve the integration of cooking and dining. The cooking pot is placed on the table, and various pollutants, waste heat, moisture, and odors produced during cooking or eating are released directly into the indoor air. Sampling results in Hong Kong, Guangzhou, Taiwan, and other restaurants [8,9,10] showed that PM2.5 from catering sources accounted for more than 80% of PM10, and the proportion of fine particles emitted from hot pot restaurants was the highest. The mass concentration of PM2.5 in hot pot restaurants far exceeded the indoor air standard (PM2.5 ≤ 0.065 mg/m3) of the US Environmental Protection Agency, which is as high as 4.44 mg/m3. Previous studies have shown that hot pot cooking (boiling) produces high concentrations of air pollutants and is highly carcinogenic. Compared with oil-based cooking, the content of high-ring (5-ring or above) polycyclic aromatic hydrocarbons (PAHs) produced by the water-based cooking process is the most abundant [11]. The most common carcinogenic PAHs are the four-ring to six-ring compounds. The emissions during boiling exceeded the limits of cancer risk (10−6) and the hazard index (=1) [10,12]. Pollutants from the combustion of cooking fuel are another significant source of indoor air pollution and a leading contributor to human disease [13]. Natural gas and electricity are the primary fuels used in modern Chinese cooking [14,15]. Combustion of natural gas is an essential source of gaseous (e.g., CO, TOC, and NOx), and PM emissions [8,16]. Cooking with electricity as a heat source produces relatively light indoor air pollution. In summary, less cooking oil consumption and lower cooking temperatures during boiling processes do not mean less harm. People are exposed to extremely high levels of pollutants while enjoying hot pots (boiling). Substantial attention should be paid to indoor air quality problems caused by boiling. In the past, the research on cooking particles mainly focused on the oil-based cooking process, exposure analysis, and spatial and temporal distribution characteristics [17,18,19,20]. The effects of cooking methods, food, fuel, and ventilation on particle emission characteristics, such as particle concentration, particle size distribution, and emission rate, have been studied by experiments and numerical simulations [21,22,23,24,25]. However, cooking with water is not the same as cooking with oil. Currently, the available information in the published literature is limited. It mainly focuses on the hazards of gaseous pollutant exposure and particulate exposure caused by boiling, with little attention paid to the emission characteristics and mechanism of particles in the boiling process. Understanding the emission characteristics of cooking particles is of great significance for predicting, evaluating, and controlling cooking fume pollution. Due to the lack of understanding of the characteristics of the particles emitted during the boiling process, the existing ventilation system of the hot pot restaurant is difficult to operate efficiently [26].
The study aims to systematically investigate the number of concentrations of particles from boiling different kinds of food. The characteristics of particles emitted from boiling food and heating edible oil were compared. Additionally, we investigated the influence of the food type and cooking methods on the total particle number emission rates. The results can provide emission rate data for the exposure analysis and guide the design of the ventilation systems.

2. Materials and Methods

In a previous study, five hot pot restaurants were selected in Xi’an, China, to evaluate the indoor air quality and ventilation systems [26]. The test results show that the indoor environment was related to the fuel of heat sources and the ventilation system, especially the local exhaust system. Indoor air temperature, relative humidity, and pollutant concentration all increased when hot pot was cooked, consistent with previous research [8,10]. Due to the influence of the catering environment, dining staff, ventilation, and other factors, it is impossible to accurately measure the particle emission characteristics when boiling hot pots. Therefore, a laboratory experiment method was conducted in this study. In the experiment, an induction cooker was used as the heating source to avoid the influence of particles produced by natural gas combustion.

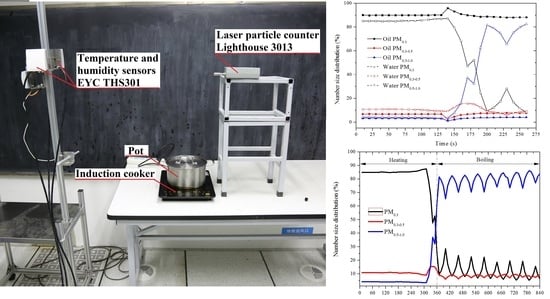
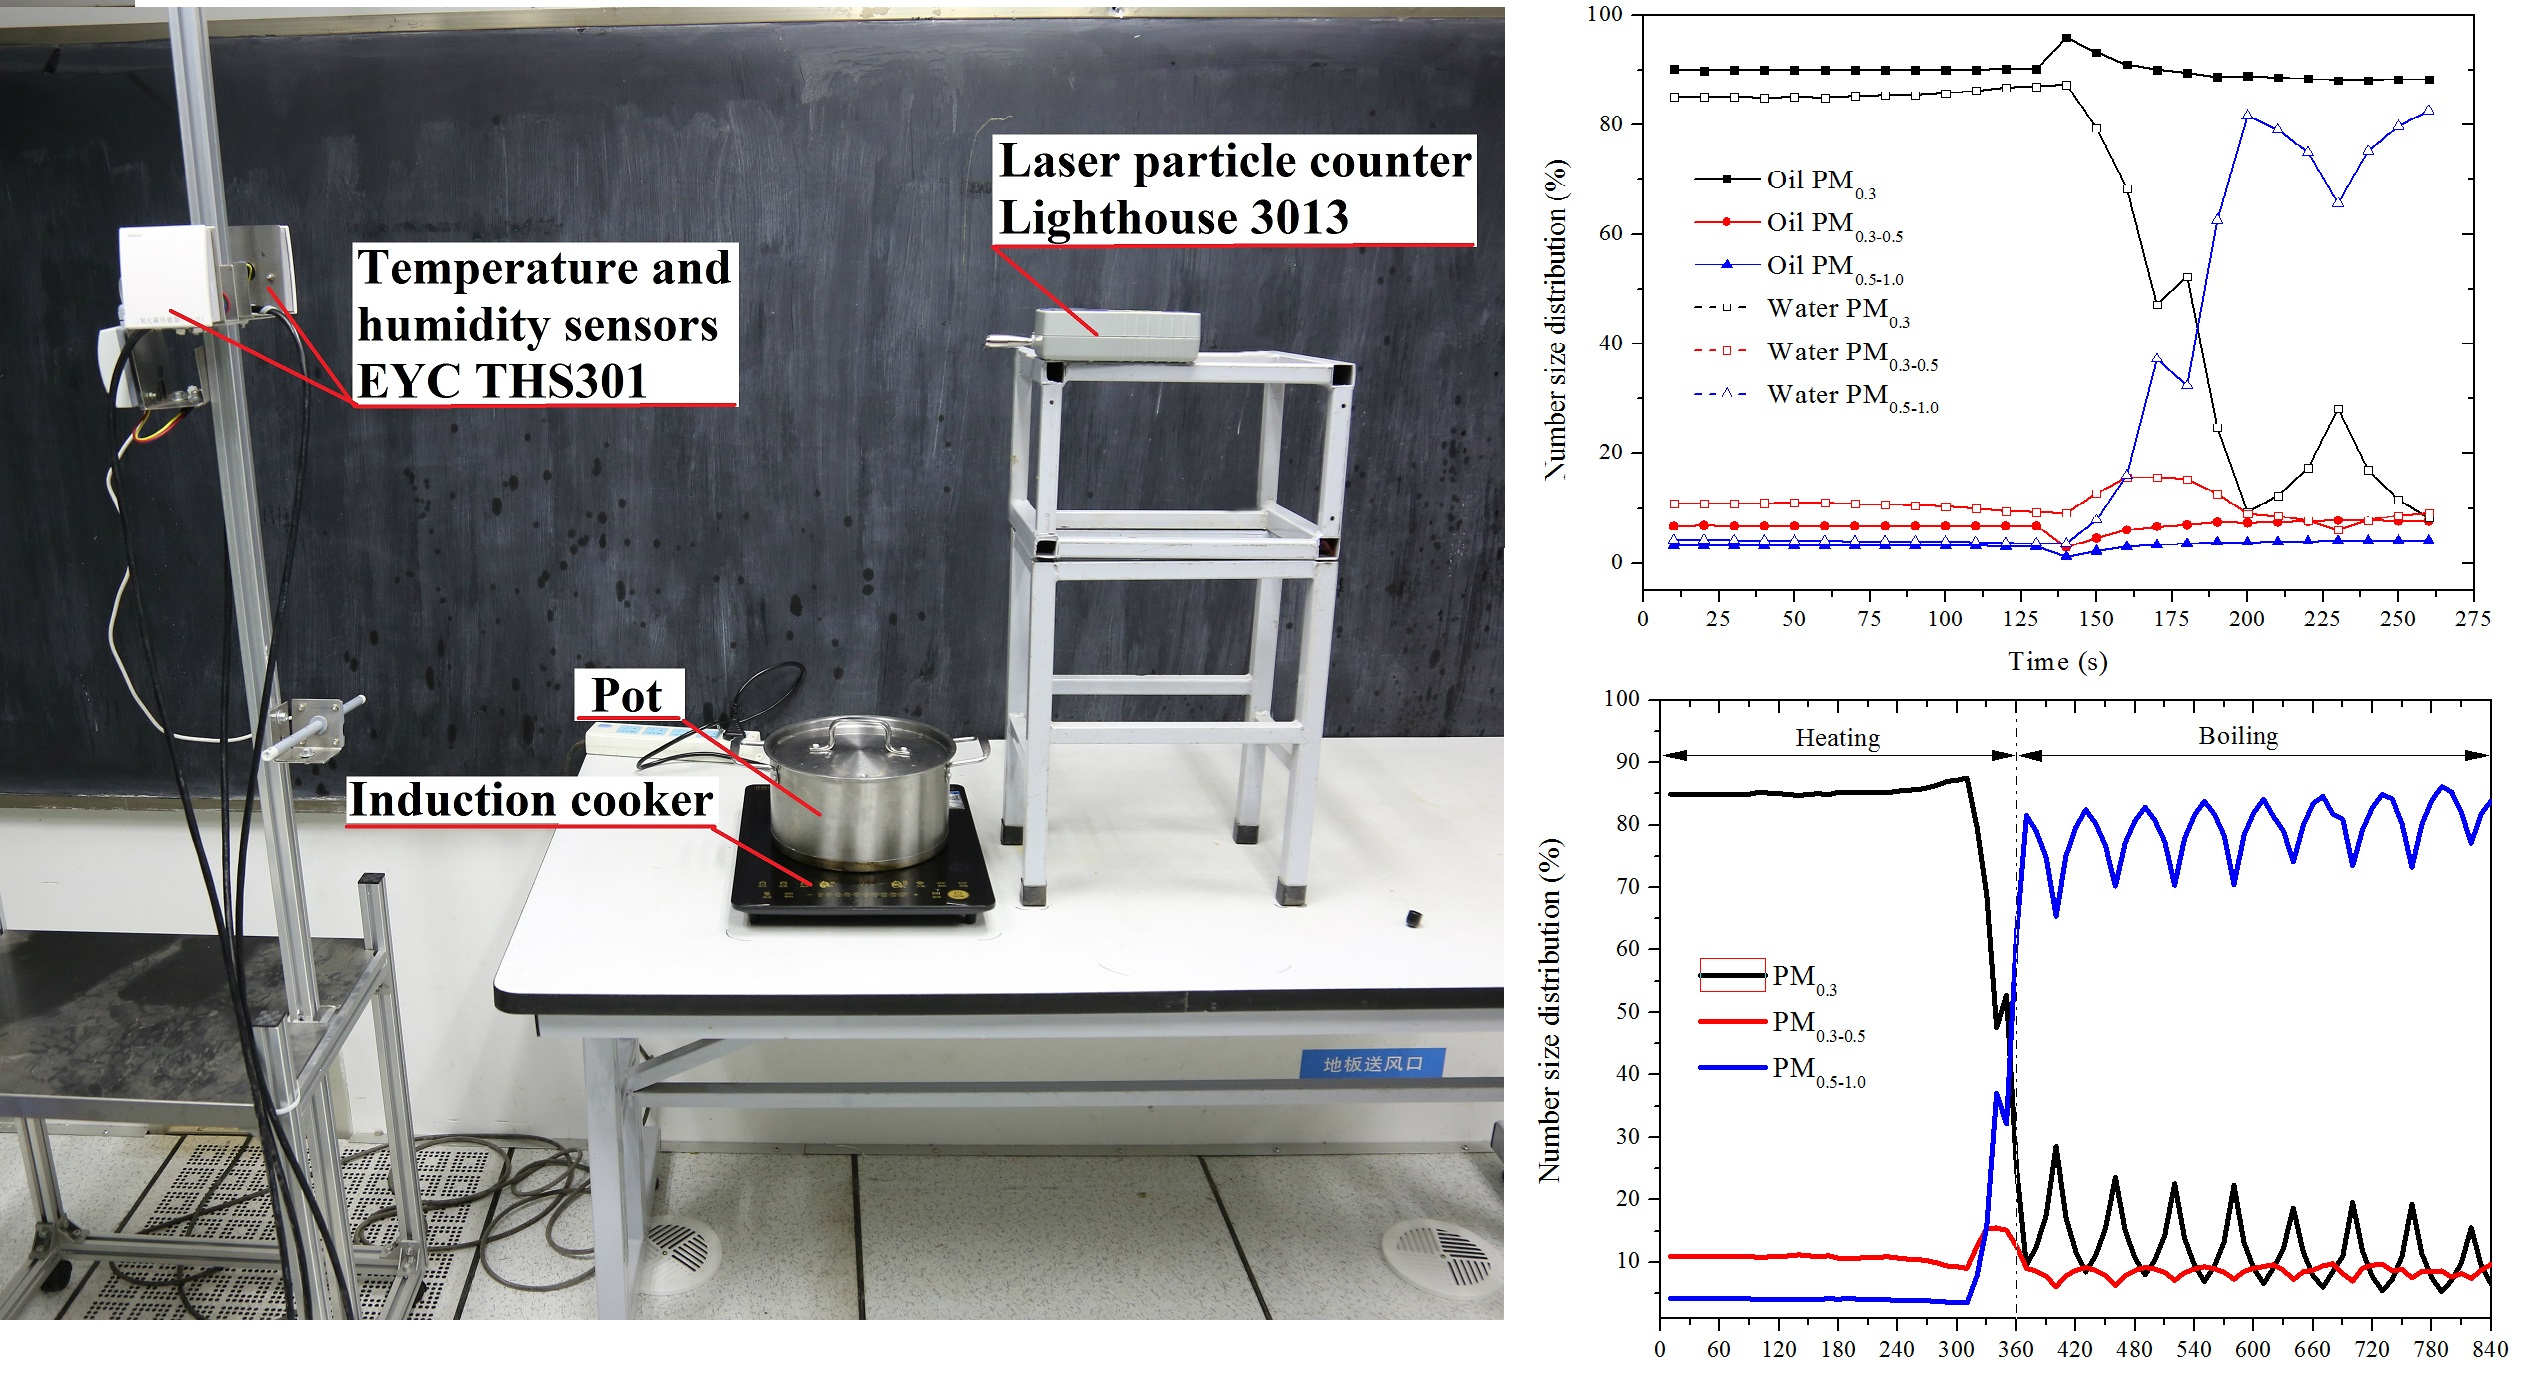
2.1. Particle Emission Experiments for Boiling

The food materials involved in the test included noodles, potatoes, fish, tofu, meatballs, and pork. Among them, starch is the main component of noodles and potatoes, protein is the main component of fish and tofu, and fat is the main component of meatballs and pork belly. In order to better compare the experimental data, the test included a set of comparative experiments, in which only the water was heated and no food materials were added to the water. All the ingredients except noodles and pork were cut into cubes with a size of 1 × 1 × 1 cm to exclude the influence of the food shape on the particle concentration. The noodles were purchased at the local supermarket. The pork was thinly sliced with a cross-sectional area of 2 × 3 cm. Before participating in the test, we waited for the evaporation of water on the surface of food materials to evaporate to prevent the excess water from affecting the test data. The weight of the food in each experiment was 320 g. In addition, all of the boiling processes included water and food, without any seasoning or additives.
The experiments were conducted in a 5.4 × 3.6 × 2.9 m3 microclimate chamber (Figures S1 and S2). Before the experiment, the air conditioning system was opened first, the indoor temperature was adjusted to 22 ± 1 °C, and the relative humidity was adjusted to 20 ± 2%. Then the air conditioning system was turned off. A Lighthouse 3013 laser particle counter was used to sample the particle number concentration in the chamber. The sample data were recorded every 10 s. We started the experiment after the background value was stable. Moreover, 1.5 L of water was added to the pot, and heated in an induction cooker with a heating power of 2100 W. The size of the induction cooker was 280 × 350 × 47 mm. Its rated power was 2200 W, and its rated voltage was 220 V. The water was heated for 6 min until it boiled. After boiling, the food was put into the pot and heated for 8 min. When the heating stopped, the number concentration of the particles naturally decayed to the background level. Then, the experiment stopped and the pot was cleaned for the next experiment. The experiment was repeated three times in each case to obtain three groups of experimental data, and the average value of the data was taken as the final measurement value. The dynamic change of the boiling emission concentration in the closed chamber was measured first, and then the emission rate of the particle source was determined. The experimental cases are shown in Table 1. Detailed information about the testing chamber, sampling location, and instrument specifications are provided in the previous study [27].

2.2. Emission Rate Estimation

The mass balance differential equation was employed to calculate the source strengths by assuming that the air was well mixed in the experiment chamber and its ambient concentration was steady:
d C i n ( t ) d t = P · A E R · C o u t + S p V k T · C i n
During the experiment, the ventilation system was off, and the door and windows were closed. Due to the high concentration of indoor particulate matter, the penetration efficiency (P) was generally ignored [20]. The processes involving particles were often neglected in indoor environments in many studies, such as coagulation, evaporation, and condensation. It is believed that the total removal rate ( k T ) is only related to the deposition rate and AER [23,28,29,30]. However, the particle number concentration emitted during the cooking process usually exceeds 106 part cm−3, while the coagulation effect cannot be ignored [31,32]. In this experiment, k T is the total removal rate due to the coagulation, evaporation, deposition, and air exchange rate (AER) in the kitchen. The detailed mathematical approaches to calculating the total removal rate, coagulation rate, and deposition rate are provided by Zhao et al. [27]. In order to solve Equation (1), the indoor particle concentration C i n 0 at the beginning t 0 is determined as the steady state value before the measurement, which is reasonable because of the long time wait before each measurement. The solution of the indoor particle concentration for Equation (1) is as follows:
C i n ( t ) = S p k T V e k T Δ t + C i n ( t 0 ) + S p k T V
The number concentration–time series is analyzed to calculate the emission rate. Using the average total removal rate, Equation (1) is simplified by using average values instead of functions. Briefly, the emission rate is assumed to be constant over the sample duration, and the steady-state solution of Equation (1) previously proposed by He et al. [28] is as follows:
S p ¯ = V × [ C i n ( p ) C i n ( 0 ) Δ t + k T ¯ × C i n ¯ ]

2.3. Statistical Analysis

The standard deviation (SD) is often used to measure the degree of statistical distribution in probability statistics. The standard deviation is the arithmetic square root of the variance. The standard deviation reflects how discrete a dataset is.
σ = 1 N i = 1 N ( x i μ ) 2

3. Results and Discussion

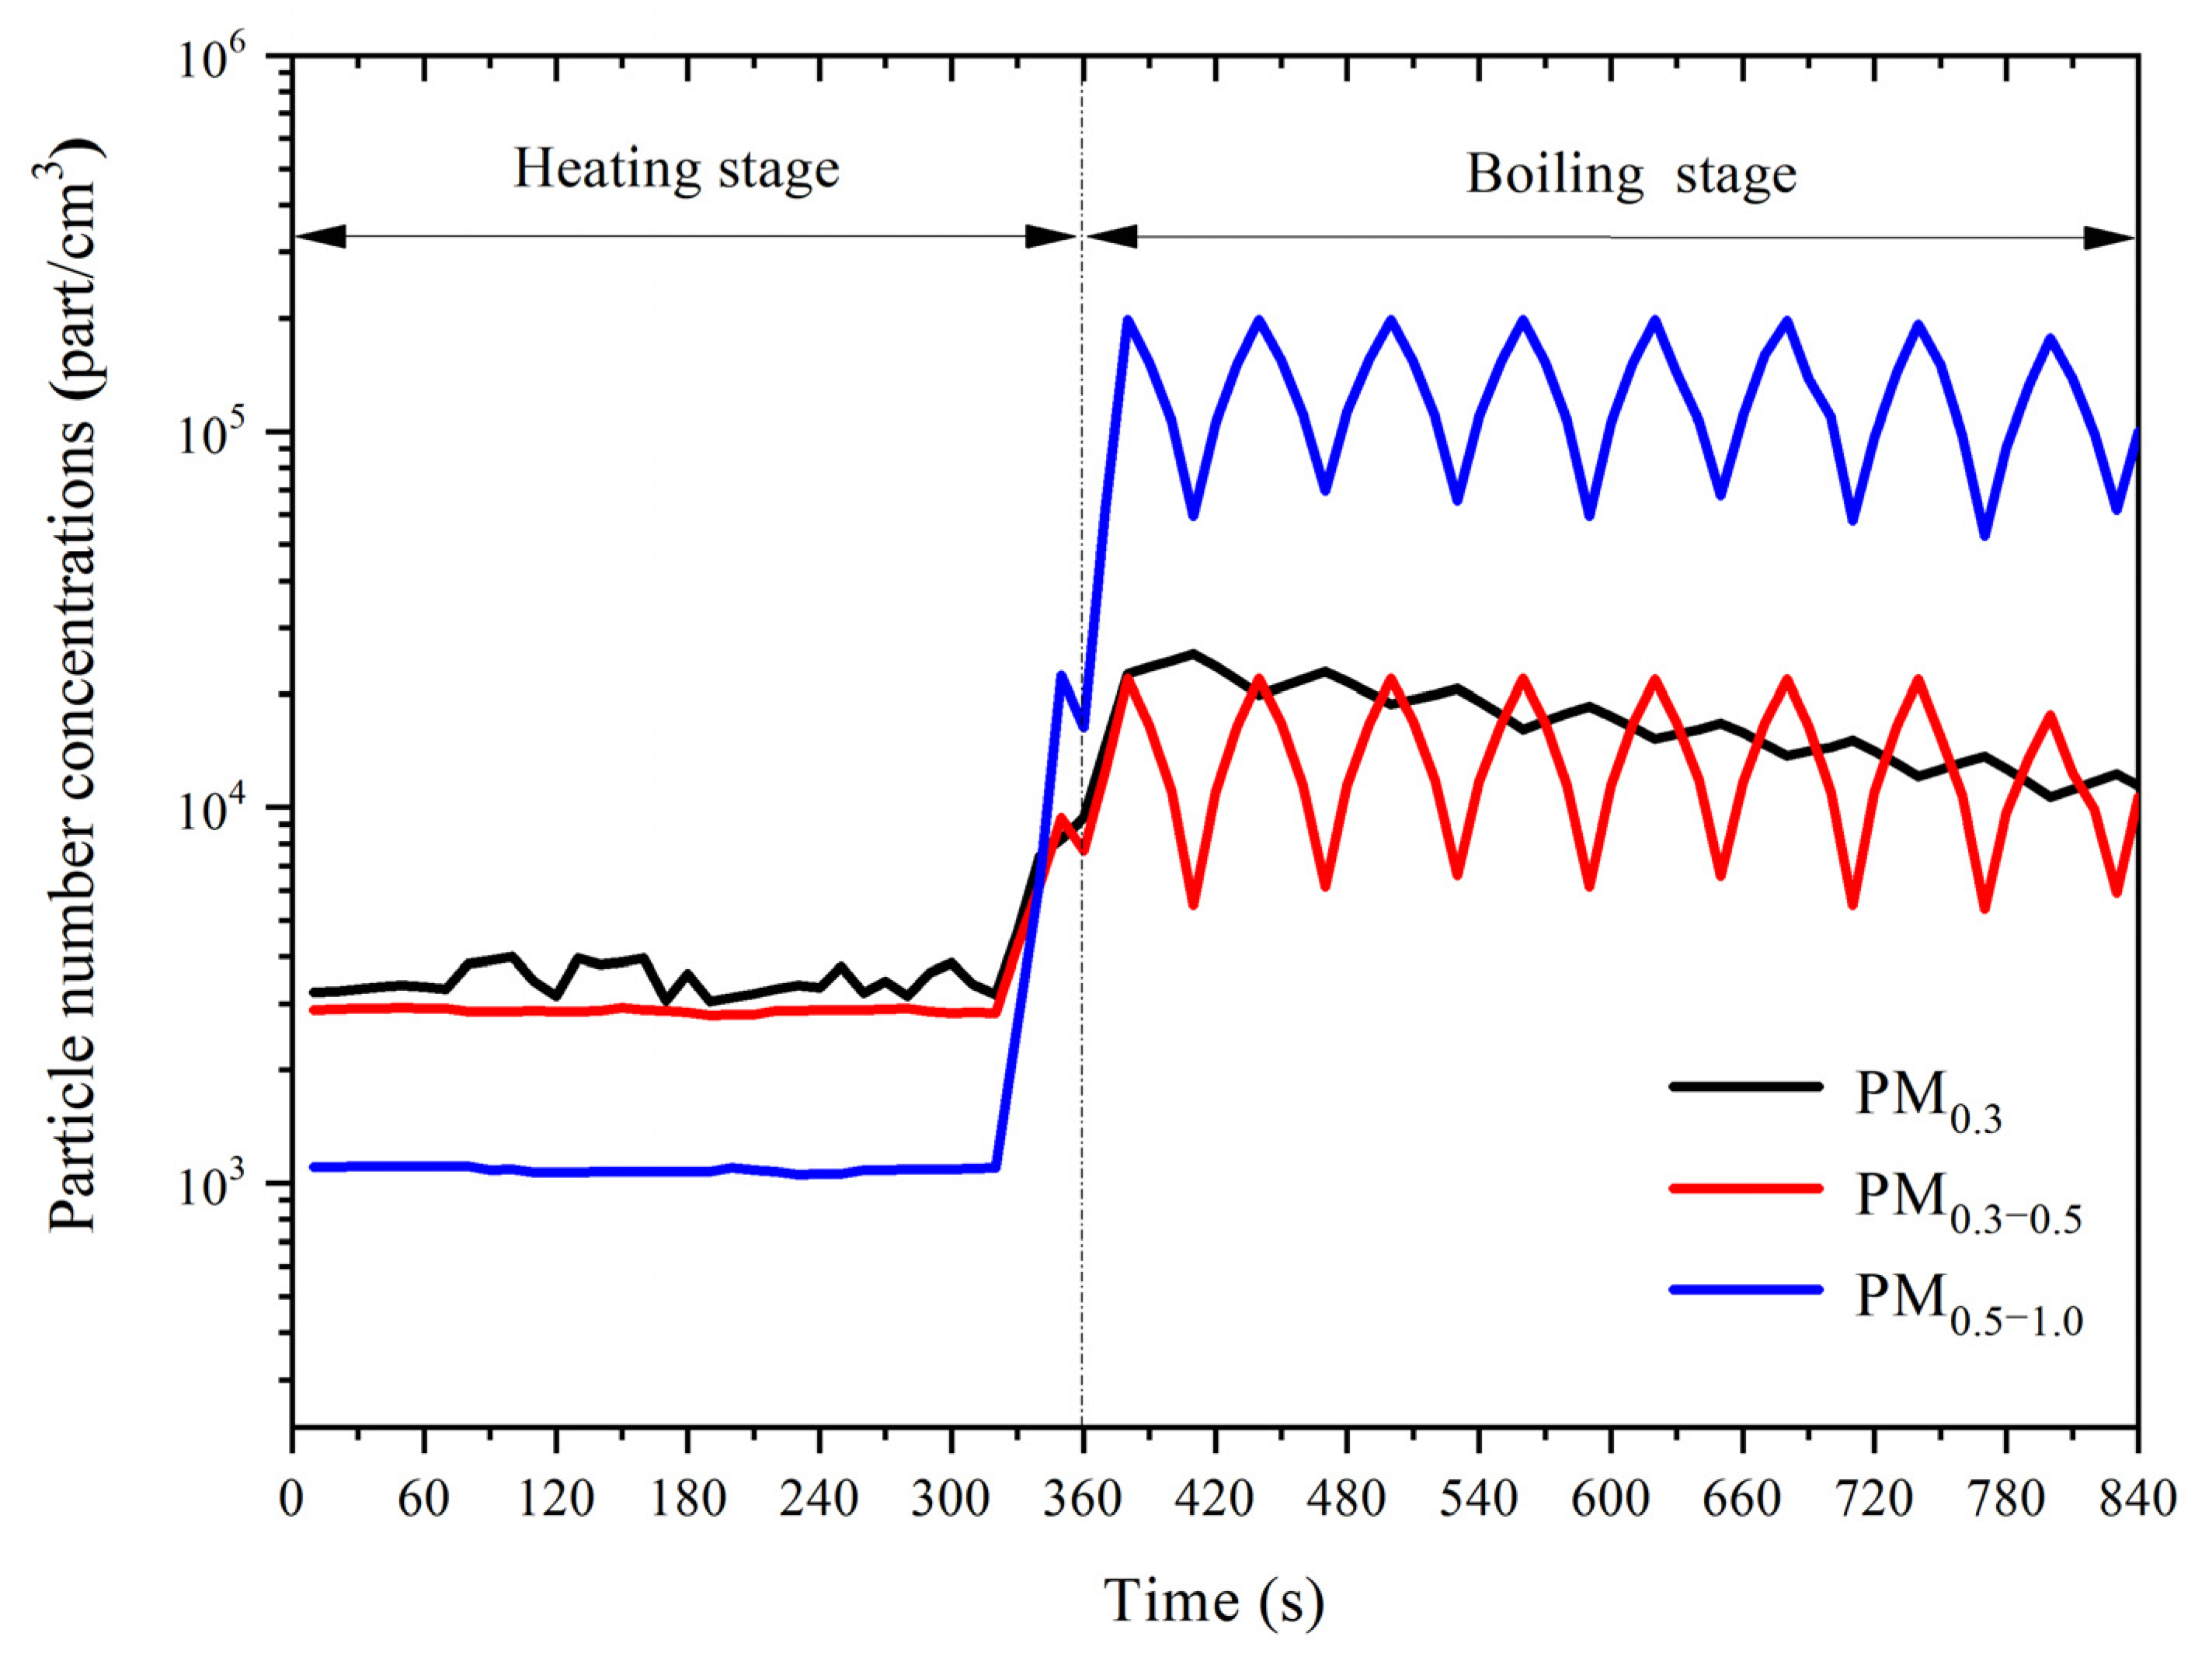
3.1. Particle Number Concentration

The mean concentration (mean value ± standard deviation, similarly after this) and peak concentration of particulate matter released during the boiling are shown in Table 2. The emission of PM0.5–1.0 was the highest, with an average value of 79,137 ± 75,187.2 part/cm3 (Meatball)~69,897 ± 65,638.7 part/cm3 (Pork). The peak concentration was 214,220 part/cm3 (Meatball)~187,015 part/cm3 (Pork). The emission of PM0.3–0.5 was the lowest, with the mean concentration between 9237 ± 6416.1 part/cm3 (control group) and 8893 ± 6176.9 part/cm3 (pork), and the peak concentration between 21,995 (control group) and 21,175 part/cm3 (Pork).
In Table 2, the particle number concentrations are compared with data from the control group. The statistical analyses were conducted using the statistical analysis software—SPSS. As the distributions of the data were not normal, the Mann–Whitney U test was employed. A level of significance of p = 0.05 was used for all statistical procedures. If p < 0.05, it denotes a statistically significant difference. As seen from the table, there is no significant difference in particle number concentrations no matter what food is cooked. This indicates that food material has no significant impact on particle emission. It is the boiling water itself that determines the particle number concentration. In addition, the shapes of noodles and pork are different from other foods. However, the concentration of particles produced during the cooking of noodles and pork did not differ significantly from the control group. This showed that the shape of the food also had no significant effect on the particle number concentration. Since there was no significant difference in the particles produced by various foods during the boiling, the control group (boiling water) was taken as an example to analyze its emission characteristics over time and compared with heating oil.
Figure 1 depicts the change of particle number concentration with time during water heating and boiling. During the heating process, the particle number concentration was unchanged. Within 60 s of boiling, the number concentrations of PM0.3, PM0.3–0.5, and PM0.5–1.0 all increased sharply. Among them, PM 0.5–1.0 increased the most, while PM0.3–0.5 increased the least. At 360 s, PM0.3–0.5 and PM0.5–1.0 reached their maximum values of 21,990 part/cm3 and 198,381 part/cm3, respectively. PM0.3 reached the maximum value of 27,570 part/cm3 at 370 s. During the boiling stage, the particle number concentration fluctuated for 60 s. PM0.5–1.0 had the most extensive fluctuation range. The amplitude ranged from 139,569 part/cm3 (720–750 s) to 114,723 parts/cm3 (780–810 s). PM0.3–0.5 fluctuated between 16,542 part/cm3 (720–750 s) and 11,677 parts/cm3 (780–810 s). PM0.3 fluctuated between 5626 part/cm3 (380–420 s) and 1374 parts/cm3 (660–690 s). On the whole, the fluctuation amplitude and the particle number concentration both decayed with time. The fluctuation of PM0.3 was the opposite of PM0.3–0.5 and PM0.5–1.0. When the number concentration of PM0.3 increased, the number concentrations of PM0.3–0.5 and PM0.5–1.0 decreased. The results in Figure 1 show that the water-heating process had little influence on the particle number concentration. However, within a short period of boiling (60 s), a large number of particles are emitted, and the particles with larger sizes were released with higher concentrations.
Figure 2 compares the changes in the particle number concentrations generated during the heating processes of corn oil and water. Two time scales, i.e., heating corn oil to the smoke point and heating water to boiling, were unified to observe the differences in the particle number concentrations produced by the two cooking methods. As shown in Figure 3, when the corn oil was heated to the smoke point, the release of PM0.3, PM0.3–0.5, and PM0.5–1.0 rose rapidly, reaching the maximum values of 510,348, 44,388, and 23,481 parts/cm3, respectively. Among them, the number concentration of PM0.3 was the highest, and the concentration of PM0.5–1.0 was the lowest. This means that cooking in oil is more likely to produce more small particles. This is significantly different from the emissions during water boiling. Previous studies have shown that when the environmental relative humidity is high (e.g., 80%), the smaller particles produced by edible oil easily coagulate and become larger under the liquid bridging force [27]. However, during the heating process, the differences in particle size distributions were slight, and the emission trend was consistent when the relative humidity was low (e.g., 20%). Therefore, it can be considered that the differences in the particle number concentrations between cooking oil and water were not caused by high environmental humidity, but by the particle characteristics of the water itself.

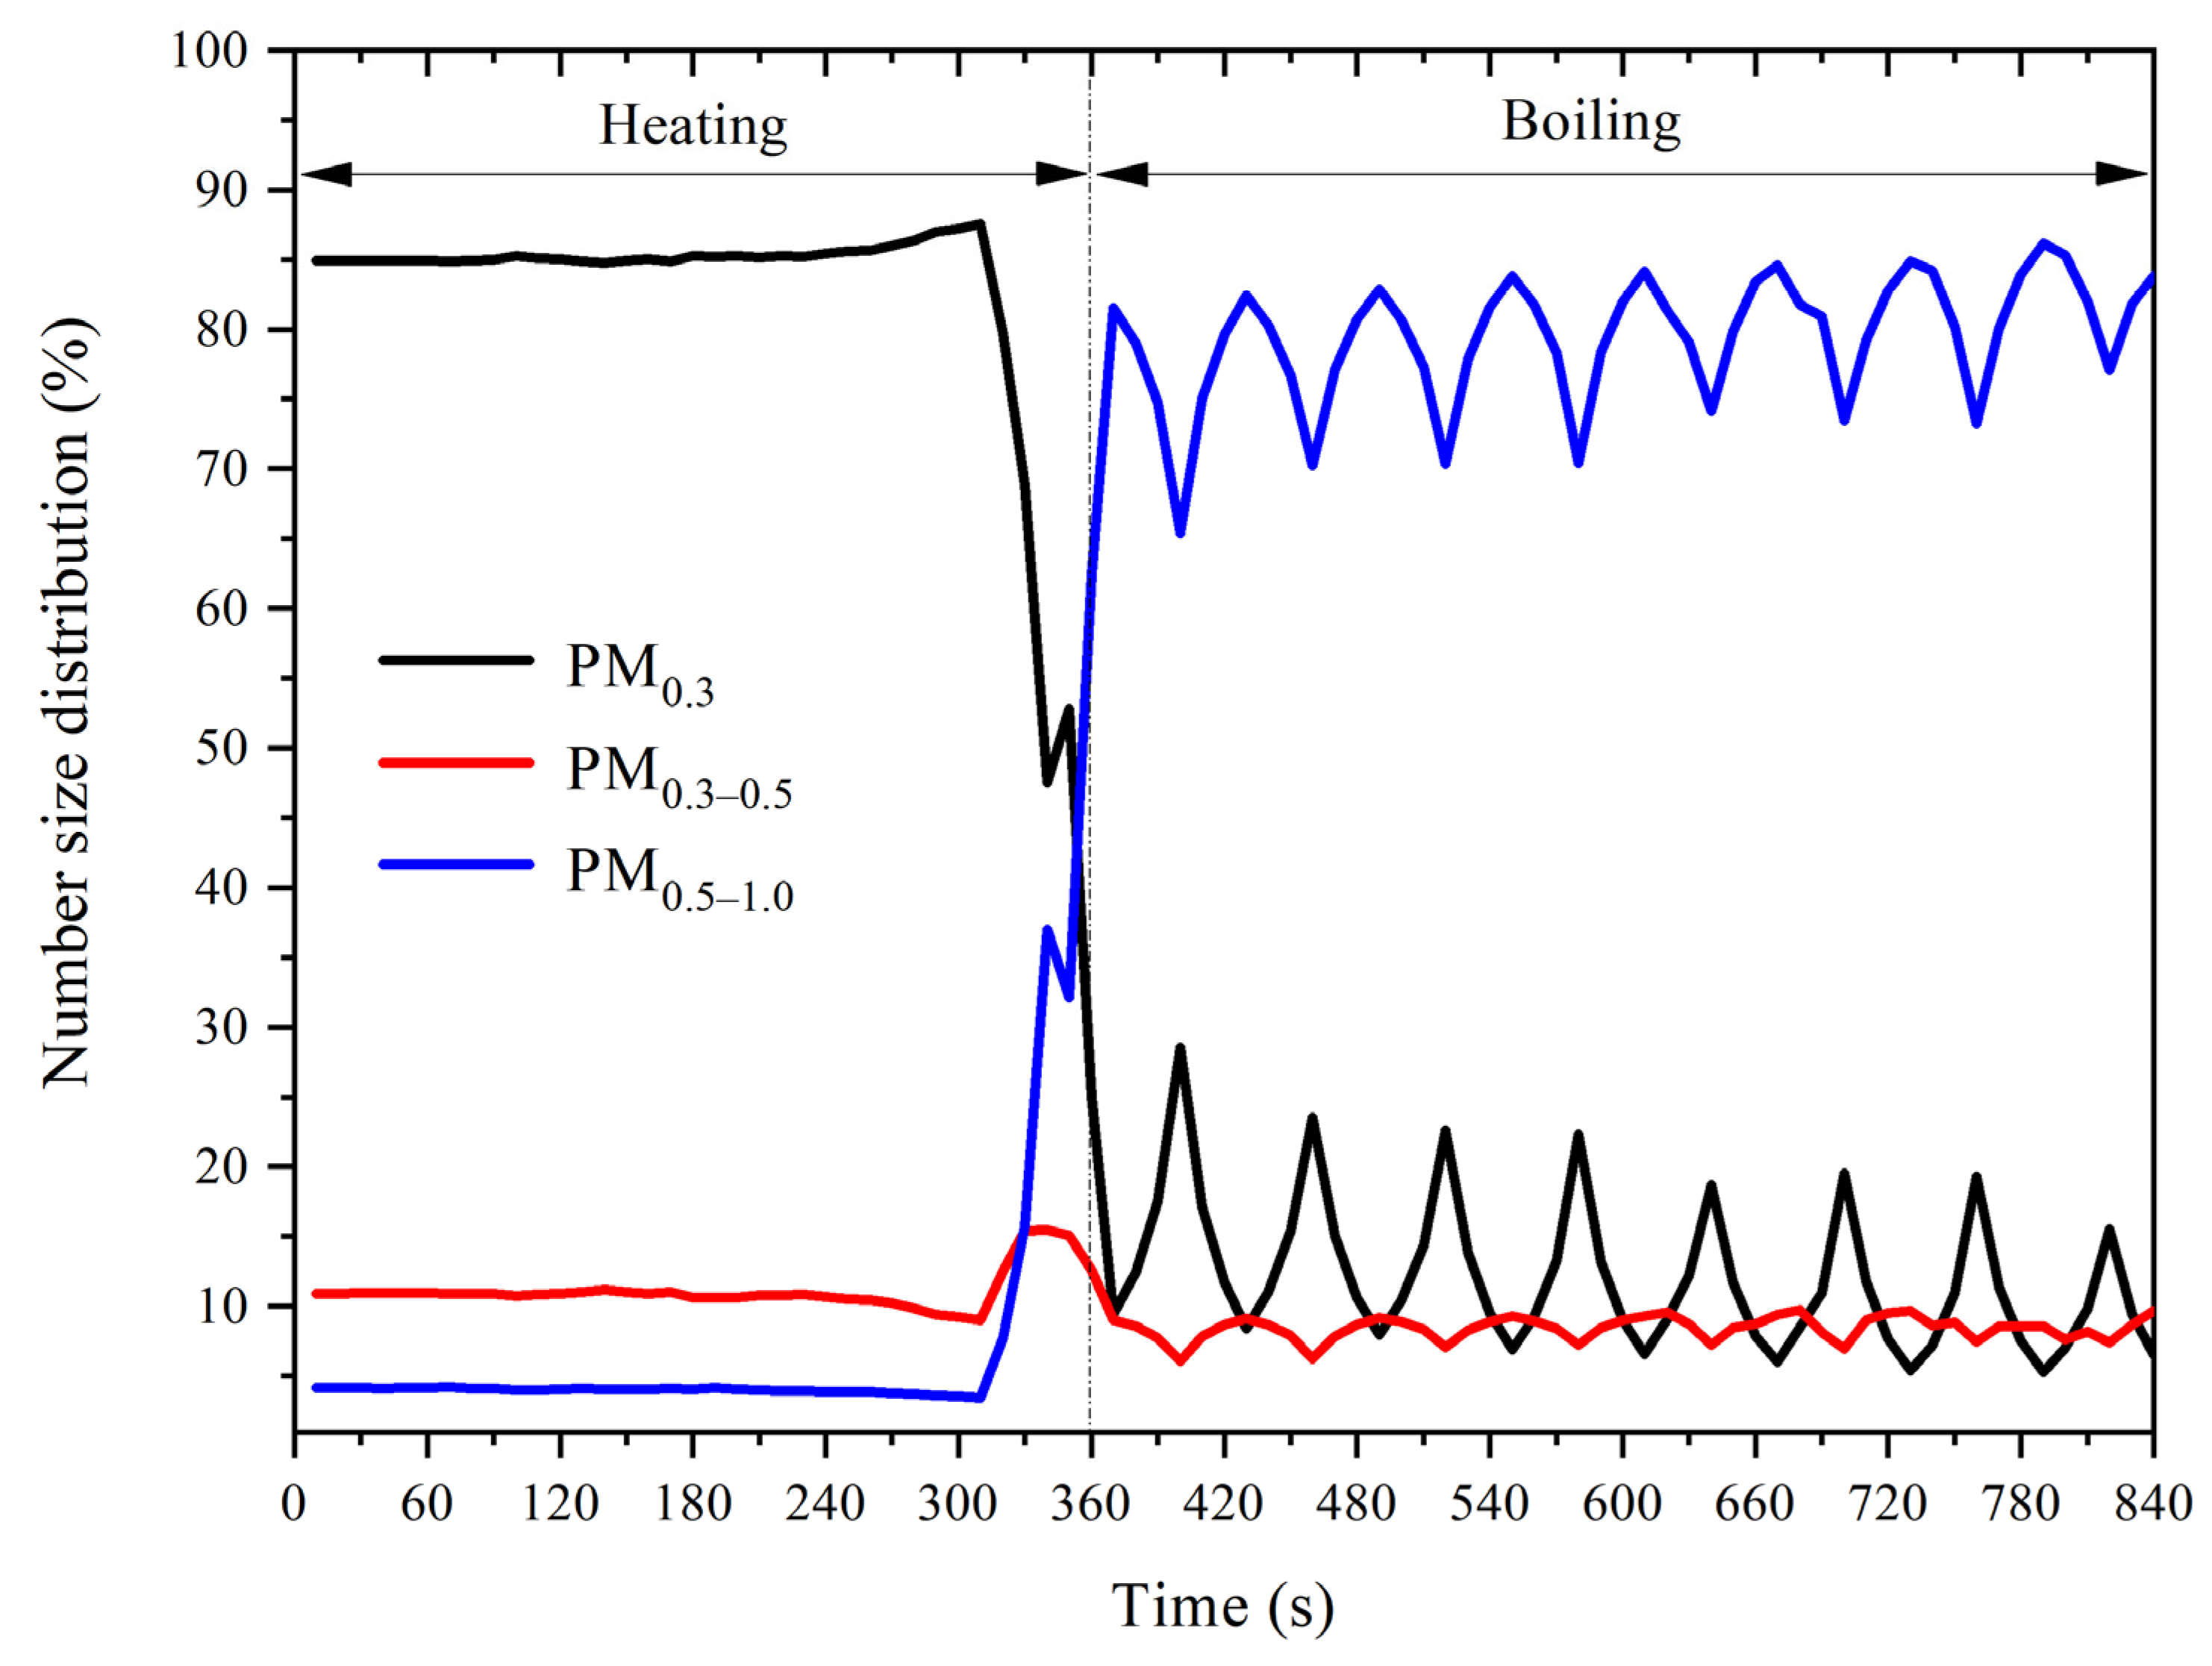
3.2. Particle Size Distribution

Figure 3 shows the average particle size distributions of boiling different foods. As seen from the figure, there are no significant differences in the particle size distributions of various foods produced by boiling, which is similar to the number concentration. The proportion of PM0.3 ranged from 41.03% (meatball) to 42.16% (noodle). The proportion of PM0.3–0.5 ranged from 9.02% (meatball) to 9.68% (fish), while the proportion of PM0.5–1.0 ranged from 48.23% (noodle) to 49.94% (meatball). Differences in food shapes were not factors in particle size distributions (for example, the particle size distributions of noodles and pork were similar to those of other food materials and the control group). Therefore, neither the material nor the shape of the food had a significant effect on the particle size distribution. It is the water-heating process itself that determines the particle size distribution. Therefore, the variations in particle size distributions during water heating were analyzed in detail.
Figure 4 shows the variation in the particle size distribution in time during boiling. The percentages of PM0.3, pm0.3–0.5, and PM0.5–1.0 changed significantly in the water-heating stage, which indicated that particles had entered the air before the water was heated to the boiling point. At approximately 250 s, the percentage of PM0.3 began to rise slowly and reached the highest point of 87.51% around 310 s. Then, the percentage dropped rapidly and gained 9.44% at 370 s. Within 60 s of heating to boiling, PM0.3 decreased by 78.08%. The proportion of PM0.3–0.5 reached the lowest value (9.01%) at 310 s and then increased slightly, achieving the highest value (15.48%) at 340 s before boiling, and then decreased to 9.04% (370 s). For PM0.5–1.0, the proportion also reached the lowest value at 310 s, which was 3.48%, then rapidly increased at boiling and reached 81.52% at 370 s, with an increase of 78.04%.
After boiling, the proportion of particles with different diameters began to fluctuate periodically, with a period of 60 s. The amplitude variations of PM0.3, PM0.3–0.5, and PM0.5–1.0 were 20.11% (400–430 s)–10.23% (790–820 s), 3.1% (400–430 s)–1.12% (790–820 s), and 17.01% (400–430 s)–9.03% (790–820 s), respectively. In general, the fluctuation of all particles showed an attenuation trend. The proportion of PM0.3 gradually decreased, the proportion of PM0.3–0.5 remained unchanged overall, and the proportion of PM0.5–1.0 gradually increased.
Figure 5 compares particle size distributions with time when heated water and corn oil are added. We unified the timelines of oil heating to the smoke point and water heating to boiling. It was found that the particle size distribution was significantly different between corn oil and water heating. When the corn oil was heated to the smoke point, the proportion of PM0.3 increased, while the proportions of PM0.3–0.5 and PM0.5–1.0 decreased correspondingly. The extreme value appeared approximately 10 s after the smoke point. The ratio of PM0.3 in corn oil increased from 90.16% to 95.88%, while the proportions of PM0.3–0.5 and PM0.5–1.0 decreased from 6.78% and 3.06% to 2.91% and 1.21%, respectively. During the initial heating of cooking oil, more smaller diameter particles were produced. With continuous heating, the proportion of PM0.3 gradually decreased, while PM0.3–0.5 and PM0.5–1.0 gradually increased. At the end of the heating process, the lowest PM0.3 proportion was 88.26% at 260 s. The proportions of PM0.3–0.5 and PM0.5–1.0 reached the maximum values in the whole process, which were 7.67% and 4.06%, respectively. This indicates that the proportion of large-diameter particles increased with the heating process, but the ratio of small particles less than 0.3 μm was still high.
The boiling process of water is different from that of edible oil. As can be seen from the figure, the percentage of PM0.3 decreased significantly (from 90% to about 10%) within 60 s of it entering the boil. At the same time, the proportion of PM0.3–0.5 and PM0.5–1.0 increased dramatically (from 9% to 15% and 3% to 80%, respectively). In addition, with the continuous boiling of water, the particle size distributions of PM0.3, PM0.3–0.5, and PM0.5–1.0 all fluctuated, and the fluctuation period was 60 s. Similar to the number concentration, the fluctuations of PM0.3, PM0.3–0.5, and PM0.5–1.0 were the opposite so when the proportion of PM0.3 decreased, the proportions of PM0.3–0.5 and PM0.5–1.0 increased. In conclusion, in the process of water heating, the proportion of small particles was high. When the water reached boiling, the small particles rapidly decreased, and the larger particles of 0.3–0.5 µm occupied higher proportions.

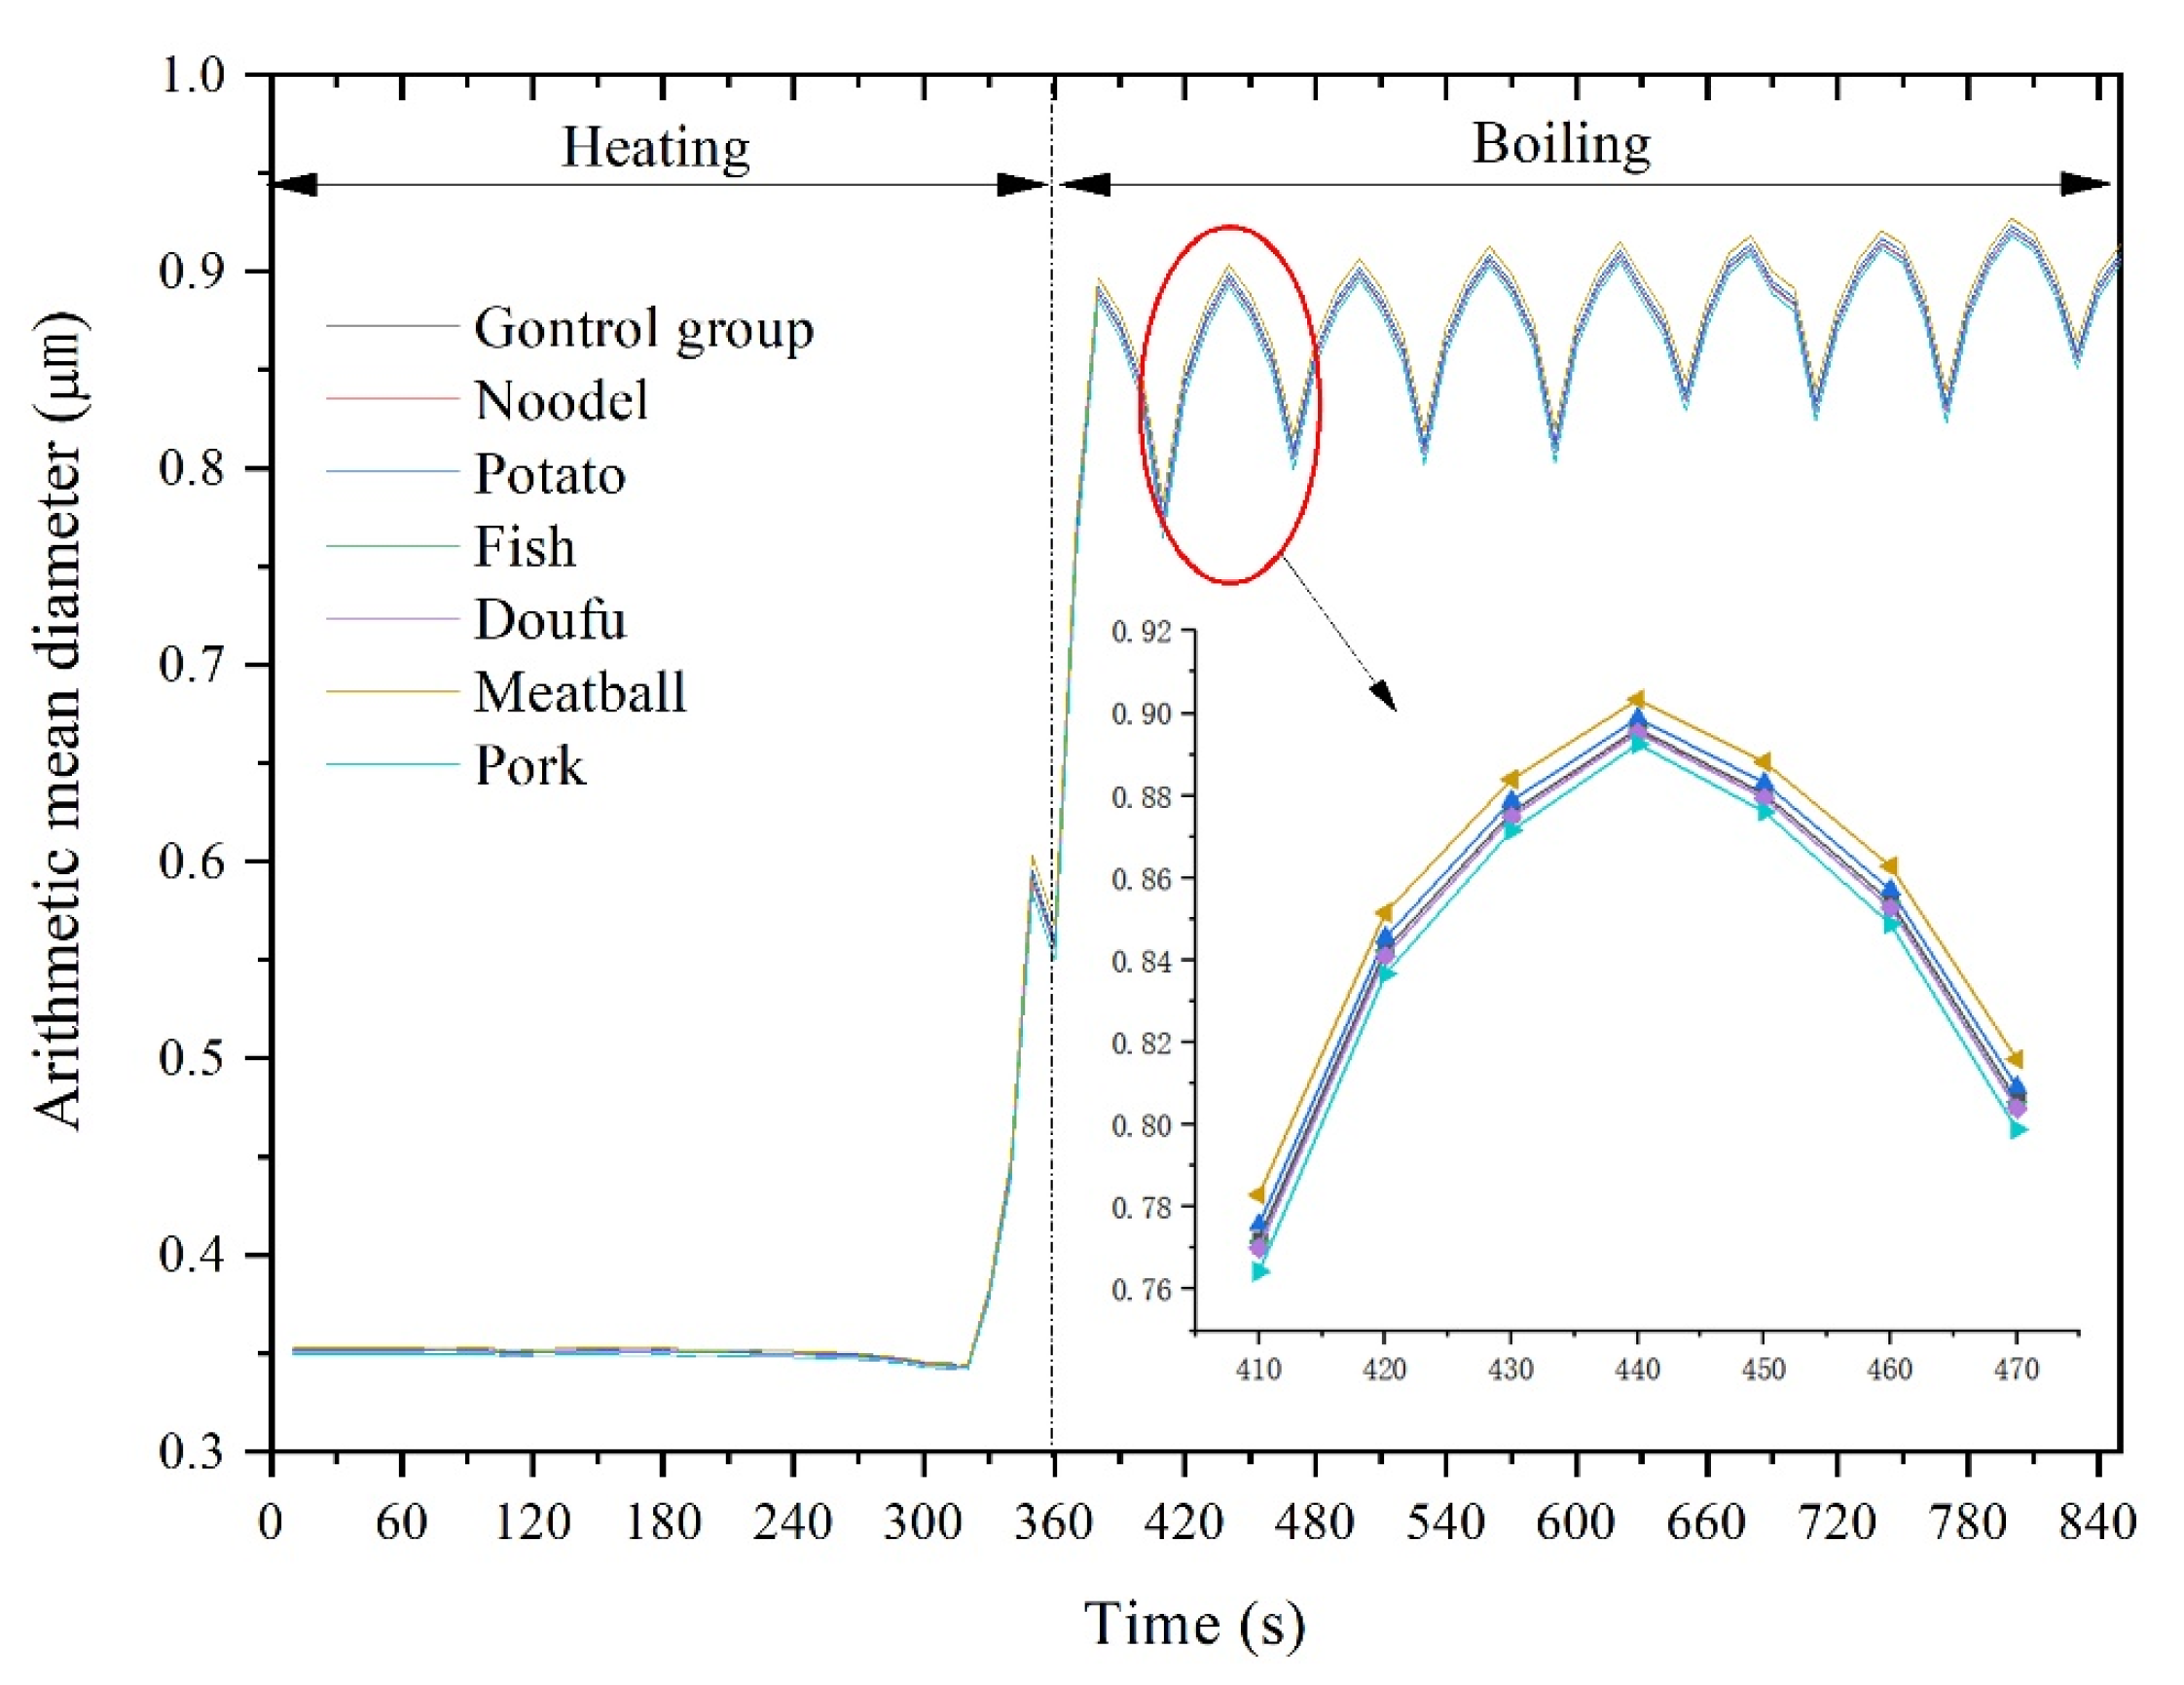
3.3. Particle Arithmetic Mean Diameter

Figure 6 shows the variation of particle arithmetic mean diameter during boiling. There was no significant difference in the arithmetic mean diameter between different foods, but the arithmetic mean diameter of particles showed apparent regularity over time. At the initial stage of water heating, the arithmetic mean diameter of the particles was stable at around 0.35 µm. The arithmetic mean diameter of the particles decreased slightly as heating continued, reaching the minimum value at 320 s, which was 0.34129 µm (pork) < 0.3423 µm (doufu) < 0.3424 µm (noodle) < 0.3426 µm (fish) < 0.3429 µm (control group) < 0.3431 µm (potato) < 0.3440 µm (Meatball). After that, the arithmetic mean diameter of the particles increased sharply as the water reached boiling. The first peak occurred at 380 s, which was 0.8857 µm (pork) < 0.8886 µm (fish) < 0.8887 µm (doufu) < 0.8888 µm (noodle) < 0.8896 µm (control group) < 0.8923 µm (potato) < 0.8971 µm (meatball), respectively. At 360 s, there was a fluctuation due to the addition of food. During the boiling process, the arithmetic mean diameter of particles also fluctuated with time, and the fluctuation period was also 60 s. The amplitude decayed with time, and the arithmetic mean diameter showed an increasing trend.
Figure 7 shows the change in the arithmetic mean particle diameter over time during the heating process of water and corn oil. When corn oil and water were heated, the arithmetic mean diameter of the particles produced was quite different. During the heating process of corn oil, the arithmetic mean diameter of the particles remained unchanged at 0.34 µm, and it decreased slightly to the minimum value of 0.31 µm approximately 10 s after the smoke point. With the heating progress, the arithmetic mean diameter of the particles increased gradually. As the heating process continued, the value increased again to 0.34 µm at 260 s. However, the heating process of water was significantly different from that of edible oil. The arithmetic mean diameter increased sharply (from 0.34 µm to about 0.89 µm) in the 60 s after boiling. In addition, with the continuous boiling of water, the arithmetic mean diameter fluctuated and its fluctuation period was also 60 s. Generally speaking, small particles accounted for a higher proportion of the water-heating process. With the boiling process, the proportion of large particles in cooking oil increased, while the proportion of small particles was always higher.

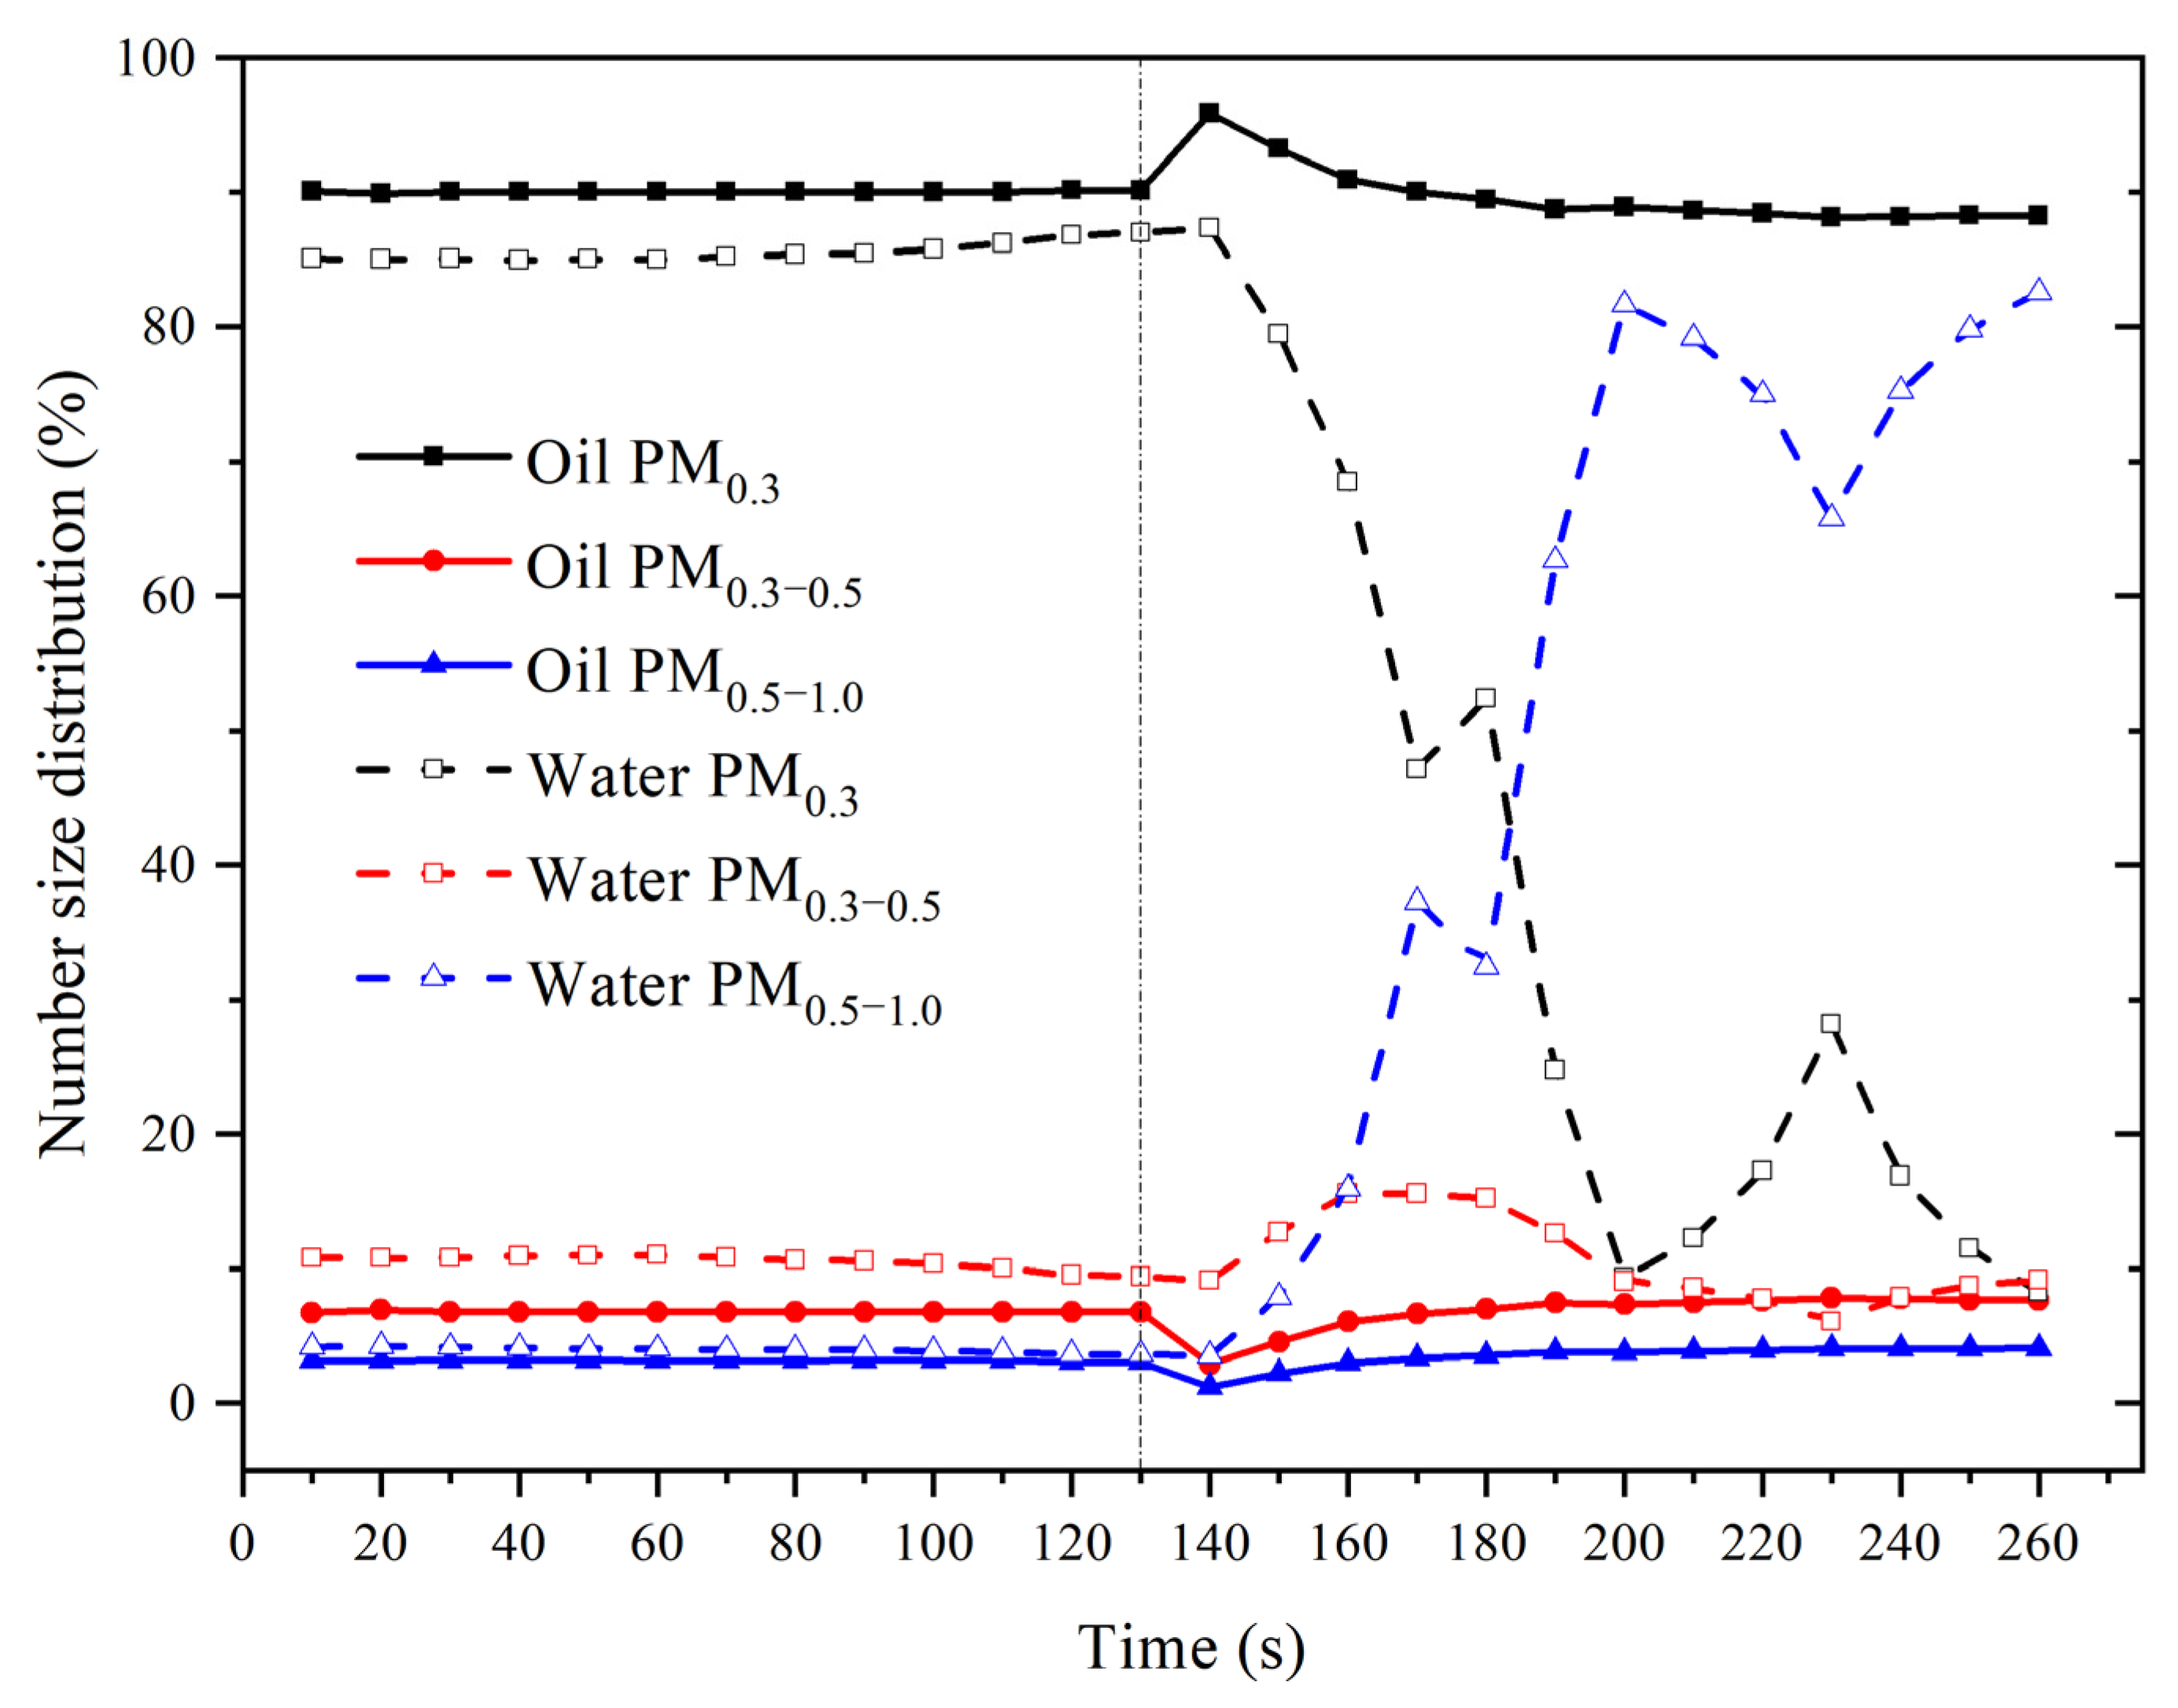
3.4. Particle Emission Characteristics

As can be seen from the above description, the number concentrations, size distributions, and arithmetic mean diameters of the particles produced during the boiling process all fluctuated periodically for 60 s, making them different from the characteristics of the edible oil heating process. Table 3 summarizes the average fluctuation value of each parameter. The number concentration of PM0.5–1.0 fluctuated the most, from 143,220.2 part/cm3 (meatball) to 125,031.4 part/cm3 (pork). PM0.3 fluctuated the least, from 3329.4 part/cm3 (control group) to 2831.8 part/cm3 (potato). PM0.3–0.5 fluctuated from 15,394.7 part/cm3 (control group) to 14,820.8 part/cm3 (pork). For the particle size distribution, PM0.3 showed the most significant fluctuation from 15.19% (pork) to 14.00% (meatball). PM0.3–0.5 fluctuated the least, from 2.01% (meatball) to 2.36% (pork). PM0.5–1.0 fluctuated between 11.99% (meatball) and 12.83% (pork). The particle arithmetic mean diameter fluctuated between 0.088 (meatball) and 0.0945 (pork). All fluctuations decreased with time.
The particles produced in the boiling process are droplets containing solids, whose movements are not only affected by gravity, drag force, and other forces but are also accompanied by evaporation. The existence of evaporation makes droplet movements more complex than gaseous pollutants and solid particles. The fluctuation phenomenon is related to the violent boiling behavior of water; that is, the fluctuation of the liquid level and the generation of bubbles. The opposite fluctuations of small particles (PM0.3) and large particles (PM0.3–0.5, PM0.5–1.0) are related to evaporation. When the particles released during boiling are initially released into the flow field (ambient air), the main component is water. The evaporation and movement of the particles are similar to that of pure water droplets. As the water mass fraction decreases with evaporation, so does the droplet size. Therefore, the number of large-diameter particles begins to fall. In contrast, the number of small particles begins to increase (at this time, the percentage of PM0.3 is in the rising stage of a complete cycle, and the percentage of PM0.3–0.5 and PM0.5–1.0 is in the decline phase). As the boiling process continues, more large particles are released, so the number of large-diameter particles gradually increases. In contrast, the number of small diameter particles gradually decreases with evaporation (at this point, the percentage of PM0.3 is in a complete cycle of decline, while the percentages of PM0.3–0.5 and PM0.5–1.0 are in upward phases). When the proportion of solid to liquid reaches a critical value, the volume of the droplet will no longer shrink due to the constant content of solid components in the particle. As the water boils, the percentages of PM0.3, PM0.3–0.5, and PM0.5–1.0 begin to fluctuate in a new cycle. The main factors affecting droplet evaporation include the initial droplet temperature, initial droplet size, ambient pressure, ambient temperature, ambient relative humidity, and air velocity [33].

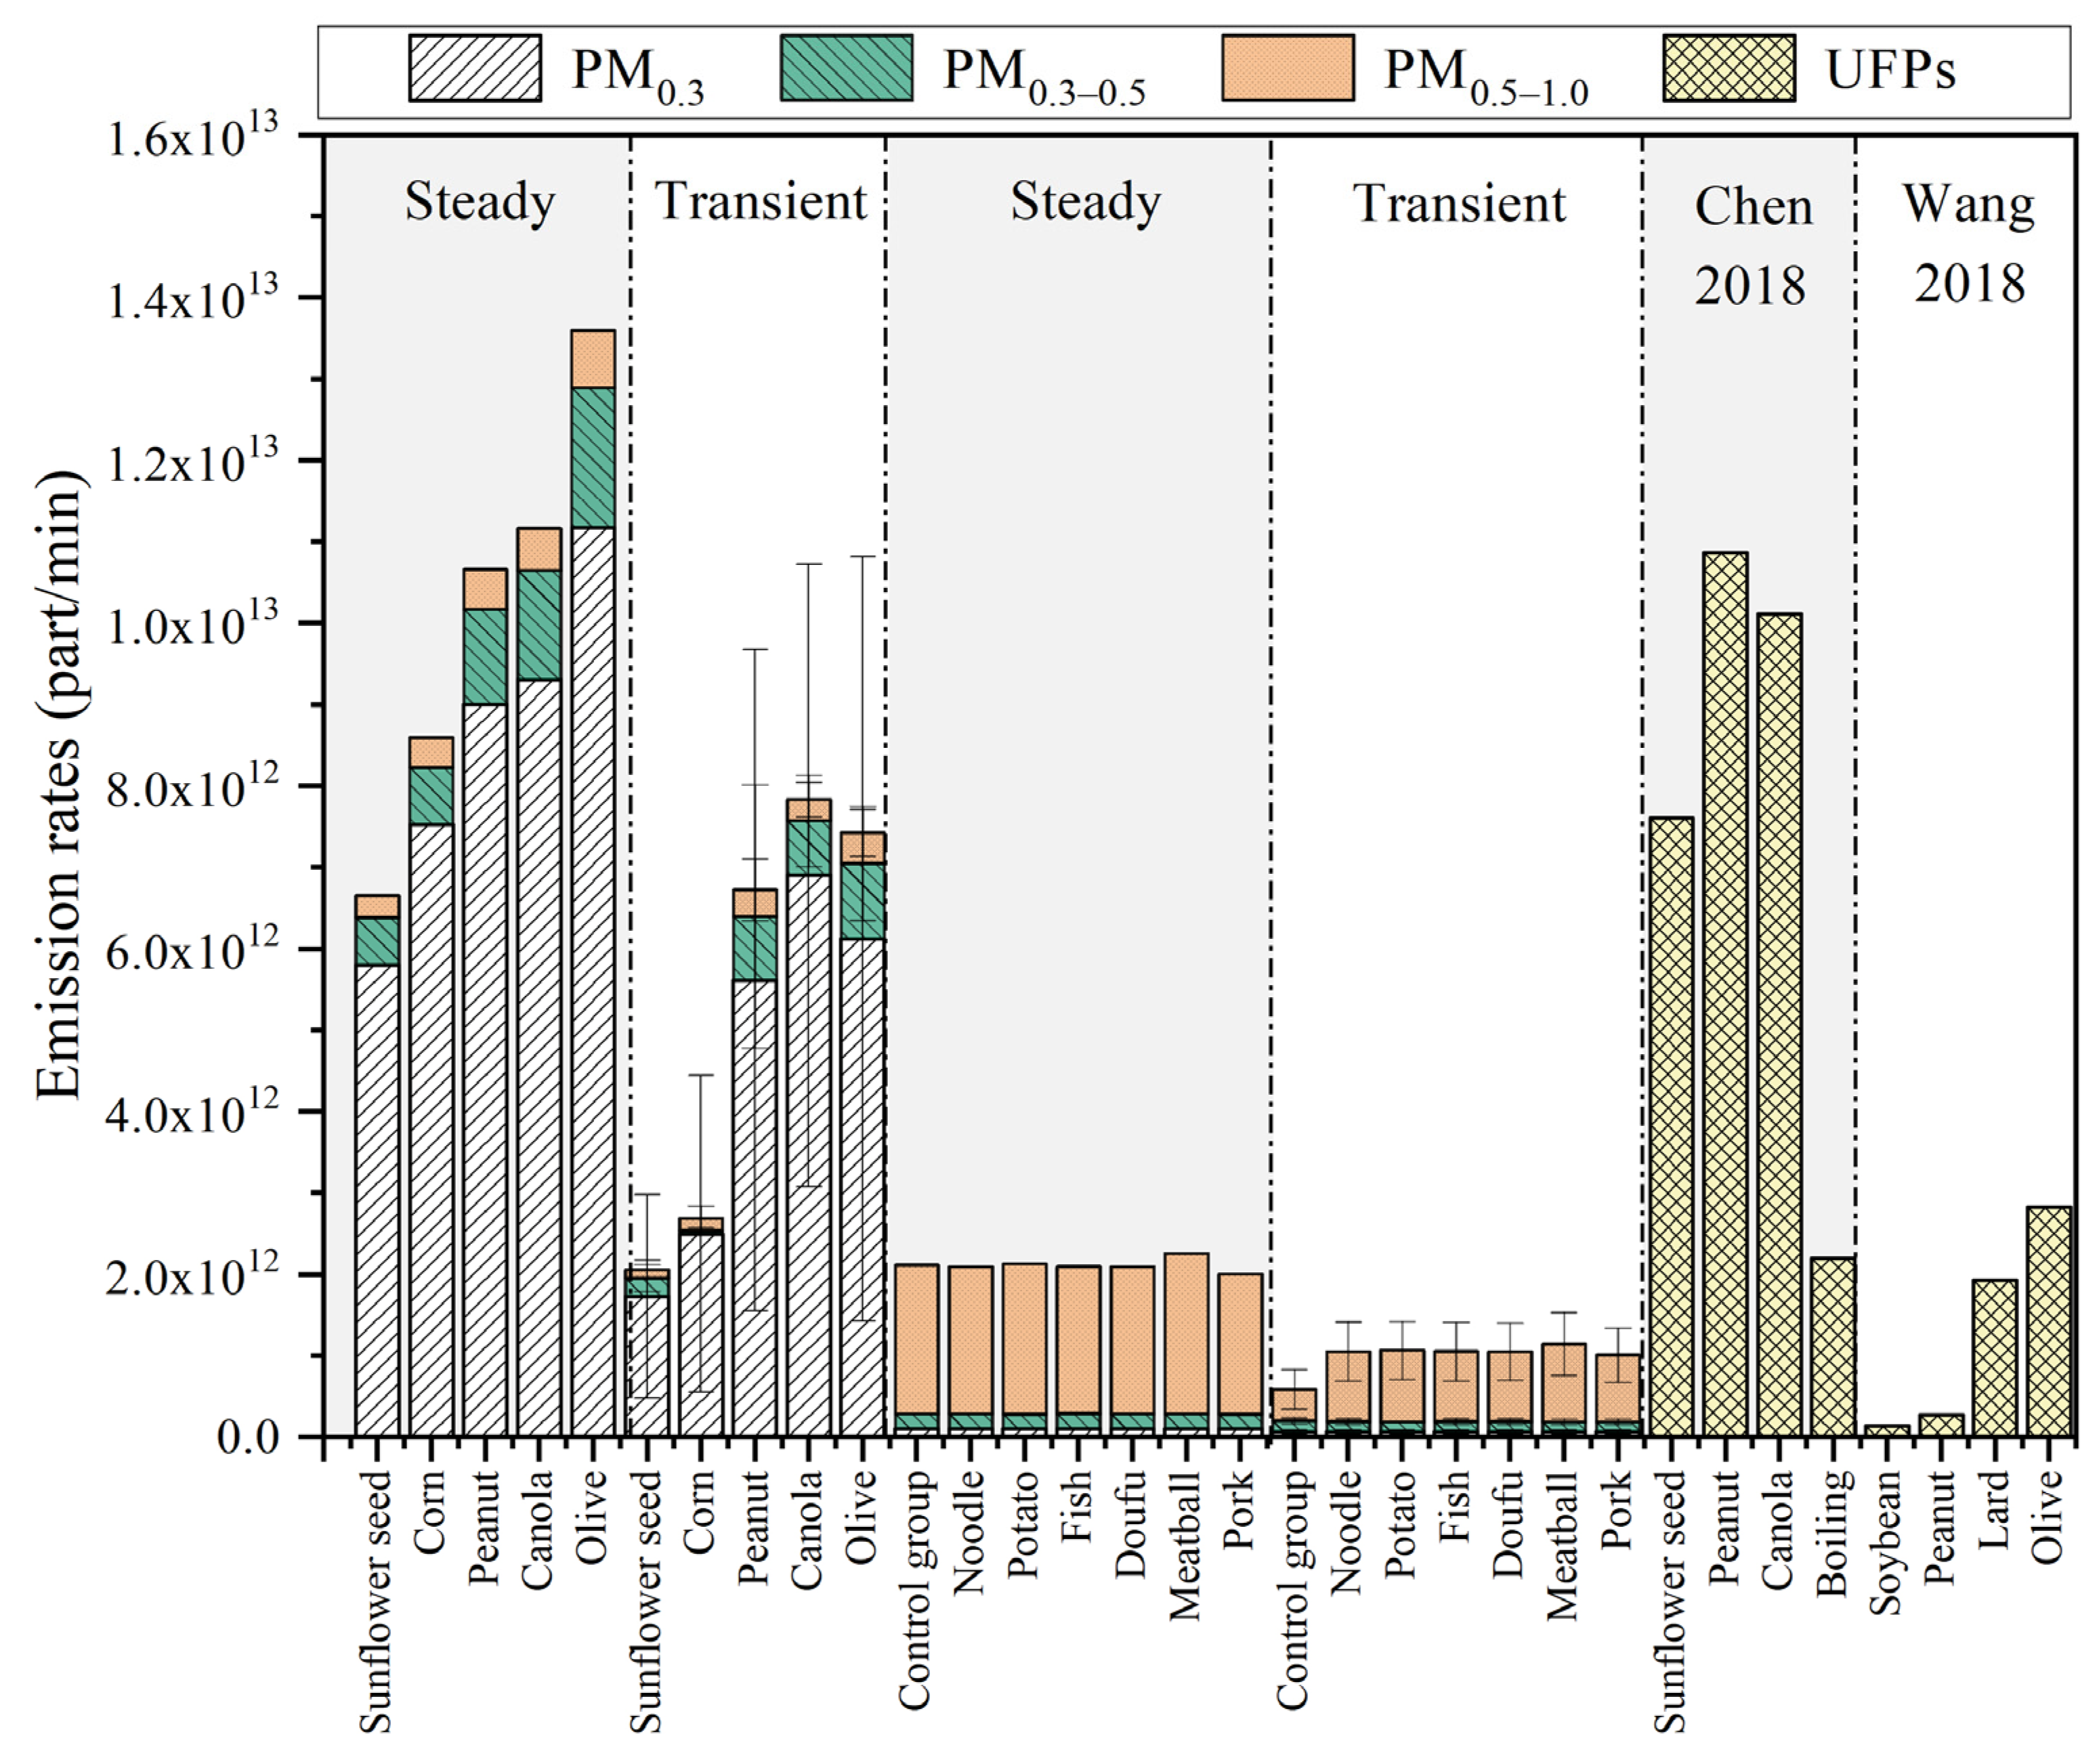
3.5. Particle Emission Rate

Figure 8 shows the comparison between the particle emission rate obtained in this experiment and previous studies. Chen et al. [34] adopted the transient calculation method, and Wang et al. [35] adopted the steady-state calculation method. The particle emission rate of heating edible oil was higher than that of boiling. For PM0.3, PM0.3–0.5, and PM0.5–1.0, the particle emission rates during oil heating were 28.0–112.4, 0.1–3.3, and 1.0–9.3 times that of water boiling, respectively. The difference in particle emission between oil heating and water boiling was mainly concentrated on the small particles less than 0.3 µm. In the process of oil heating, the emission rate of PM0.3 was the highest and that of PM0.5–1.0 was the lowest. The particle emission rate of edible oil is related to its smoke point. Cooking oils with lower smoke points, such as olive oil, release more particles when heated. Previous studies show that the particle emission rates of oil heating and boiling are between 1010 and 1012 #/min. The differences in emission rates between previous studies and this one can be attributed to the different cooking methods, heating temperatures, air exchange rates, food materials, and ingredients. Ideally, the source emission rate depends only on the source itself, independent of the chamber geometry, decay rate, and air exchange rate. However, the mechanisms of deposition, coagulation, evaporation, and condensation change the number concentration and particle size distribution. In this paper, the particle decay concentrations from these mechanisms are incorporated into the total removal rate k T . Still, these processes cannot be simply expressed as first-order decay constants, and specific errors will be generated based on this assumption.

4. Conclusions

In this study, the emission characteristics of the particles produced by boiling food were studied in an experimental chamber. The changes in the particle number concentration, size distribution, and arithmetic mean diameter compared with the oil heating process were obtained. The particle emission rate during the boiling process was calculated. The main conclusions are as follows:
  • In the water-heating process, the particle number concentration, size distribution, and arithmetic mean diameter were unchanged, while within 60 s of heating to boiling, they all changed sharply.
  • Water boiling tended to produce more large particles (0.5–1.0 µm), which were significantly different from the emissions of more small-sized particles (less than 0.3 µm) during the oil heating. Neither the food material nor the shape had a significant impact on the particle emission characteristics during the boiling process.
  • The number concentrations, size distributions, and arithmetic mean diameters of the particles produced during the boiling process all fluctuated in 60 s. The number concentration of PM0.5–1.0 fluctuated the most, ranging from 143,220.2 part/cm3 (meatball) to 125,031.4 part/cm3 (pork). For the particle size distribution, PM0.3 showed the most significant fluctuation from 15.19% (pork) to 14.00% (meatball). The particle arithmetic mean diameter fluctuated between 0.088 (meatball) and 0.0945 (pork). All the fluctuations diminished over time.
  • There was a significant difference between the transient and the steady-state calculation; the steady-state calculation had a high estimate of the emission rate. For PM0.3, PM0.3–0.5, and PM0.5–1.0, the particle emission rates of oil heating were 28.0–112.4, 0.1–3.3, and 1.0–9.3 times the food boiling, respectively. The difference in particle emission between oil heating and boiling mainly concentrated on small particles less than 0.3 µm.

Supplementary Materials

The following supporting information can be downloaded at: https://www.mdpi.com/article/10.3390/atmos14010167/s1, Figure S1: Microclimate chamber; Figure S2: The instrument arrangement.

Author Contributions

Conceptualization, Y.Z.; methodology, P.T.; investigation, M.W.; data curation and writing, X.L.; funding acquisition, Y.Z. and G.Q. All authors have read and agreed to the published version of the manuscript.

Funding

The authors gratefully acknowledge the financial support of the National Natural Science Foundation of China (no. 52104148), China Postdoctoral Foundation project (no. 2021M692593), Natural Science Basic Research Plan of Shaanxi Province of China (no. 2020JQ-750), and the Scientific Research Program funded by the Shaanxi Provincial Education Department (no. 19JK0543).

Institutional Review Board Statement

Not applicable.

Informed Consent Statement

Not applicable.

Data Availability Statement

Data is unavailable due to privacy.

Conflicts of Interest

The authors declare no conflict of interest.

Nomenclature

Abbreviations
PMparticulate matter
PAHspolycyclic aromatic hydrocarbons
LPGliquefied petroleum gas
SDstandard deviation
AERair exchange rates
Symbols
C i n indoor particle concentration
C i n ( 0 ) initial indoor particle concentration
C i n ( p ) peak indoor particle concentration
C o u t outdoor particle concentration
P penetration efficiency
S p emission rate
S p ¯ average emission rate
t time
t 0 initial time
Δ t time difference between initial and peak concentration
V room volume
k T total removal rate
Greek Letters
μ average value
σ standard deviation

References

  1. Bo, M.; Salizzoni, P.; Clerico, M.; Buccolieri, R. Assessment of Indoor-Outdoor Particulate Matter Air Pollution: A Review. Atmosphere 2017, 8, 136. [Google Scholar] [CrossRef] [Green Version]
  2. Qi, J.; Liu, L.X.; Wu, J.J. Improving Combustion Technology for Cooking Activities for Pollutant Emission Reduction and Carbon Neutrality. Atmosphere 2022, 13, 561. [Google Scholar] [CrossRef]
  3. Lu, F.J.; Shen, B.X.; Yuan, P.; Li, S.; Sun, Y.; Mei, X. The emission of PM2.5 in Respiratory Zone from Chinese Family Cooking and Its Health Effect. Sci. Total Environ. 2019, 654, 671–677. [Google Scholar] [CrossRef] [PubMed]
  4. Zhang, N.; Han, B.; He, F.; Xu, J.; Zhao, R.; Zhang, Y.; Bai, Z. Chemical Characteristic of PM2.5 Emission and Inhalational Carcinogenic Risk of Domestic Chinese Cooking. Environ. Pollut. 2017, 227, 24–30. [Google Scholar] [CrossRef] [PubMed]
  5. IARC Working Group on the Evaluation of Carcinogenic Risks to Humans. Household use of solid fuels and high-temperature frying. In IARC Monographs on the Evaluation of Carcinogenic Risks to Humans; WHO: Geneva, Switzerland, 2010; Volume 95, p. 1. [Google Scholar]
  6. Wang, C.; Liu, L.; Liu, X.; Chen, W.; He, G. Mechanisms of Lung Cancer Caused by Cooking Fumes Exposure: A Minor Review. Chin. Med. Sci. J. 2017, 32, 193–197. [Google Scholar]
  7. Du, W.; Li, X.Y.; Chen, Y.C.; Shen, G. Household Air Pollution and Personal Exposure to Air Pollutants in Rural China—A Review. Environ. Pollut. 2018, 237, 625–638. [Google Scholar] [CrossRef]
  8. Lee, S.C.; Li, W.M.; Chan, L.Y. Indoor Air Quality at Restaurants with Different Styles of Cooking in Metropolitan Hong Kong. Sci. Total Environ. 2001, 279, 181–193. [Google Scholar] [CrossRef]
  9. Li, Y.C.; Shu, M.; Ho, S.S.H.; Wang, C.; Cao, J.-J.; Wang, G.-H.; Wang, X.-X.; Wang, K.; Zhao, X.-Q. Characteristics of PM2.5 Emitted from Different Cooking Activities in China. Atmos. Res. 2015, 166, 83–91. [Google Scholar] [CrossRef]
  10. Cheng, J.H.; Lee, Y.S.; Chen, K.S. Carbonyl Compounds in Dining Areas, Kitchens and Exhaust Streams in Restaurants with Varying Cooking Methods in Kaohsiung, Taiwan. J. Environ. Sci. 2016, 41, 218–226. [Google Scholar] [CrossRef]
  11. Zhu, L.Z.; Wang, J. Sources and Patterns of Polycyclic Aromatic Hydrocarbons Pollution in Kitchen Air, China. Chemosphere 2003, 50, 611–618. [Google Scholar] [CrossRef]
  12. Ho, S.S.H.; Yu, J.Z.; Chu, K.W.; Yeung, L.L. Carbonyl Emissions from Commercial Cooking Sources in Hong Kong. J. Air Waste Manag. Assoc. 2006, 56, 1091–1098. [Google Scholar] [CrossRef] [PubMed]
  13. Ni, K.; Carter, E.; Schauer, J.J.; Ezzati, M.; Zhang, Y.; Niu, H.; Lai, A.M.; Shan, M.; Wang, Y.; Yang, X.; et al. Seasonal Variation in Outdoor, Indoor, and Personal Air Pollution Exposures of Women Using Wood Stoves in the Tibetan Plateau: Baseline assessment for an energy intervention study. Environ. Int. 2016, 94, 449–457. [Google Scholar] [CrossRef] [PubMed]
  14. Susaya, J.; Kim, K.H.; Ahn, J.W.; Jung, M.-C.; Kang, C.-H. BBQ charcoal Combustion as an Important Source of Trace Metal Exposure to Humans. J. Hazard. Mater. 2010, 176, 932–937. [Google Scholar] [CrossRef] [PubMed]
  15. Shen, X.W.; Chen, M.Z.; Ge, M.T.; Padua, M.G. Examining the Conceptual Model of Potential Urban Development Patch (PUDP), VOCs, and Food Culture in Urban Ecology: A Case in Chengdu, China. Atmosphere 2022, 13, 1369. [Google Scholar] [CrossRef]
  16. Vicente, E.D.; Vicente, A.; Evtyugina, M.; Carvalho, R.; Tarelho, L.; Oduber, F.; Alves, C. Particulate and Gaseous Emissions from Charcoal Combustion in Barbecue Grills. Fuel Process. Technol. 2018, 176, 296–306. [Google Scholar] [CrossRef]
  17. Wang, L.; Xiang, Z.; Stevanovic, S.; Ristovski, Z.; Salimi, F.; Gao, J.; Wang, H.; Li, L. Role of Chinese Cooking Emissions on Ambient Air Quality and Human Health. Sci. Total Environ. 2017, 589, 173–181. [Google Scholar] [CrossRef]
  18. Zhao, Y.J.; Zhao, B. Emissions of Air Pollutants from Chinese Cooking: A Literature Review. Build. Simul.-China 2018, 11, 977–995. [Google Scholar] [CrossRef]
  19. Zhao, Y.J.; Chen, C.; Zhao, B. Is Oil Temperature a Key Factor Influencing Air Pollutant Emissions from Chinese Cooking? Atmos. Environ. 2018, 193, 190–197. [Google Scholar] [CrossRef]
  20. Yi, H.H.; Huang, Y.H.; Tang, X.L.; Zhao, S.; Xie, X.; Zhang, Y. Characteristics of Non-methane Hydrocarbons and Benzene Series Emission from Commonly Cooking Oil Fumes. Atmos. Environ. 2019, 200, 208–220. [Google Scholar] [CrossRef]
  21. Zhao, Y.J.; Chen, C.; Zhao, B. Emission Characteristics of PM2.5-bound Chemicals from Residential Chinese Cooking. Build. Environ. 2019, 149, 623–629. [Google Scholar] [CrossRef]
  22. Lai, A.C.K.; Ho, Y.W. Spatial Concentration Variation of Cooking-Emitted Particles in a Residential Kitchen. Build. Environ. 2008, 43, 871–876. [Google Scholar] [CrossRef]
  23. Gao, J.; Cao, C.; Xiao, Q.; Xu, B.; Zhou, X.; Zhang, X. Determination of Dynamic Intake Fraction of Cooking-Generated Particles in the Kitchen. Build. Environ. 2013, 65, 146–153. [Google Scholar] [CrossRef]
  24. Rim, D.; Wallace, L.; Nabinger, S.; Persily, A. Reduction of Exposure to Ultrafine Particles by Kitchen Exhaust Hoods: The Effects of Exhaust Flow Rates, Particle Size, and Burner Position. Sci. Total Environ. 2012, 432, 350–356. [Google Scholar] [CrossRef] [PubMed]
  25. Poon, C.; Wallace, L.; Lai, A.C.K. Experimental Study of Exposure to Cooking Emitted Particles under Single Zone and Two-Zone Environments. Build. Environ. 2016, 104, 122–130. [Google Scholar] [CrossRef] [Green Version]
  26. Zhao, Y.J.; Tao, P.F.; Zhang, B.; Huan, C. Contribution of Chinese Hot Pot and Barbecue Restaurants on Indoor Environmental Parameters. Aerosol Air Qual. Res. 2020, 20, 2925–2940. [Google Scholar] [CrossRef]
  27. Zhao, Y.J.; Zhang, Z.H.; Ji, C.F.; Liu, L.; Zhang, B.; Huan, C. Characterization of Particulate Matter from Heating and Cooling Several Edible Oils. Build. Environ. 2019, 152, 204–213. [Google Scholar] [CrossRef]
  28. He, C.; Morawska, L.; Hitchins, J.; Gilbert, D. Contribution from Indoor Sources to Particle Number and Mass Concentrations in Residential Houses. Atmos. Environ. 2004, 38, 3405–3415. [Google Scholar] [CrossRef]
  29. Wallace, L.A.; Emmerich, S.J.; Howard-Reed, C. Source Strengths of Ultrafine and Fine Particles Due to Cooking with a Gas Stove. Environ. Sci. Technol. 2004, 38, 2304–2311. [Google Scholar] [CrossRef]
  30. Torkmahalleh, M.A.; Goldasteh, I.; Zhao, Y.; Udochu, N.M.; Rossner, A.; Hopke, P.K.; Ferro, A.R. PM2.5 and Ultrafine Particles Emitted during Heating of Commercial Cooking Oils. Indoor Air 2012, 22, 483–491. [Google Scholar] [CrossRef]
  31. Lai, A.C.K.; Chen, J. Numerical Study of Cooking Particle Coagulation by using an Eulerian Model. Build. Environ. 2015, 89, 38–47. [Google Scholar] [CrossRef]
  32. Kim, D.S.; Park, S.H.; Song, Y.M.; Lee, K. Brownian Coagulation of Polydisperse Aerosols in the Transition Regime. J. Aerosol Sci. 2003, 34, 859–868. [Google Scholar] [CrossRef]
  33. Wang, Y.; Yang, Y.; Zou, Y.; Cao, Y.; Ren, X.; Li, Y. Evaporation and Movement of Fine Water Droplets Influenced by Initial Diameter and Relative Humidity. Aerosol Air Qual. Res. 2015, 16, 301–313. [Google Scholar] [CrossRef]
  34. Chen, C.; Zhao, Y.; Zhao, B. Emission Rates of Multiple Air Pollutants Generated from Chinese Residential Cooking. Environ. Sci. Technol. 2018, 52, 1081–1087. [Google Scholar] [CrossRef] [PubMed]
  35. Wang, L.; Zheng, X.; Stevanovic, S.; Wu, X.; Xiang, Z.; Yu, M.; Liu, J. Characterization Particulate Matter from Several Chinese Cooking Dishes and Implications in Health Effects. J. Environ. Sci. 2018, 72, 98–106. [Google Scholar] [CrossRef]
Figure 1. Variations of particle number concentrations during boiling water.
Atmosphere 14 00167 g001
Figure 2. Comparison of changes in particle number concentrations when heating water and corn oil.
Atmosphere 14 00167 g002
Figure 3. Mean particle size distribution in the food boiling process.
Atmosphere 14 00167 g003
Figure 4. Variation in particle size distribution during water boiling.
Atmosphere 14 00167 g004
Figure 5. Comparison of changes in particle size distributions when heating water and corn oil.
Atmosphere 14 00167 g005
Figure 6. Variation of particle arithmetic mean diameter during boiling.
Atmosphere 14 00167 g006
Figure 7. Comparison of changes in particle arithmetic mean diameter when heating water and corn oil.
Atmosphere 14 00167 g007
Figure 8. Comparison of emission rates with previous studies.
Atmosphere 14 00167 g008
Table 1. The experimental cases.
FoodFood Weight (g)Water (L)Heating Power (W)Heating Time (min)Relative Humidity (%)Ventilation
Control group-1.521001420Off
Noodle/Potato/Tofu/Fish/Meatball Pork3201.521001420Off
Corn oil50 mL-800420Off
Table 2. The particle number concentrations produced by cooking various ingredients.
Particle Size (μm)FoodMean Concentration ± SD
(Part/cm3)
Significant Differences
(p < 0.05)
Peak Concentration
(Part/cm3)
Significant Differences
(p < 0.05)
0.3Control group19,666 ± 4623.628,248
Noodle19,748 ± 4624.128,366
Potato19,458 ± 4574.727,949
Tofu19,678 ± 4645.028,265
Fish19,757 ± 4626.528,379
Meatball19,814 ± 4658.528,461
Pork19,589 ± 4605.628,138
0.3–0.5Control group9237 ± 6416.121,995
Noodle9129 ± 6248.621,737
Potato8922 ± 6196.821,244
Tofu9202 ± 6343.021,912
Fish9132 ± 6391.721,745
Meatball8922 ± 6229.121,244
Pork8893 ± 6176.921,175
0.5–1.0Control group73,346 ± 69,685.7198,546
Noodle72,481 ± 70,426.5196,203
Potato74,078 ± 70,381.3200,528
Tofu72,481 ± 68,863.5196,203
Fish72,481 ± 68,867.5196,203
Meatball79,137 ± 75,187.2214,220
Pork69,897 ± 65,638.7187,015
Table 3. The amplitude of particles emitted by boiling food (Mean ± SD).
PM0.3PM0.3–0.5PM0.5–1.0
Number concentration
(part/cm3)
Control group3329.4 ± 1787.115,394.7 ± 1425.5132,740.4 ± 6755.3
Noodle2874.0 ± 1182.415,214.1 ± 1408.9131,174.3 ± 6676.0
Potato2831.8 ± 1164.914,868.6 ± 1376.8134,065.5 ± 6823.0
Fish2863.8 ± 1178.215,336.4 ± 1420.2131,174.3 ± 6675.3
Doufu2875.3 ± 1182.815,219.3 ± 1409.4131,174.3 ± 6675.9
Meatball2883.7 ± 1186.314,868.6 ± 1376.8143,220.2 ± 7288.9
Pork2851.1 ± 1172.814,820.8 ± 1372.4125,031.4 ± 6363.1
Size distribution
(%)
Control group14.62 ± 2.372.27 ± 0.5812.35 ± 2.03
Noodle14.79 ± 2.392.28 ± 0.5812.51 ± 2.04
Potato14.44 ± 2.352.17 ± 0.5612.28 ± 2.02
Fish14.74 ± 2.382.29 ± 0.5812.45 ± 2.04
Doufu14.78 ± 2.392.29 ± 0.5812.50 ± 2.04
Meatball14.00 ± 2.302.01 ± 0.5211.99 ± 2.00
Pork15.19 ± 2.422.36 ± 0.5912.83 ± 2.07
Arithmetic mean diameter
(µm)
Control group0.0910 ± 0.0148
Noodle0.0921 ± 0.0149
Potato0.0903 ± 0.0148
Fish0.0917 ± 0.0149
Doufu0.0921 ± 0.0149
Meatball0.0880 ± 0.0145
Pork0.0945 ± 0.0151
Disclaimer/Publisher’s Note: The statements, opinions and data contained in all publications are solely those of the individual author(s) and contributor(s) and not of MDPI and/or the editor(s). MDPI and/or the editor(s) disclaim responsibility for any injury to people or property resulting from any ideas, methods, instructions or products referred to in the content.

