
Concentrations of Airborne Microplastics during the Dry Season at Five Locations in Bangkok Metropolitan Region, Thailand


Abstract
:
1. Introduction
2. Materials and Methods
2.1. Sampling Sites
- University: The high-volume air sampler was placed in an open space with limited human activities nearby.
- Roadside: The high-volume air sampler was placed around 200 m from a heavy traffic road.
- Urban park: The high-volume air sampler was placed around 200 m from a heavy traffic road and inside an urban park with many trees.
- Dumpsite: The high-volume air sampler was placed 50 m away from the RDF processing building where cutting and shredding of plastic wastes to different sizes for RDF production were conducted.
- Industrial estate: The high-volume air sampler was placed at an industrial estate’s office which is far away from the factories.
2.2. Sampling Methods
2.3. Quantification and Identification of AMPs
2.4. Contamination Control
3. Results
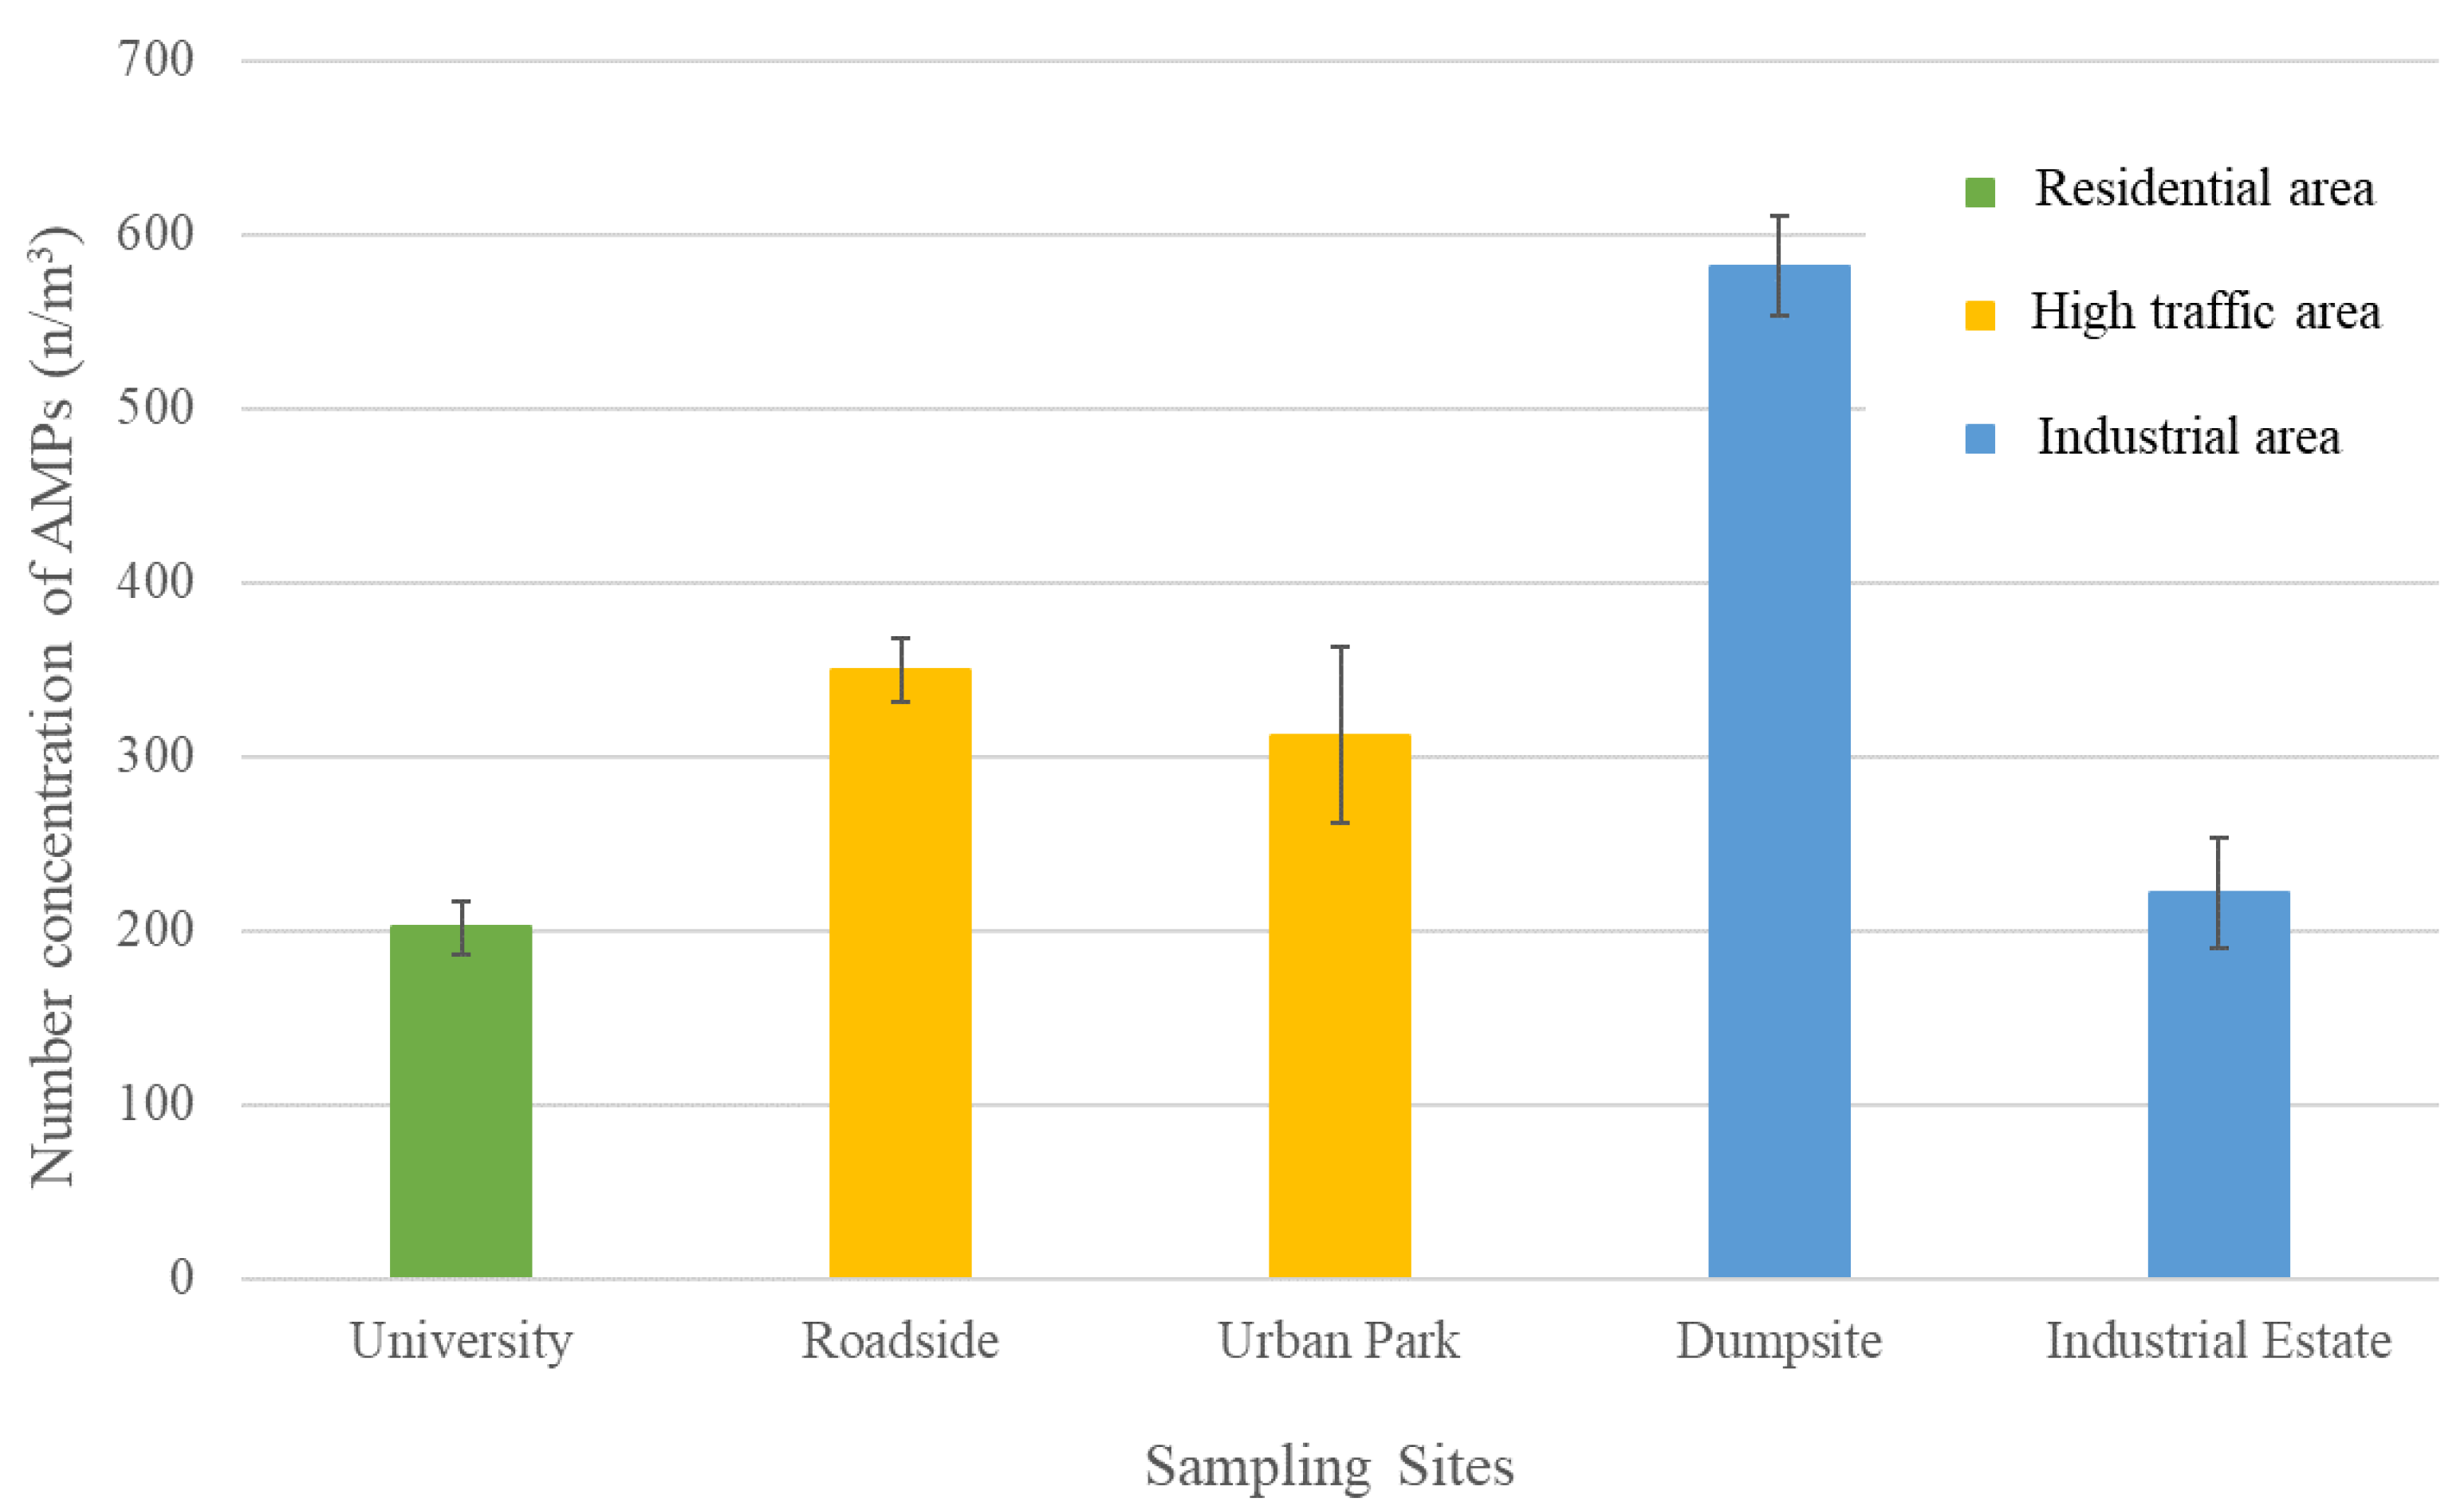
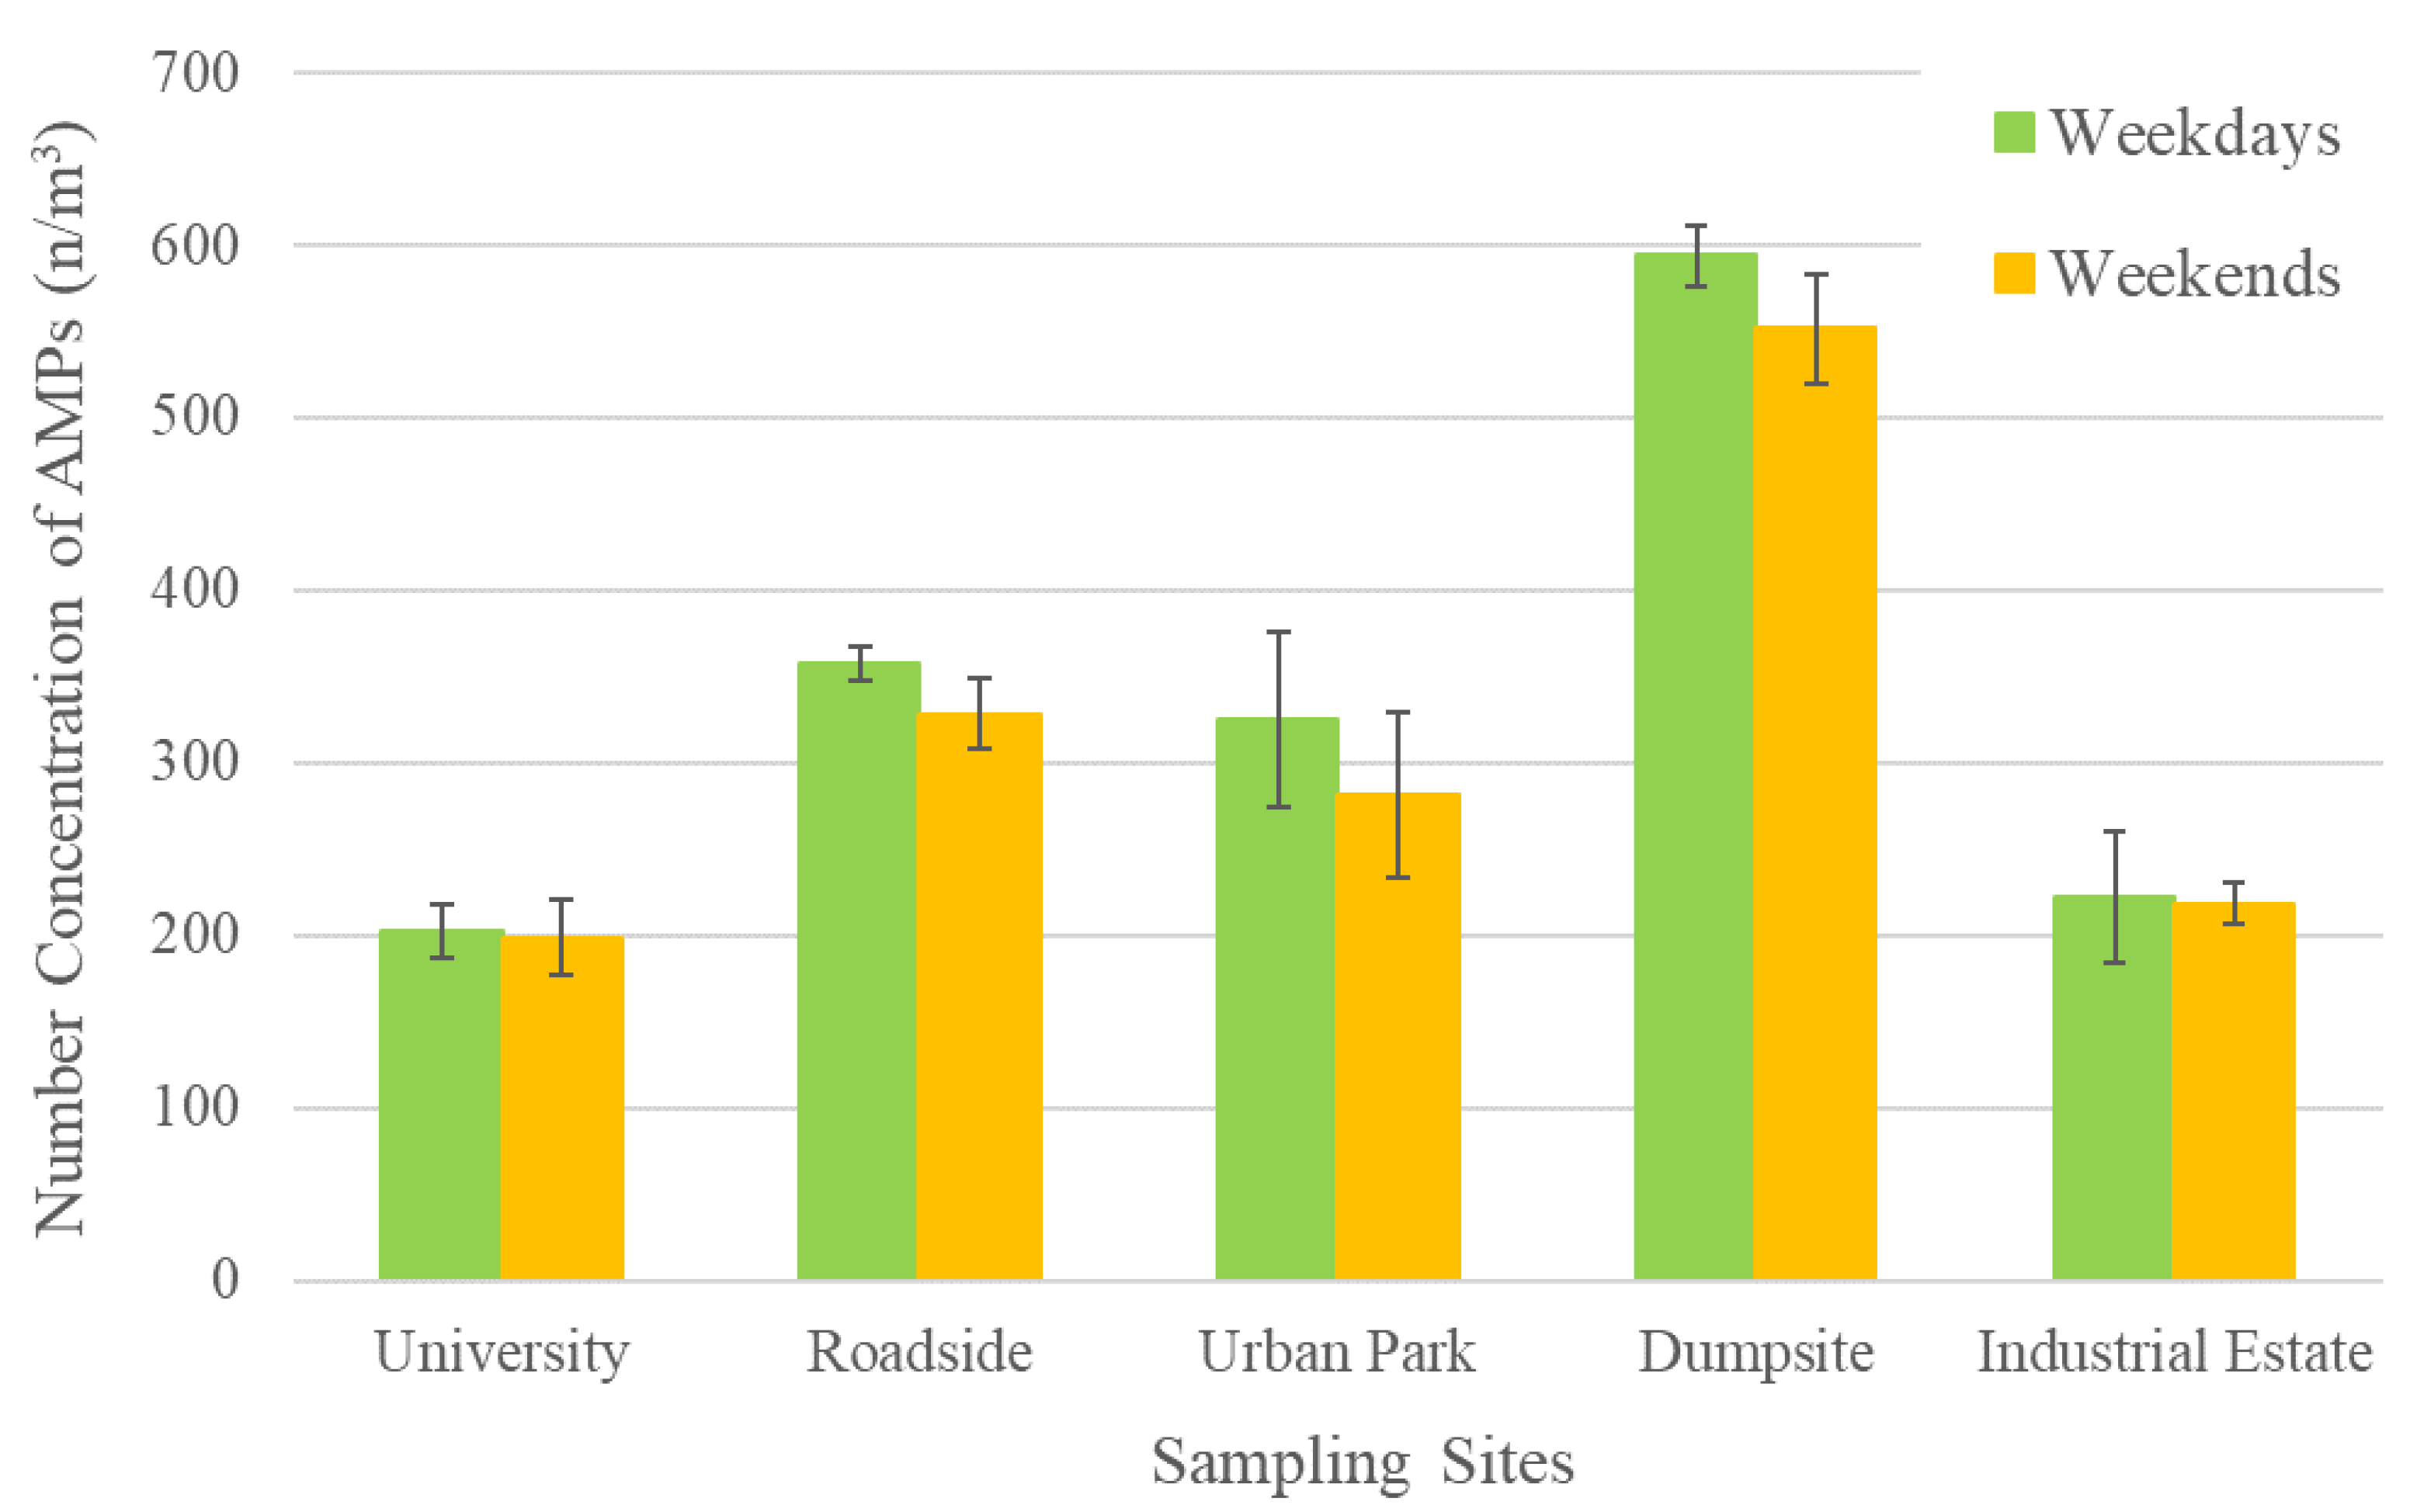
3.1. Number Concentration of AMPs at Five Sampling Locations
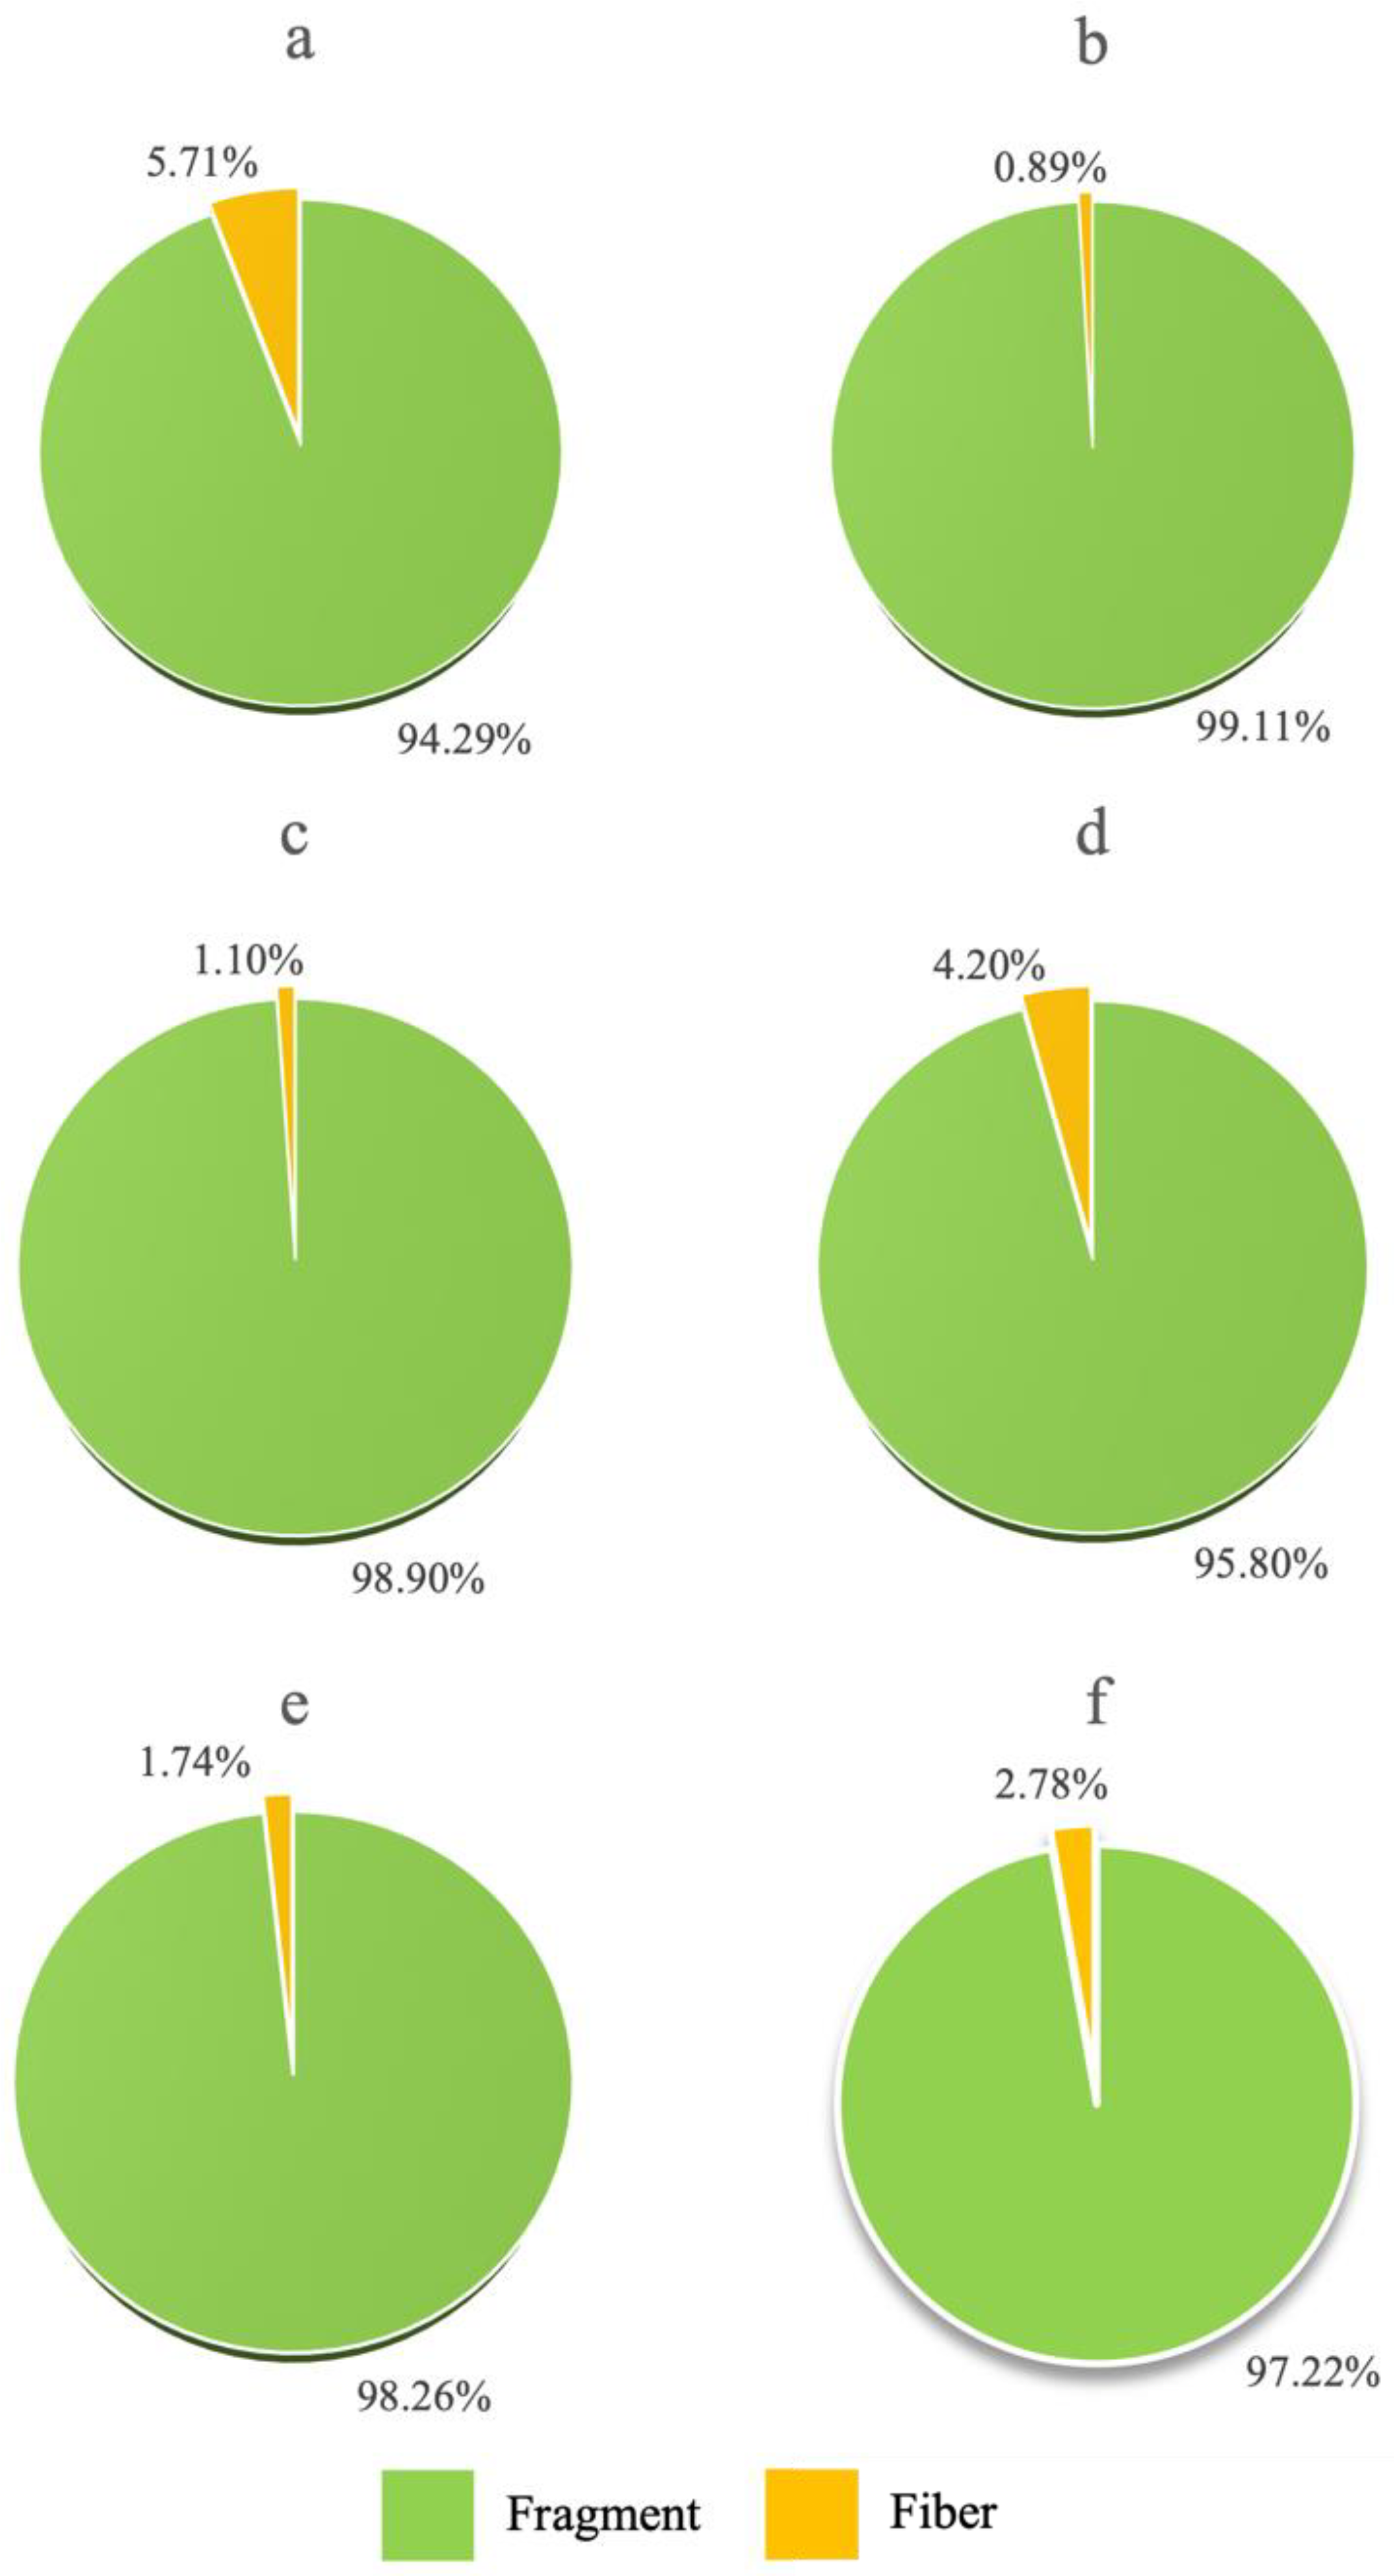
3.2. Shapes of AMPs
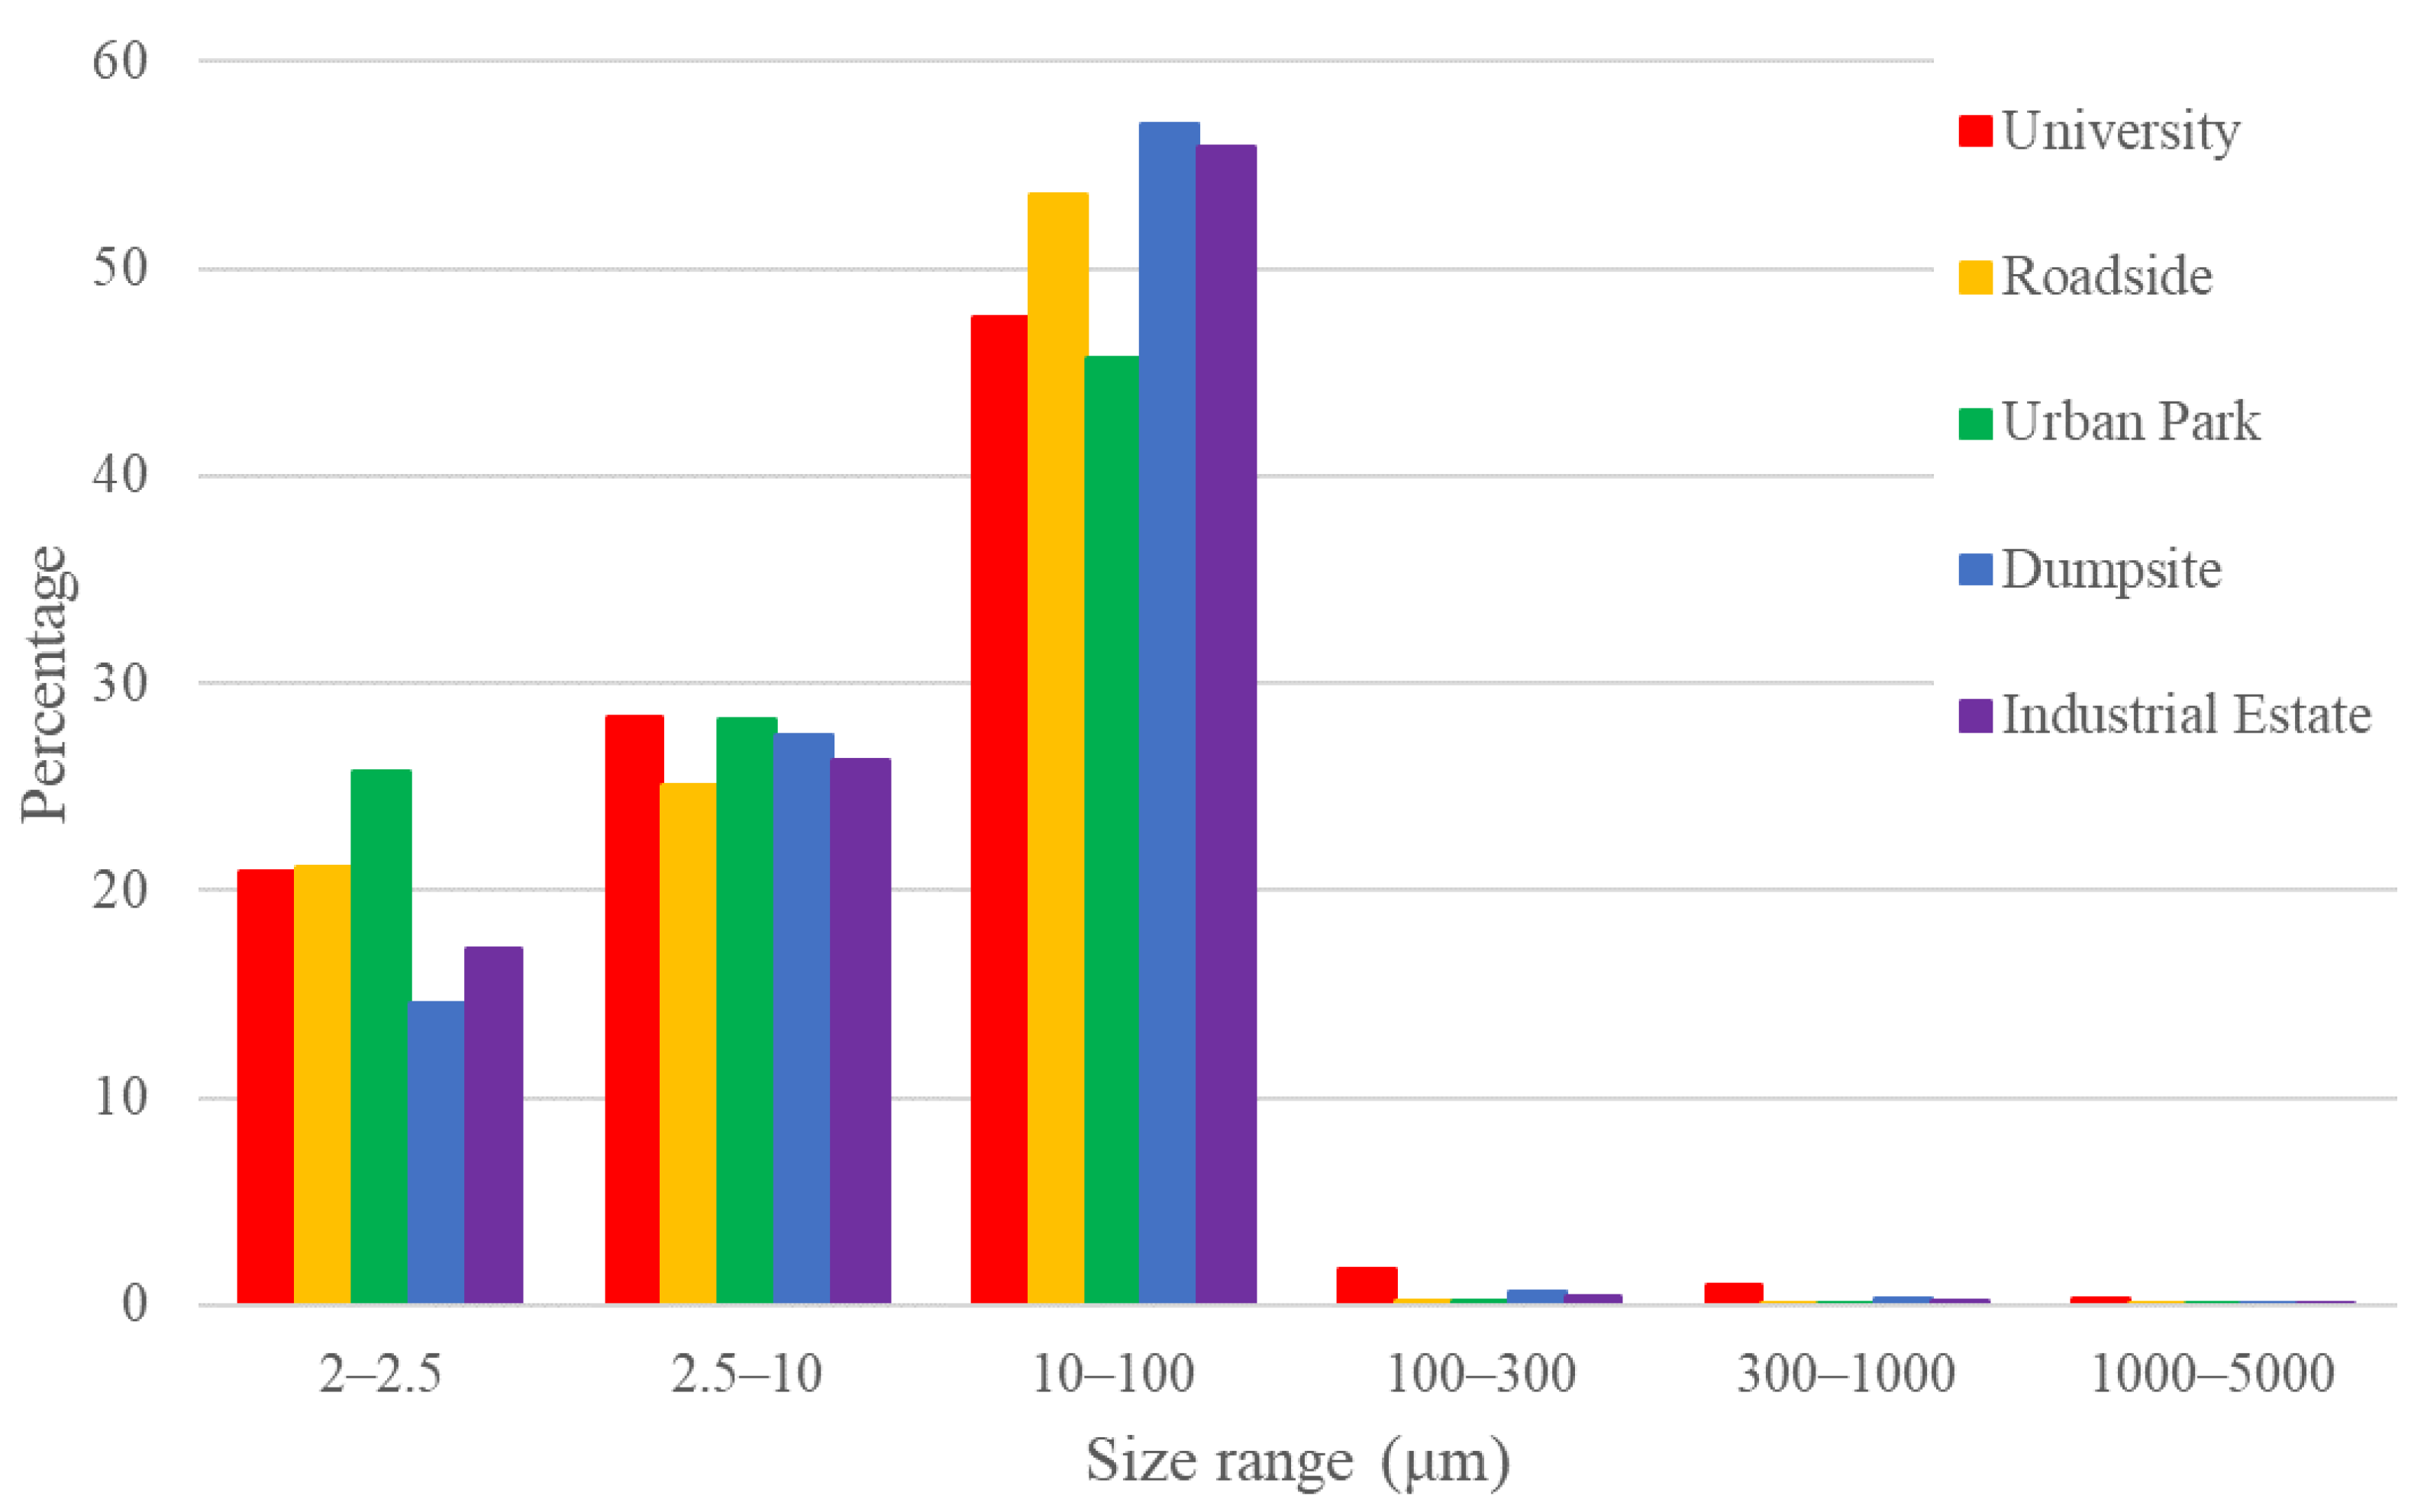
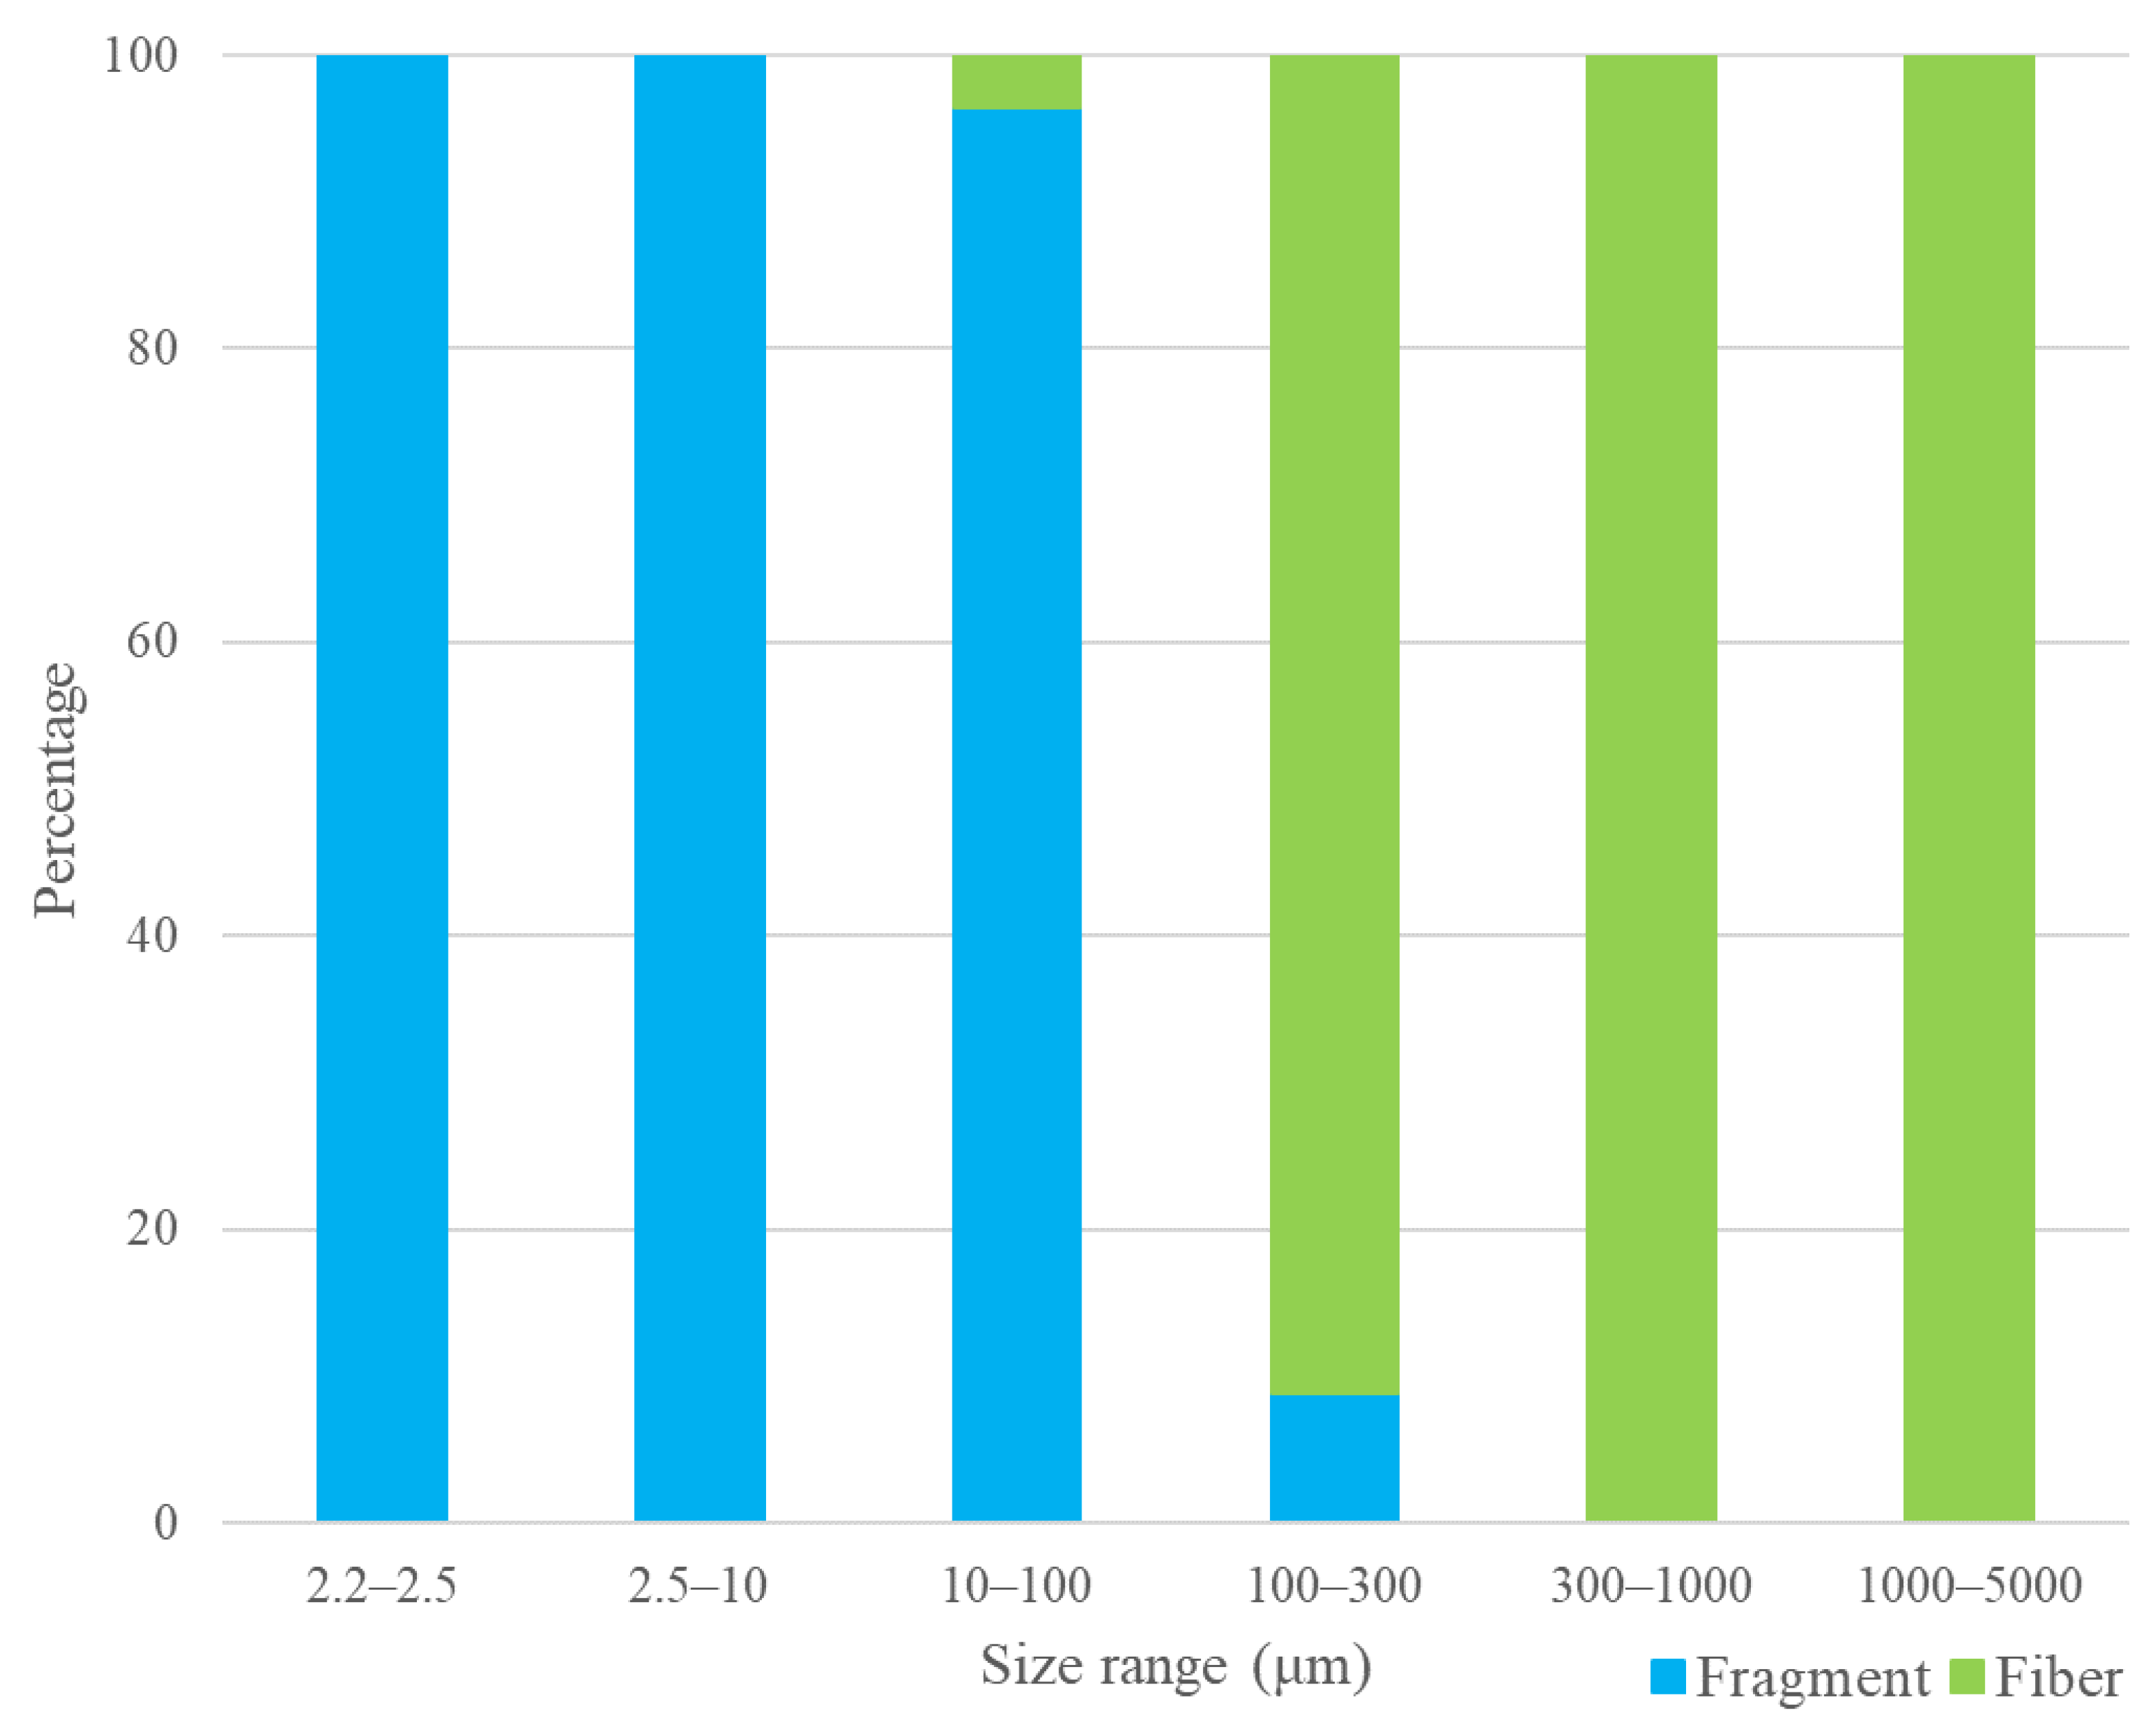
3.3. Sizes of AMPs
3.4. Polymer Types of AMPs
4. Discussion
5. Conclusions
Supplementary Materials
Author Contributions
Funding
Institutional Review Board Statement
Informed Consent Statement
Data Availability Statement
Acknowledgments
Conflicts of Interest
References
- Plastics Europe. Plastics—The Facts 2020 an Analysis of European Plastics Production, Demand and Waste Data. 2020. Available online: https://plasticseurope.org/knowledge-hub/plastics-the-facts-2020 (accessed on 10 September 2021).
- Andrady, A.L.; Neal, M.A. Applications and societal benefits of plastics. Philos. Trans. R. Soc. B Biol. Sci. 2009, 364, 1977–1984. [Google Scholar] [CrossRef] [PubMed] [Green Version]
- Lebreton, L.; Andrady, A. Future scenarios of global plastic waste generation and disposal. Palgrave Commun. 2019, 5, 1–11. [Google Scholar] [CrossRef] [Green Version]
- Lithner, D.; Larsson, Å.; Dave, G. Environmental and health hazard ranking and assessment of plastic polymers based on chemical composition. Sci. Total Environ. 2011, 409, 3309–3324. [Google Scholar] [CrossRef] [PubMed]
- Frias, J.P.G.L.; Nash, R. Microplastics: Finding a consensus on the definition. Mar. Pollut. Bull. 2019, 138, 145–147. [Google Scholar] [CrossRef] [PubMed]
- Akanyange, S.N.; Lyu, X.; Zhao, X.; Li, X.; Zhang, Y.; Crittenden, J.C.; Anning, C.; Chen, T.; Jiang, T.; Zhao, H. Does microplastic really represent a threat? A review of the atmospheric contamination sources and potential impacts. Sci. Total Environ. 2021, 777, 146020. [Google Scholar] [CrossRef]
- Boucher, J.; Friot, D. Primary Microplastics in the Oceans: A Global Evaluation of Sources; IUCN: Gland, Switzerland, 2007; Volume 43. [Google Scholar]
- Guo, X.; Wang, J. The chemical behaviors of microplastics in marine environment: A review. Mar. Pollut. Bull. 2019, 142, 1–14. [Google Scholar] [CrossRef]
- Golwala, H.; Zhang, X.; Iskander, S.M.; Smith, A.L. Solid waste: An overlooked source of microplastics to the environment. Sci. Total Environ. 2021, 769, 144581. [Google Scholar] [CrossRef]
- Alimba, C.G.; Faggio, C. Microplastics in the marine environment: Current trends in environmental pollution and mechanisms of toxicological profile. Environ. Toxicol. Pharmacol. 2019, 68, 61–74. [Google Scholar] [CrossRef]
- Auta, H.S.; Emenike, C.U.; Fauziah, S.H. Distribution and importance of microplastics in the marine environment: A review of the sources, fate, effects, and potential solutions. Environ. Int. 2017, 102, 165–176. [Google Scholar] [CrossRef]
- Chae, Y.; An, Y.J. Current research trends on plastic pollution and ecological impacts on the soil ecosystem: A review. Environ. Pollut. 2018, 240, 387–395. [Google Scholar] [CrossRef]
- Beaurepaire, M.; Dris, R.; Gasperi, J.; Tassin, B. Microplastics in the atmospheric compartment: A comprehensive review on methods, results on their occurrence and determining factors. Curr. Opin. Food Sci. 2021, 41, 159–168. [Google Scholar] [CrossRef]
- Levermore, J.M.; Smith, T.E.; Kelly, F.J.; Wright, S.L. Detection of microplastics in ambient particulate matter using Raman spectral imaging and chemometric analysis. Anal. Chem. 2020, 92, 8732–8740. [Google Scholar] [CrossRef] [PubMed]
- Amato-Lourenço, L.F.; Costa, N.D.S.X.; Dantas, K.C.; dos Santos Galvão, L.; Moralles, F.N.; Lombardi, S.C.F.S.; Júnior, A.M.; Lindoso, J.A.L.; Ando, R.A.; Lima, F.G.; et al. Airborne microplastics and SARS-CoV-2 in total suspended particles in the area surrounding the largest medical centre in Latin America. Environ. Pollut. 2022, 292, 118299. [Google Scholar] [CrossRef] [PubMed]
- Donaldson, K.; Tran, C.L. Inflammation caused by particles and fibers. Inhal. Toxicol. 2002, 14, 5–27. [Google Scholar] [CrossRef] [PubMed]
- Eschenbacher, W.L.; Kreiss, K.; Lougheed, M.D.; Pransky, G.S.; Day, B.; Castellan, R.M. Nylon flock–associated interstitial lung disease. Am. J. Respir. Crit. Care Med. 1999, 159, 2003–2008. [Google Scholar] [CrossRef]
- Pauly, J.L.; Stegmeier, S.J.; Allaart, H.A.; Cheney, R.T.; Zhang, P.J.; Mayer, A.G.; Streck, R.J. Inhaled cellulosic and plastic fibers found in human lung tissue. Cancer Epidemiol. Prev. Biomark. 1998, 7, 419–428. [Google Scholar]
- Lippmann, M.D.B.R.E.; Yeates, D.B.; Albert, R.E. Deposition, retention, and clearance of inhaled particles. Occup. Environ. Med. 1980, 37, 337–362. [Google Scholar] [CrossRef] [Green Version]
- Tran, C.L.; Buchanan, D.; Cullen, R.T.; Searl, A.; Jones, A.D.; Donaldson, K. Inhalation of poorly soluble particles. II. Influence of particle surface area on inflammation and clearance. Inhal. Toxicol. 2000, 12, 1113–1126. [Google Scholar]
- Leslie, H.A.; van Velzen, M.J.; Brandsma, S.H.; Vethaak, D.; Garcia-Vallejo, J.J.; Lamoree, M.H. Discovery and quantification of plastic particle pollution in human blood. Environ. Int. 2022, 163, 107199. [Google Scholar] [CrossRef]
- Jenner, L.C.; Rotchell, J.M.; Bennett, R.T.; Cowen, M.; Tentzeris, V.; Sadofsky, L.R. Detection of microplastics in human lung tissue using μFTIR spectroscopy. Sci. Total Environ. 2022, 831, 154907. [Google Scholar] [CrossRef]
- Huang, Y.; Qing, X.; Wang, W.; Han, G.; Wang, J. Mini-review on current studies of airborne microplastics: Analytical methods, occurrence, sources, fate and potential risk to human beings. TrAC Trends Anal. Chem. 2020, 125, 115821. [Google Scholar] [CrossRef]
- Pollution Control Department (PCD). Booklet on Thailand State of Pollution 2018; Pollution Control Department: Bangkok, Thailand, 2019. Available online: http://www.oic.go.th/FILEWEB/CABINFOCENTER3/DRAWER056/GENERAL/DATA0001/00001462.PDF (accessed on 10 September 2021).
- Khanunthong, A. Industry Outlook 2021–2023: Plastics. 2021. Available online: https://www.krungsri.com/getmedia/e0db7960-9663-4498-a4a7-d648d892105d/IO_Plastics_210112_EN_EX.pdf.aspx (accessed on 25 September 2021).
- National Statistical Office Thailand (NSO). Number of Population from Registration by Age, Sex, Region and Province: 2021. 2021. Available online: http://statbbi.nso.go.th/staticreport/page/sector/en/01.aspx (accessed on 15 September 2021).
- Jin, S.; Guo, J.; Wheeler, S.; Kan, L.; Che, S. Evaluation of impacts of trees on PM2.5 dispersion in urban streets. Atmos. Environ. 2014, 99, 277–287. [Google Scholar] [CrossRef]
- Chen, L.; Liu, C.; Zhang, L.; Zou, R.; Zhang, Z. Variation in tree species ability to capture and retain airborne fine particulate matter (PM2. 5). Sci. Rep. 2017, 7, 1–11. [Google Scholar]
- Zhu, X.; Huang, W.; Fang, M.; Liao, Z.; Wang, Y.; Xu, L.; Mu, Q.; Shi, C.; Lu, C.; Deng, H.; et al. Airborne microplastic concentrations in five megacities of northern and southeast China. Environ. Sci. Technol. 2021, 55, 12871–12881. [Google Scholar] [CrossRef] [PubMed]
- Liao, Z.; Ji, X.; Ma, Y.; Lv, B.; Huang, W.; Zhu, X.; Fang, M.; Wang, Q.; Wang, X.; Dahlgren, R.; et al. Airborne microplastics in indoor and outdoor environments of a coastal city in Eastern China. J. Hazard. Mater. 2021, 417, 126007. [Google Scholar] [CrossRef]
- Kaya, A.T.; Yurtsever, M.; Bayraktar, S.Ç. Ubiquitous exposure to microfiber pollution in the air. Eur. Phys. J. Plus 2018, 133, 488. [Google Scholar] [CrossRef]
- Ding, Y.; Zou, X.; Wang, C.; Feng, Z.; Wang, Y.; Fan, Q.; Chen, H. The abundance and characteristics of atmospheric microplastic deposition in the northwestern South China Sea in the fall. Atmos. Environ. 2021, 253, 118389. [Google Scholar] [CrossRef]
- Liu, K.; Wu, T.; Wang, X.; Song, Z.; Zong, C.; Wei, N.; Li, D. Consistent transport of terrestrial microplastics to the ocean through atmosphere. Environ. Sci. Technol. 2019, 53, 10612–10619. [Google Scholar] [CrossRef]
- Syafei, A.D.; Nurasrin, N.R.; Assomadi, A.F.; Boedisantoso, R. Microplastic pollution in the ambient air of Surabaya, Indonesia. Curr. World Environ. 2017, 14, 290. [Google Scholar] [CrossRef] [Green Version]
- Klein, M.; Fischer, E.K. Microplastic abundance in atmospheric deposition within the Metropolitan area of Hamburg, Germany. Sci. Total Environ. 2019, 685, 96–103. [Google Scholar] [CrossRef]
- Wright, S.L.; Ulke, J.; Font, A.; Chan, K.L.A.; Kelly, F.J. Atmospheric microplastic deposition in an urban environment and an evaluation of transport. Environ. Int. 2020, 136, 105411. [Google Scholar] [CrossRef] [PubMed]
- Gaston, E.; Woo, M.; Steele, C.; Sukumaran, S.; Anderson, S. Microplastics differ between indoor and outdoor air masses: Insights from multiple microscopy methodologies. Appl. Spectrosc. 2020, 74, 1079–1098. [Google Scholar] [CrossRef] [PubMed]
- Tamminga, M.; Hengstmann, E.; Fischer, E.K. Nile red staining as a subsidiary method for microplastic quantification: A comparison of three solvents and factors influencing application reliability. SDRP J. Earth Sci. Environ. Stud. 2017, 2, 165–172. [Google Scholar]
- World Health Organization (WHO). Air Quality Guidelines for Europe. 2000. Available online: https://apps.who.int/iris/bitstream/handle/10665/107335/E71922.pdf?sequence=1 (accessed on 15 September 2021).
- Ashrafi, K.; Fallah, R.; Hadei, M.; Yarahmadi, M.; Shahsavani, A. Source apportionment of total suspended particles (TSP) by positive matrix factorization (PMF) and chemical mass balance (CMB) modeling in Ahvaz, Iran. Arch. Environ. Contam. Toxicol. 2018, 75, 278–294. [Google Scholar] [CrossRef] [PubMed]


| Criteria | University | Roadside | Urban Park | Dumpsite | Industrial Estate |
|---|---|---|---|---|---|
| Land use type | Residential area | Roadside | Roadside | Industrial area | Industrial area |
| Source of AMPs nearby | No | Yes | Yes | Yes | No |
| Types of trees in 50 × 50 m2 with the high-volume air sampler in the center | No | No | Coconut trees, deciduous trees, palm trees, bushes, etc. | No | No |
| Study Area | Environment | Number Concentration (n/m3) | Abundance Size | Shapes | Polymer Types | Reference |
|---|---|---|---|---|---|---|
| Sao Paulo, Brazil | Outdoor | 14.02–15.90 | Not Available | Not Available | Polyester: 80.40%, other: 19.60% | [15] |
| 5 megacities, China | Outdoor | 282 ± 127 | <30 μm: 61.60%, 30–100 μm: 33.10%, 100–300 μm: 4.70%, 300–100 μm: 0.50%, >1000 μm: 0.03% | Fragments: 88.20%, Fibers: 11.80% | PE, PS, PVC, PA, PP, PET | [29] |
| Wenzhou, China | Outdoor | 189 ± 85 | <30 μm: 65.10%, 30–100 μm: 29.40% | Fragments: 94.20%, Fibers: 5.80% | PE, PS, polyester | [30] |
| Sakarya, Turkey | Outdoor | 2019 | Not Available | Fragments, Fibers | PA, PU, PE, polyester (PES) | [31] |
| The northwestern South China Sea | Outdoor | 0.04 ± 0.02 | <200 μm: 28%, 200–500 μm: 24%, 500–1000 μm: 26%, >2000 μm: 4% | Fibers: 65%, Fragments: 20%, Granules: 8%, Foam: 4%, Film: 3% | Polyester: 29%, rayon: 19%, PP: 15%, PE: 13%, PS: 10%, PA: 8%, phenoxy resin: 6% | [32] |
| West Pacific Ocean | Outdoor | 0–1.37 | <500 μm: >50% | Fiber: 60% Fragment: 31% | PET: 57% PE: 10% | [33] |
| Surabaya, Indonesia | Outdoor | 55.93–174.97 | <1500 μm: 48% | Fiber | Cellophane, PE, PET | [34] |
| 5 locations in BMR, Thailand | Outdoor | 333.42 ± 142.99 | 2.2–2.5 μm: 19.89%, 2.5–10 μm: 27.09%, 10–100 μm: 51.94%, 100–300 μm: 0.65%, 300–1000 μm: 0.34%, 1000–5000 μm: 0.10% | Fragments: 97.22%, Fibers: 2.78% | PE, PU, PP, PS, cellophane | This study |
Disclaimer/Publisher’s Note: The statements, opinions and data contained in all publications are solely those of the individual author(s) and contributor(s) and not of MDPI and/or the editor(s). MDPI and/or the editor(s) disclaim responsibility for any injury to people or property resulting from any ideas, methods, instructions or products referred to in the content. |
© 2022 by the authors. Licensee MDPI, Basel, Switzerland. This article is an open access article distributed under the terms and conditions of the Creative Commons Attribution (CC BY) license (https://creativecommons.org/licenses/by/4.0/).
Share and Cite
Sarathana, D.; Winijkul, E. Concentrations of Airborne Microplastics during the Dry Season at Five Locations in Bangkok Metropolitan Region, Thailand. Atmosphere 2023, 14, 28. https://doi.org/10.3390/atmos14010028
Sarathana D, Winijkul E. Concentrations of Airborne Microplastics during the Dry Season at Five Locations in Bangkok Metropolitan Region, Thailand. Atmosphere. 2023; 14(1):28. https://doi.org/10.3390/atmos14010028
Chicago/Turabian StyleSarathana, Danuwas, and Ekbordin Winijkul. 2023. "Concentrations of Airborne Microplastics during the Dry Season at Five Locations in Bangkok Metropolitan Region, Thailand" Atmosphere 14, no. 1: 28. https://doi.org/10.3390/atmos14010028