Article

Calibration of DustTrak and Low-Cost Sensors and Their Application for Assessment of Inhalation Exposures to Traffic-Related PM2.5 and PM1 in Ho Chi Minh City

1
Faculty of Environment, University of Science, Ho Chi Minh City 700000, Vietnam
2
Vietnam National University, Ho Chi Minh City 700000, Vietnam
3
Faculty of Food Science and Technology, Ho Chi Minh City University of Industry and Trade, Ho Chi Minh City 700000, Vietnam
4
Research Center for Environmental Changes, Academia Sinica, Taipei 115, Taiwan
*
Author to whom correspondence should be addressed.
Atmosphere 2023, 14(10), 1504; https://doi.org/10.3390/atmos14101504
Submission received: 25 August 2023 / Revised: 13 September 2023 / Accepted: 26 September 2023 / Published: 28 September 2023
(This article belongs to the Section Air Quality)

Abstract

:
The in-traffic microenvironment can enhance personal exposure to fine particulate matter (PM). With this study, we aimed to calibrate a DustTrak instrument (DustTrak 8533 DRX Aerosol Monitor, TSI Incorporated, Shoreview, MN, USA) and low-cost sensors (AS-LUNG-P sensors) and then assess inhalation exposure to PM2.5 and PM1 for different commuters in central areas of Ho Chi Minh City (HCM). The DustTrak instrument and low-cost sensors were calibrated using a gravimetric method under side-by-side conditions. Relationships between the DustTrak signals and PM concentrations measured by the gravimetric method were identified using simple linear regression models for PM2.5 (R2 = 0.998, p-value < 0.05) and PM1 (R2 = 0.989, p-value < 0.05). Meanwhile, PM concentrations determined by the AS-LUNG-P sensors and the gravimetric method were correlated using two-segmented linear regressions. To obtain the corresponding two-segment regression equations, the response of the AS-LUNG-P sensors was compared with the corrected DustTrak data. The coefficient of variation (CV) evaluated for all sensors was smaller than 10%, indicating that the data were applicable for particle assessment. For inhalation exposure assessment, the results showed that commuters using open transport modes, such as bikes, motorbikes, and walking, were exposed to more PM than those using closed transport modes (e.g., cars). Specifically, the bicyclists had the highest inhaled doses of PM among the open transport groups. PM exposure levels in the morning were higher than in the afternoon. Additionally, exposure levels to PM concentrations rapidly increased when passing through intersections of major roads and moderately decreased when using surgical facemasks.

1. Introduction

The World Health Organization (WHO) has estimated that air pollution inhalation, from both indoor and outdoor environments, causes seven million deaths globally each year. Eighty-nine percent of those deaths occur in low- and middle-income countries. In Vietnam, approximately 60,000 deaths per year are related to air pollution (https://www.who.int/vietnam/health-topics/air-pollution, accessed on 27 March 2023). Exposure to fine particulate matter (PM) is the main reason for this mortality. Fine PM is a concern because of its effects on the environment and human health. The impact of particles depends on their composition, surface area, and size. The smaller the particles, the greater the effects [1]. Fine PM can penetrate deep into the lungs, where it causes irritation and impairment of lung and cardiovascular function, resulting in serious health problems that may lead to death. Previous studies have reported that human exposure to fine PM is related to respiratory and cardiovascular illnesses, hospitalization, and mortality [2,3,4]. Vehicular emissions are considered to be one of the main sources of PM in the atmosphere. Commuters in the transportation microenvironment are likely to be directly exposed to PM from vehicle exhausts. The inhaled dose of PM and the resultant effects will be enhanced due to direct contact with vehicle emissions while commuting [2,5]. There are other impact factors governing exposure variation, including traffic characteristics, fuel type, road characteristics, ventilation conditions, meteorology, and local urban background concentrations [6,7]. Moreover, traffic-related air pollution has higher emissions and concentrations in developing countries than in developed countries [8,9].
The DustTrak instrument, using the light-scattering method to detect the particle concentration, has been used to evaluate PM in the atmosphere and take in-traffic measurements [6,10,11,12]. Due to its portability and capability of observing PM concentrations in real-time, the DustTrak monitor can provide high spatiotemporal resolution. However, many studies have pointed out that DustTrak instruments overestimate the PM concentration due to the meteorological conditions [11,13]. Relative humidity (RH) and temperature are factors that influence DustTrak recordings [11,12]. Therefore, it is essential to calibrate DustTrak monitors by considering real sampling field conditions to obtain high-accuracy measurements of PM for a specific application [12].
Using low-cost sensors for estimating PM in the atmosphere has gained popularity in recent years [14,15,16]. Low-cost sensors—devices with powerful single-board computer platforms—are much less expensive than traditional instruments, and applying low-cost sensors in assessing traffic-related PM2.5 exposure has been identified as a research priority in Asia [16]. A low-cost sensor, named AS-LUNG, was developed to quantify real-time PM in the atmosphere and for personal exposure assessment [4,17,18]. Nevertheless, similar to other instruments with light-scattering principles, AS-LUNG sensors need to be evaluated for their applicability to real monitoring conditions before use.
Vietnam is considered to be a developing country, with a high rate of industrialization and urbanization. Along with rapid development, Vietnam faces many problems related to environmental pollution, especially air pollution. The monitoring of fine PM concentrations in Vietnam has many limitations due to costly instruments. Monitoring stations are equipped with expensive equipment and are only located in limited areas. Using low-cost sensors is a new solution to overcome these financial issues. To date, there have been few studies using low-cost sensors to estimate concentrations of fine PM, especially PM2.5 and PM1, in Vietnam. In the literature, the PM exposure of motorcyclists [5,19], bus passengers, and car commuters [5] in Ho Chi Minh City (HCM) has been reported. Personal exposure assessments of fine particulate matter for motorcyclists and bicyclists [20,21], as well as bus and car commuters [21], have been conducted in Hanoi. A study by Quang et al. [22] pointed out that commuters who used motorcycles were exposed to significantly higher levels of black carbon than those who traveled by bus and car. However, very few studies have measured inhaled doses of PM2.5, and no study has measured PM1. Moreover, it is necessary to evaluate the real inhaled PM doses of in-transit commuters because they often wear facemasks when traveling. In Vietnam, facemasks are commonly worn by motorcyclists to block air pollutants, especially during the COVID-19 pandemic. From January 2020 to April 2023, there have been 11,544,777 confirmed cases of COVID-19 in Vietnam, with 43,187 deaths (https://covid19.who.int/region/wpro/country/vn, accessed on 5 April 2023). Moreover, PM plays an important role in the spread of the SARS-CoV-2 virus [23,24]. Therefore, more studies should be conducted on PM during the COVID-19 pandemic in HCM, a megacity in Vietnam where air pollution has been reported in recent years.
In this study, the first step was to calibrate the DustTrak instrument against the gravimetric method. Then, the calibrated DustTrak instrument was used to calibrate the low-cost sensor, AS-LUNG-P, by using both instruments to estimate the inhaled PM2.5 and PM1 doses of commuters using different popular transportation modes in HCM, Vietnam, during the COVID-19 lockdown. PM2.5 and PM1 were contemporaneously observed while commuting on bicycles, motorcycles, cars, and walking on the same route in the morning and afternoon. The findings from this study will provide useful information for citizens to reduce their personal exposure to PM in the megacity of HCM. Moreover, this study will provide helpful data for the government to plan a series of laws and policies to reduce and overcome environmental pollution. This study is part of an initiative called Health Investigation and Air Sensing for Asian Pollution (Hi-ASAP), developed under the umbrella of the Monsoon Asia and Oceania Networking Group (MANGO) of the International Global Atmospheric Chemistry Project (IGAC).

2. Materials and Methods

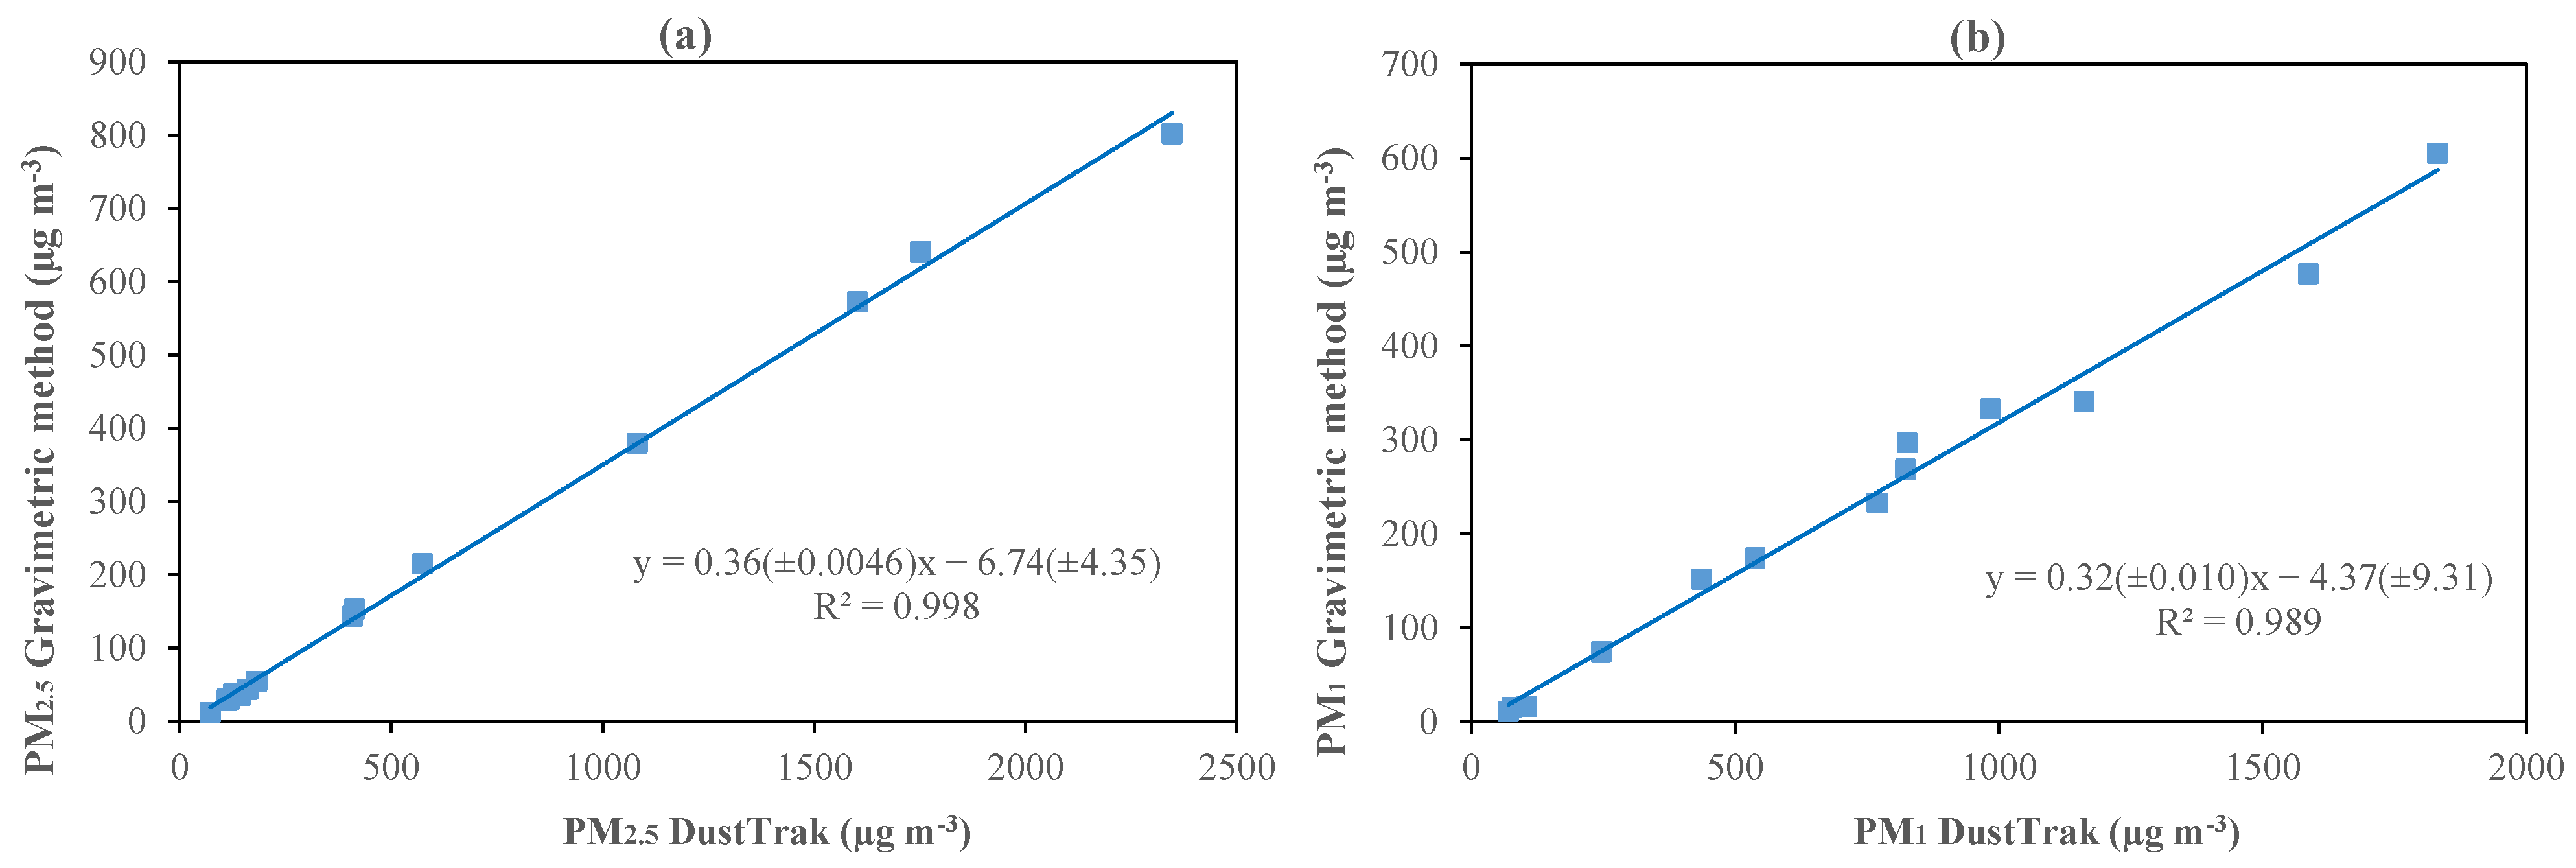
2.1. Calibrating the DustTrak Instrument against the Gravimetric Method

A DustTrak device (DustTrak 8533 DRX Aerosol Monitor, TSI Incorporated, Shoreview, MN, USA) was calibrated under side-by-side conditions with a reference method (i.e., the gravimetric method). For the gravimetric setup, the procedure was performed using an impact sampler (SKC, Eighty Four, PA, USA) at a flow rate of 10 L/min to collect PM2.5 and an impact sampler (HazDust EPAM-5000 instrument, SKC, Eighty Four, PA, USA) at 4 L/min to collect PM1. Both PM2.5 and PM1 were collected on Teflon filters (46.2 mm with polypropylene support ring, Cytiva (Whatman), Marlborough, MA, USA). After sampling, the filters were stabilized in a desiccator for 24 h at a temperature of 25 °C and humidity from 30 to 40% before weighing with a 6-digit microbalance (Radwag, Radom, Poland). The blank sample was carried out in parallel with the real sample. To simulate haze conditions, the PM was conditionally released by burning incense. For low and moderate concentrations of PM, the samples were collected from the ambient air in HCM. The DustTrak instrument continuously monitored the PM at a frequency of 1 min, while the gravimetric method was performed for 6 h and 12 h under high and low PM concentrations, respectively. Hence, the lower PM concentration, the longer the sampling time. Then, the PM concentrations measured by the DustTrak device were calculated based on the sampling time interval of the gravimetric method. The limitation of our study is that we did not investigate the sensitivity of DustTrak calibration to the averaging interval, due to the lack of a reference instrument with higher resolution. In this study, our primary focus was to determine the calibration factor for correcting the DustTrak monitor.

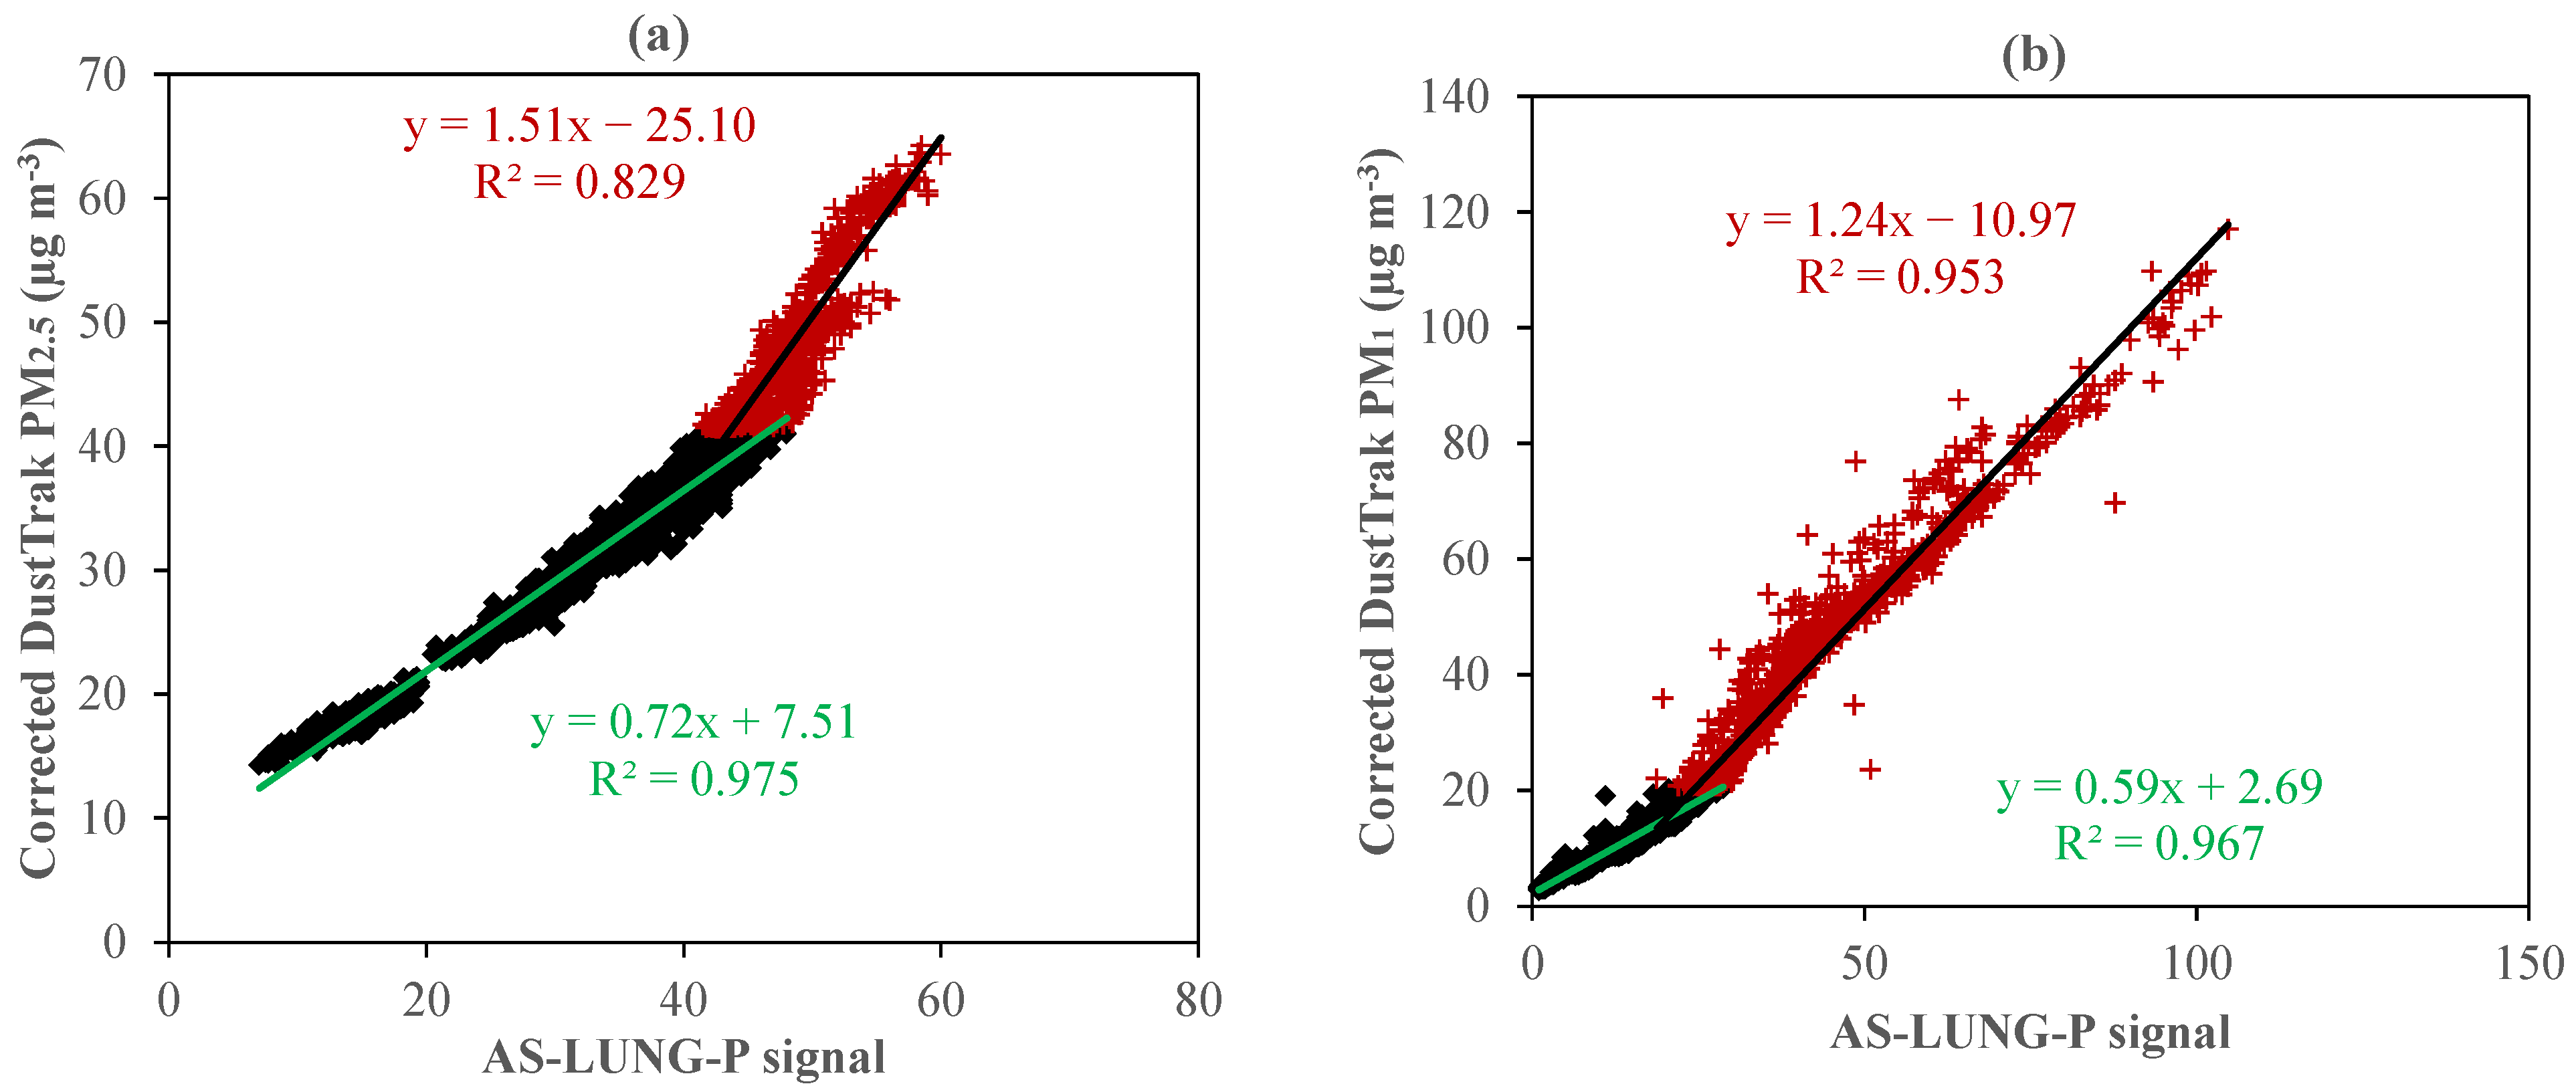
2.2. Calibration of Low-Cost Sensors by a DustTrak Instrument

Low-cost AS-LUNG-P sensors with PM detectors (PMS3003, Plantower, Beijing, China) were deployed in this study. The AS-LUNG-P sensor was developed by Academia Sinica, Taiwan [4]. The AS-LUNG-P sensors and the DustTrak device with a 1 min resolution were used to monitor PM under ambient conditions side-by-side. The PM measurements of the AS-LUNG-P sensors were filtered and the outliers removed based on a protocol from Academia Sinica, Taiwan [4,17,18]. The PM concentrations measured by the low-cost AS-LUNG-P sensors were calibrated with concentrations determined by the DustTrak device, which had already been calibrated with the gravimetric method. Similar to the study of Lung et al. [18], this study also used two-segmented linear regression equations with a breakpoint to calibrate the PM concentrations measured by the AS-LUNG-P sensors. The breakpoint, slope, and intercept of the two-segment regression were calculated through a piecewise linear fit. All statistical analyses were performed in PyCharm.

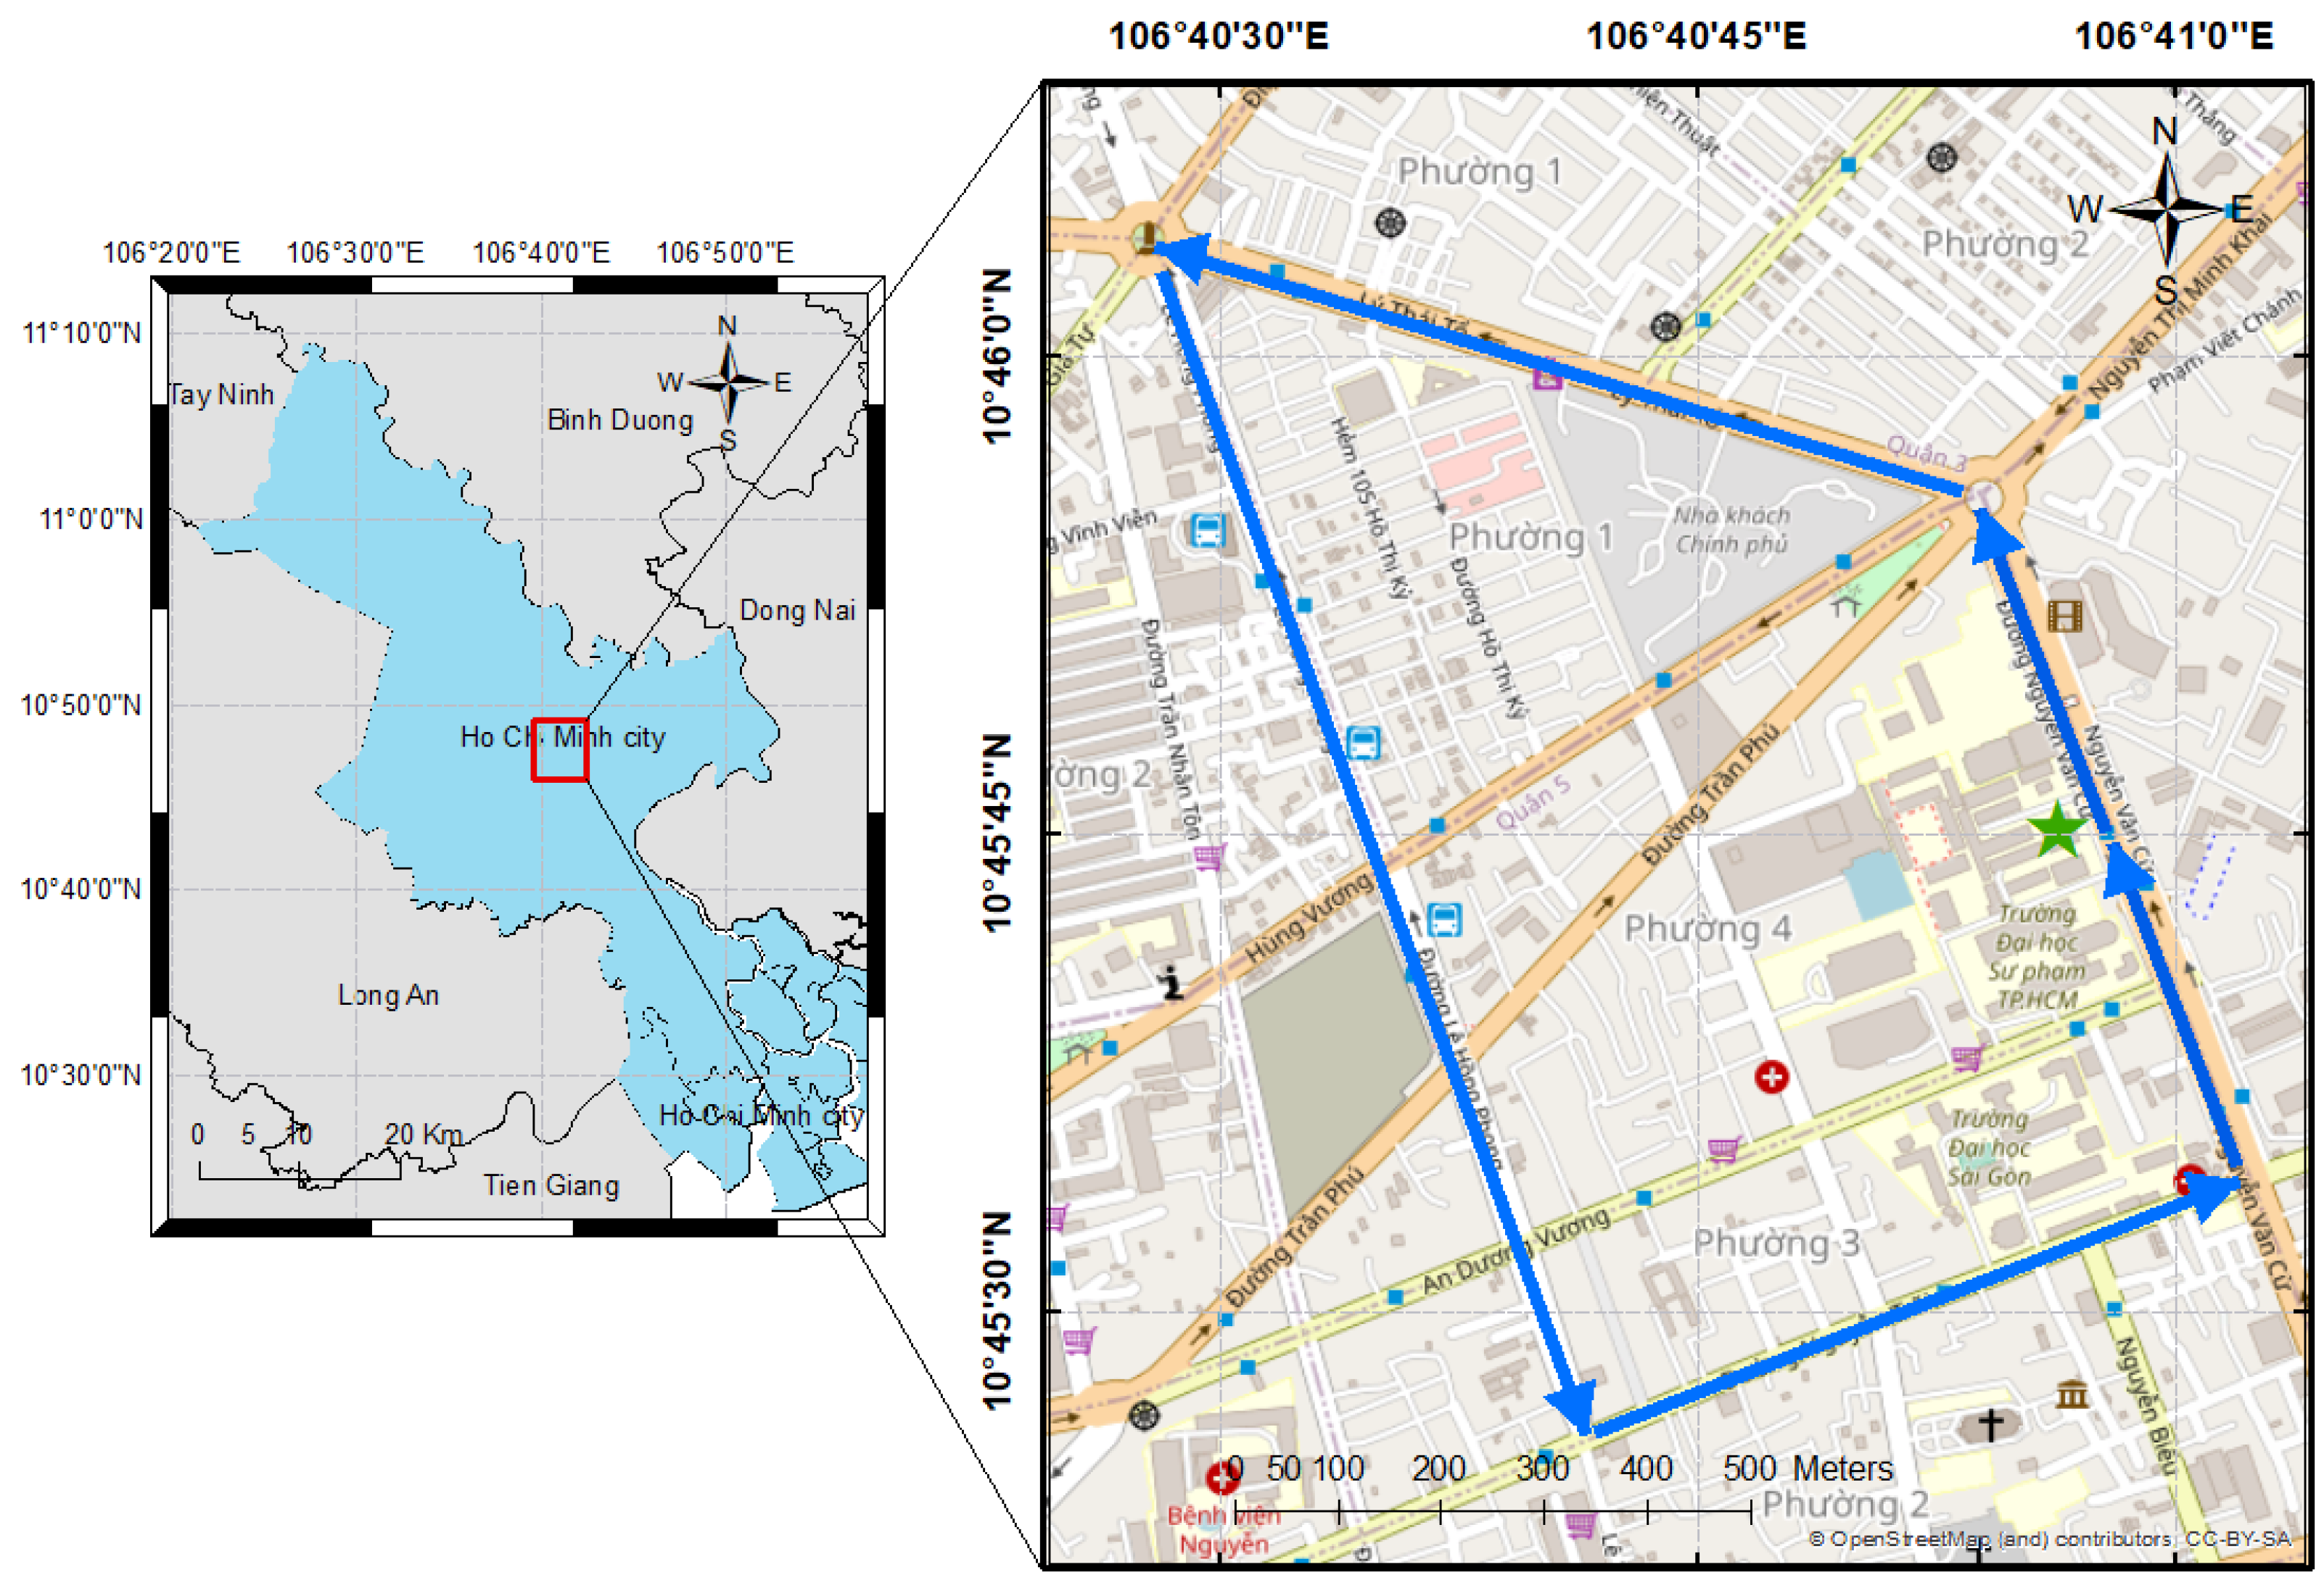
2.3. Assessment of PM2.5 and PM1 Exposure Using Different Transport Modes in HCM

Different transport modes, including bicycle, motorcycle, car, and walking, were investigated in this study. Each commuter wore an AS-LUNG-P sensor when traveling in the real traffic microenvironment (Figure S1). The commuters were required to travel the same route in District 5, an urban district of HCM, Vietnam, where transportation activities are one of the major contributors to ambient air pollution (Figure 1). Therefore, some main roads with high traffic volumes in District 5, such as Nguyen Van Cu, Ly Thai To, Le Hong Phong, and Nguyen Trai Street, were chosen to monitor the PM. The sampling route, with several T-junctions and crossroads, is shown in Figure 1 (blue arrows). There are two large roundabouts located on Ly Thai To Street. The total length of the sampling route was about 4 km. The measurements were carried out from 7 October to 22 October 2021 (during the COVID-19 lockdown in HCM), including weekdays and weekends. The measurements were recorded from 7:00 to 7:30 a.m. during the morning rush hour and from 4:30 to 5:00 p.m. during the afternoon rush hour. To measure PM concentrations during transportation, 1-min data from the AS-LUNG-P sensors were used. A map of the PM concentrations along the route was created using ArcGIS software. Additionally, an outdoor sensor, AS-LUNG-O [18], was set up at a fixed site in District 5, University of Science, Vietnam National University, Ho Chi Minh City, to measure PM concentrations in the surrounding air.
During the COVID-19 lockdown in HCM, all of the subjects wore medical facemasks, thereby reducing their PM exposure [5,25]. Therefore, to properly assess the PM exposure concentrations, we applied the fine PM removal coefficient for wearing a facemask, calculated from the study of Huy et al. [5]. Wearing a facemask can reduce PM exposure by 23–31% for PM1 and 33–43% for PM2.5 [5]. In this study, we applied a facemask removal efficiency of 30% for PM1 and 40% for PM2.5 to estimate the inhaled PM doses for individual commuters.
The inhaled dose was calculated based on Equations (1) and (2), where both inhalation rates and personal activities were considered [26]. We separated estimates of inhaled PM doses for male and female subjects aged 18 to 30 years old. We assumed that the subjects in each group had equivalent inhalation rates and metabolic activity. These two variables were important in estimating the inhaled dose.
D = C × VE × t (μg)
VE = BMR × MET × VQ × H × 1 1440   ( m 3 / min )
where:
D: Amount of PM2.5 and PM1 inhaled into the respiratory system (μg);
C: Inhaled PM concentration (μg m−3);
VE: Inhalation rate, volume of inhaled air of an exposed person (m3/min);
t: Time of short-term exposure (we assumed that HCM citizens take an average of 30 min to commute from home to work);
BMR: Basal metabolic rate (MJ/day);
MET: Metabolic equivalent associated with the activity (MET = 1.2 for sedentary activity (car user), MET = 2 for light physical activity (walking, motorcycling), or MET = 4 for moderate activity (cycling));
VQ: Ventilation equivalent (VQ = 27);
H: Oxygen uptake (H = 0.05 (L/KJ)).

3. Results and Discussion

3.1. DustTrak Monitor Corrections

The mean DustTrak and gravimetric method data for a corresponding sampling time were analyzed for correlation. Figure 2 shows the linear regression between data from DustTrak and PM concentrations obtained using the gravimetric method. The data from the DustTrak instrument and the gravimetric method showed a strong correlation, with correlation coefficients of 0.999 and 0.994 for PM2.5 and PM1, respectively. The DustTrak data were 2.8 times higher than the gravimetric value for PM2.5 and 3.1 times higher for PM1. Previous studies have revealed that DustTrak monitors overestimate the PM2.5 concentration, for instance, 2-fold [12] or from 2.8- to 3.2-fold [11] higher than the actual value. DustTrak monitor data for PM1 have been sparsely analyzed in the literature. The DustTrak data showed a different relationship to the gravimetric technique for PM1 (slope = 0.32) and PM2.5 (slope = 0.36). This result suggests that the DustTrak monitor’s performance was affected by particle size. Moreover, other properties of particles (e.g., chemical composition) also affect the performance of the DustTrak monitors [12,27]. The limit of our study is that we did not determine the aerosol components. However, in this study, we investigated the effect of humidity on the performance of the DustTrak instrument. The RH during our experiment ranged from 60 to 80%. The relationship between the DustTrak signal and the PM concentration obtained using the gravimetric technique should have a relationship with RH, reflecting the influence of humidity on the device’s signal [11,12]. However, in this study, we did not find any significant relationship between the above ratio and RH (R = 0.3, p-value < 0.05). It is likely that, during our experiment, the humidity only fluctuated in the range of 60–80%, and this humidity range did not significantly affect the signal of the DustTrak monitor. Therefore, we only applied the correlation equation to correct the DustTrak data and did not calibrate against humidity. The corrected equations for the DustTrak data are as follows: y = 0.36(±0.0046)x − 6.74(±4.35), R2 = 0.998, and p-value < 0.05 for PM2.5; y = 0.32(±0.010)x − 4.37(±9.31), R2 = 0.989, and p-value < 0.05 for PM1. After applying the correction factor, the accuracy of both PM2.5 and PM1 values from the DustTrak monitor was enhanced (the new slopes were approximately 1, and intercepts were very small). Additionally, the bias of the corrected DustTrak data compared to the gravimetric measurements was from 0.1 to 5.5% for PM2.5 and from 0.7 to 9.8% for PM1, showing that the DustTrak has a good agreement with the standard method.

3.2. Calibration of the AS-LUNG-P Low-Cost Sensor

The results of the comparison between the low-cost sensor and the gravimetric method are illustrated in Figure S2. It can be seen that the responses of the AS-LUNG-P sensor to the PM2.5 and PM1 concentrations had a relationship with a two-segmented linear correlation. The first segment and the second segment had coefficients of determination of 0.82 and 0.99, respectively. For PM1, the sensor signal also followed the above rule. Previous studies have also shown a two-segmented linear correlation when performing AS-LUNG-P sensor calibration [4,17,18]. However, the frequency of data from the gravimetric method was low, so the two segments of the correlation could not be evaluated correctly. Therefore, this correlation was assessed between data from the AS-LUNG-P sensors and the corrected data from the DustTrak monitor, with the same logging interval. The comparison results of 1 min AS-LUNG-P sensor number 1 data and the corrected DustTrak data are presented in Figure 3. The two-segmented linear regressions of the other AS-LUNG-P sensors used in this study are described in Table 1. Each sensor had different two-segmented linear regressions and breakpoints. However, this relationship had a high correlation coefficient, with R2 > 0.9, p-value < 0.05. To evaluate the inter-sensor response to PM in HCM’s ambient air, the coefficient of variation (CV) of the four sensors used in this study was calculated with the equation CV = C s C m , where CV is the precision, Cs is the standard deviation of the measurements, and Cm is the mean signal from the four sensors. The CV of the four low-cost sensors ranged between 0.3 and 9% for PM2.5 and from 0.4 to 10% for PM1. The CV being below 10% shows that the sensors had good precision and low intervariability, making them applicable for particle assessment. We also calculated the bias of the sensors, the results of which are presented in Table 1. The bias of the four sensors after correction was around 0.10, 0.14, 0.13, and 0.12 for PM2.5, respectively. For PM1, the biases were lower than 10 percent. The results show that, after correction, all of the AS-LUNG-P sensors demonstrated good accuracy for PM in ambient air in urban HCM.

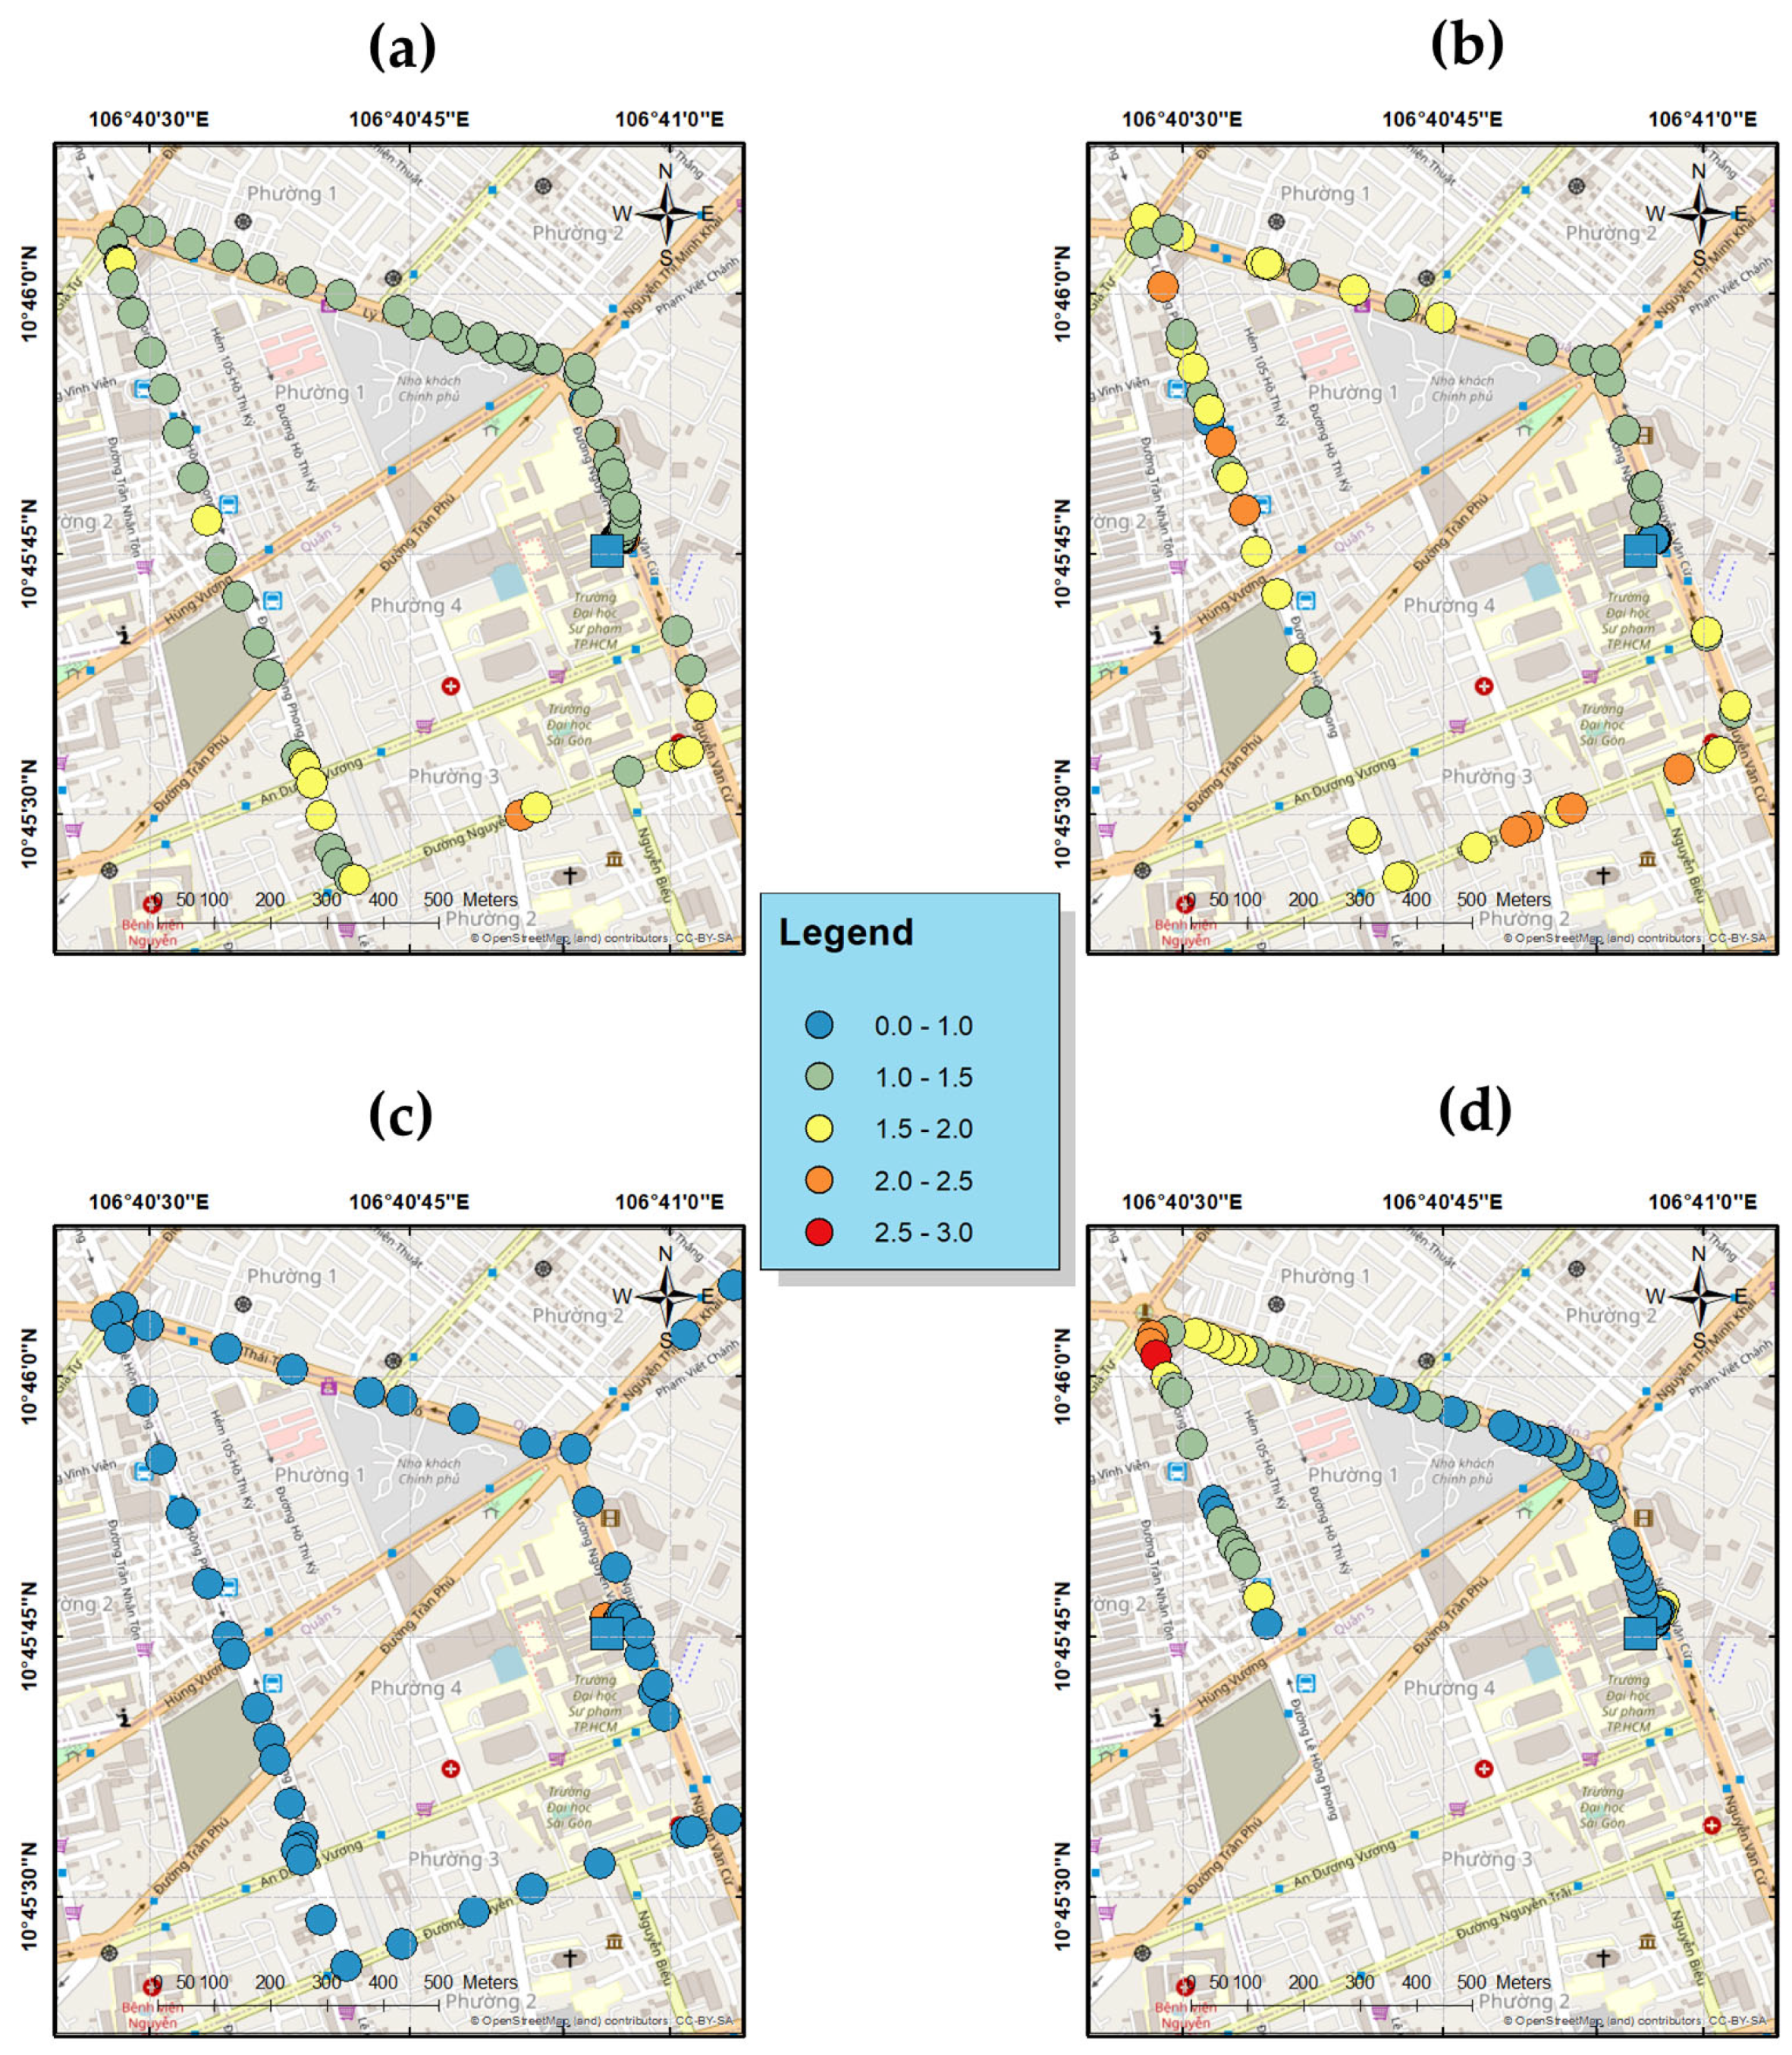
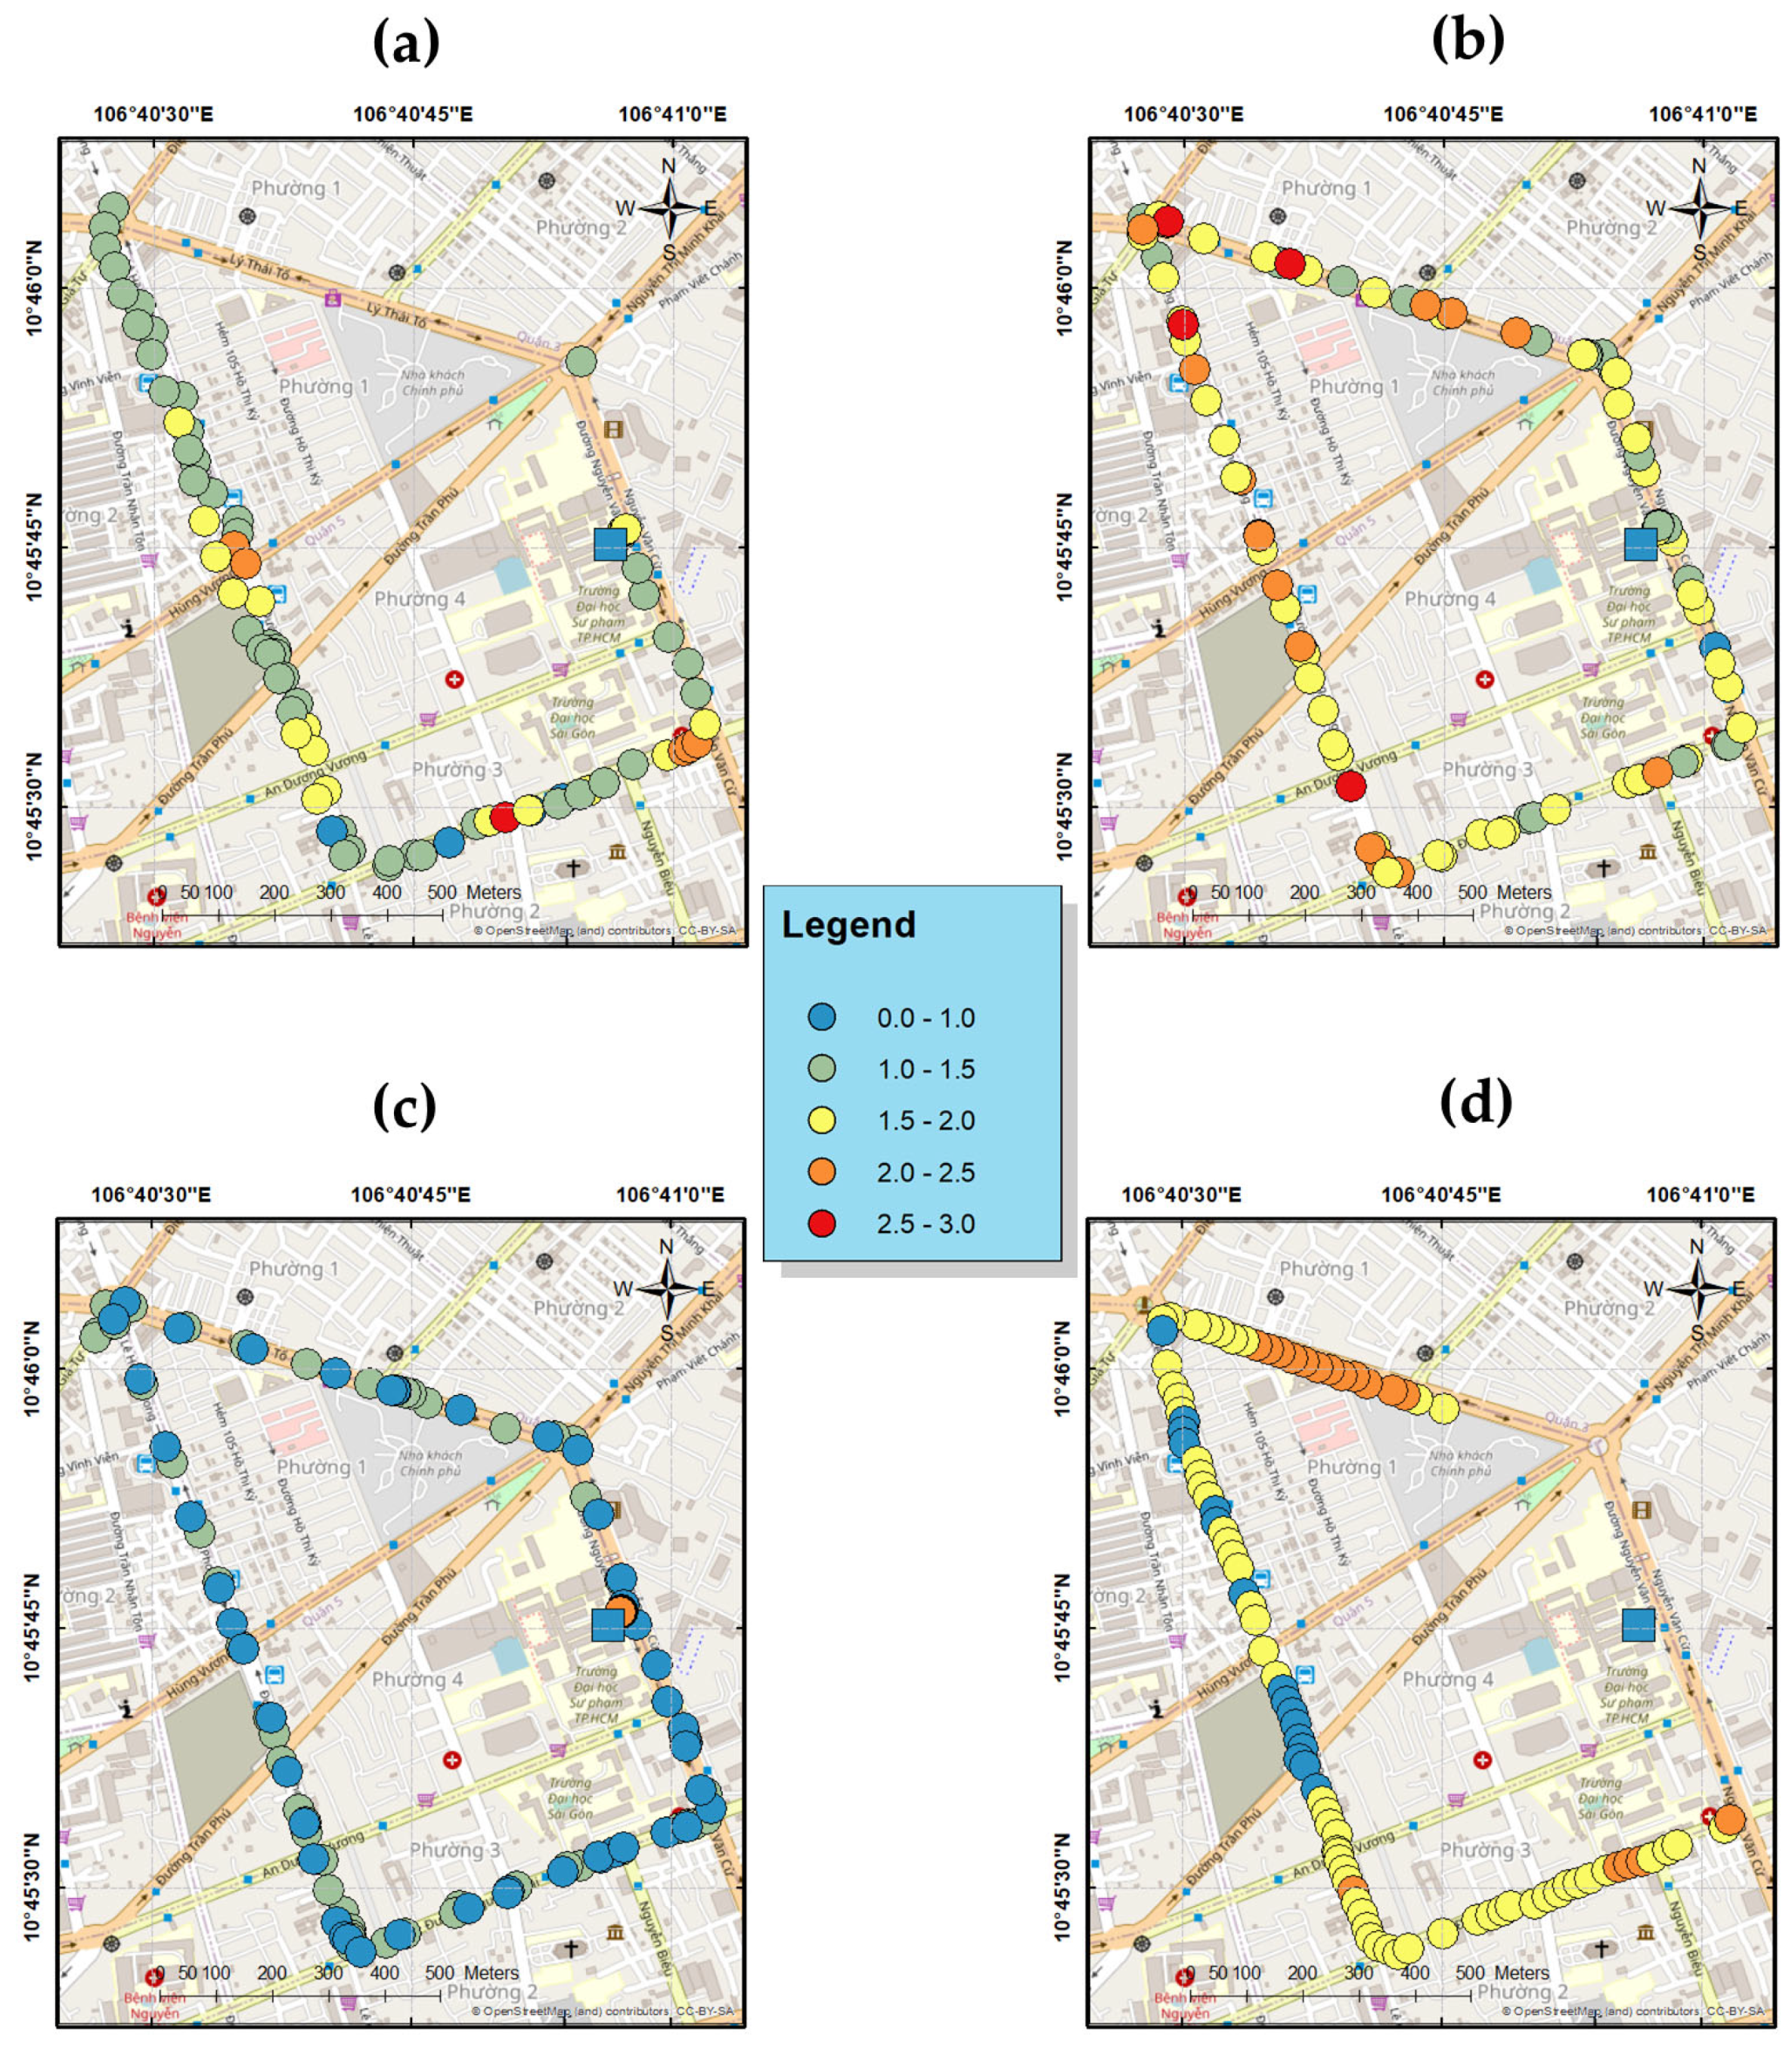
3.3. Quantifying PM Concentrations Faced by in-Transit Commuters Using Different Transportation Modes in Urban HCM during the COVID-19 Lockdown

Table 2 describes the PM concentrations experienced by the subjects commuting via common transportation modes in HCM during the morning and afternoon rush hours. Car users experienced the lowest concentrations of PM compared to others, with PM2.5 and PM1 concentrations of 15.5 and 7 µg m−3 in the morning, and 12.4 and 4 µg m−3 in the afternoon, respectively. The PM2.5 exposure of motorbike, bike, and walking commuters was not significantly different, indicating that these subjects were exposed to the same outdoor air quality. A study by Sm et al. [28] showed that bicyclists, motorcyclists, and walking commuters had the highest PM exposure concentrations. This result is consistent with many previous studies [5,25,29,30]. Commuters in vehicles without protection from the vehicle body or air filter are likely to experience higher concentrations of PM compared to those in closed transportation modes (with protection from the vehicle body or air filter) [31]. A study by Huy et al. [5] in HCM reported that motorcyclists were exposed to PM2.5 concentrations 1.4 and 4.3 times higher than bus and car passengers, respectively.
The concentration of PM1 in ambient air during the study period ranged from 3 to 71 µg m−3, with an average of 14 ± 12 µg m−3, while that of PM2.5 ranged from 3.5 to 94.1 µg m−3, with a mean of 21.0 ± 13.9 µg m−3. Table S1 shows the PM2.5 exposure increments (concentration increases compared to ambient levels) in HCM and other cities. Compared with the ambient air concentration of PM2.5, commuting by car can reduce exposure by 5.4 μg m−3 (15% lower than the ambient air’s PM). Bicyclists, motorcyclists, and pedestrians were exposed to direct PM2.5 emissions of 7.4, 8.9, and 8.1 μg m−3, respectively. Ham et al. [6] found that the ventilation settings of vehicles can reduce in-vehicle PM2.5, black carbon (BC), and ultrafine particle concentrations by 15–75%. The PM2.5 exposure increments in urban HCM were higher than those in Taiwan [14] and lower than those in Hanoi [20]. Wang et al. [14] reported that the PM2.5 exposure increments for bike, scooter, car, and walking were 6.1, 8.1, −19.2, and 7.1 μg m−3, respectively.
The concentration of PM2.5 in October 2021, during the COVID-19 pandemic in urban HCM (this study), decreased by 43% when compared to the normal period (37 µg m−3 in October 2017 [32]). Due to the reduction in anthropogenic emissions from sources such as traffic activities, air pollution in many cities and countries was improved [33,34,35,36,37]. Therefore, the PM exposure in this study represents the lockdown period and may be lower than in normal conditions. Nevertheless, the PM2.5 exposure increments in urban HCM were still higher than those in Taiwan during normal conditions. Many studies have shown that PM exposure severely increases hospital admission cases and mortality associated with COVID-19 [38,39,40]. Moreover, the death rate of COVID-19 in HCM was 4.95% higher than in other cities in the Asian region [41]. This result suggests that air pollution, especially fine PM, is a big problem in HCM, even during the COVID-19 pandemic.
For bicyclists, motorcyclists, and pedestrians, the concentration of PM1 accounted for 50% of PM2.5, indicating that those commuters may inhale small particles into their bodies. Previous studies have also revealed that fine PM accounts for a majority of the total suspended particles in the atmosphere in HCM [5,32]. Therefore, exposure to fine PM from the atmosphere in HCM can result in adverse effects on human health. This can be seen in the adverse birth outcomes when exposure to PM occurs during pregnancy in HCM. An increase of 10 µg m−3 in PM2.5 during the second trimester resulted in a decrease of 11.771 g in birth weight and an increase of 23.1% in the risk of preterm birth [42]. Car passengers had a PM1/PM2.5 ratio of 0.36, reflecting that cars present a different microenvironment than other transportation modes.
The PM exposure concentrations experienced by subjects during the afternoon period were lower than during the morning peak. This phenomenon has been reported in the literature in HCM [32], in Hanoi, Vietnam [20], in Vellore, India [43], and in Al-Hillah, Iraq [44]. Munir et al. [25] also found a similar trend in Bandung, Indonesia, showing that PM2.5 concentrations in the afternoon were lower than those in the morning due to reduced traffic activities.
The weekday PM2.5 concentrations for bicyclists, motorcyclists, car users, and pedestrians were 29.8, 30.4, 12.8, and 30.3 µg m−3, respectively. The amount of PM2.5 inhaled into the respiratory system when traveling was higher on weekdays and lower on weekends (Figure S3). The PM2.5 exposure concentrations on weekends were 17.7, 20.0, 11.9, and 18.6 µg m−3 for bicyclists, motorcyclists, car users, and pedestrians, respectively. There was an increase in PM2.5 concentration from the start of the week (Monday) to the middle of the week (Wednesday). The PM2.5 concentration then dropped from Wednesday to the weekend.
Figure 4 and Figure 5 illustrate PM2.5 exposure’s normalization against that measured at the fixed stations of different transportation modes in urban HCM in the morning and in the afternoon, respectively. The concentration of PM increased when the subjects passed through crowded streets such as Nguyen Van Cu Street and Le Hong Phong Street. Previous studies have revealed that on-road emissions contribute to large amounts of PM in the atmosphere. For instance, the stop-and-go traffic, market, temple, and vendor contributions to PM2.5 at 3–5 m away were 4.38, 3.90, 2.72, and 1.80 µg m–3, respectively [18]. A traffic area in Bandung, Indonesia, had a PM2.5 concentration of 53 µg m–3, which was higher than the 41 µg m–3 seen in a residential area [25]. Moreover, the PM2.5 concentrations were highest at busy traffic sites and lowest in urban backgrounds [28]. It can be seen that the concentrations of PM2.5 and PM1 are raised when commuters (bicyclists, motorcyclists, and pedestrians) stop at traffic lights and roundabouts. Motorcycle commuters idling at traffic lights had exposure concentrations of PM10, PM2.5, and PM1 that were significantly increased, by 5%, 6%, and 7%, respectively, in comparison to the levels experienced by moving motorcyclists [31]. The occurrence of hotspots along the route was mainly attributed to traffic-promoting factors such as stoplights [7].

3.4. Correlation among in-Traffic Microenvironment, Microclimate Conditions, and Ambient Air PM

The Spearman correlations among PM, CO2, temperature, and humidity for bikers, based on the time of collection (morning and afternoon), are described in Table 3. Those for motorcyclists, car users, and pedestrians are illustrated in Figures S4 and S5. The mean temperature (T) and relative humidity (RH) in the morning were 28 °C and 82%, respectively, and in the afternoon they were 30 °C and 73%, respectively. There was a moderate correlation between T and RH for open traffic microenvironments such as those experienced by cyclists, motorcyclists, and pedestrians. The humidity decreased when the temperature increased, or vice versa, according to the negative correlation coefficient. This result is in line with the findings of previous studies [25]. However, there was no relationship between T and RH in the car microenvironment. PM1 and PM2.5 had a strong correlation, with a correlation coefficient of R = 1 for all commuter datasets. CO2 concentrations were higher in the morning than in the afternoon, with a mean of 489 ppm and 458 ppm, respectively. We found a weak correlation between meteorological factors and PM concentrations, except for car users.
We also compared the in-traffic PM concentration with background ambient air PM (Figure S6). We found that there was a correlation between in-traffic PM concentrations and those from background ambient air. Open modes of transportation showed a strong correlation of PM with background air (R = 0.84 for bicycle, 0.85 for motorcycle, and 0.88 for walking; p-value < 0.05), while closed vehicles showed no significant relationship (R = 0.31, p-value < 0.05). It is likely that PM from background air directly affects commuters using open modes of transport in HCM.

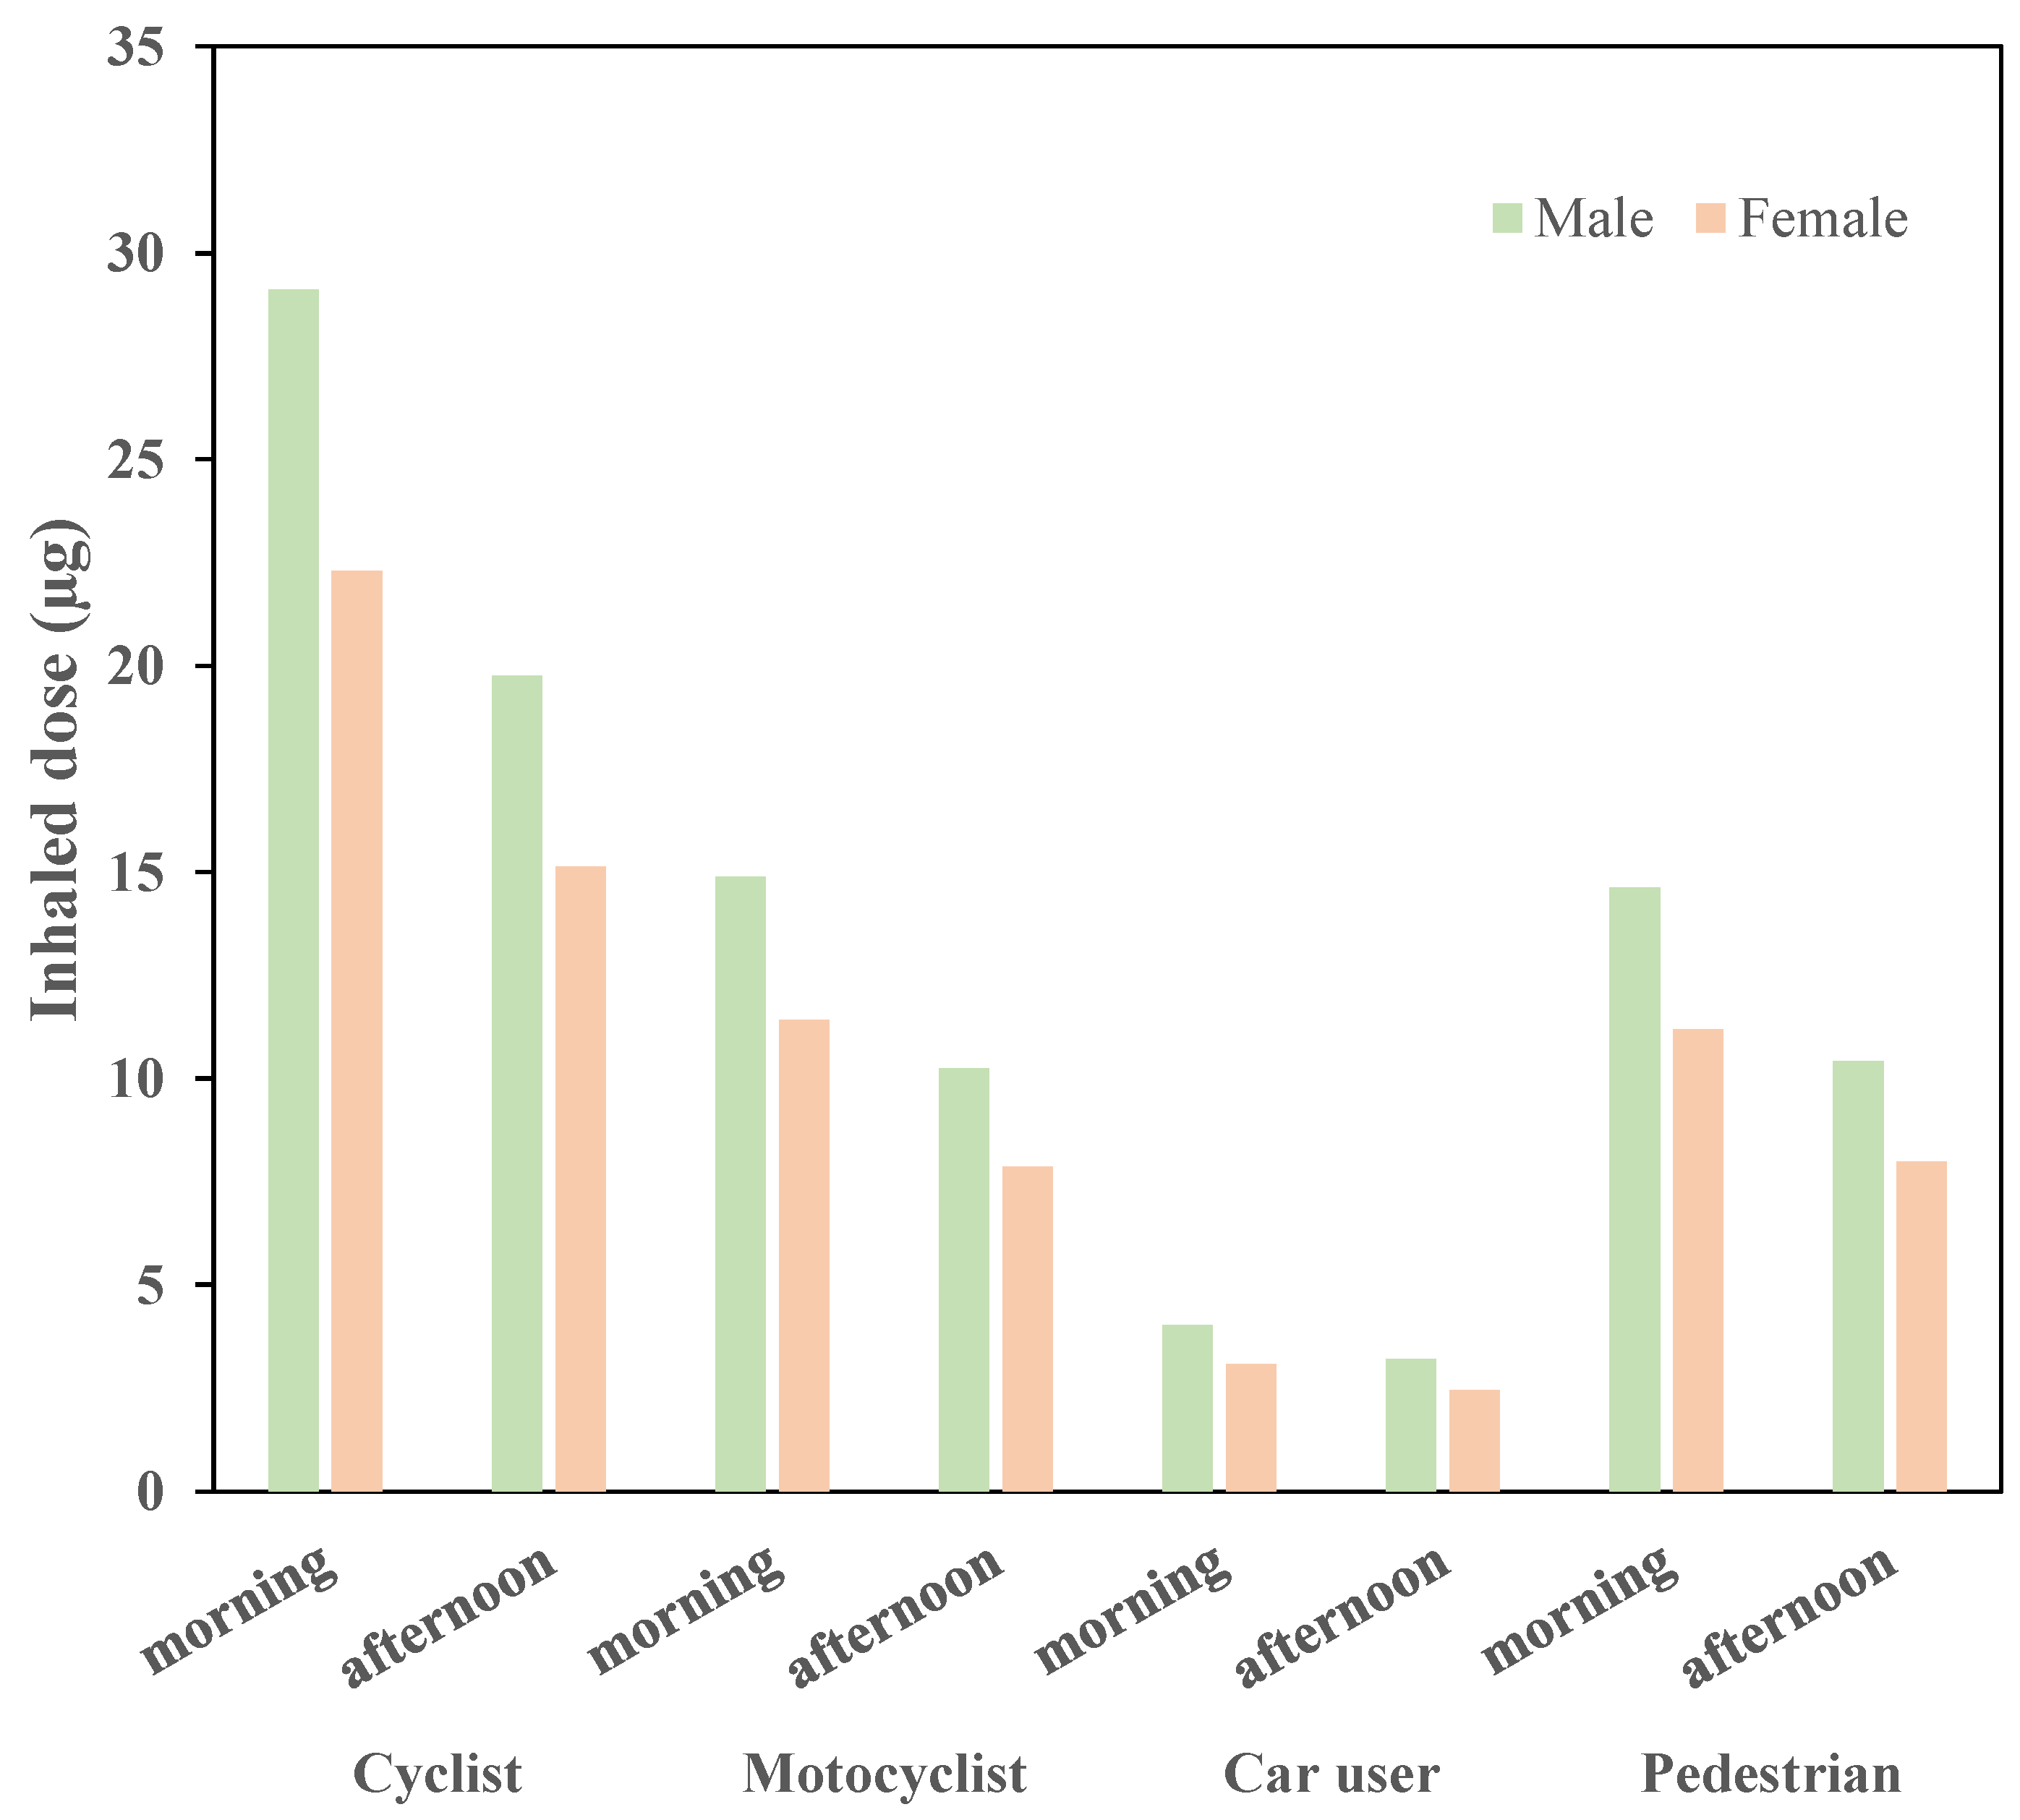
3.5. Estimated Inhaled Doses of PM2.5 and PM1

The inhaled doses of PM for each transportation microenvironment for males and females are presented in Table S2. The amount of PM inhaled during commuting depends on the physical activities involved. According to the classification of physical activity, using a car is rated as sedentary activity because drivers are normally seated in the vehicle. Walking and cycling are categorized as light and moderate activities, respectively. The concentration of PM2.5 when traveling by motorbike tends to be higher than the concentration of PM2.5 when traveling by bicycle. However, the dose of inhalation for bicyclists was the highest, due to their having the highest metabolic equivalent for moderate activity. The inhalation rates of cyclists, motorcyclists or pedestrians, and car passengers were 22–29 L/min, 11–14 L/min, and 7–9 L/min, respectively. Previous studies have also reported similar inhalation rates for car users (e.g., 11 L/min [45], 8.2 L/min [29], 7.8 L/min [46]). Those for cyclists were 33.8 L/min [47], 26 L/min [45], and 23.5 L/min [48]. The higher the inhalation rate, the higher the inhaled dose. Male commuters were exposed to 23% more PM than female commuters. The basal metabolic rate for male passengers was higher than for female passengers (Figure 6). Kolluru et al. [49] also reported that male passengers were exposed to more PM than female passengers. The morning dose of PM for all traffic microenvironments was higher than that in the afternoon. The morning dose for all transportation modes was more than 1.5 times higher than the afternoon dose for both male and female passengers.
Compared to a study conducted in Hanoi, Vietnam [20], the inhaled dose in HCM was 3.3 times lower for cyclists and 3.5 times lower for motorcyclists. Table 4 shows the inhaled doses of PM2.5 from in-vehicle microenvironments summarized from the literature. Cyclists or pedestrians always had the highest inhaled dose. The PM2.5 dose inhaled by cyclists in HCM was at the same level as that in Xi’an, China [50], lower than that in Nanjiang, China [47], and higher than that in Milan, Italy [51] and Mexico City, Mexico [52]. Subjects using closed vehicles such as cars, buses, and subways had the lowest inhaled doses. It should be noted that the inhaled doses from this study represent the COVID-19 lockdown period and are lower than those under normal conditions.

4. Conclusions

This is the first study to evaluate the inhaled doses of PM2.5 and PM1 in in-traffic microenvironments in urban HCM during the COVID-19 pandemic. First, we obtained the regression equation to correct the DustTrak monitor and used a two-segmented linear regression for calibration of the AS-LUNG-P sensors. The low-cost sensors exhibited CV and bias values within acceptable thresholds, indicating that they demonstrate good accuracy in measuring ambient air levels of PM in HCM. Second, we evaluated the inhaled PM2.5 and PM1 doses for four common types of transportation modes in HCM, including open transport modes (i.e., bicycle, motorcycle, and walking) and closed transport modes (i.e., car). Open transport modes were more likely to expose individuals directly to vehicle emissions. Bicyclists had the highest inhaled PM2.5 dose (12.9 µg), followed by motorcyclists (6.7 µg) and pedestrians (6.6 µg). Commuting by car significantly reduces the inhaled dose of PM. Commuters were exposed to more PM during the morning trip than during the afternoon trip. During the COVID-19 lockdown, the PM concentrations decreased; however, the inhaled dose was still high when compared with other cities during normal periods.

Supplementary Materials

The following supporting information can be downloaded at: https://www.mdpi.com/article/10.3390/atmos14101504/s1, Table S1: The average hourly PM2.5 exposure increments (µg m−3) for different transportation modes in other cities; Table S2: Inhaled doses of PM2.5 and PM1 for short-term exposures; Figure S1: Commuters participating in the study on exposure to PM2.5 and PM1 in HCM using low-cost sensors; Figure S2: Correlation of signal from AS-LUNG-P sensors with concentrations of PM2.5 (a) and PM1 (b) measured using the gravimetric method; Figure S3: PM2.5 exposure concentrations during weekdays and weekends in urban HCM; Figure S4: The Spearman correlations among PM, CO2, temperature, and humidity in the traffic microenvironment for motorcyclists (a), car users (b), and pedestrians (c) based on the time of col-lection (morning); Figure S5: The Spearman correlations among PM, CO2, temperature, and humidity in the traffic microenvironment for motorcyclists (a), car users (b), and pedestrians (c) based on the time of col-lection (afternoon); Figure S6: The Spearman correlations between PM in traffic microenvironments and ambient air.

Author Contributions

N.D.T.C.: validation, resources, formal analysis, and writing—original draft preparation; T.A.N.: investigation, sampling, and visualization; T.C.-T.: writing—review and editing; D.H.H.: writing—review and editing; S.-C.C.L.: methodology and writing—review and editing; T.T.H.: Conceptualization, methodology, writing—review and editing, and funding acquisition. All authors have read and agreed to the published version of the manuscript.

Funding

This research was funded by Vietnam National University, Ho Chi Minh City (VNU-HCM), under grant number C2021-18-19.

Institutional Review Board Statement

This study was conducted in accordance with the Declaration of Helsinki and approved by the Institutional Review Board of the School of Medicine, Vietnam National University, Ho Chi Minh City (protocol code: no. 01QĐ-IRB-VN01.017; date of approval: 7 March 2022).

Informed Consent Statement

Informed consent was obtained from all subjects involved in the study.

Data Availability Statement

Not applicable.

Acknowledgments

This research was funded by Vietnam National University, Ho Chi Minh City (VNU-HCM), under grant number C2021-18-19. We gratefully thank the members of the Air and Water Pollution—Public Health—Climate Change Research Group of the Faculty of Environment, VNU-HCM University of Science, for the operation and maintenance of instruments at the observation site. The low-cost sensors were supported by the Integrated Research on Disaster Risk, International Centre of Excellence–Taipei (IRDR ICoE-Taipei), Advanced Institute on Health Investigation and Air Sensing for Asian Pollution (AI on Hi-ASAP).

Conflicts of Interest

The authors declare no conflict of interest.

References

  1. Kelly, F.J.; Fussell, J.C. Size, source and chemical composition as determinants of toxicity attributable to ambient particulate matter. Atmos. Environ. 2012, 60, 504–526. [Google Scholar] [CrossRef]
  2. Brook, R.D.; Bard, R.L.; Burnett, R.T.; Shin, H.H.; Vette, A.; Croghan, C.; Phillips, M.; Rodes, C.; Thornburg, J.; Williams, R. Differences in blood pressure and vascular responses associated with ambient fine particulate matter exposures measured at the personal versus community level. Occup. Environ. Med. 2011, 68, 224. [Google Scholar] [CrossRef] [PubMed]
  3. Suglia Shakira, F.; Gryparis, A.; Schwartz, J.; Wright Rosalind, J. Association between Traffic-Related Black Carbon Exposure and Lung Function among Urban Women. Environ. Health Perspect. 2008, 116, 1333–1337. [Google Scholar] [CrossRef] [PubMed]
  4. Lung, S.-C.C.; Chen, N.; Hwang, J.-S.; Hu, S.-C.; Wang, W.-C.V.; Wen, T.-Y.J.; Liu, C.-H. Panel study using novel sensing devices to assess associations of PM2.5 with heart rate variability and exposure sources. J. Expo. Sci. Environ. Epidemiol. 2020, 30, 937–948. [Google Scholar] [CrossRef]
  5. Huy, D.H.; Chi, N.D.T.; Nam, N.X.T.; Hien, T.T. Commuter exposures to in-transit PM in an urban city dominated by motorcycle: A case study in Vietnam. Atmos. Pollut. Res. 2022, 13, 101351. [Google Scholar] [CrossRef]
  6. Ham, W.; Vijayan, A.; Schulte, N.; Herner, J.D. Commuter exposure to PM2.5, BC, and UFP in six common transport microenvironments in Sacramento, California. Atmos. Environ. 2017, 167, 335–345. [Google Scholar] [CrossRef]
  7. Collado, J.T.; Abalos, J.G.; de los Reyes, I.; Cruz, M.T.; Leung, G.F.; Abenojar, K.; Manalo, C.R.; Go, B.; Chan, C.L.; Gonzales, C.K.G.; et al. Spatiotemporal Assessment of PM2.5 Exposure of a High-risk Occupational Group in a Southeast Asian Megacity. Aerosol Air Qual. Res. 2023, 23, 220134. [Google Scholar] [CrossRef]
  8. Both, A.F.; Westerdahl, D.; Fruin, S.; Haryanto, B.; Marshall, J.D. Exposure to carbon monoxide, fine particle mass, and ultrafine particle number in Jakarta, Indonesia: Effect of commute mode. Sci. Total Environ. 2013, 443, 965–972. [Google Scholar] [CrossRef]
  9. Goel, R.; Gani, S.; Guttikunda, S.K.; Wilson, D.; Tiwari, G. On-road PM2.5 pollution exposure in multiple transport microenvironments in Delhi. Atmos. Environ. 2015, 123, 129–138. [Google Scholar] [CrossRef]
  10. Li, Z.; Che, W.; Frey, H.C.; Lau, A.K.H.; Lin, C. Characterization of PM2.5 exposure concentration in transport microenvironments using portable monitors. Environ. Pollut. 2017, 228, 433–442. [Google Scholar] [CrossRef]
  11. Li, Z.; Che, W.; Lau, A.K.H.; Fung, J.C.H.; Lin, C.; Lu, X. A feasible experimental framework for field calibration of portable light-scattering aerosol monitors: Case of TSI DustTrak. Environ. Pollut. 2019, 255, 113136. [Google Scholar] [CrossRef]
  12. Javed, W.; Guo, B. Performance Evaluation of Real-time DustTrak Monitors for Outdoor Particulate Mass Measurements in a Desert Environment. Aerosol Air Qual. Res. 2021, 21, 200631. [Google Scholar] [CrossRef]
  13. Wang, Z.; Calderón, L.; Patton, A.P.; Sorensen Allacci, M.; Senick, J.; Wener, R.; Andrews, C.J.; Mainelis, G. Comparison of real-time instruments and gravimetric method when measuring particulate matter in a residential building. J. Air Waste Manag. Assoc. 2016, 66, 1109–1120. [Google Scholar] [CrossRef] [PubMed]
  14. Wang, W.-C.V.; Lung, S.-C.C.; Liu, C.-H.; Wen, T.-Y.J.; Hu, S.-C.; Chen, L.-J. Evaluation and Application of a Novel Low-Cost Wearable Sensing Device in Assessing Real-Time PM2.5 Exposure in Major Asian Transportation Modes. Atmosphere 2021, 12, 270. [Google Scholar] [CrossRef]
  15. Gao, M.; Cao, J.; Seto, E. A distributed network of low-cost continuous reading sensors to measure spatiotemporal variations of PM2.5 in Xi’an, China. Environ. Pollut. 2015, 199, 56–65. [Google Scholar] [CrossRef]
  16. Lung, S.-C.C.; Thi Hien, T.; Cambaliza, M.O.L.; Hlaing, O.M.; Oanh, N.T.; Latif, M.T.; Lestari, P.; Salam, A.; Lee, S.-Y.; Wang, W.-C.V.; et al. Research Priorities of Applying Low-Cost PM2.5 Sensors in Southeast Asian Countries. Int. J. Environ. Res. Public Health 2022, 19, 1522. [Google Scholar] [CrossRef] [PubMed]
  17. Chen, L.-J.; Ho, Y.-H.; Lee, H.-C.; Wu, H.-C.; Liu, H.-M.; Hsieh, H.-H.; Huang, Y.-T.; Lung, S.-C.C. An Open Framework for Participatory PM2.5 Monitoring in Smart Cities. IEEE Access 2017, 5, 14441–14454. [Google Scholar] [CrossRef]
  18. Lung, S.-C.C.; Wang, W.-C.V.; Wen, T.-Y.J.; Liu, C.-H.; Hu, S.-C. A versatile low-cost sensing device for assessing PM2.5 spatiotemporal variation and quantifying source contribution. Sci. Total Environ. 2020, 716, 137145. [Google Scholar] [CrossRef]
  19. Pant, P.; Huynh, W.; Peltier, R.E. Exposure to air pollutants in Vietnam: Assessing potential risk for tourists. J. Environ. Sci. 2018, 73, 147–154. [Google Scholar] [CrossRef]
  20. Vo, T.L.H.; Truong, T.T.; Dao, V.P.; Nguyen, T.T.H.; Ly, B.T. Personal exposure assessment of fine particulate matter for commuters in Hanoi. TNU J. Sci. Technol. 2021, 226, 48–56. [Google Scholar]
  21. Saksena, S.; Quang, T.N.; Nguyen, T.; Dang, P.N.; Flachsbart, P. Commuters’ exposure to particulate matter and carbon monoxide in Hanoi, Vietnam. Transp. Res. Part D Transp. Environ. 2008, 13, 206–211. [Google Scholar] [CrossRef]
  22. Quang, T.N.; Hue, N.T.; Dat, M.V.; Tran, L.K.; Phi, T.H.; Morawska, L.; Thai, P.K. Motorcyclists have much higher exposure to black carbon compared to other commuters in traffic of Hanoi, Vietnam. Atmos. Environ. 2021, 245, 118029. [Google Scholar] [CrossRef]
  23. Shao, L.; Cao, Y.; Jones, T.; Santosh, M.; Silva, L.F.O.; Ge, S.; da Boit, K.; Feng, X.; Zhang, M.; BéruBé, K. COVID-19 mortality and exposure to airborne PM2.5: A lag time correlation. Sci. Total Environ. 2022, 806, 151286. [Google Scholar] [CrossRef] [PubMed]
  24. Ali, S.M.; Malik, F.; Anjum, M.S.; Siddiqui, G.F.; Anwar, M.N.; Lam, S.S.; Nizami, A.-S.; Khokhar, M.F. Exploring the linkage between PM2.5 levels and COVID-19 spread and its implications for socio-economic circles. Environ. Res. 2021, 193, 110421. [Google Scholar] [CrossRef] [PubMed]
  25. Munir, M.M.; Adrian, M.; Saputra, C.; Lestari, P. Utilizing Low-cost Mobile Monitoring to Estimate the PM2.5 Inhaled Dose in Urban Environment. Aerosol Air Qual. Res. 2022, 22, 220079. [Google Scholar] [CrossRef]
  26. U.S. EPA. Exposure Factors Handbook 2011 Edition (Final Report); U.S. Environmental Protection Agency: Washington, DC, USA, 2011; Chapter 6.
  27. Zhang, J.; Marto, J.P.; Schwab, J.J. Exploring the applicability and limitations of selected optical scattering instruments for PM mass measurement. Atmos. Meas. Technol. 2018, 11, 2995–3005. [Google Scholar] [CrossRef]
  28. Sm, S.N.; Reddy Yasa, P.; Mv, N.; Khadirnaikar, S.; Pooja, R. Mobile monitoring of air pollution using low cost sensors to visualize spatio-temporal variation of pollutants at urban hotspots. Sustain. Cities Soc. 2019, 44, 520–535. [Google Scholar] [CrossRef]
  29. Liu, Y.; Zhong, H.; Liu, K.; Oliver Gao, H.; He, L.; Xu, R.; Ding, H.; Huang, W. Assessment of personal exposure to PM for multiple transportation modes. Transp. Res. Part D Transp. Environ. 2021, 101, 103086. [Google Scholar] [CrossRef]
  30. Sinaga, D.; Setyawati, W.; Cheng, F.Y.; Lung, S.-C.C. Investigation on daily exposure to PM2.5 in Bandung city, Indonesia using low-cost sensor. J. Expo. Sci. Environ. Epidemiol. 2020, 30, 1001–1012. [Google Scholar] [CrossRef]
  31. Tsai, D.-H.; Wu, Y.-H.; Chan, C.-C. Comparisons of commuter’s exposure to particulate matters while using different transportation modes. Sci. Total Environ. 2008, 405, 71–77. [Google Scholar] [CrossRef]
  32. Hien, T.T.; Chi, N.D.T.; Nguyen, N.T.; Vinh, L.X.; Takenaka, N.; Huy, D.H. Current Status of Fine Particulate Matter (PM2.5) in Vietnam’s Most Populous City, Ho Chi Minh City. Aerosol Air Qual. Res. 2019, 19, 2239–2251. [Google Scholar] [CrossRef]
  33. Gao, C.; Zhang, F.; Fang, D.; Wang, Q.; Liu, M. Spatial characteristics of change trends of air pollutants in Chinese urban areas during 2016–2020: The impact of air pollution controls and the COVID-19 pandemic. Atmos. Res. 2023, 283, 106539. [Google Scholar] [CrossRef] [PubMed]
  34. Sulaymon, I.D.; Zhang, Y.; Hopke, P.K.; Zhang, Y.; Hua, J.; Mei, X. COVID-19 pandemic in Wuhan: Ambient air quality and the relationships between criteria air pollutants and meteorological variables before, during, and after lockdown. Atmos. Res. 2021, 250, 105362. [Google Scholar] [CrossRef] [PubMed]
  35. Benchrif, A.; Wheida, A.; Tahri, M.; Shubbar, R.M.; Biswas, B. Air quality during three covid-19 lockdown phases: AQI, PM2.5 and NO2 assessment in cities with more than 1 million inhabitants. Sustain. Cities Soc. 2021, 74, 103170. [Google Scholar] [CrossRef]
  36. Yang, K.; Wu, C.; Luo, Y. The impact of COVID-19 on urban PM2.5—Taking Hubei Province as an example. Environ. Pollut. 2022, 294, 118633. [Google Scholar] [CrossRef]
  37. Ghosal, R.; Saha, E. Impact of the COVID-19 induced lockdown measures on PM2.5 concentration in USA. Atmos. Environ. 2021, 254, 118388. [Google Scholar] [CrossRef]
  38. de Angelis, E.; Renzetti, S.; Volta, M.; Donato, F.; Calza, S.; Placidi, D.; Lucchini, R.G.; Rota, M. COVID-19 incidence and mortality in Lombardy, Italy: An ecological study on the role of air pollution, meteorological factors, demographic and socioeconomic variables. Environ. Res. 2021, 195, 110777. [Google Scholar] [CrossRef]
  39. Chakrabarty, R.K.; Beeler, P.; Liu, P.; Goswami, S.; Harvey, R.D.; Pervez, S.; van Donkelaar, A.; Martin, R.V. Ambient PM2.5 exposure and rapid spread of COVID-19 in the United States. Sci. Total Environ. 2021, 760, 143391. [Google Scholar] [CrossRef]
  40. Sahu, S.K.; Mangaraj, P.; Beig, G.; Tyagi, B.; Tikle, S.; Vinoj, V. Establishing a link between fine particulate matter (PM2.5) zones and COVID-19 over India based on anthropogenic emission sources and air quality data. Urban Clim. 2021, 38, 100883. [Google Scholar] [CrossRef]
  41. Vuong, L.N.; Huynh, N.; Ngo, D.Q.; Nguyen, V.N.; Duong, K.D.; Tran, N.N.; Le, T.P.; Nguyen, N.A.; Doan, T.T.P.; Pham, D.L.; et al. A Community-Based Model of Care During the Fourth Wave of the COVID-19 Outbreak in Ho Chi Minh City, Vietnam. Front. Artif. Intell. 2022, 5, 831841. [Google Scholar] [CrossRef]
  42. Ho, T.H.; van Dang, C.; Pham, T.T.B.; Thi Hien, T.; Wangwongwatana, S. Ambient particulate matter (PM2.5) and adverse birth outcomes in Ho Chi Minh City, Vietnam. Hyg. Environ. Health Adv. 2023, 5, 100049. [Google Scholar] [CrossRef]
  43. Manojkumar, N.; Monishraj, M.; Srimuruganandam, B. Commuter exposure concentrations and inhalation doses in traffic and residential routes of Vellore city, India. Atmos. Pollut. Res. 2021, 12, 219–230. [Google Scholar] [CrossRef]
  44. Al-sareji, O.J.; Grmasha, R.A.; Hashim, K.S.; Salman, J.M.; Al-Juboori, R.A. Personal exposure and inhalation doses to PM1 and PM2.5 pollution in Iraq: An examination of four transport modes. Build. Environ. 2022, 212, 108847. [Google Scholar] [CrossRef]
  45. Huang, J.; Deng, F.; Wu, S.; Guo, X. Comparisons of personal exposure to PM2.5 and CO by different commuting modes in Beijing, China. Sci. Total Environ. 2012, 425, 52–59. [Google Scholar] [CrossRef] [PubMed]
  46. Li, B.; Lei, X.-N.; Xiu, G.-L.; Gao, C.-Y.; Gao, S.; Qian, N.-S. Personal exposure to black carbon during commuting in peak and off-peak hours in Shanghai. Sci. Total Environ. 2015, 524–525, 237–245. [Google Scholar] [CrossRef]
  47. Shen, J.; Gao, Z. Commuter exposure to particulate matters in four common transportation modes in Nanjing. Build. Environ. 2019, 156, 156–170. [Google Scholar] [CrossRef]
  48. Zuurbier, M.; Hoek, G.; Oldenwening, M.; Lenters, V.; Meliefste, K.; Hazel, P.v.d.; Brunekreef, B. Commuters’ Exposure to Particulate Matter Air Pollution Is Affected by Mode of Transport, Fuel Type, and Route. Environ. Health Perspect. 2010, 118, 783–789. [Google Scholar] [CrossRef]
  49. Kolluru, S.S.R.; Patra, A.K.; Dubey, R.S. In-vehicle PM2.5 personal concentrations in winter during long distance road travel in India. Sci. Total Environ. 2019, 684, 207–220. [Google Scholar] [CrossRef]
  50. Zheng, J.; Qiu, Z.; Gao, H.O.; Li, B. Commuter PM exposure and estimated life-expectancy loss across multiple transportation modes in Xi’an, China. Ecotoxicol. Environ. Saf. 2021, 214, 112117. [Google Scholar] [CrossRef]
  51. Boniardi, L.; Borghi, F.; Straccini, S.; Fanti, G.; Campagnolo, D.; Campo, L.; Olgiati, L.; Lioi, S.; Cattaneo, A.; Spinazzè, A.; et al. Commuting by car, public transport, and bike: Exposure assessment and estimation of the inhaled dose of multiple airborne pollutants. Atmos. Environ. 2021, 262, 118613. [Google Scholar] [CrossRef]
  52. Velasco, E.; Retama, A.; Segovia, E.; Ramos, R. Particle exposure and inhaled dose while commuting by public transport in Mexico City. Atmos. Environ. 2019, 219, 117044. [Google Scholar] [CrossRef]
  53. Tan, S.H.; Roth, M.; Velasco, E. Particle exposure and inhaled dose during commuting in Singapore. Atmos. Environ. 2017, 170, 245–258. [Google Scholar] [CrossRef]
Figure 1. Maps of the study area (red rectangle), sampling route (blue arrows), and fix station (green star) used for estimating PM2.5 and PM1 exposure when using different types of transportation modes in urban Ho Chi Minh City.
Atmosphere 14 01504 g001
Figure 2. Linear correlation between data from DustTrak and concentrations of PM2.5 (a) and PM1 (b) measured by the gravimetric method.
Atmosphere 14 01504 g002
Figure 3. Two-segment linear regression of the signals from AS-LUNG-P sensors with the corrected DustTrak concentrations of PM2.5 (a) and PM1 (b).
Atmosphere 14 01504 g003
Figure 4. PM2.5 exposure normalized (colored circles) against that at the fixed stations for bicyclists (a), car commuters (b), motorcyclists (c), and pedestrians (d) in transportation microenvironments in the center of HCM in the morning. The PM2.5 concentration normalization at the fixed station (square) is equal to 1.
Atmosphere 14 01504 g004
Figure 5. PM2.5 exposure normalized (colored circles) against that at the fixed stations for bicyclists (a), car commuters (b), motorcyclists (c), and pedestrians (d) in transportation microenvironments in the center of HCM in the afternoon. The PM2.5 concentration normalization at the fixed station (square) is equal to 1.
Atmosphere 14 01504 g005
Figure 6. Inhaled dose of PM2.5 for each transportation microenvironment for males and females (aged 18 to 30 years) in urban HCM.
Atmosphere 14 01504 g006
Table 1. Two-segment linear regression of the four AS-LUNG-P sensors deployed in this study. Sensors 1, 2, 3, and 4 were used to estimate PM exposure for bicyclists, motorcyclists, car commuters, and pedestrians, respectively.
First SegmentBreakpointSecond SegmentBias
Sensor 1PM2.50.72x + 7.5141.41.51x − 25.100.10 ± 0.10
PM10.59x + 2.6920.71.24x − 10.970.08 ± 0.09
Sensor 2PM2.50.60x + 8.9637.71.18x − 12.900.14 ± 0.06
PM10.54x + 2.3118.91.16x − 9.410.09 ± 0.10
Sensor 3PM2.50.63x + 8.6538.41.31x − 17.320.13 ± 0.10
PM10.59x + 2.4018.91.29x − 10.770.07 ± 0.08
Sensor 4PM2.50.65x + 8.0338.71.23x − 14.560.12 ± 0.08
PM10.53x + 2.3219.41.23x − 11.150.09 ± 0.10
Table 2. Exposure concentrations of PM2.5 and PM1 (µg/m3) while traveling using different transportation modes in HCM (mean (bold), range (in parentheses)).
PM2.5PM1
MorningAfternoonMorningAfternoon
Bike33.622.81811
(15.2–79.8)(12.7–41.7)(7–49)(5–23)
Motorbike34.423.72113
(18.3–79.3)(13.1–34.9)(9–56)(5–21)
Car15.512.474
(10.4–25.4)(9.9–19.7)(3–13)(3–10)
Walking33.824.12012
(18.1–74.4)(14.5–36.4)(8–51)(6–22)
Table 3. Spearman correlation among PM2.5, PM1, CO2 concentration, relative humidity, and temperature for bikers.
MorningTRHCO2PM2.5PM1
T1.00 –0.35 −0.210.100.10
RH 1.00 0.200.320.32
CO2 1.000.220.22
PM2.5 1.001.00
PM1 1.00
Afternoon T RH CO2PM2.5PM1
T1.00−0.250.36−0.19−0.19
RH 1.00-0.390.39
CO2 1.000.240.24
PM2.5 1.001.00
PM1 1.00
Table 4. Inhaled PM2.5 dose (µg) of in-vehicle commuters in other cities. This study averaged the inhaled dose of both male and female commuters in the morning trip and afternoon trip.
HCM, Vietnam
(This Study)
Xi’an,
China [50]
Nanjing, China
[47]
Milan, Italy
[51]
Singapore
[53]
Mexico City,
Mexico
[52]
Measurement deviceAS-LUNG-PLaser aerosol spectrometer and dust monitorDustTrak monitorPM—Aerocet 831DustTrak monitorDustTrak monitor
Measurement conditionRainy season, COVID-19 lockdownSummer and winterSummer and winterWinter Spring intermonsoon and southwest monsoonWarm dry season
Cyclist12.928.531.510.1-14.6
Motorcyclist6.7-----
Car user 1.99.04-5.02.45.1
Pedestrian6.6-396.523.122.9
Bus user-11.210.4-3.05.0
Subway user-56.3-264.6
Disclaimer/Publisher’s Note: The statements, opinions and data contained in all publications are solely those of the individual author(s) and contributor(s) and not of MDPI and/or the editor(s). MDPI and/or the editor(s) disclaim responsibility for any injury to people or property resulting from any ideas, methods, instructions or products referred to in the content.

