
Background Characteristics and Influence Analysis of Greenhouse Gases at Jinsha Atmospheric Background Station in China

 and
and 
Abstract
:1. Introduction
2. Materials and Methods
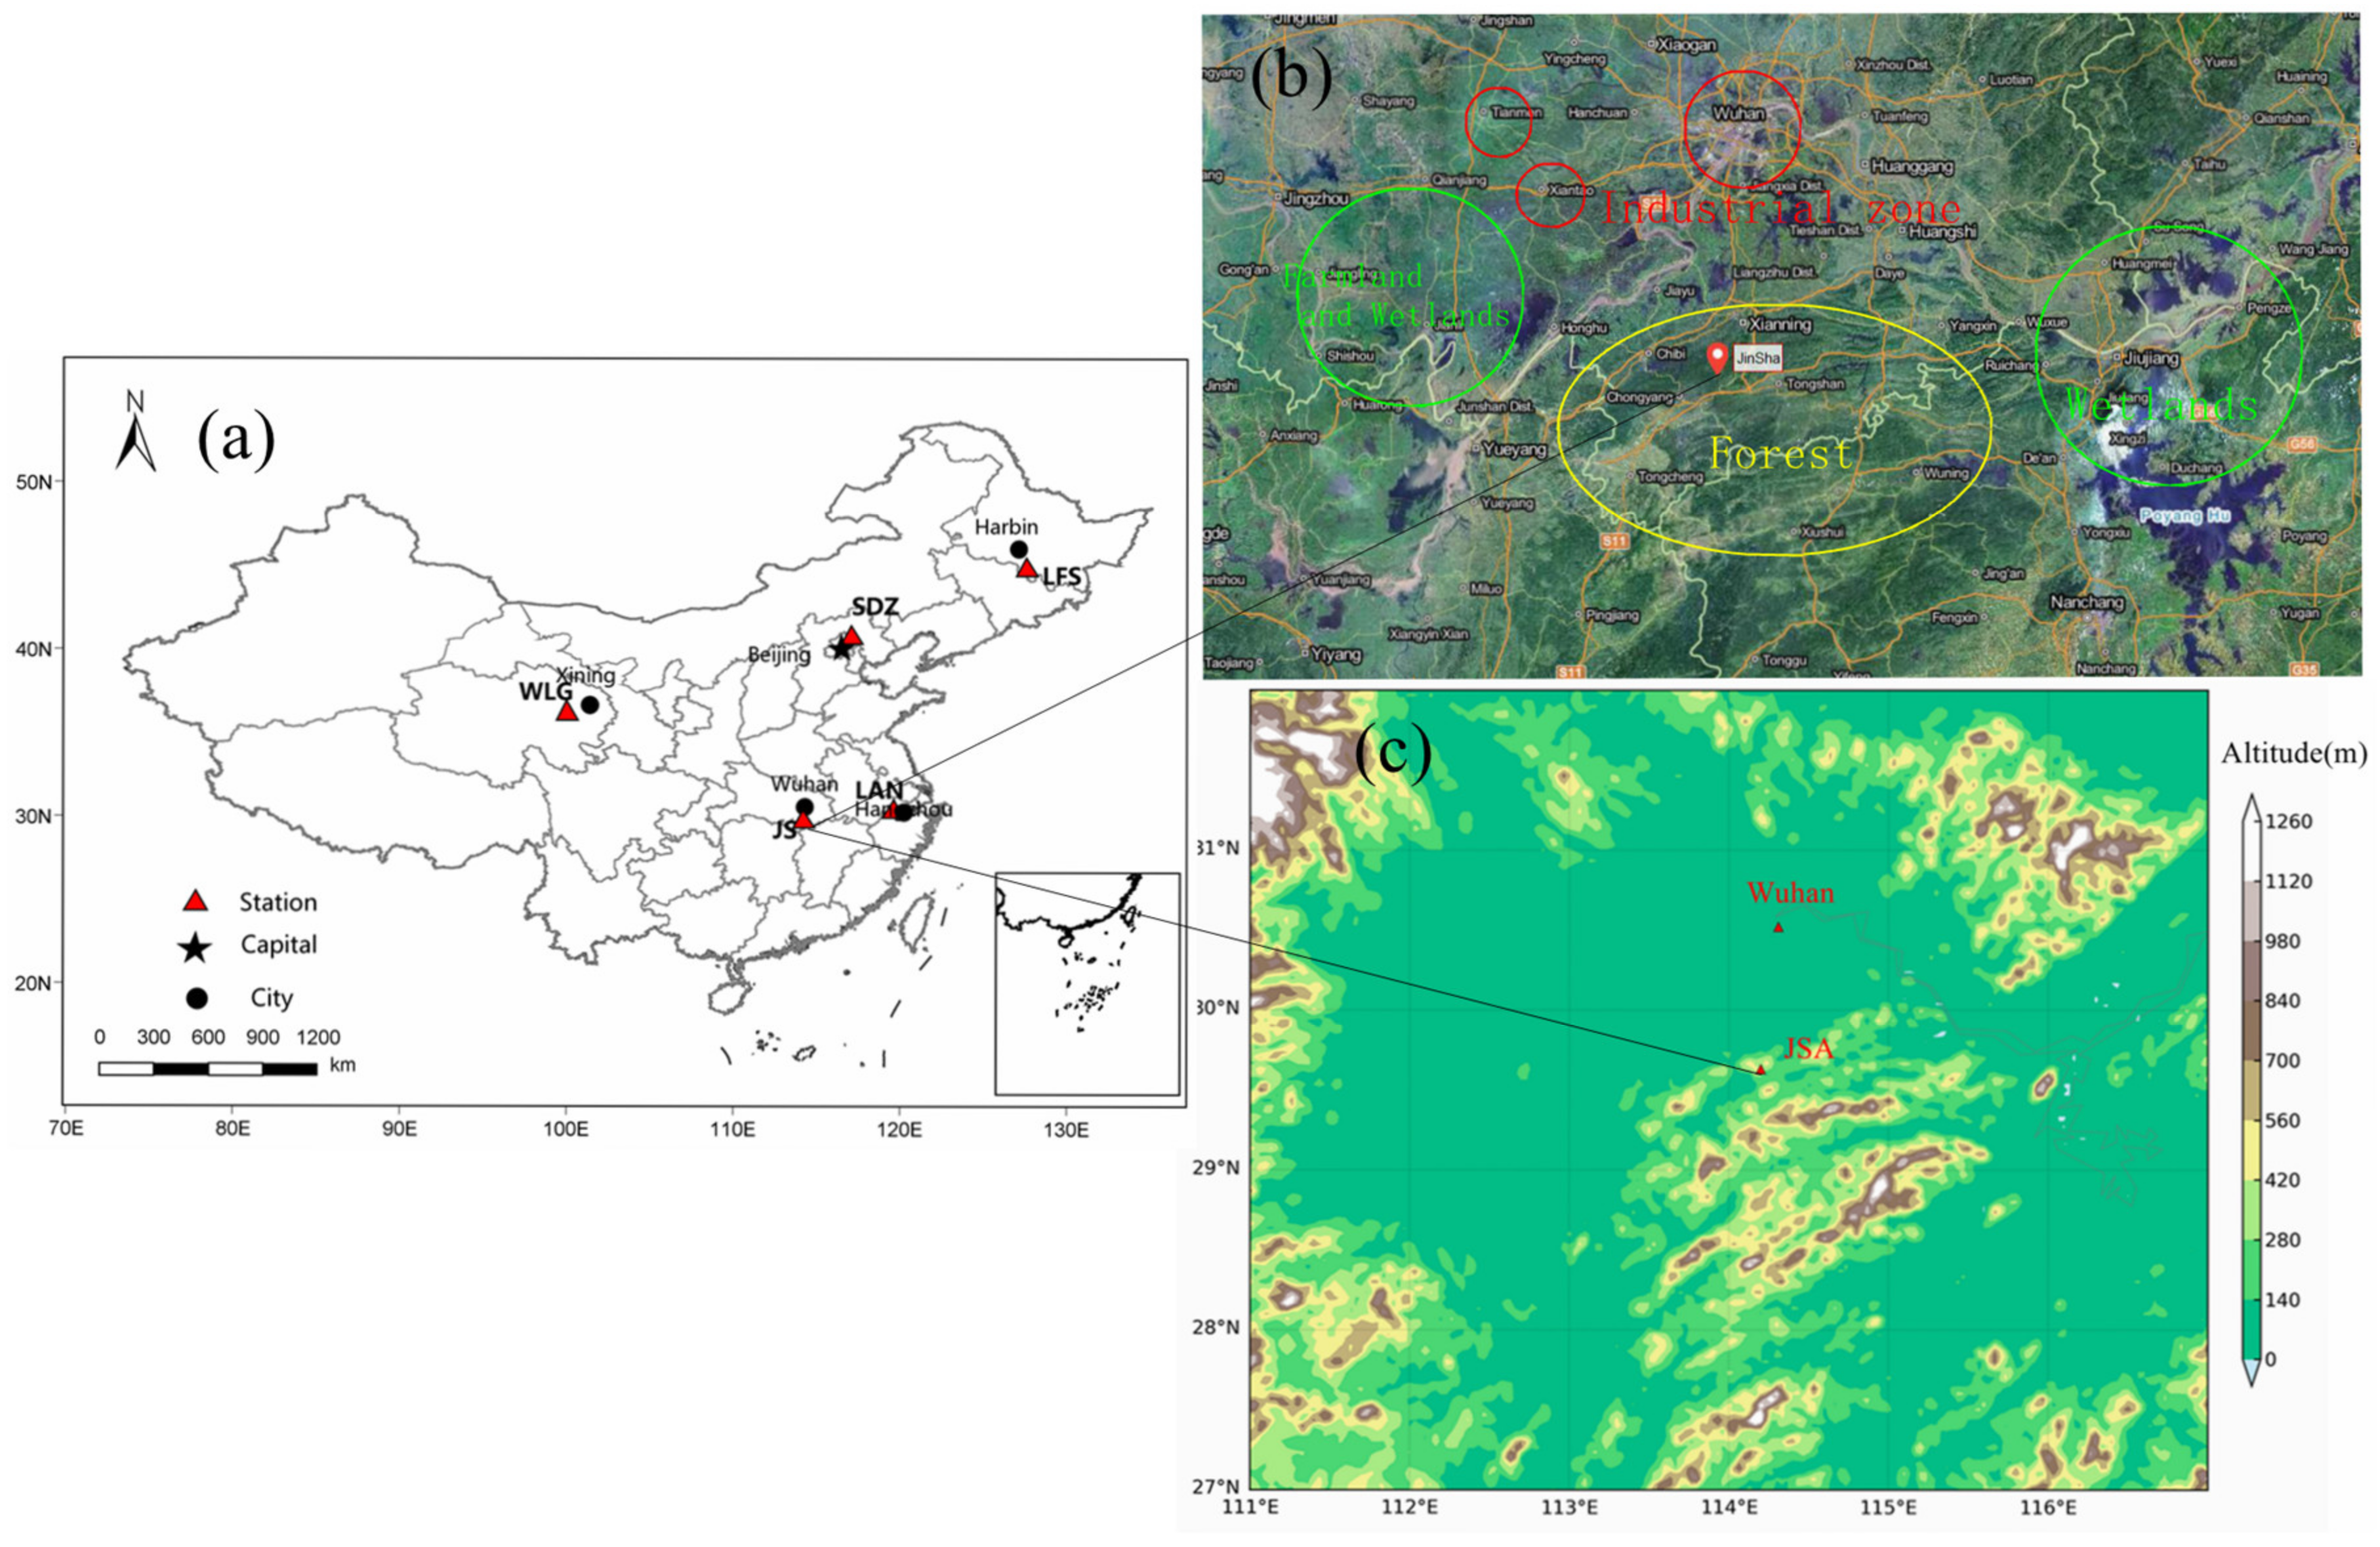
2.1. Sampling Sites
2.2. Measurement System
2.3. Data Processing
3. Results and Discussion
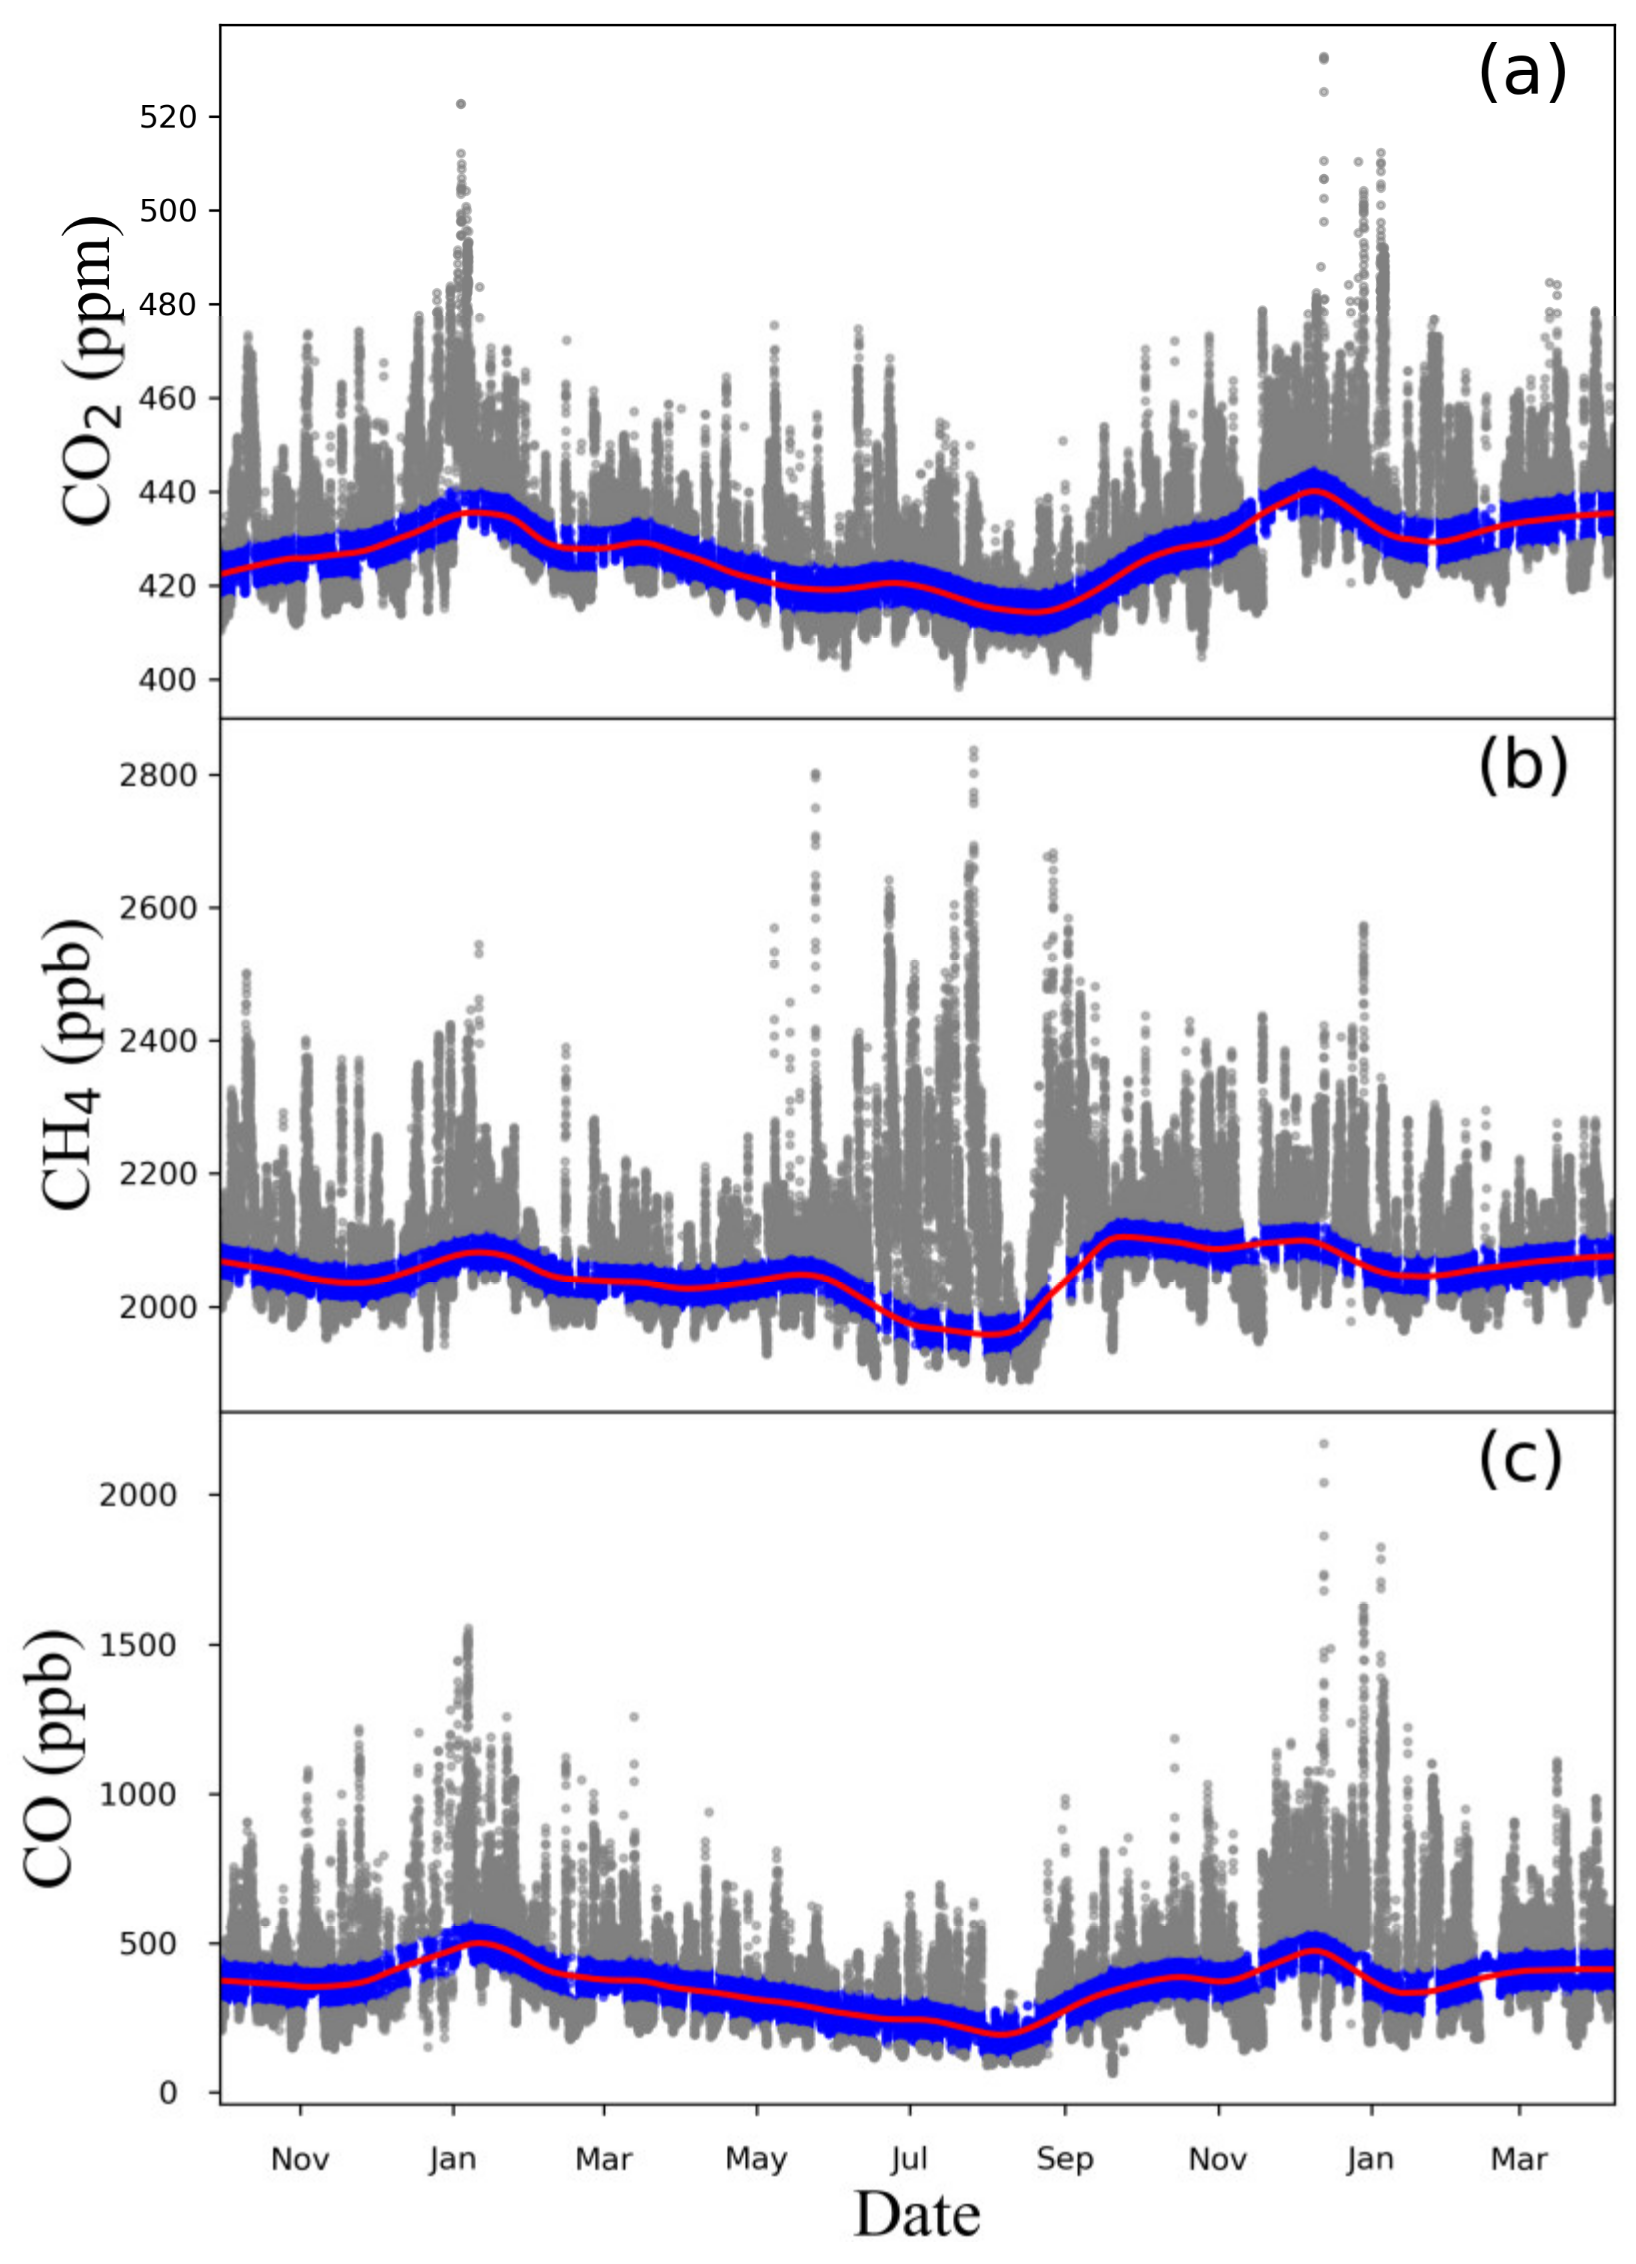
3.1. Filtered Data
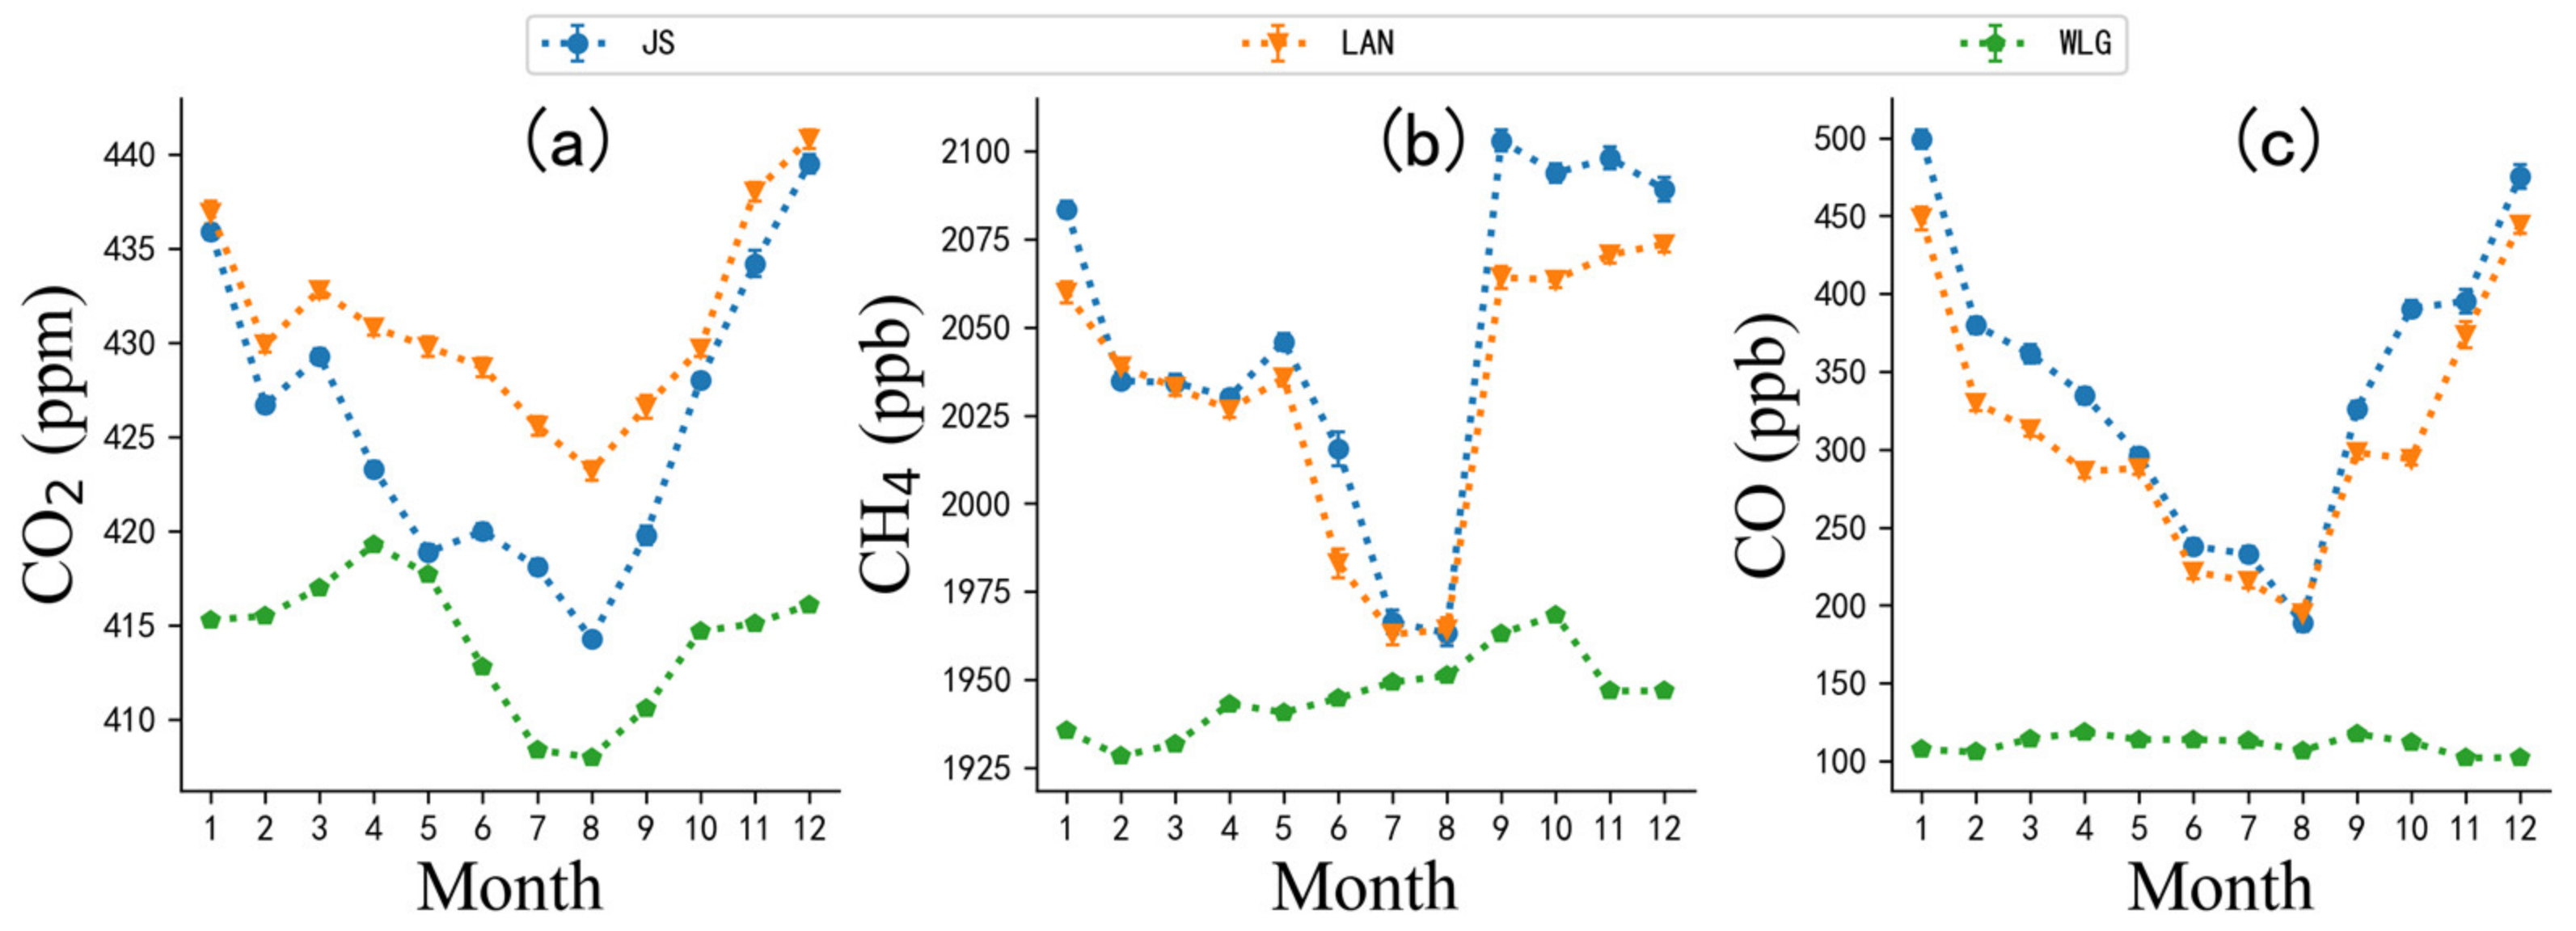
3.2. Seasonal Cycle
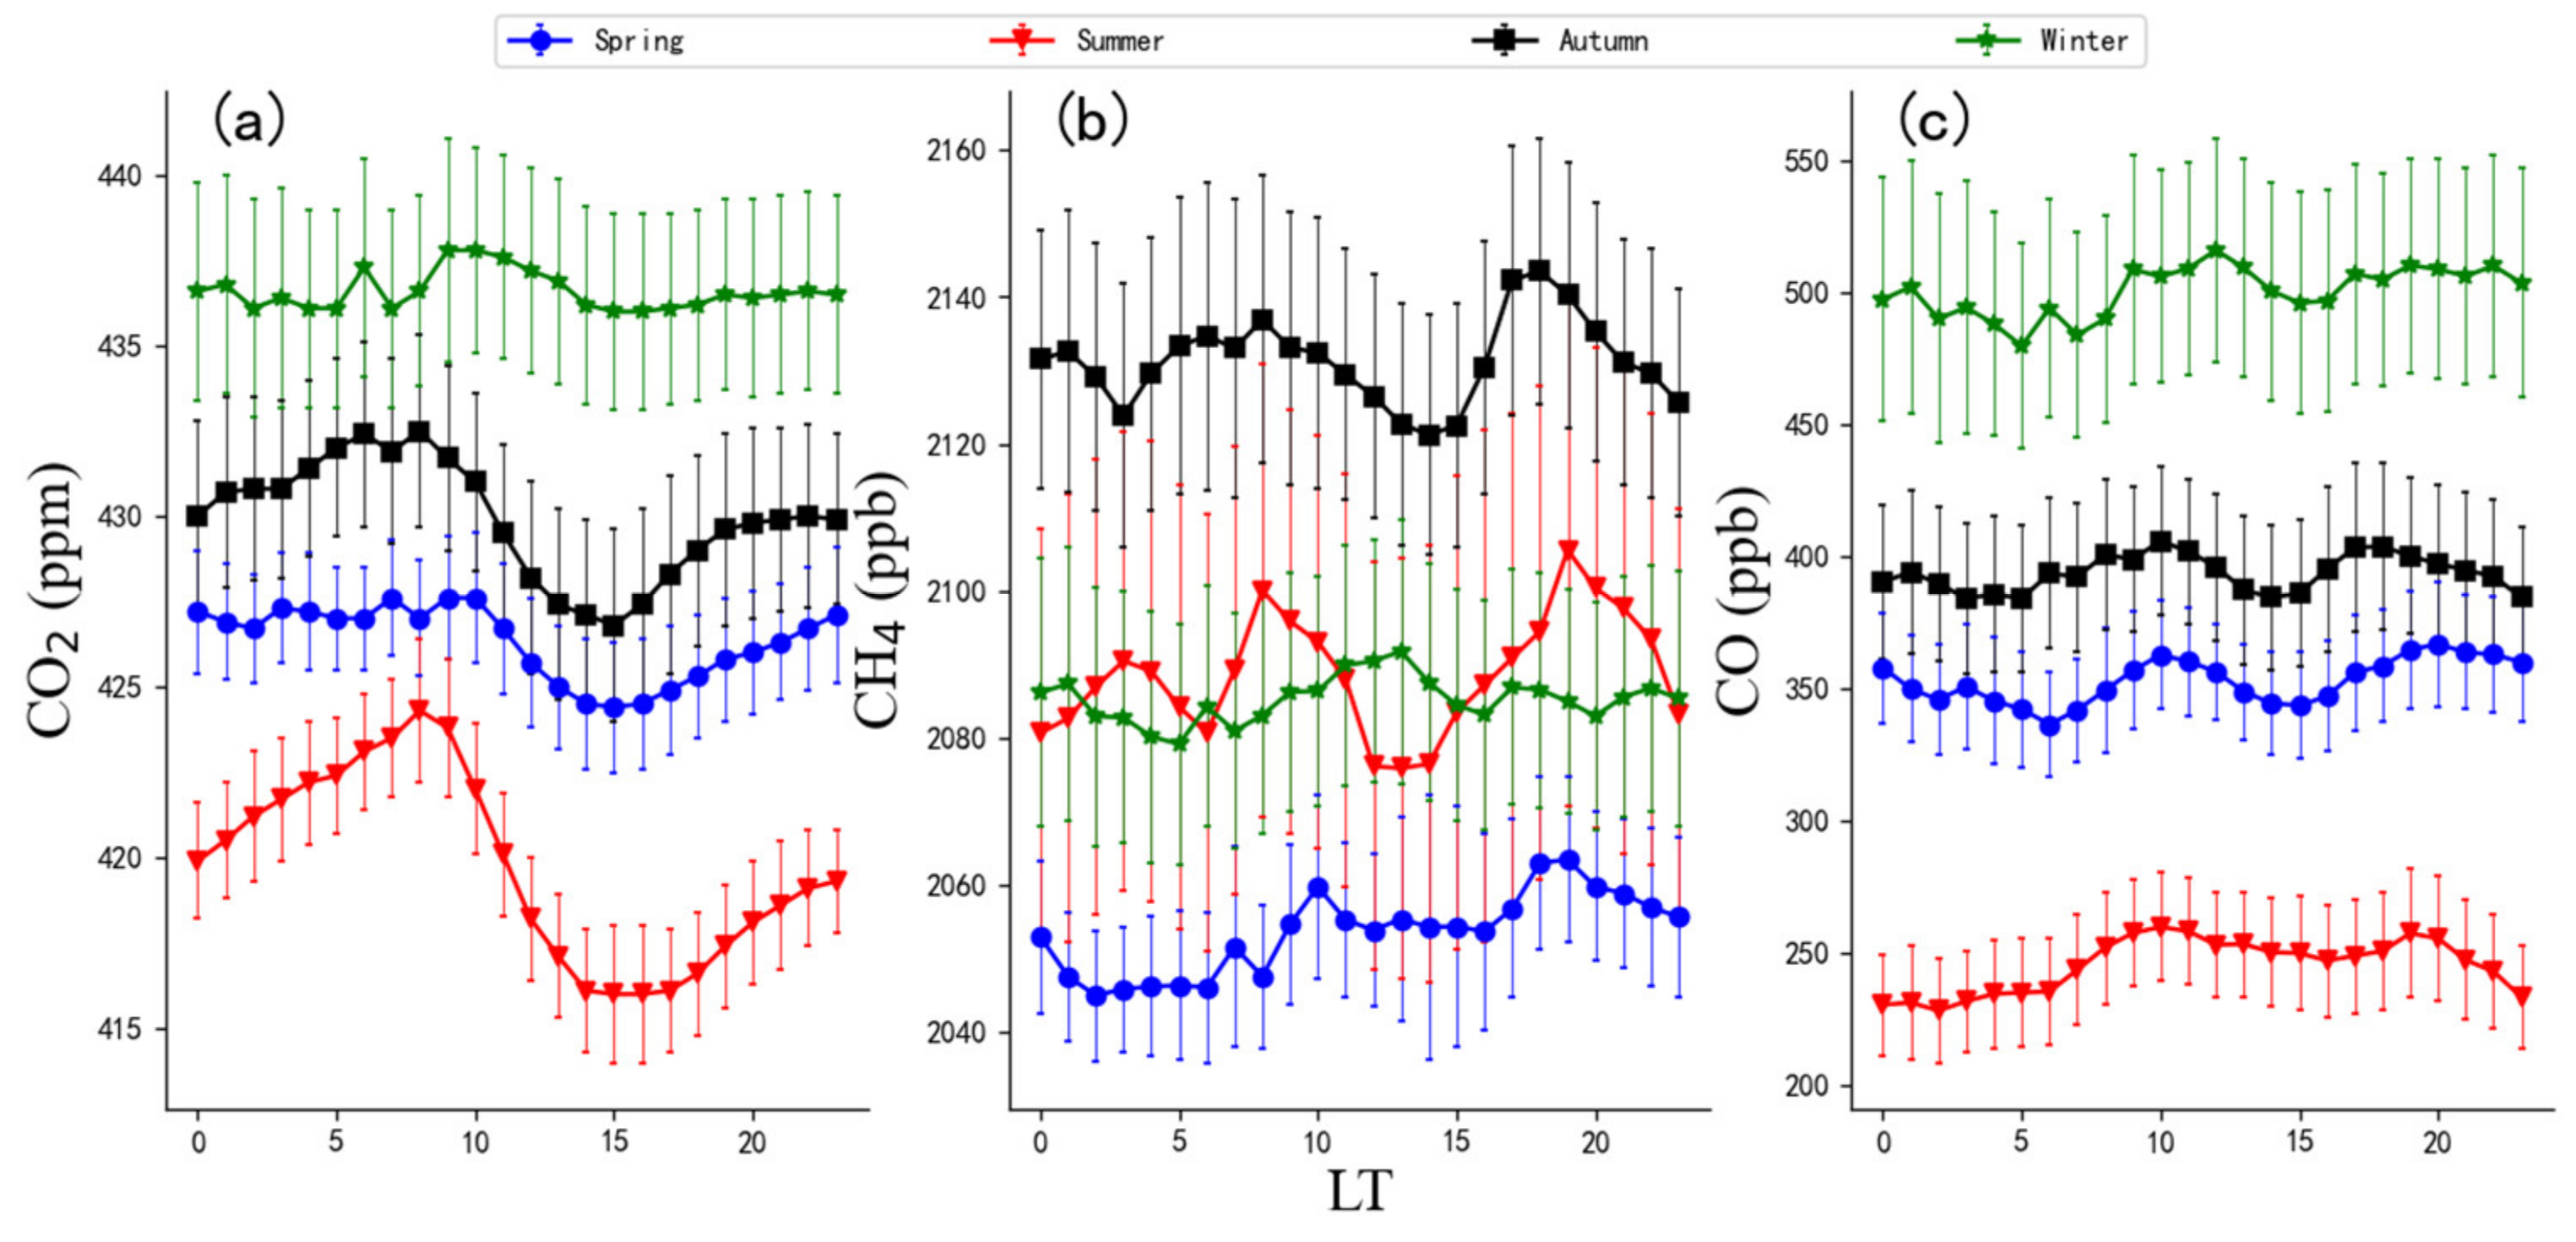
3.3. Average Diurnal Variations
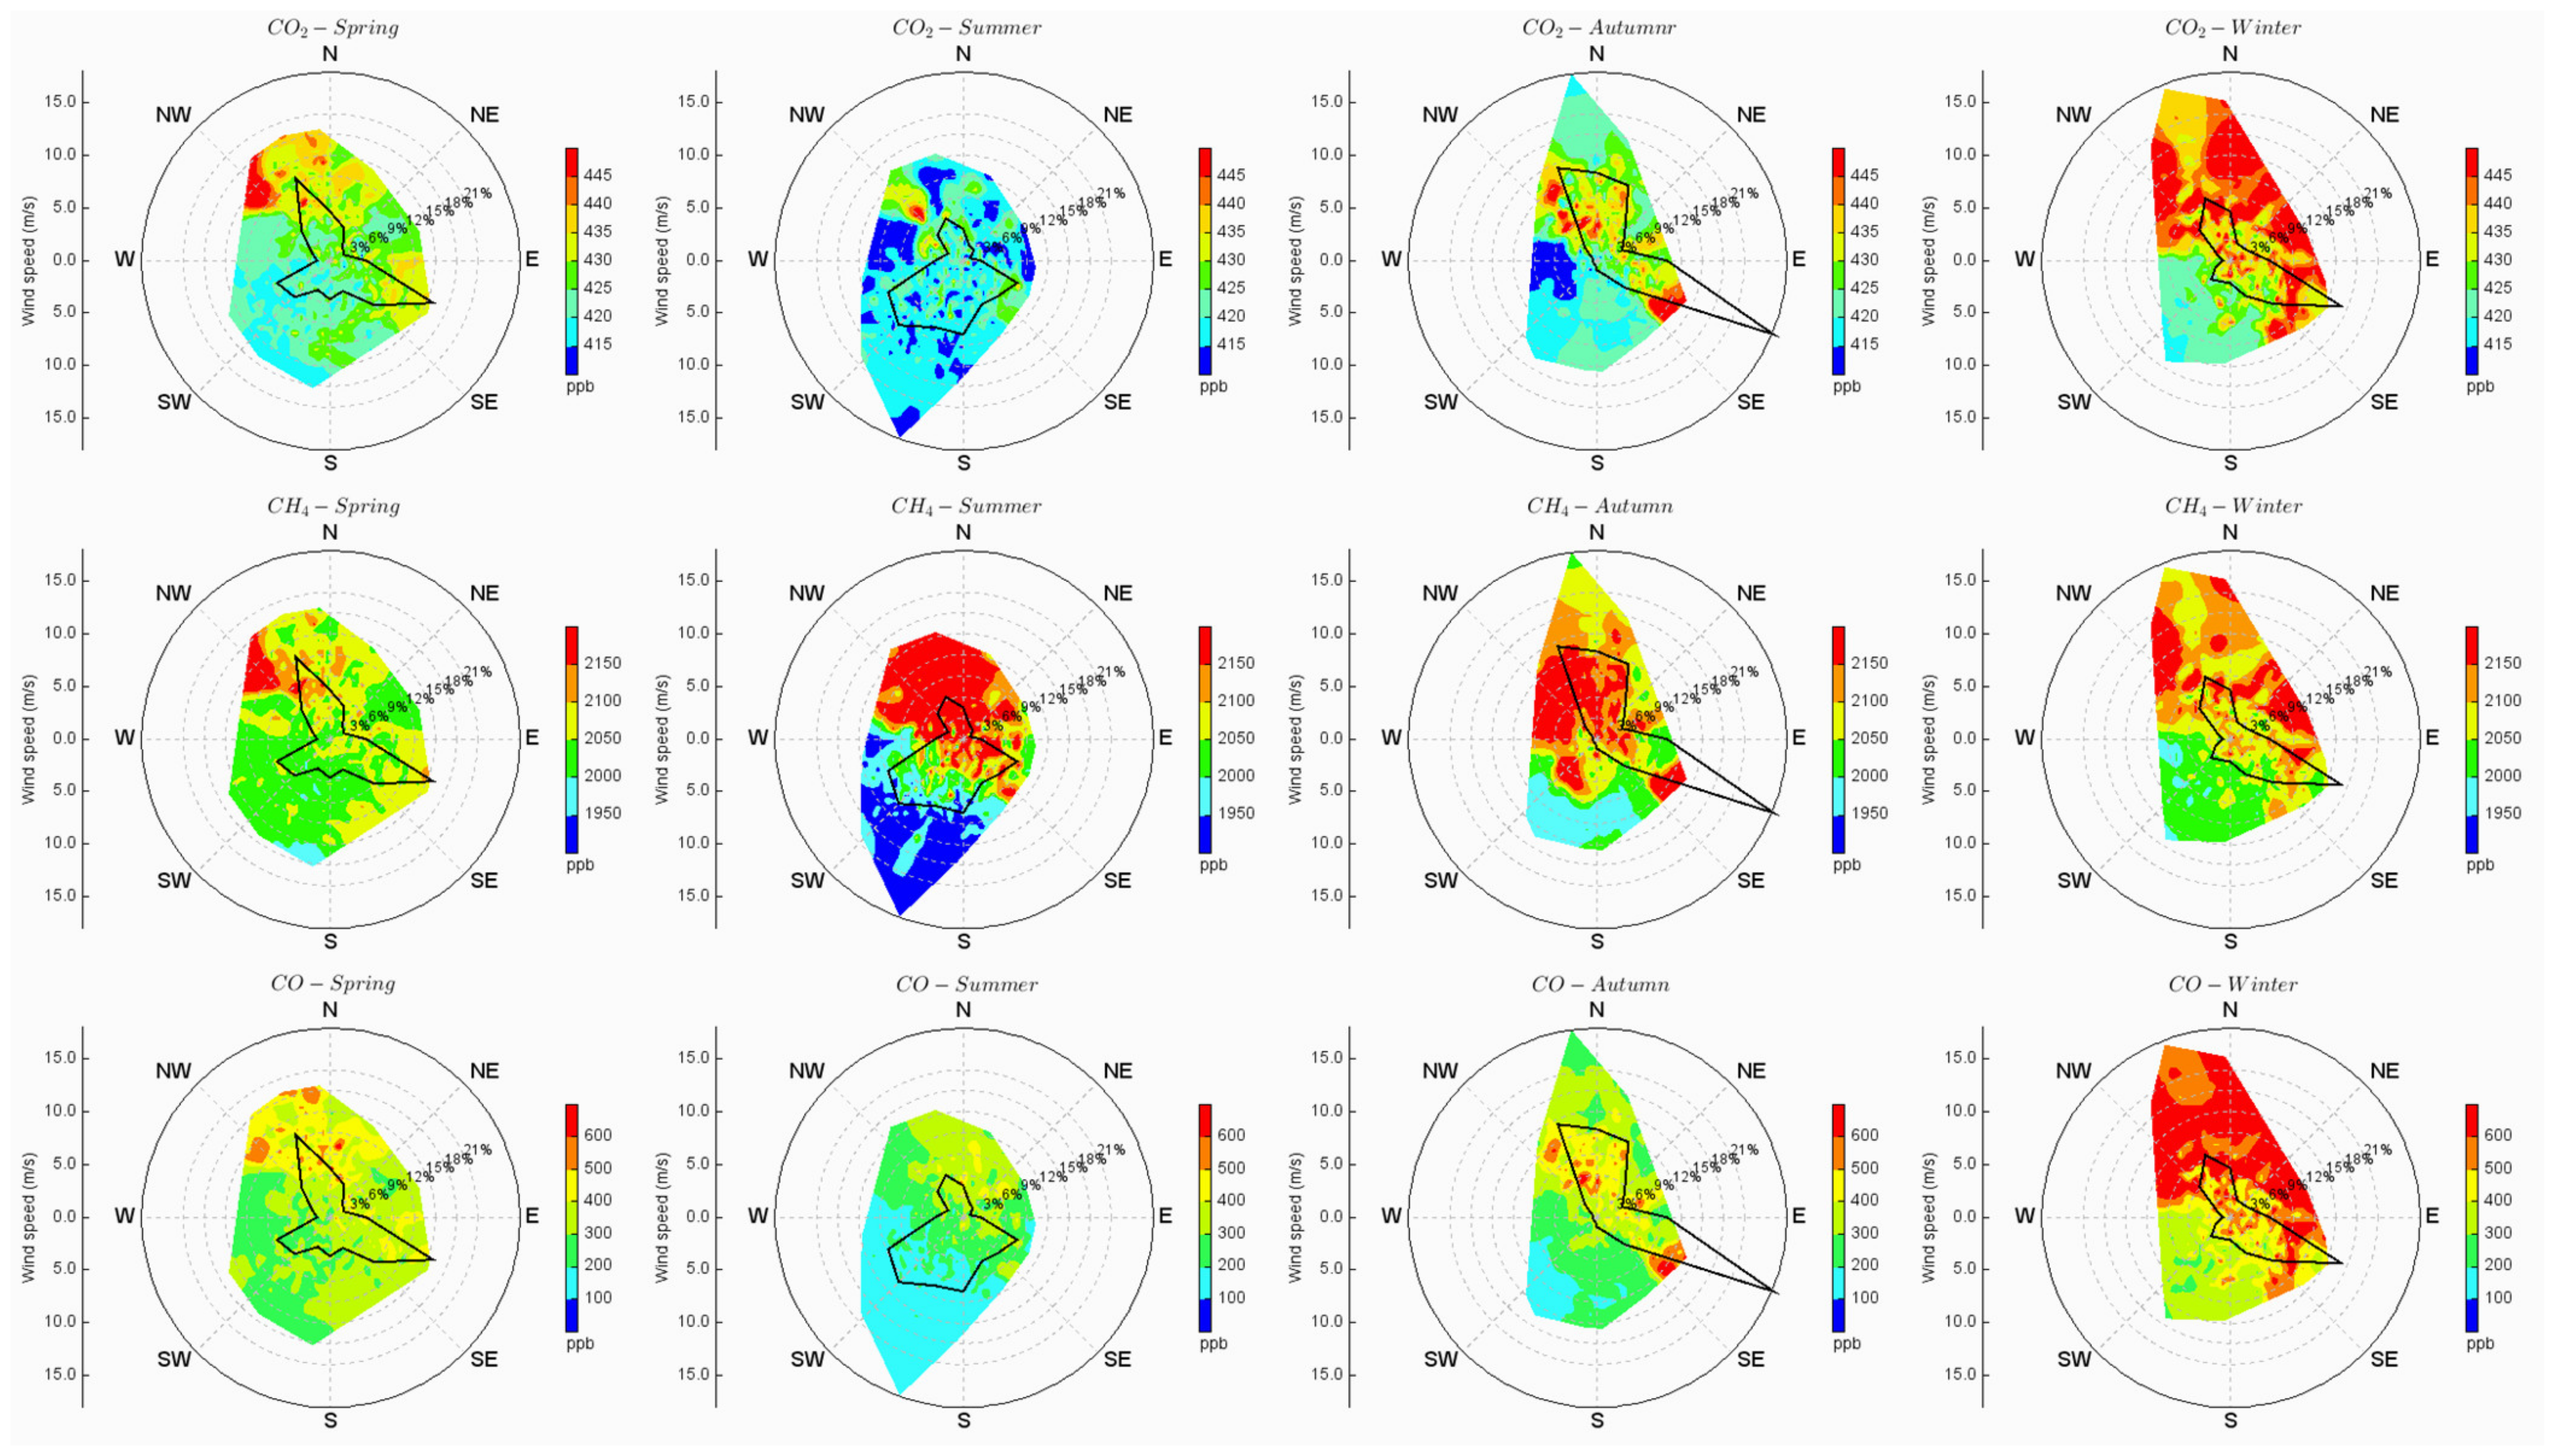
3.4. Impact of Local Surface Wind
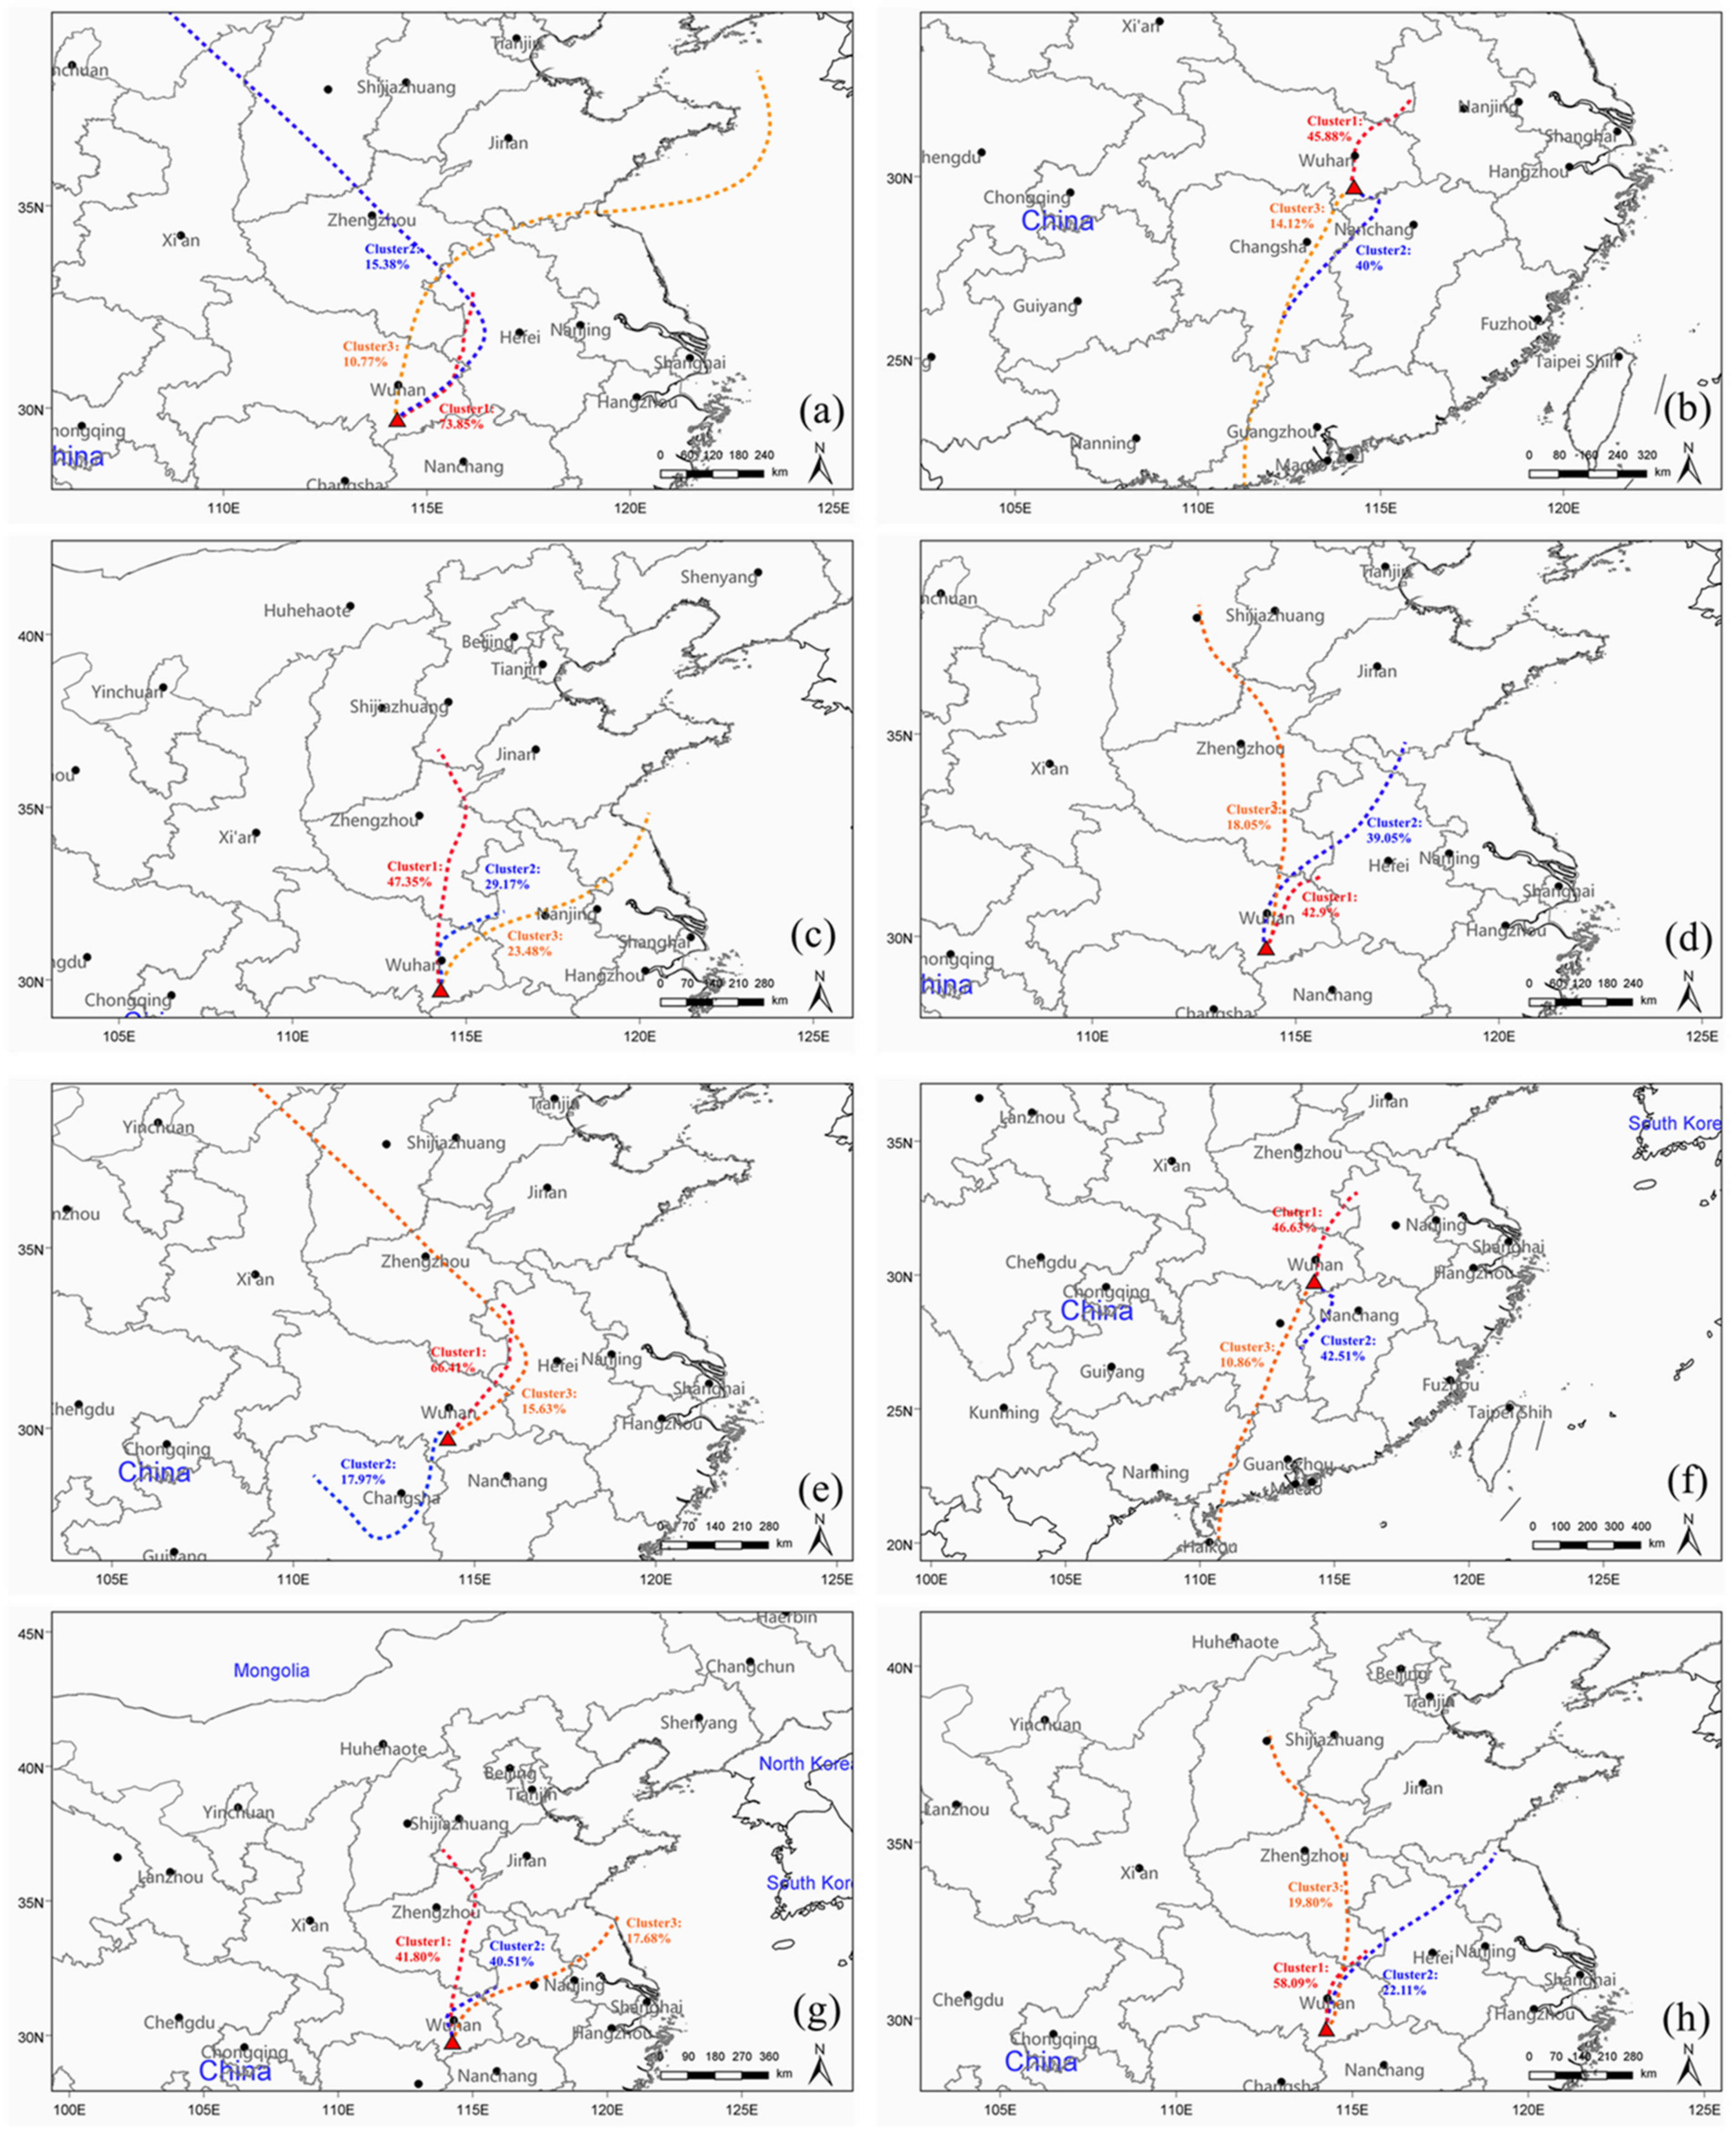
3.5. Effect of Regional Transport
3.6. Effect of Source Regions
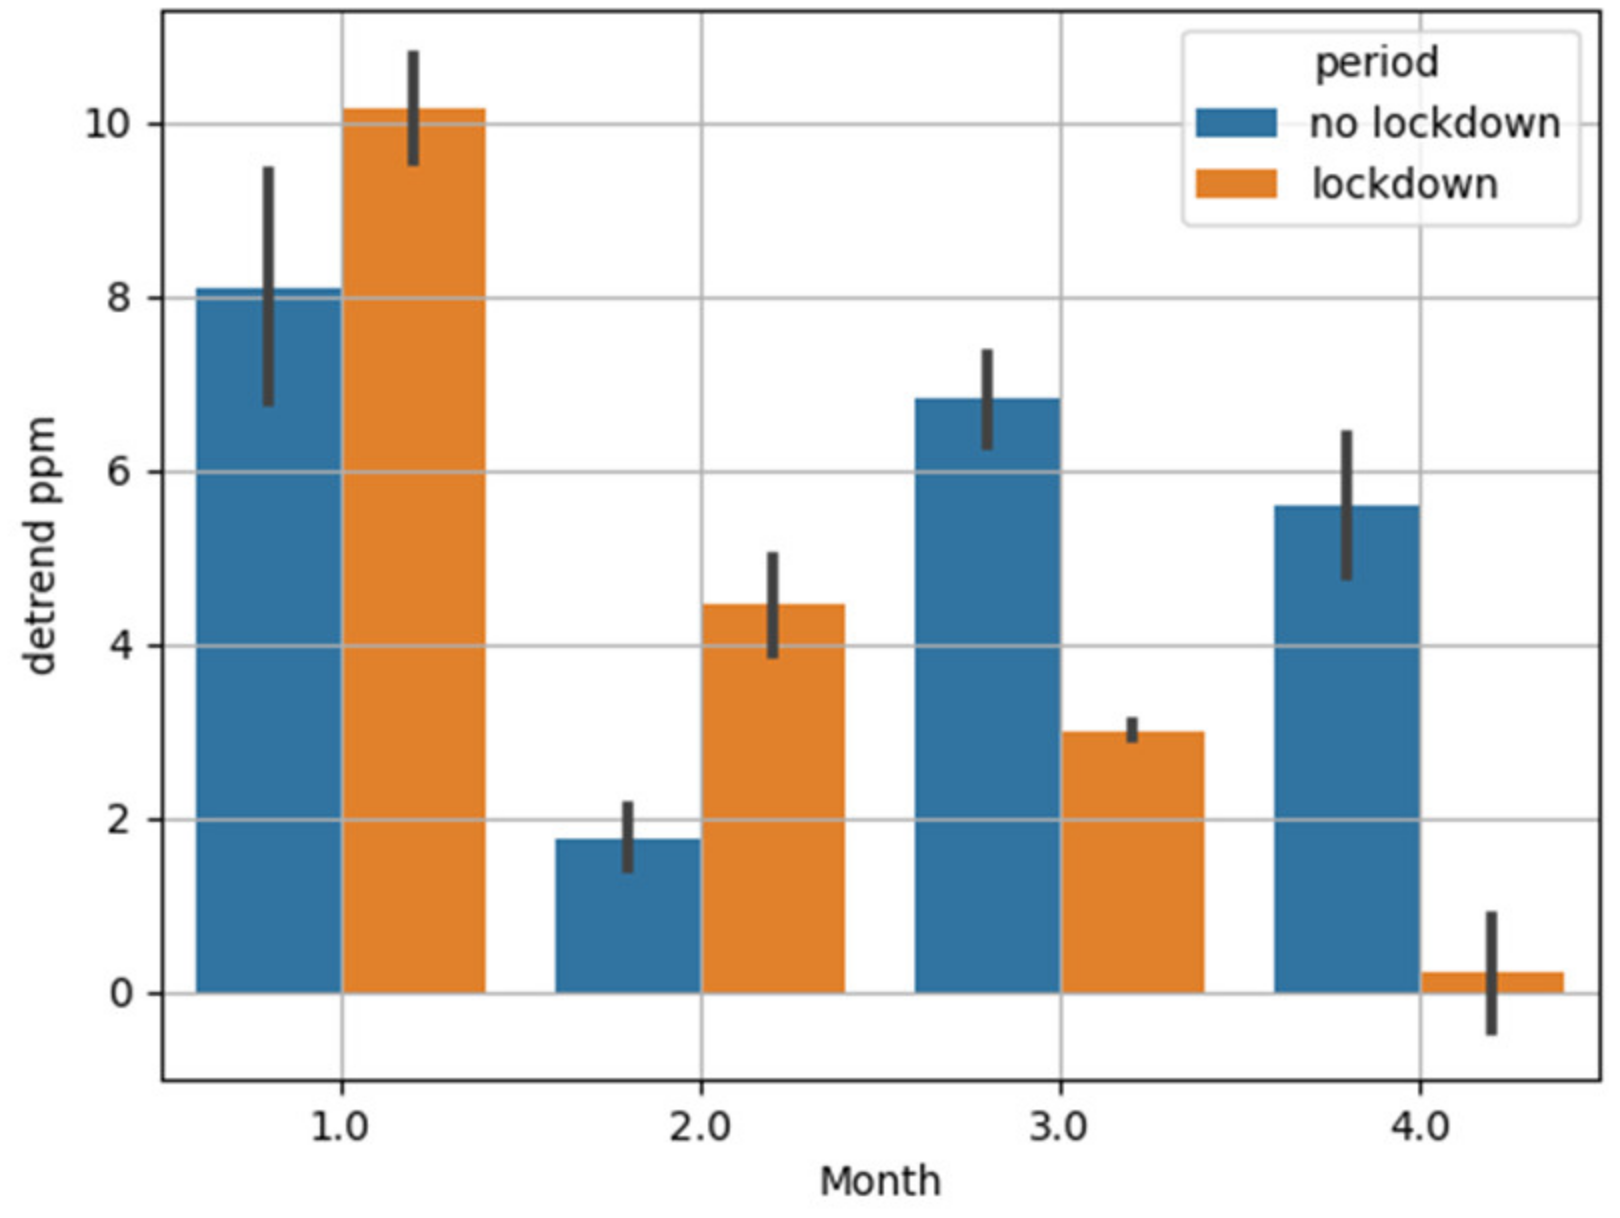
3.7. Effect of COVID-19
4. Conclusions
Author Contributions
Funding
Data Availability Statement
Acknowledgments
Conflicts of Interest
References
- Masson-Delmotte, V.; Zhai, P.; Pirani, A.; Connors, S.L.; Péan, C.; Berger, S.; Caud, N.; Chen, Y.; Goldfarb, L.; Gomis, M. Climate Change 2021: The Physical Science Basis. Contribution of Working Group I to the Sixth Assessment Report of the Intergovernmental Panel on Climate Change; Cambridge University Press: Cambridge, UK, 2021; Volume 2. [Google Scholar]
- Irakulis-Loitxate, I.; Guanter, L.; Liu, Y.-N.; Varon, D.J.; Maasakkers, J.D.; Zhang, Y.; Chulakadabba, A.; Wofsy, S.C.; Thorpe, A.K.; Duren, R.M. Satellite-based survey of extreme methane emissions in the permian basin. Sci. Adv. 2021, 7, eabf4507. [Google Scholar] [CrossRef] [PubMed]
- Zhang, Y.; Gautam, R.; Pandey, S.; Omara, M.; Maasakkers, J.D.; Sadavarte, P.; Lyon, D.; Nesser, H.; Sulprizio, M.P.; Varon, D.J.; et al. Quantifying methane emissions from the largest oil-producing basin in the united states from space. Sci. Adv. 2020, 6, eaaz5120. [Google Scholar] [CrossRef] [PubMed]
- Tarasova, O.; Vermeulen, A.; Sawa, Y.; Houweling, S.; Dlugokencky, E. The state of greenhouse gases in the atmosphere using global observations through 2021. In Proceedings of the Copernicus Meetings 2023, Boston, MA, USA, 8–10 November 2023. [Google Scholar]
- Shi, T.; Han, G.; Ma, X.; Pei, Z.; Chen, W.; Liu, J.; Zhang, X.; Li, S.; Gong, W. Quantifying strong point sources emissions of CO2 using spaceborne lidar: Method development and potential analysis. Energy Convers. Manag. 2023, 292, 117346. [Google Scholar] [CrossRef]
- Zhang, H.; Han, G.; Ma, X.; Chen, W.; Zhang, X.; Liu, J.; Gong, W. Robust algorithm for precise x CO2 retrieval using single observation of ipda lidar. Opt. Express 2023, 31, 11846–11863. [Google Scholar] [CrossRef] [PubMed]
- Eldering, A.; O’Dell, C.W.; Wennberg, P.O.; Crisp, D.; Gunson, M.R.; Viatte, C.; Avis, C.; Braverman, A.; Castano, R.; Chang, A.; et al. The orbiting carbon observatory-2: First 18 months of science data products. Atmos. Meas. Tech. 2017, 10, 549–563. [Google Scholar] [CrossRef]
- Butz, A.; Guerlet, S.; Hasekamp, O.; Schepers, D.; Galli, A.; Aben, I.; Frankenberg, C.; Hartmann, J.M.; Tran, H.; Kuze, A.; et al. Toward accurate CO2 and CH4 observations from gosat. Geophys. Res. Lett. 2011, 38, L14812. [Google Scholar] [CrossRef]
- Eldering, A.; Wennberg, P.O.; Crisp, D.; Schimel, D.S.; Gunson, M.R.; Chatterjee, A.; Liu, J.; Schwandner, F.M.; Sun, Y.; O’Dell, C.W.; et al. The orbiting carbon observatory-2 early science investigations of regional carbon dioxide fluxes. Science 2017, 358, eaam5745. [Google Scholar] [CrossRef]
- Schwandner, F.M.; Gunson, M.R.; Miller, C.E.; Carn, S.A.; Eldering, A.; Krings, T.; Verhulst, K.R.; Schimel, D.S.; Nguyen, H.M.; Crisp, D.; et al. Spaceborne detection of localized carbon dioxide sources. Science 2017, 358, eaam5782. [Google Scholar] [CrossRef]
- Turner, A.J.; Shusterman, A.A.; McDonald, B.C.; Teige, V.; Harley, R.A.; Cohen, R.C. Network design for quantifying urban CO2 emissions: Assessing trade-offs between precision and network density. Atmos. Chem. Phys. 2016, 16, 13465–13475. [Google Scholar] [CrossRef]
- Byrne, B.; Jones, D.B.A.; Strong, K.; Zeng, Z.C.; Deng, F.; Liu, J. Sensitivity of CO2 surface flux constraints to observational coverage. J. Geophys. Res.-Atmos. 2017, 122, 6672–6694. [Google Scholar] [CrossRef]
- Schultz, M.G.; Akimoto, H.; Bottenheim, J.; Buchmann, B.; Galbally, I.E.; Gilge, S.; Helmig, D.; Koide, H.; Lewis, A.C.; Novelli, P.C. The global atmosphere watch reactive gases measurement network. Elementa 2015, 3, 000067. [Google Scholar] [CrossRef]
- Fang, S.X.; Zhou, L.X.; Tans, P.P.; Ciais, P.; Steinbacher, M.; Xu, L.; Luan, T. In situ measurement of atmospheric CO2 at four WMO/GAW stations in China. Atmos. Chem. Phys. 2014, 14, 2541–2554. [Google Scholar] [CrossRef]
- Fang, S.X.; Zhou, L.X.; Kenneth, A.M.; Xu, L.; Chris, W.R. Study of atmospheric CH4 mole fractions at three WMO/GAW stations in China. J. Geophys. Res. Atmos. 2013, 118, 4874–4886. [Google Scholar] [CrossRef]
- Zhang, F.; Zhou, L.; Novelli, P.; Worthy, D.; Zellweger, C.; Klausen, J.; Ernst, M.; Steinbacher, M.; Cai, Y.; Xu, L. Evaluation of in situ measurements of atmospheric carbon monoxide at mount Waliguan, China. Atmos. Chem. Phys. 2011, 11, 5195–5206. [Google Scholar] [CrossRef]
- Wang, J.; Feng, L.; Palmer, P.I.; Liu, Y.; Fang, S.; Bösch, H.; O’Dell, C.W.; Tang, X.; Yang, D.; Liu, L. Large chinese land carbon sink estimated from atmospheric carbon dioxide data. Nature 2020, 586, 720–723. [Google Scholar] [CrossRef]
- Piao, S.; He, Y.; Wang, X.; Chen, F. Estimation of china’s terrestrial ecosystem carbon sink: Methods, progress and prospects. Sci. China Earth Sci. 2022, 65, 641–651. [Google Scholar] [CrossRef]
- Zhang, X.; Brandt, M.; Tong, X.; Ciais, P.; Yue, Y.; Xiao, X.; Zhang, W.; Wang, K.; Fensholt, R. A large but transient carbon sink from urbanization and rural depopulation in china. Nat. Sustain. 2022, 5, 321–328. [Google Scholar] [CrossRef]
- Wang, Y.; Wang, X.; Wang, K.; Chevallier, F.; Zhu, D.; Lian, J.; He, Y.; Tian, H.; Li, J.; Zhu, J. The size of the land carbon sink in china. Nature 2022, 603, E7–E9. [Google Scholar] [CrossRef] [PubMed]
- Wang, Y.; Tian, X.; Chevallier, F.; Johnson, M.S.; Philip, S.; Baker, D.F.; Schuh, A.E.; Deng, F.; Zhang, X.; Zhang, L. Constraining china’s land carbon sink from emerging satellite CO2 observations: Progress and challenges. Glob. Chang. Biol. 2022, 28, 6838–6846. [Google Scholar] [CrossRef]
- Ruckstuhl, A.F.; Henne, S.; Reimann, S.; Steinbacher, M.; Vollmer, M.K.; O’Doherty, S.; Buchmann, B.; Hueglin, C. Robust extraction of baseline signal of atmospheric trace species using local regression. Atmos. Meas. Tech. 2012, 5, 2613–2624. [Google Scholar] [CrossRef]
- Draxier, R.R.; Hess, G.D. An overview of the HYSPLIT_4 modeling system of trajectories, dispersion, and deposition. Aust. Meteorol. Mag. 1998, 47, 295–308. [Google Scholar]
- Thoning, K.W.; Tans, P.P.; Komhyr, W.D. Atmospheric carbon dioxide at Mauna Loa Observatory: 2. Analysis of the NOAA GMCC data. J. Geophys. Res. Atmos. 1989, 94, 8549–8565. [Google Scholar] [CrossRef]
- Ramonet, M.; Ciais, P.; Apadula, F.; Bartyzel, J.; Bastos, A.; Bergamaschi, P.; Blanc, P.E.; Brunner, D.; Caracciolo di Torchiarolo, L.; Calzolari, F.; et al. The fingerprint of the summer 2018 drought in Europe on ground-based atmospheric CO2 measurements. Philos. Trans. R. Soc. B Biol. Sci. 2020, 375, 1810. [Google Scholar] [CrossRef] [PubMed]
- Liu, L.X.; Tans, P.P.; Xia, L.; Zhou, L.; Zhang, F. Analysis of patterns in the concentrations of atmospheric greenhouse gases measured in two typical urban clusters in China. Atmos. Environ. 2017, 173, 343–354. [Google Scholar] [CrossRef]

Disclaimer/Publisher’s Note: The statements, opinions and data contained in all publications are solely those of the individual author(s) and contributor(s) and not of MDPI and/or the editor(s). MDPI and/or the editor(s) disclaim responsibility for any injury to people or property resulting from any ideas, methods, instructions or products referred to in the content. |
© 2023 by the authors. Licensee MDPI, Basel, Switzerland. This article is an open access article distributed under the terms and conditions of the Creative Commons Attribution (CC BY) license (https://creativecommons.org/licenses/by/4.0/).
Share and Cite
Wu, D.; Yue, Y.; Jing, J.; Liang, M.; Sun, W.; Han, G.; Lou, M. Background Characteristics and Influence Analysis of Greenhouse Gases at Jinsha Atmospheric Background Station in China. Atmosphere 2023, 14, 1541. https://doi.org/10.3390/atmos14101541
Wu D, Yue Y, Jing J, Liang M, Sun W, Han G, Lou M. Background Characteristics and Influence Analysis of Greenhouse Gases at Jinsha Atmospheric Background Station in China. Atmosphere. 2023; 14(10):1541. https://doi.org/10.3390/atmos14101541
Chicago/Turabian StyleWu, Dongqiao, Yanyu Yue, Junshan Jing, Miao Liang, Wanqi Sun, Ge Han, and Mengyu Lou. 2023. "Background Characteristics and Influence Analysis of Greenhouse Gases at Jinsha Atmospheric Background Station in China" Atmosphere 14, no. 10: 1541. https://doi.org/10.3390/atmos14101541