Abstract
The UK government has announced its ten-point plan to annually install 600,000 low-carbon heat pumps by 2028. However, there is a lack of evidence showing potential overheating risk in dwellings retrofitted with heat pumps. This paper examines the prevalence and magnitude of summertime overheating across 24 naturally ventilated social housing dwellings retrofitted with ground source heat pumps (GSHPs). The dwellings are located in a socially deprived area in Oxford (UK). The empirical study included longitudinal monitoring of indoor temperatures in the living rooms and bedrooms during the non-heating seasons of 2021 and 2022 (May–September), which included a record-breaking heatwave in July 2022. Indoor temperature and CO2 levels in bedrooms were monitored across a subset of six dwellings alongside the monitoring of window opening state in three bedrooms to understand the effect of natural ventilation in removing excess heat. About 136 thermal comfort surveys were conducted to ascertain the subjective responses of residents. Overheating risk assessment was carried out using CIBSE static and adaptive methods, which revealed that summertime overheating was prevalent across half of the dwellings in the non-heating season of 2022, as compared to 17% overheated dwellings in 2021. Bungalows with upgraded cavity wall insulation and top floor flats facing south and south-west had a propensity to overheat. The variation in indoor temperature and CO2 levels across a small sample also indicated the relationship between overheating and residents’ behaviour. Given that the majority of the dwellings were occupied by retired elderly people with low incomes who are vulnerable to heat and cannot afford active forms of cooling, it is vital to deploy passive design measures, such as appropriate shading devices that are suitable for a heating-dominated climate and enhanced ventilation, as part of home energy retrofits. Implementing reversible heat pumps coupled with solar PVs can provide cooling during heatwaves while delivering low-carbon heat in the winter.
Keywords:
overheating; thermal comfort; social housing; heat pump; passive design; monitoring; survey 1. Introduction
The UK experienced five extreme heatwaves in summer 2022 (June–August) with a record-breaking period between 10 and 25 July during a time in which the country saw excess mortality of 10.4% that was above the five-year average [1]. This indicates the potential health risk for vulnerable citizens [2,3]. The sudden increase in the intensity of heatwaves highlights the vital role of climate emergency actions to be taken by world governments, keeping the global temperature within the limit of 1.5 °C, which can be stabilised through achieving global net-zero carbon emissions targets by 2050 [4]. However, evidence indicates that a 4 °C rise under current climatic conditions should be expected [5]. Based on the recent UK Climate Projections [6], the UK will be warmer by the end of the 21st century, with a projected temperature rise of 1.3 °C to 5.1 °C in summer under the high emission scenario. As a part of the Ten-point Plan for a Green Industrial Revolution, the UK government aims to install 600,000 low-carbon heat pumps each year by 2028 [7]. However, with 300,000 homes to be built in the UK per year [5], there is a risk of lock-in if new and existing dwellings with heat pumps do not address the risk of summertime overheating, since homes with heat pumps usually tend to be well insulated to maximise the efficiency of the heat pumps, which affects indoor–outdoor air change. Such dwellings may be also at a higher risk of overheating with always-on heat pumps. Studies on the indoor environmental conditions of UK dwellings have identified that the majority of UK dwellings experience summertime overheating under the current climate [8,9], more so in social housing and existing dwellings [10,11]. This underlines the morality concern of higher temperatures as experienced in the UK during the heatwave of 2022, with those over 65 years old being particularly affected [1].
With a view to enhance the energy efficiency of buildings in winter, existing dwellings were retrofitted with higher standards of thermal insulation, as recommended by the Building Regulations [12]. This, together with residents’ behaviour, can increase the possibility of overheating in dwellings during the summer months and hence increase the health risk of vulnerable residents. The UK social housing stock includes over four million properties in England, covering 17% of the total dwellings [13,14]. The majority of social renters are those in the last two lowest income quintiles (46% and 26%), which include elderly, vulnerable, retired, and unemployed residents [13]. This outlines the key role of providing energy-efficient and affordable social housing dwellings that not only provide comfortable indoor environments but also reduce energy costs. It also highlights the importance of undertaking overheating risk assessment across social housing estates, in line with the UK Climate Change Risk Assessment, emphasising the overheating risk to human health and productivity due to exposure to excess heat in homes [5]. However, Building Regulations in England have only set standards to mitigate overheating in new residential buildings in the Approved Document Part O on overheating [15]. There is also limited empirical evidence on assessing the risk of overheating in existing social housing dwellings retrofitted with low-carbon heat pumps.
Within this context, this paper examines the extent of summertime overheating using CIBSE TM52 and CIBSE TM59 methods across 24 naturally ventilated social housing dwellings that were co-located in a socially deprived area in Oxford (UK) and retrofitted with ground source heat pumps (GSHPs). This study aims to investigate the prevalence of summertime overheating in the dwellings during a typical non-heating season in 2021 (May-September), as compared to the non-heating season of 2022 that experienced five extreme heatwaves. This helps to identify the potential impact of building characteristics on indoor temperature and residents’ thermal comfort under extreme climatic condition in summer. This empirical study included the longitudinal monitoring of outdoor temperatures, as well as indoor temperatures in living rooms. Thermal comfort surveys were also conducted over two summers to understand the residents’ perception of heat. Indoor temperatures and CO2 levels in bedrooms were monitored across a subset of six dwellings, alongside the monitoring of window opening state during the non-heating season of 2022 to understand the impact of ventilation in removing excess heat.
2. Evidence to Date
Although several studies have been undertaken on summertime overheating in dwellings [16,17,18,19], the focused has largely been on newly built housing. A recent study on the extent of overheating in existing UK dwellings found that a high proportion of dwellings failed to meet the UK Approved Document Part O on overheating in newly built homes [20]. This document is based on prevention and remedy by limiting solar gain through window openings, reducing heat gain through heating pipes, removing excess heat via cross-ventilation, and avoiding excessive solar gain through external shutters and overhangs on south-facing façades of newly built homes [15]. A range of design measures need to be implemented in existing dwellings to meet the Approved Document Part O (currently valid for newly built homes), alongside behaviour changes in the opening and closing of windows and internal shading devices (e.g., blinds and curtains) at the right time to prevent overheating and the build-up of excess heat [20]. Studies have found that building fabric retrofits of existing dwellings can potentially increase the risk of overheating in summer due to increased levels of airtightness [21]. Such dwellings can retain heat in summer if natural ventilation or extractor fans cannot remove excess heat.
Summertime overheating in buildings can occur due to several factors, including a high outdoor temperature, which can be aggravated by allowing buildings to receive a strong afternoon solar glare, limiting natural ventilation when the outdoor temperature is lower than the indoor temperature and increasing the internal heat gain [22]. Recent empirical studies that examined overheating risk across 122 free-running social housing dwellings in the UK found that a large number of the dwellings were uncomfortably warm in summer based on CIBSE static criteria, with 40% of the dwellings exceeding the 1% limit of the occupied hours [11]. This was more evident across end-terraced bungalows and top- and middle-floor flats with filled cavity walls when the outdoor temperature peaked between 28.8 °C and 33.3 °C, suggesting that a high proportion of dwellings can experience overheating under extremely hot weather. In line with the impact of building characteristics on overheating, Tink et al. [23], using the CIBSE TM52 overheating assessment, confirmed how UK dwellings with solid walls and internal insulation overheated when the outdoor temperature exceeded 30 °C, which could be mitigated by using passive design strategies, such as shading devices to reduce solar glare and night-time natural ventilation to purge warm air from the buildings. A review study on overheating in UK dwellings that included the social housing sector highlighted the key role of the energy efficiency of dwellings in increasing the risk of summertime overheating, with highly insulated buildings being at a higher risk [8].
Not only can building characteristics affect indoor temperature, but resident behaviour can also influence the intensity of overheating. Therefore, training residents on how to operate their homes is a key factor in avoiding excess indoor heat. As identified by Sameni, Gaterell [16], resident-controlled window opening and the lack of shading devices increased summertime indoor discomfort in 25 social housing flats in the UK that were constructed to the Passivhaus standard during three subsequent summers, with more than 75% of the flats being largely affected. A review study on the overheating risk in the UK social housing sector also highlighted the impact of residents’ cooking and heating behaviour in increasing the risk of exposure to excess heat in summer [8]. An empirical study carried out by Vellei et al. [24] on 55 retrofitted social housing dwellings in England and the studies undertaken by Baborska-Narożny, Stevenson [25] and Mavrogianni, Taylor [26] indicated how residents’ preferences for reduced ventilation due to their age and limiting indoor–outdoor air change affected the severity of summertime overheating. Though, this excessive indoor heat could be mitigated by taking simple actions such as opening windows when the outdoor temperature is lower than the indoor temperature and implementing shading devices to reduce solar glare and night-time ventilation, which signify a major role of training residents in managing their homes.
A limited number of studies have been carried out to understand the effectiveness of residents’ behaviour in reducing the extent of overheating in dwellings, and such studies are limited to reactive responses to high indoor temperatures [27,28] with a lack of investigation on proactive approaches (e.g., commissioning retrofit measures) to tackle overheating. Murtagh et al. [29] studied the effectiveness of improving residents’ knowledge in protecting their homes against overheating by conducting a large-scale survey of 1007 UK householders, which found a relatively moderate contribution of knowledge to tackling overheating. Although enhancing the perceptions of overheating risk had an influence on residents’ motivation to take behavioural action, improving their agency to make changes was a strong factor. This indicates the key role of understanding the psychological factors that can affect the effectiveness of residents’ mitigating actions against overheating. Despite this, residents’ age was found to be negatively related to their intention to act against overheating [29]. Given the negative association of age with overheating, it is important to enhance motivation in elderly residents by improving their knowledge and know-how about tackling overheating through behavioural actions.
The impact of residents’ behaviour on the extent of overheating in their homes is despite the effect of certain retrofit measures (e.g., airtightness and thermal insulation) in exacerbating thermal discomfort in extreme heatwave periods [26], highlighting the vital role of assessing dwellings’ whole-year performance to adapt a proactive approach that matches with residents’ requirements, allowing them to adapt themselves to excessive temperature rises by changing their clothes, activities, and window opening behaviour [30]. This also indicates why adaptive overheating assessment methods such as CIBSE TM52 [31] and CIBSE TM59 [32] can better predict overheating than static methods with fixed temperatures, as tested in studies carried out by Hughes and Natarajan [33], Morey, Beizaee [11], Lomas, Watson [18], and Mitchell and Natarajan [30]. However, the uncertainty on residents’ adaptive behaviour in using passive measures such as blinds for solar protection and opening windows to dispute excess heat in summer [34,35] underlines the key role of implementing in-use data and residents’ socio-economic/demographic backgrounds into adaptive overheating assessment tools.
The adaptive model of thermal comfort in free-running dwellings connects the indoor and outdoor environment while allowing residents to adapt themselves to excessive temperature rises by changing their clothes, activities, and window opening behaviour [30], which indicate different indoor comfort temperatures. This approach may account for why some overheated passive dwellings with high indoor temperatures in summers [16,30,36,37,38] were still considered acceptable to residents. Where access to annual weather conditions and occupancy is available but where residents may not fully have control of their indoor environment, CIBSE TM59 metrics [32] can be used to assess overheating in dwellings, which combine guidance from the adaptive CIBSE TM52 [31] in conjunction with the static CIBSE Guide A [39], which gives a limit to bedroom temperatures of 26 °C. An empirical study carried out by Hughes and Natarajan [33] to assess overheating in 43 dwellings occupied by residents aged 65 and over in south-west UK indicated how adaptive CIBSE TM52 and CIBSE TM59 metrics can provide more reliable predictions for dwellings occupied by elderlies during hot weather, which matched with their responses to a thermal comfort survey, compared with the PMV/PPD thermal comfort model, which complied with the ASHREA-55 standards for thermal comfort in naturally ventilated buildings with fixed recommended operative temperatures [40]. Limited studies have also been undertaken to assess overheating in social housing dwellings with vulnerable residents and elderlies, allowing an understanding of whether such residents can adapt themselves to indoor temperatures under severe climates. Pyrgou and Santamouris [41] found a significant association between gender mortality and age group, with those of 80 years and over being at a higher risk of mortality due to their reduced ability to regulate body temperature. This became evident following the 10% excess mortality in the UK during a record-breaking heatwave, with those of 65 years and over being particularly affected [1], suggesting that mortality temperature should be calculated for vulnerable residents.
Despite an increased interest in assessing overheating risk in social housing dwellings, we found no studies that have explicitly addressed overheating in retrofitted social housing with low-carbon heat pumps during hot weather and heatwaves, which the current paper tries to address. Reviewing the grey and academic literature on overheating revealed different proportions of samples that have experienced overheating due to variations in occupancy, energy use patterns, location, climatic conditions, built forms, sample sizes, and monitoring periods, with the majority highlighting the severity of summertime overheating under future climatic conditions.
3. Methods and Case Study
Drawing from building and social science, this study uses a mixed methods approach to understand the risk of overheating across 24 free-running social housing dwellings in Oxford (UK) during the typical non-heating season of 2021 (May–September), as well as 2022, which saw five extreme heatwaves from June to August, experiencing the UK’s hottest period on record between 10 and 25 July. The case study dwellings consisted of 10 ground-floor and 8 top-floor flats, as well as 6 bungalows, all of which were co-located in a socially deprived housing estate in Oxford (UK) and that were retrofitted with ground source heat pumps (GSHPs) with thermostatic control. The research methods include the following:
- Building characteristics (i.e., floor area, built form, and energy efficiency rating) were extracted from Energy Performance Certificates (EPCs) before heat pump installation.
- The longitudinal monitoring of outdoor temperature as well as indoor temperature across the living rooms of 24 dwellings over the two summers.
- The longitudinal monitoring of indoor temperature and indoor CO2 levels across a subset of six dwelling in bedrooms, alongside the monitoring of window opening state in the bedrooms of three dwellings in summer 2022 to understand the impact of air change rate (ACH) and natural ventilation in removing excess heat. Air change rate was calculated using CO2-based decay methods, as tested by López-García, Lizana [42].
- About 136 thermal comfort surveys were carried out in 22 dwellings to ascertain the subjective responses of residents over the two summers.
- Overheating risk was assessed using CIBSE TM52 and CIBSE TM59 criteria.
The monitoring periods covered the typical non-heating season of 2021 (May to September) with a mean outdoor temperature of over 17 °C, which saw an increase of 6% during the same months in 2022 with a record-breaking heatwave, reaching 18 °C and over. The heatwave periods in the UK were assessed in line with a heatwave threshold of 25−28 °C as defined by the UK Meteorological Office (Met Office), which indicates a heatwave when a location records a period of at least three consecutive days with daily maximum temperatures meeting or exceeding this threshold [43]. A maximum outdoor temperature of 40 °C was observed in the non-heating season of 2022 during the extreme heatwave period in July, increasing from 36 °C, which was recorded in the non-heating season of 2021 (Figure 1). As presented in Figure 1, the heatwaves in 2022 were between 16 and 19 June, 30 July and 5 August, 8 and 17 August, and 23 and 25 August, and a record-breaking heatwave between 10 and 25 July experienced a maximum mean temperature of 30 °C and over during the midday.
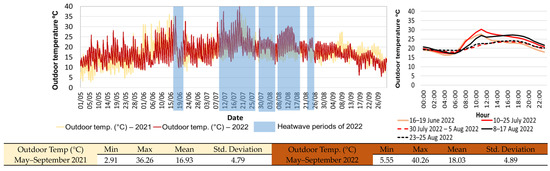
Figure 1.
Mean daily outdoor temperature profiles in May–September 2021 and 2022 (left), as well as the heatwave periods in 2022 (right).
3.1. Overview of Case Study Dwellings
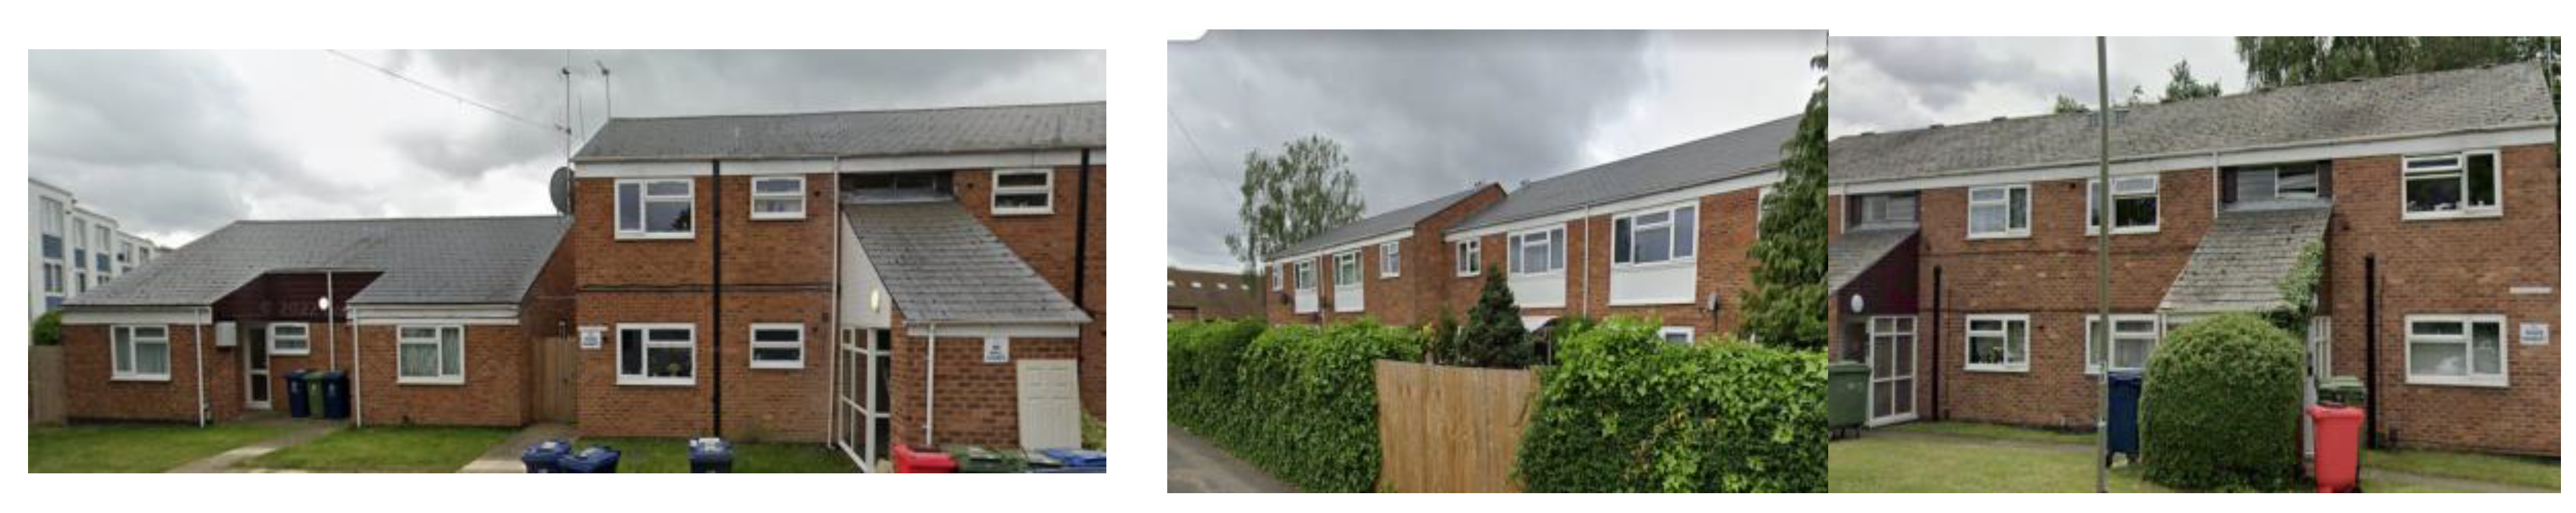
The 24 social housing dwellings consisted of ten ground-floor and eight top-floor flats, as well as two end-terraced bungalows, three mid-terraced bungalows, and one semi-detached bungalow, co-located in an estate within a socially deprived area in Oxford (UK). The low-rise block and the bungalows were constructed in the 1960s. GSHPs were installed between October 2020 and March 2021. The physical characteristics of the dwellings were identified using EPCs before heat pump installation, which are summarised in Table 1. All bungalows and the three flats (flats P06, P03, and P04) with energy efficiency ratings of C, D, and E had their filled cavity wall insulation improved before heat pump installation. Figure 2 presents the samples of the bungalows and flats with improved cavity wall insulation (left), as well as energy inefficient flats (right). All bungalows and top-floor flats included a pitched roof with 270 mm loft insulation, as well as double-glazed windows.

Table 1.
Characteristics of case study dwellings.

Figure 2.
Samples of bungalows and flat façades with cavity wall insulation upgrades (left) and flats with no cavity wall insulation upgrades (right).
3.2. Environmental and Window Opening Monitoring
The longitudinal physical monitoring of indoor temperature was undertaken at 15 min intervals using Bluetooth-enabled HOBO MX1101 loggers that were wall-mounted in the living rooms of the 24 dwellings and that covered the typical non-heating seasons (May to September) of 2021 and 2022. Outdoor temperature was also measured using HOBO MX2301 in a control dwelling over the two non-heating seasons.
To understand the impact of natural ventilation on removing excess heat, indoor CO2 levels, alongside indoor temperature, were monitored in bedrooms in a subset of six dwellings at 15 min intervals using a Bluetooth-enabled HOBO MX1102 data logger during the non-heating season of 2022 with a record breaking heatwave between 10 and 25 July. The monitoring of CO2 levels allowed us to calculate the air change rate (ACH) in bedrooms using a CO2-based decay method during hot weather. The window opening state was recorded simultaneously with CO2 levels in the bedrooms of three dwellings using the HOBO U9-001 data logger to cross-relate the air change rate, while identifying its association with residents’ behaviour and overheating. Table 2 shows the specifications of the monitoring devices installed in the case study dwellings.
Table 2.
Specifications of monitoring devices installed in case study dwellings.
3.3. Thermal Comfort Survey
The thermal comfort survey was utilised during summer 2021 (June–September) and summer 2022 (August) to gather data regarding residents’ thermal sensations (7-point ASHRAE scale) and thermal preferences (5-point scale) during the warm periods together with simultaneous measurements of environmental conditions (i.e., Wet Bulb Globe Temperature (WBGT), Black Globe Temperature (TG), Relative Humidity (RH%), Air Temperature (TA), Wet Bulb (WT) and Dew Point (DEW), and airflow rate). A total of 136 responses from 22 dwellings were obtained, with 102 and 34 responses gathered during the summers of 2021 and 2022, respectively.
3.4. Overheating Assessment
To examine overheating in the case study dwellings, dynamic (adaptive) and static metrics of CIBSE TM52 and CIBSE TM59 were used, which were developed by taking the outdoor temperature and thermal adaptation (ability of the body to adjust to temperatures) into account. CIBSE TM52, with the adaptive methods, includes three criteria by which overheating can be assessed during the occupied and unoccupied hours. Where 2 out of 3 criteria (detailed below) are not met, the indoor space is counted as overheated.
- Criterion 1. Hours of exceedance: This criterion examines the number of hours during which ΔT (the difference between the actual operative temperature ( and the maximum acceptable temperature ()) is greater than or equal to one degree during the period of May to September, which should not be more than 3% of the occupied hours. ΔT can be calculated using Equations (1)–(3) below:
is the daily mean outdoor temperature for yesterday, is daily mean outdoor temperature for the day before, and so on.
- Criterion 2. Daily weighted exceedance (): This criterion should be less than or equal to 6 for any one day. can be calculated using Equations (4) and (5) below:
For example, in a room where the temperature is monitored at half−hourly intervals over 8 occupied hours, there are 16 readings. Of the total, there are 10 of them where ∆T is zero or negative (WF = 0), 3 readings where ∆T = 1 (WF = 1), 2 where ∆T = 2 (WF = 2), and 1 where ∆T = 3 (WF = 3). Then: = 1/2 [(10 × 0) + (3 × 1) + (2 × 2) + (1 × 3)] = 5 [31].
- Criterion 3. Upper limit temperature (): To set an absolute maximum value or upper limit temperature ( for the indoor operative temperature (, the value of ΔT should not exceed 4 K.
CIBSE TM59 uses a combination of dynamic (adaptive) and static criteria. Criterion A of CIBSE TM59 is dynamic, which is the same as CIBSE TM52 criterion 1 regarding hours of exceedance from May to September in bedrooms and living rooms. Criterion B of CIBSE TM59 is static, with an upper comfort temperature of 26 °C, which should not exceed 1% of the annual hours in bedrooms during sleeping hours between 22:00 and 07:00. The occupied hours during the May–September period in living rooms are from 9:00 to 22:00 for 153 days, and the occupied hours in bedrooms accounted for 24 h for the examination of criterion 1 of CIBSE TM52 and CIBSE TM59.
3.5. Assessment of Air Change Rate (ACH) and Passive Building Performance
To identify the impact of natural ventilation on removing excess heat during the non-heating season of 2022, during which heatwaves occurred, the air change rate (ACH) associated with ventilation and infiltration was calculated for the bedrooms of six dwellings using a CO2-based decay method. This diagnostic analytic was tested by López-García, Lizana [42] on three dwellings during the summer periods. The CO2-based decay method evaluated the real air change rate (ACH—1/h or ) with three stages of analytical approaches, starting with identifying the CO2 level decay curves, which were identified by selecting negative gradients (decreased CO2 levels) (step 1). This was followed by detecting the decay sections of CO2 levels with a starting point of above 1000 ppm, as well as a slope limit of 100 ppm/h, largely selected for unoccupied hours (step 2). Following the selection of the CO2 decay curves using steps 1 and 2, ACH values were calculated using Equation (6) below. Once all ACH rates were calculated according to the available CO2 decay curves, the mean value of ACHs based on the available data points were measured. According to López-García, Lizana [42], this method allows for the identification of real−time fluctuations in air change in buildings to determine whether they are naturally ventilated (single-sided or cross ventilation) or use mechanical ventilation systems, with an accuracy rate of ±10% [44]. This method of calculation helped to characterise overheating across the bedrooms of the six dwellings, which were monitored with HOBO MX1102 data loggers, which observed indoor CO2 levels and indoor temperatures.
where
ACH: Air change rate () at time t.
: Indoor CO2 level (ppm) at time t = 0
: Indoor CO2 level (ppm) at time t
: Outdoor CO2 level (400–500 ppm) [42]
Following the calculation of the air change rate (), the passive building performance of the monitored dwellings was studied through a heat balance map by dividing the map into four thermal stages. Each stage relates to the positive or negative influence of the total heat flux (±: flow of energy per unit of area per unit of time) and the ventilation and infiltration load (). The approach was iteratively developed, tested, and validated by You et al. [44] in three dwellings, which were characterised by different construction periods, geometry, orientations, ventilation systems, building standards, and operating conditions. This method allowed us to identify how heat loads could affect passive building performance using the observed indoor environmental data.
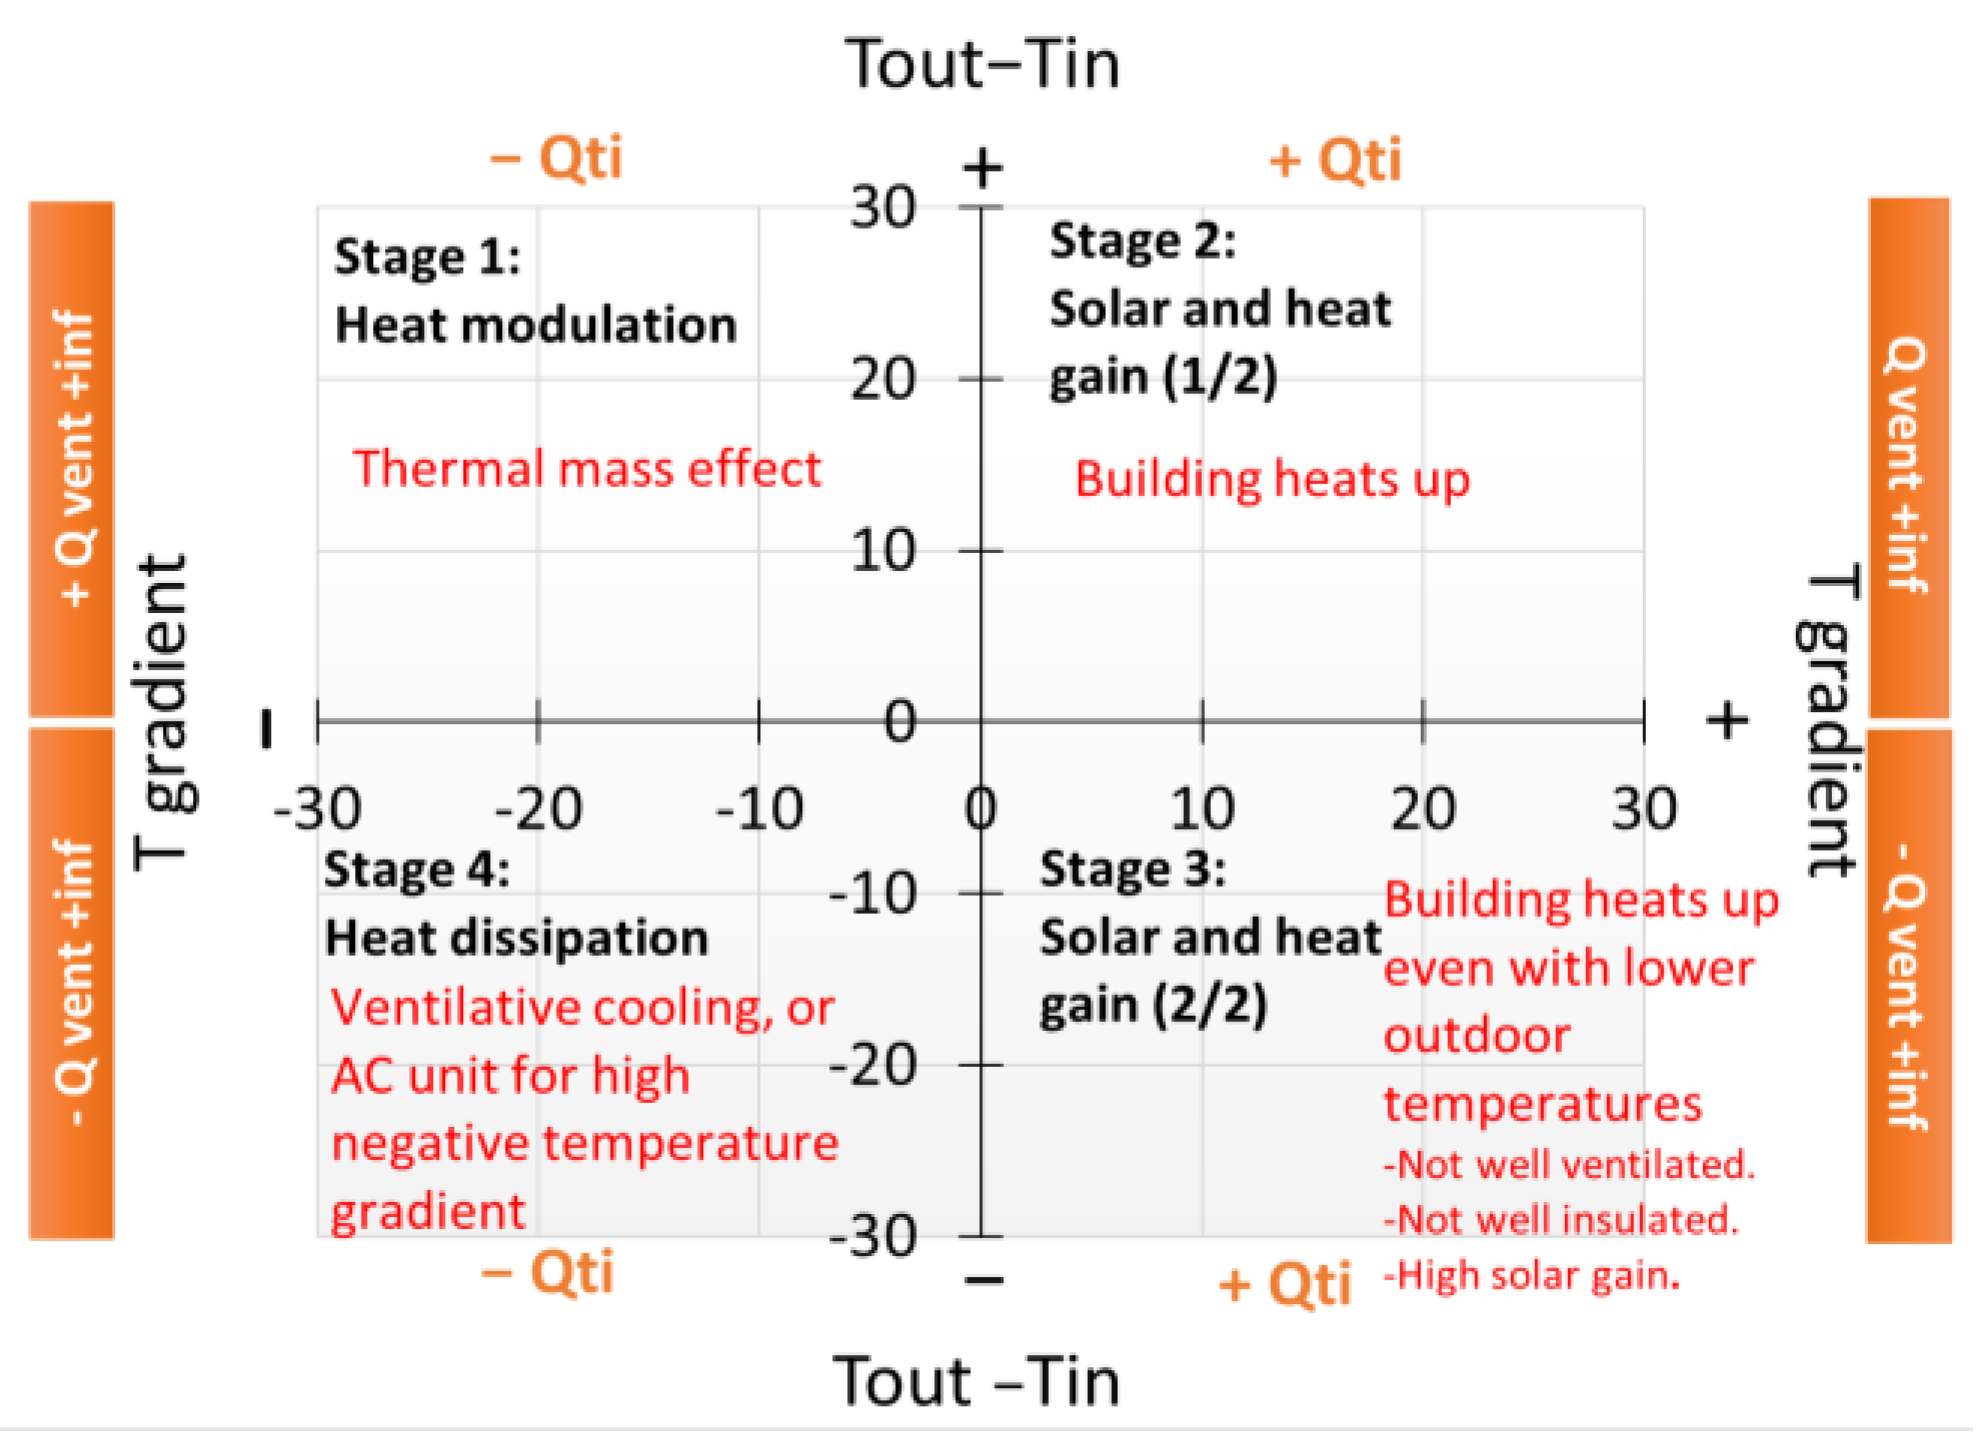
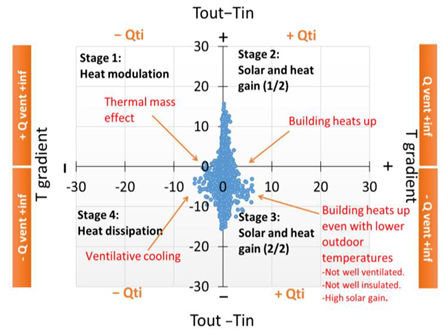
The heat balance map presented in Figure 3 is labelled based on the main groups of the passive conditioning of buildings [45,46], which consist of heat modulation (stage 1), solar and heat gain (stages 2 and 3), and heat dissipation (stage 4). The total heat flux (±) is identified according to the positive and negative indoor temperature gradient per hour (±, °C/h), as well as ventilation and infiltration load (±), which is a difference between outdoor and indoor temperatures per hour (− , °C/h). Stages 1 to 4 of the heat balance map are as follows (Figure 3):
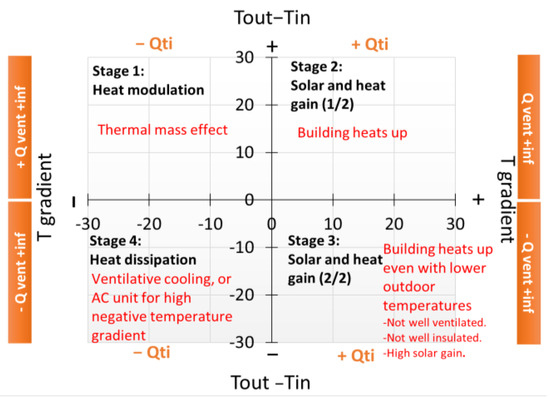
Figure 3.
Heat balance map.
- Stage 1 includes + and −, indicating the thermal mass effect.
- Stage 2 includes + and +, indicating solar and heat gain.
- Stage 3 includes − and +, indicating solar and heat gain even with lower outdoor temperatures, confirming not−well−insulated or not−well−ventilated buildings or a high solar gain.
- Stage 4 includes − and −, indicating ventilative cooling.This method can help to calculate the percentage of time in which the heat flow of the building operates in every thermal stage, and it can help to characterise the measured value of the building in each thermal stage.
4. Results
Indoor temperature and the extent of overheating were examined for the living rooms of 24 dwellings over two non-heating seasons in 2021 and 2022 (May to September) together with thermal comfort surveys, which were undertaken to understand the residents’ thermal sensations and thermal preferences in a typical summer in 2021, as compared to summer 2022 with heatwaves. CO2 levels and indoor temperature were also observed in bedrooms across a subset of six dwellings to examine the impact of the air change rate (ACH) on removing excess heat using a CO2-based decay method, followed by assessing the overheating risk and passive design performance of the bedrooms. The window opening state was simultaneously observed in three bedrooms to identify the impact of residents’ window opening behaviour on indoor temperature, CO2 levels, and the extent of overheating.
4.1. Indoor Temperatures
4.1.1. Indoor Temperature in Living Rooms
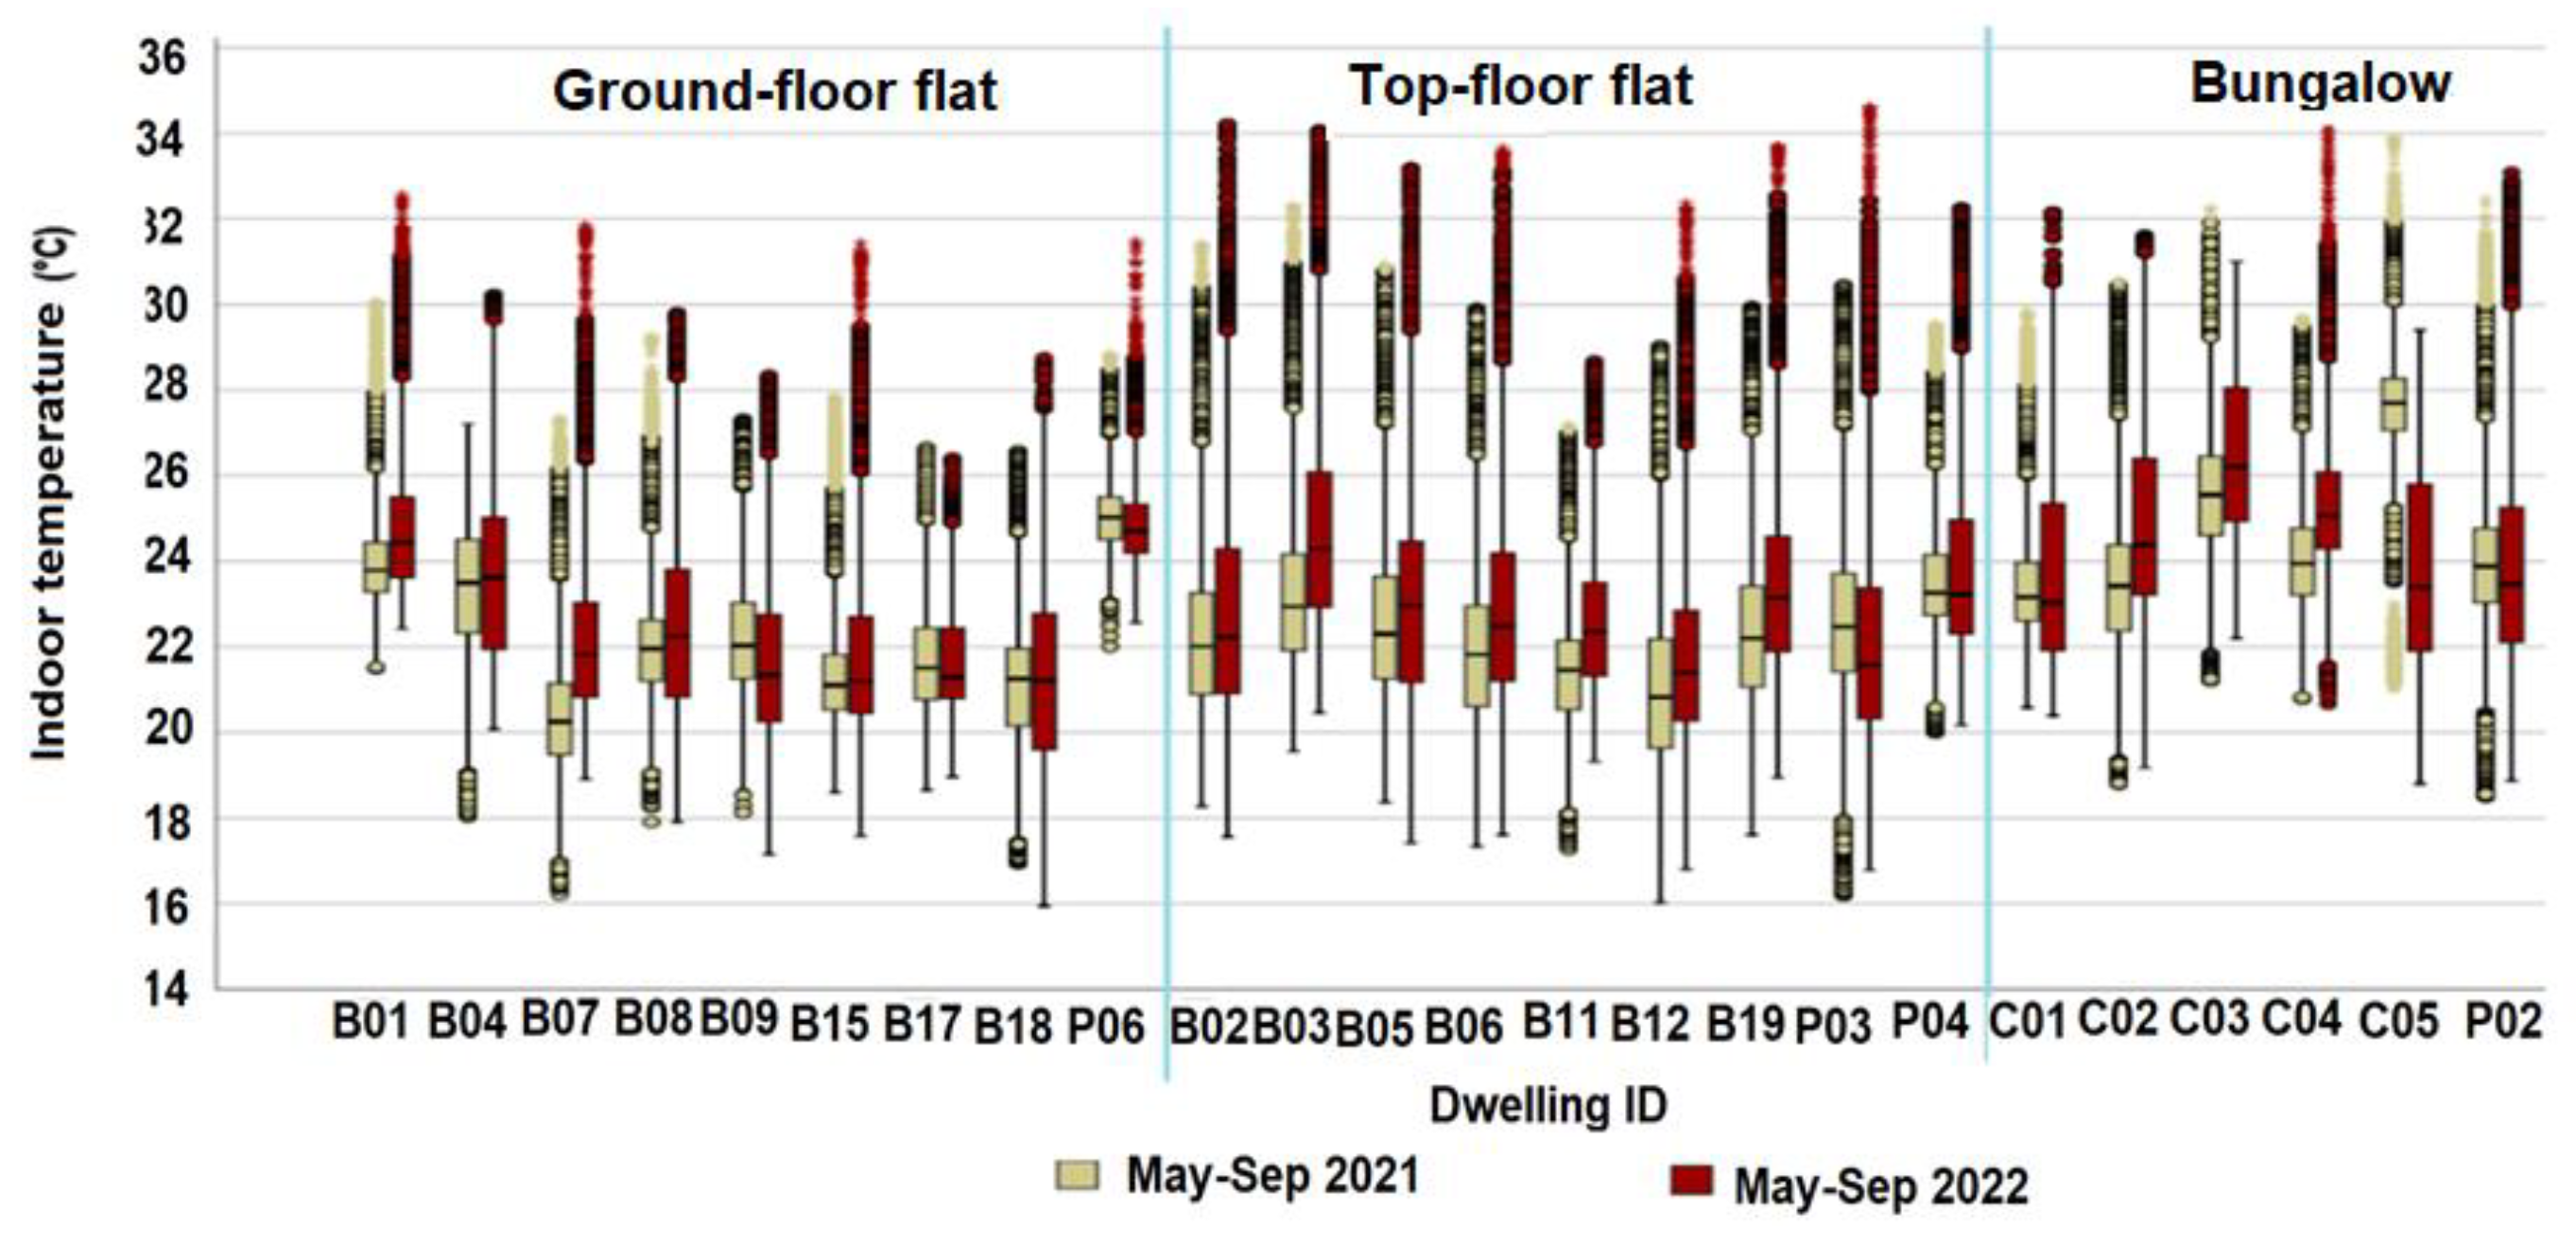
Descriptive statistics were produced to characterise indoor temperature across the living rooms of 24 dwellings, for which we found a higher mean indoor temperature of 23.3° with a wider range in the non-heating season of 2022, rising from 22.8° observed in the non-heating season of 2021. The distributions of indoor temperature presented in Table 3 and Figure 4 indicate that the majority of top-floor flats and bungalows experienced higher indoor temperatures over the two summers, reaching 32 °C and above, possibly due to more exposed area. This was more evident during heatwave days in these dwellings, which experienced a maximum indoor temperature of over 34 °C, observed in top-floor flats B02, B03, and P03 and end−terraced bungalow C04 facing south or south–west. The bungalows also experienced the highest mean indoor temperatures of over 26.5 °C in both summers, which were observed in mid-terraced bungalows C05 and C03. Across the flats, there was an increase of 2.2% in the mean indoor temperature during the non-heating season of 2022 with a record-breaking heatwave as compared to the non-heating season of 2021, and in bungalows, the mean indoor temperature increased by 0.4%, possibly due to the upgraded cavity wall insulation that provided a more stable yet slightly higher indoor temperature. Top-floor flats were also found to have the highest standard deviation in temperature, indicating the impact of buildings’ exposure to solar radiation on indoor temperatures.
Table 3.
Descriptive statistics of indoor temperatures across 24 dwellings during a typical non-heating season in 2021, as well as the non-heating season of 2022 with heatwaves.
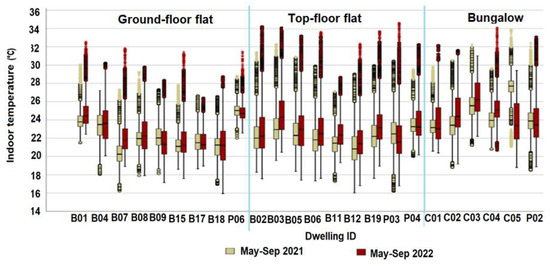
Figure 4.
Distribution of indoor temperature across 24 dwellings during the typical non-heating season of 2021 (May–September) and non-heating season of 2022 with heatwaves (May–September).
The distributions of indoor temperature in the living rooms of the 24 dwellings that are presented in Figure 4 show that the top-floor flats, followed by bungalows, experienced a longer range above the CIBSE Guide A recommendations, recommending an upper comfort temperature threshold of 28 °C, with both years being higher in the non-heating season of 2022 with heatwaves. This indicates that dwellings with larger exposed area to sunlight may experience longer periods of overheating if they are not sheltered appropriately in summer. The moderate correlation between the mean indoor temperature and mean outdoor temperature in the non-heating season of 2022 implies the key role of protecting dwellings from excess heat.
4.1.2. Indoor Temperature in Bedrooms
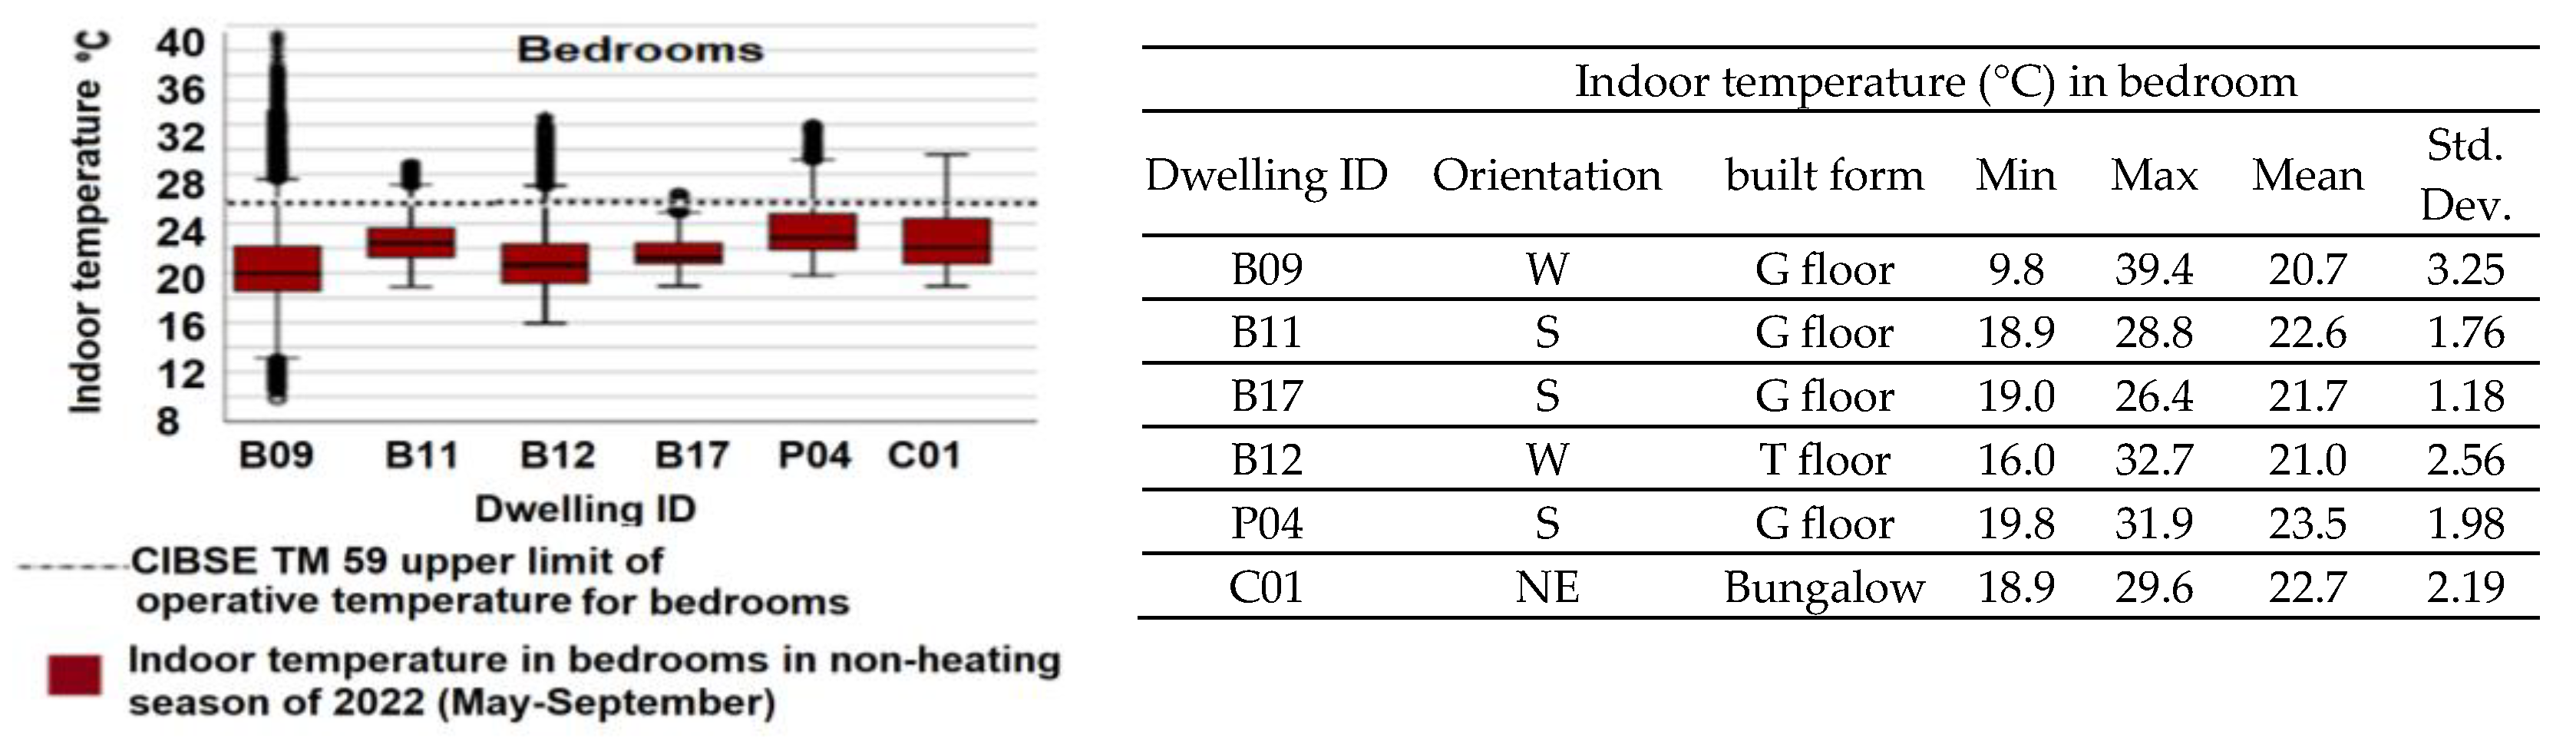
The indoor environment was monitored in bedrooms across a subset of six dwellings during the non-heating season of 2022. The descriptive statistics and distribution of indoor temperatures presented in Figure 5 indicate differences in indoor temperatures in bedrooms. The highest daily maximum indoor temperature of 39.4 °C was observed in the bedroom of ground-floor flat B09 facing west, followed by flats B12 and P04 facing west and south, respectively, with a maximum indoor temperature of over 32 °C. This suggests the influence of the strong afternoon–early evening sun hitting the west- and south-facing façade in increasing indoor temperatures, indicating the key role of an effective shading device during extremely warm periods to protect façades from excess solar glare. Interestingly, the lowest mean indoor temperature of 21 °C was also observed in the bedrooms of ground floor flat B09 and top floor flat B12 facing west, despite experiencing the maximum indoor temperature. This implies that the absence of a strong solar glare on the west façade of the bedrooms between early nights to late afternoons allowed a large temperature swing during the warm months, indicating the importance of improving cavity wall insulation, which also increases heat pump efficiency in the winter season.
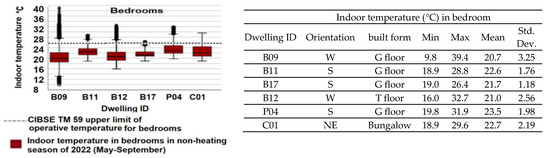
Figure 5.
Distribution of indoor temperature and descriptive statistics during the extreme heatwave of 10–25 July 2022 across the bedrooms of six dwellings.
Although the mean indoor temperature in bedrooms did not exceed the upper comfort limit of 26 °C for bedrooms during the May–September period, it was apparent that flats B09, B12, and P04 experienced an extended period over the comfort limit in bedrooms. This indicates an overheating risk during sleeping hours.
4.2. Overheating Assessment
4.2.1. Overheating in Living Rooms
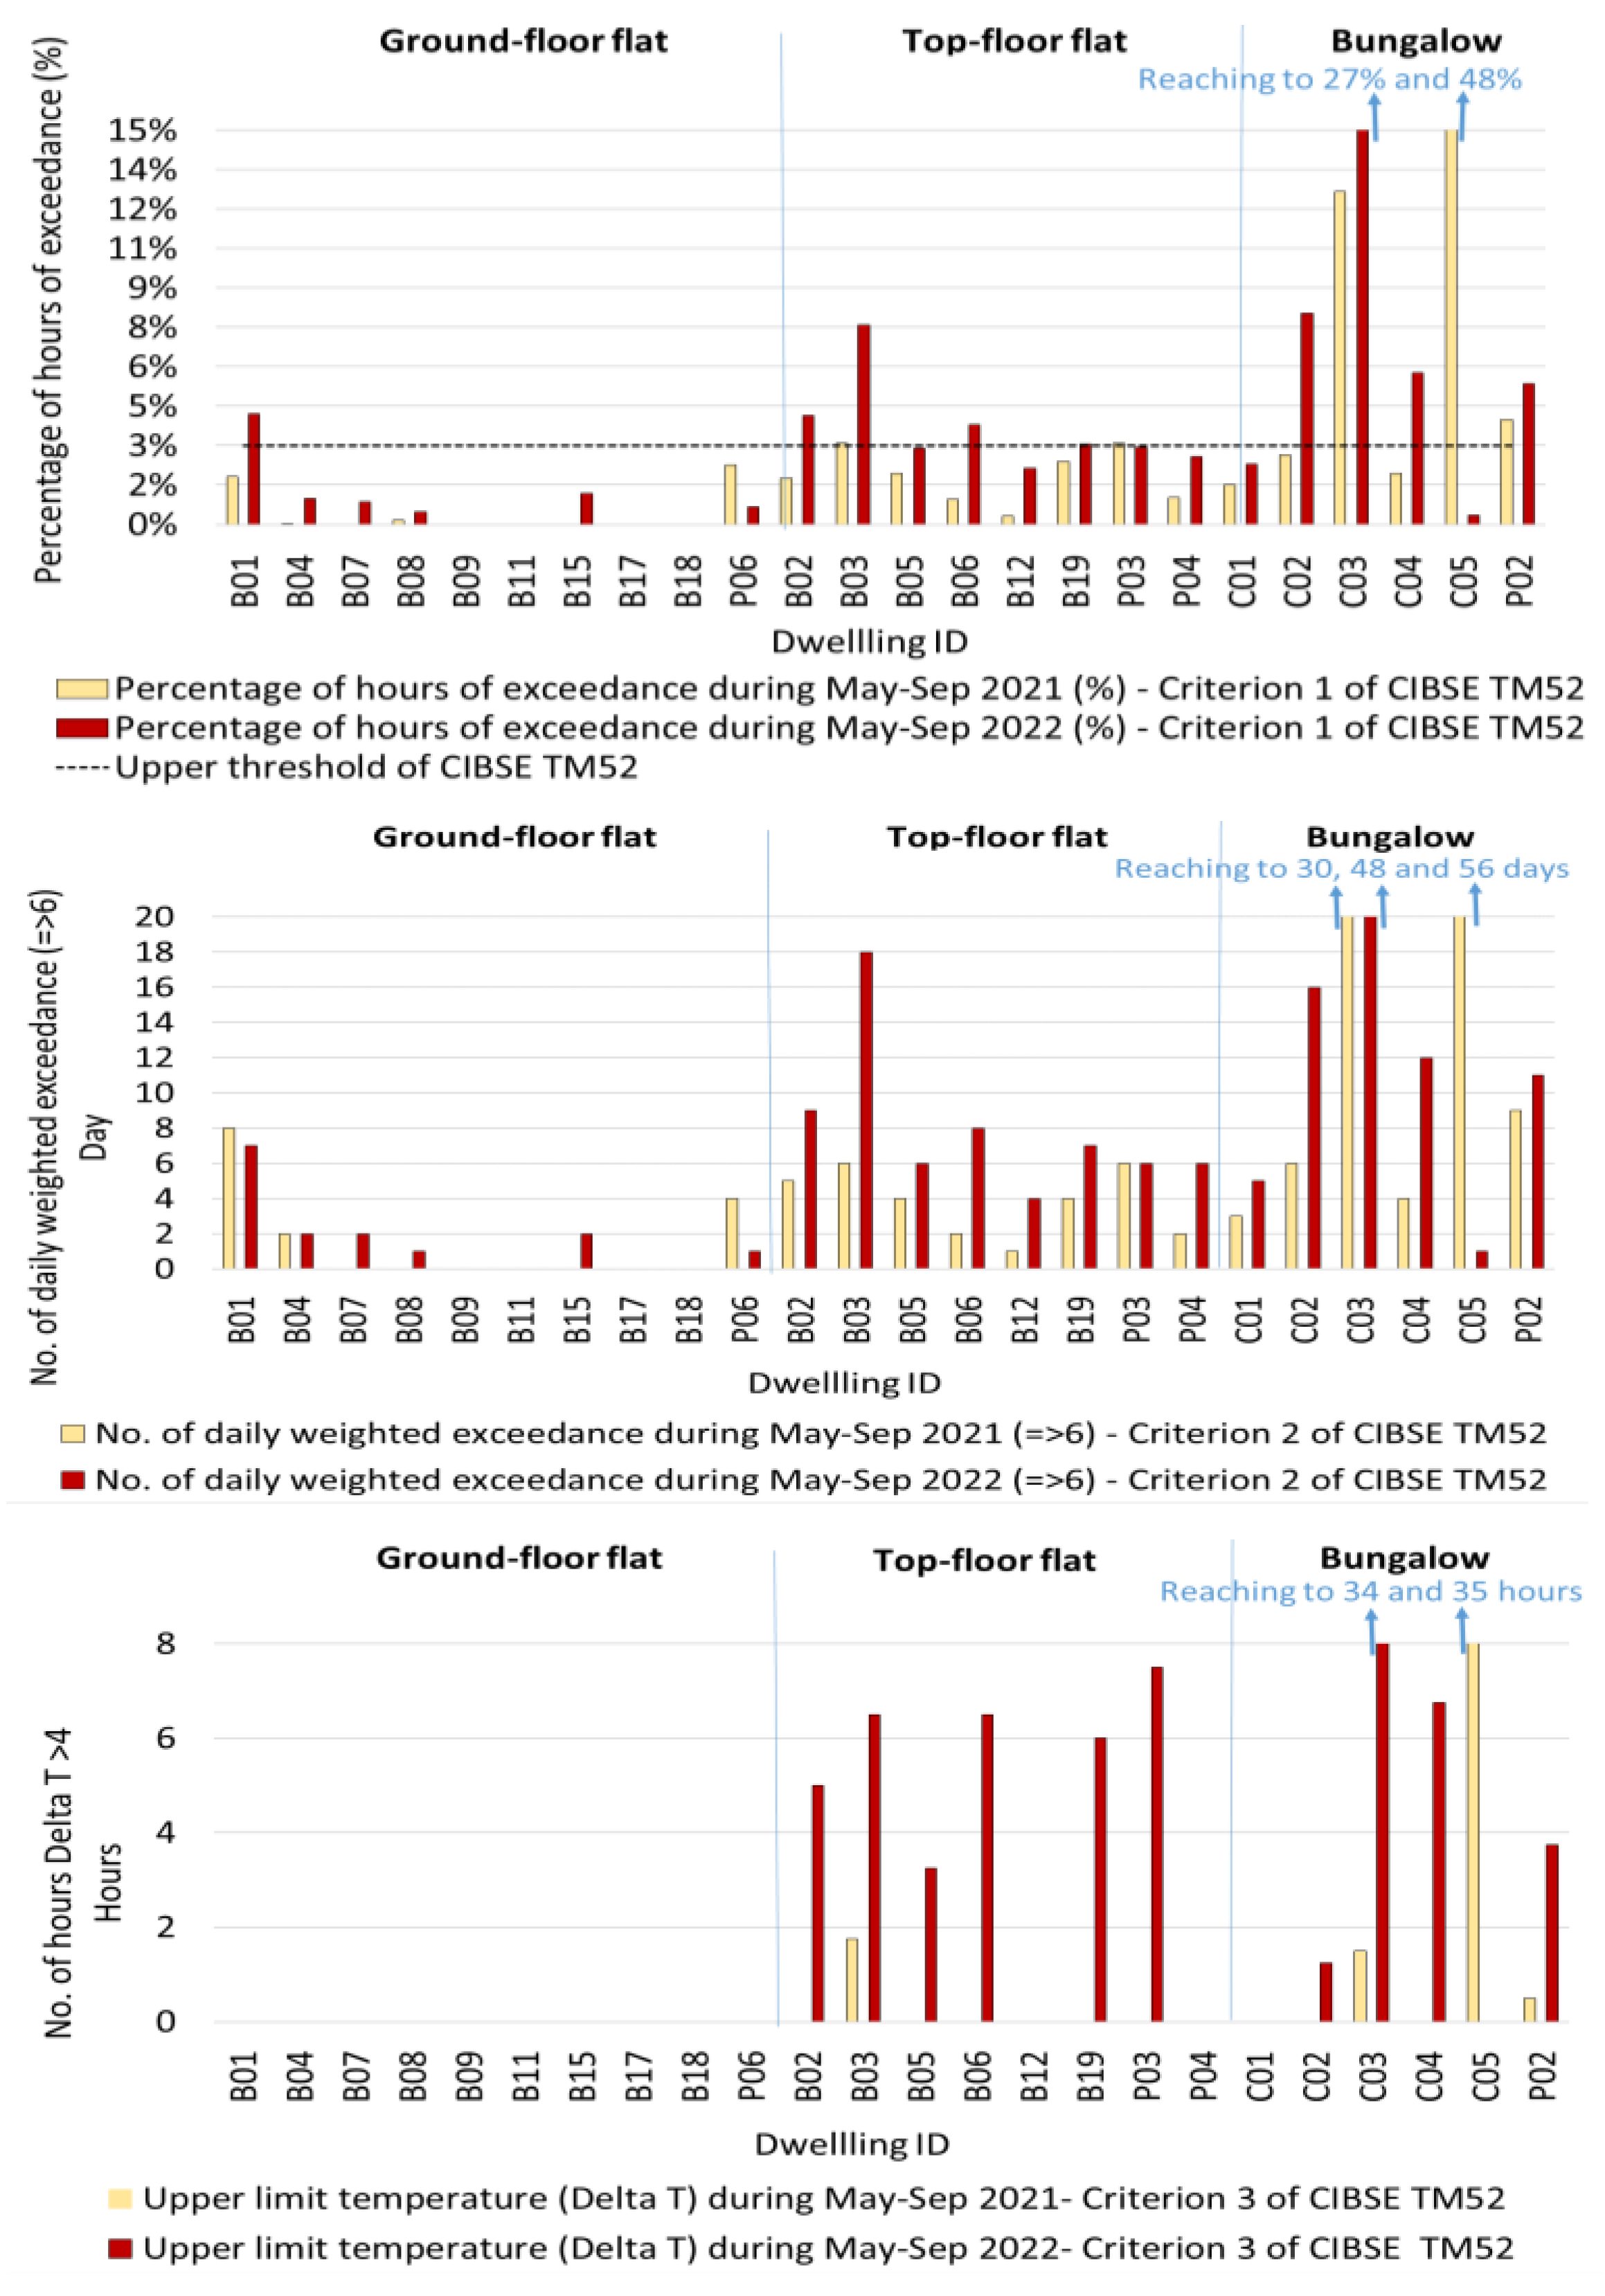
Overheating risk in the living rooms of 24 dwellings was assessed using CIBSE TM52 criteria with occupied hours between 9:00 and 22:00. The living room in each flat needed to fail at least two criteria for the period of May to September to be classed as overheated, which is explained in the Methods and Case Study section. Criterion 1 of CIBSE TM52 for the living rooms and bedrooms is identical to criterion 1 of CIBSE TM59. As presented in Figure 6, living rooms in 4 out of the 24 dwellings failed criterion 1 of CIBSE TM52 during the non-heating season of 2021 (May to September), exceeding the 3% hours of exceedance limit, which included bungalows C03, C05, and P02, as well as top-floor flat B03, facing south−west or south. These dwellings also failed criteria 2 and 3 of CIBSE TM52 on daily weighted exceedance and hourly exceedance of the upper temperature limit (Delta T), and therefore, they were classed as overheated (17%). Out of the 24 dwellings, 11 (46%) failed three criteria of CIBSE TM52 (except flat B01, which failed criteria 1 and 2), with the majority being top-floor flats and bungalows. This indicates the impact of heatwaves on residents’ thermal discomfort, particularly across dwellings with more exposed area. Bungalow C03 was found to well exceed the 3% limit of criterion 1 in both summers, indicating that the heat pump was used to deliver heat. This was observed through the on/off state of heat pumps and during site visits.
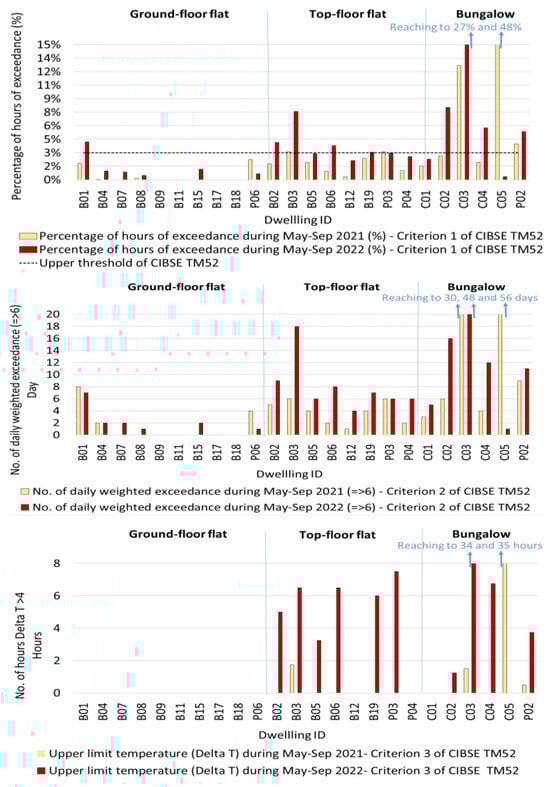
Figure 6.
CIBSE TM52 assessment including percentage of hours of exceedance (criterion 1) (top), daily weighted exceedance (criterion 2) (middle), and upper limit temperature (criterion 3) (bottom) during May–September 2021 and 2022 in the living rooms of 24 dwellings.
To deep dive, the CIBSE TM52 assessment was undertaken during the record-breaking heatwave between 10 and 25 July 2022. As presented in Table 4, over 75% of the living rooms were identified as overheated against CIBSE TM52 criteria during the record-breaking heatwave period, which included 83% of the bungalows and all top-floor flats, followed by 50% of ground−floor flats. This indicates that, with the rise in the outdoor temperature in the summer season, more dwellings experience overheating, and therefore, more vulnerable residents and elderlies are likely to be at risk for negative health impacts in addition to discomfort.
Table 4.
Dwellings failed the CIBSE TM52 criteria in the living rooms during the occupied hours (9:00–22:00) in May–September 2022, and the extreme heatwave period of 10–25 July 2022.
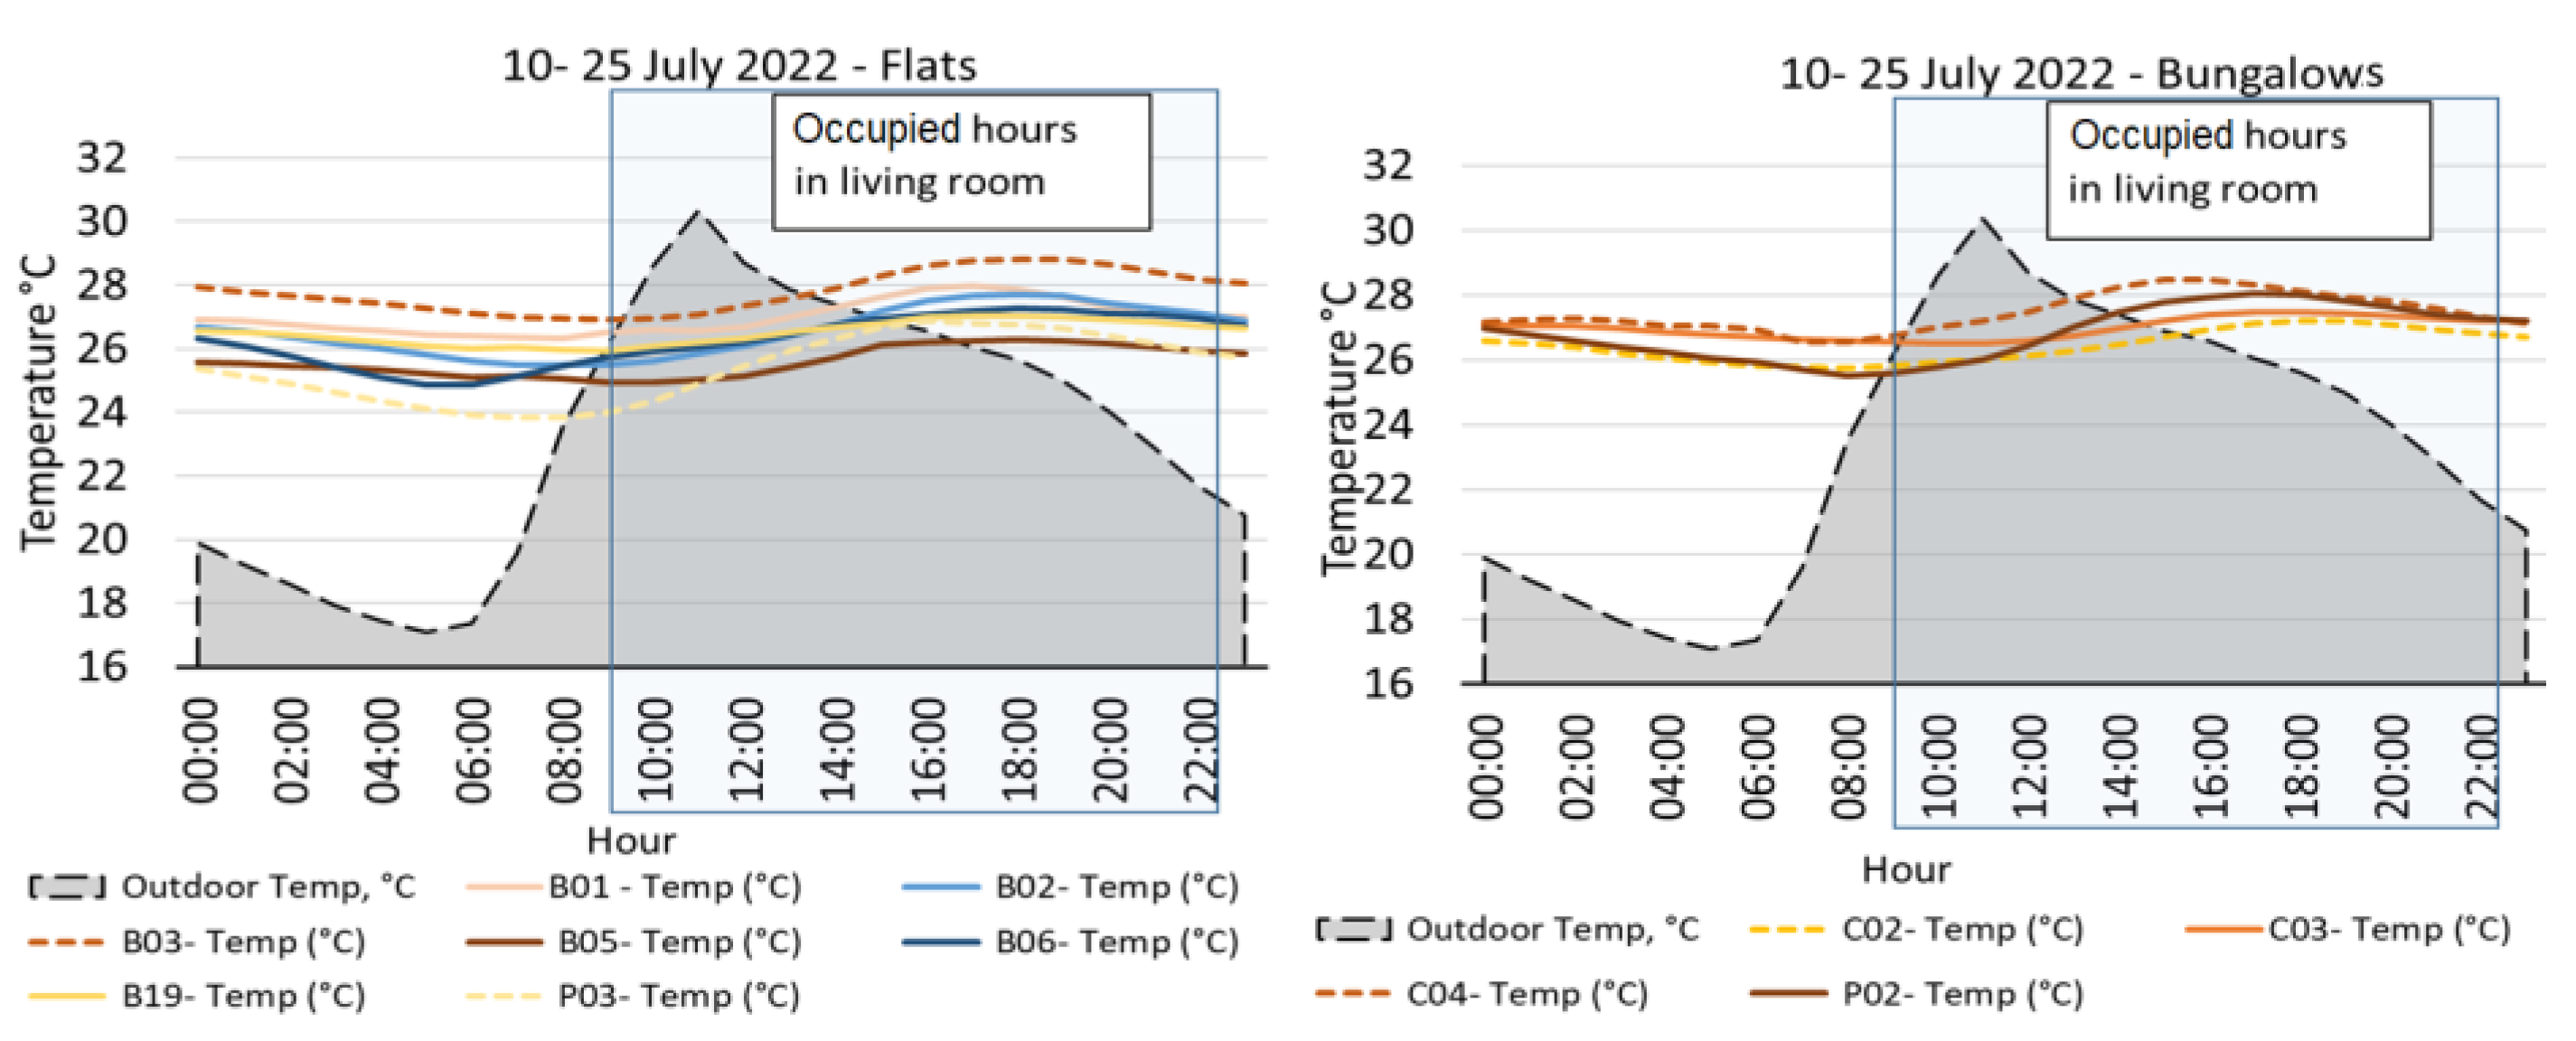
Daily mean indoor temperature profiles (using 15 mine data) were examined during the record-breaking heatwave of 10–25 July 2022 across the flats and bungalows that failed at least two criteria of CIBSE TM52 in May–September 2022 (Figure 7). Although there were wide variations between the mean indoor temperature profiles, as well as for the magnitude of the changes across four bungalows and seven flats, it was evident that the indoor temperature steadily increased during the occupied hours from 9:00 to 20:00 in the majority of the dwellings, with a peak temperature happening between 15:00 and 18:00 when the south-facing façade received strong solar glare. The occurrence of peaks and troughs were found to be similar across the majority of the dwellings, following outdoor temperature trends since the dwellings were naturally ventilated, though the air flow was not adequate to remove excess heat, with the indoor temperature reaching above 28 °C in bungalow C02 and top-floor flat B03. During this period, residents might use electrical cooling systems such as fans to provide comfortable indoor environments, adding to the evening peak period of electricity demand in the UK.
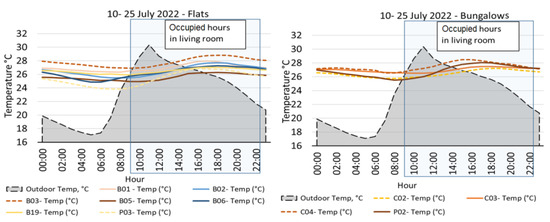
Figure 7.
Mean daily temperature profiles of dwellings that failed CIBSE TM52 criteria in living rooms of flats (left) and bungalows (right) during the occupied hours (9:00–22:00) during the extreme heatwave periods between 10 and 25 July 2022.
4.2.2. Overheating in Bedrooms
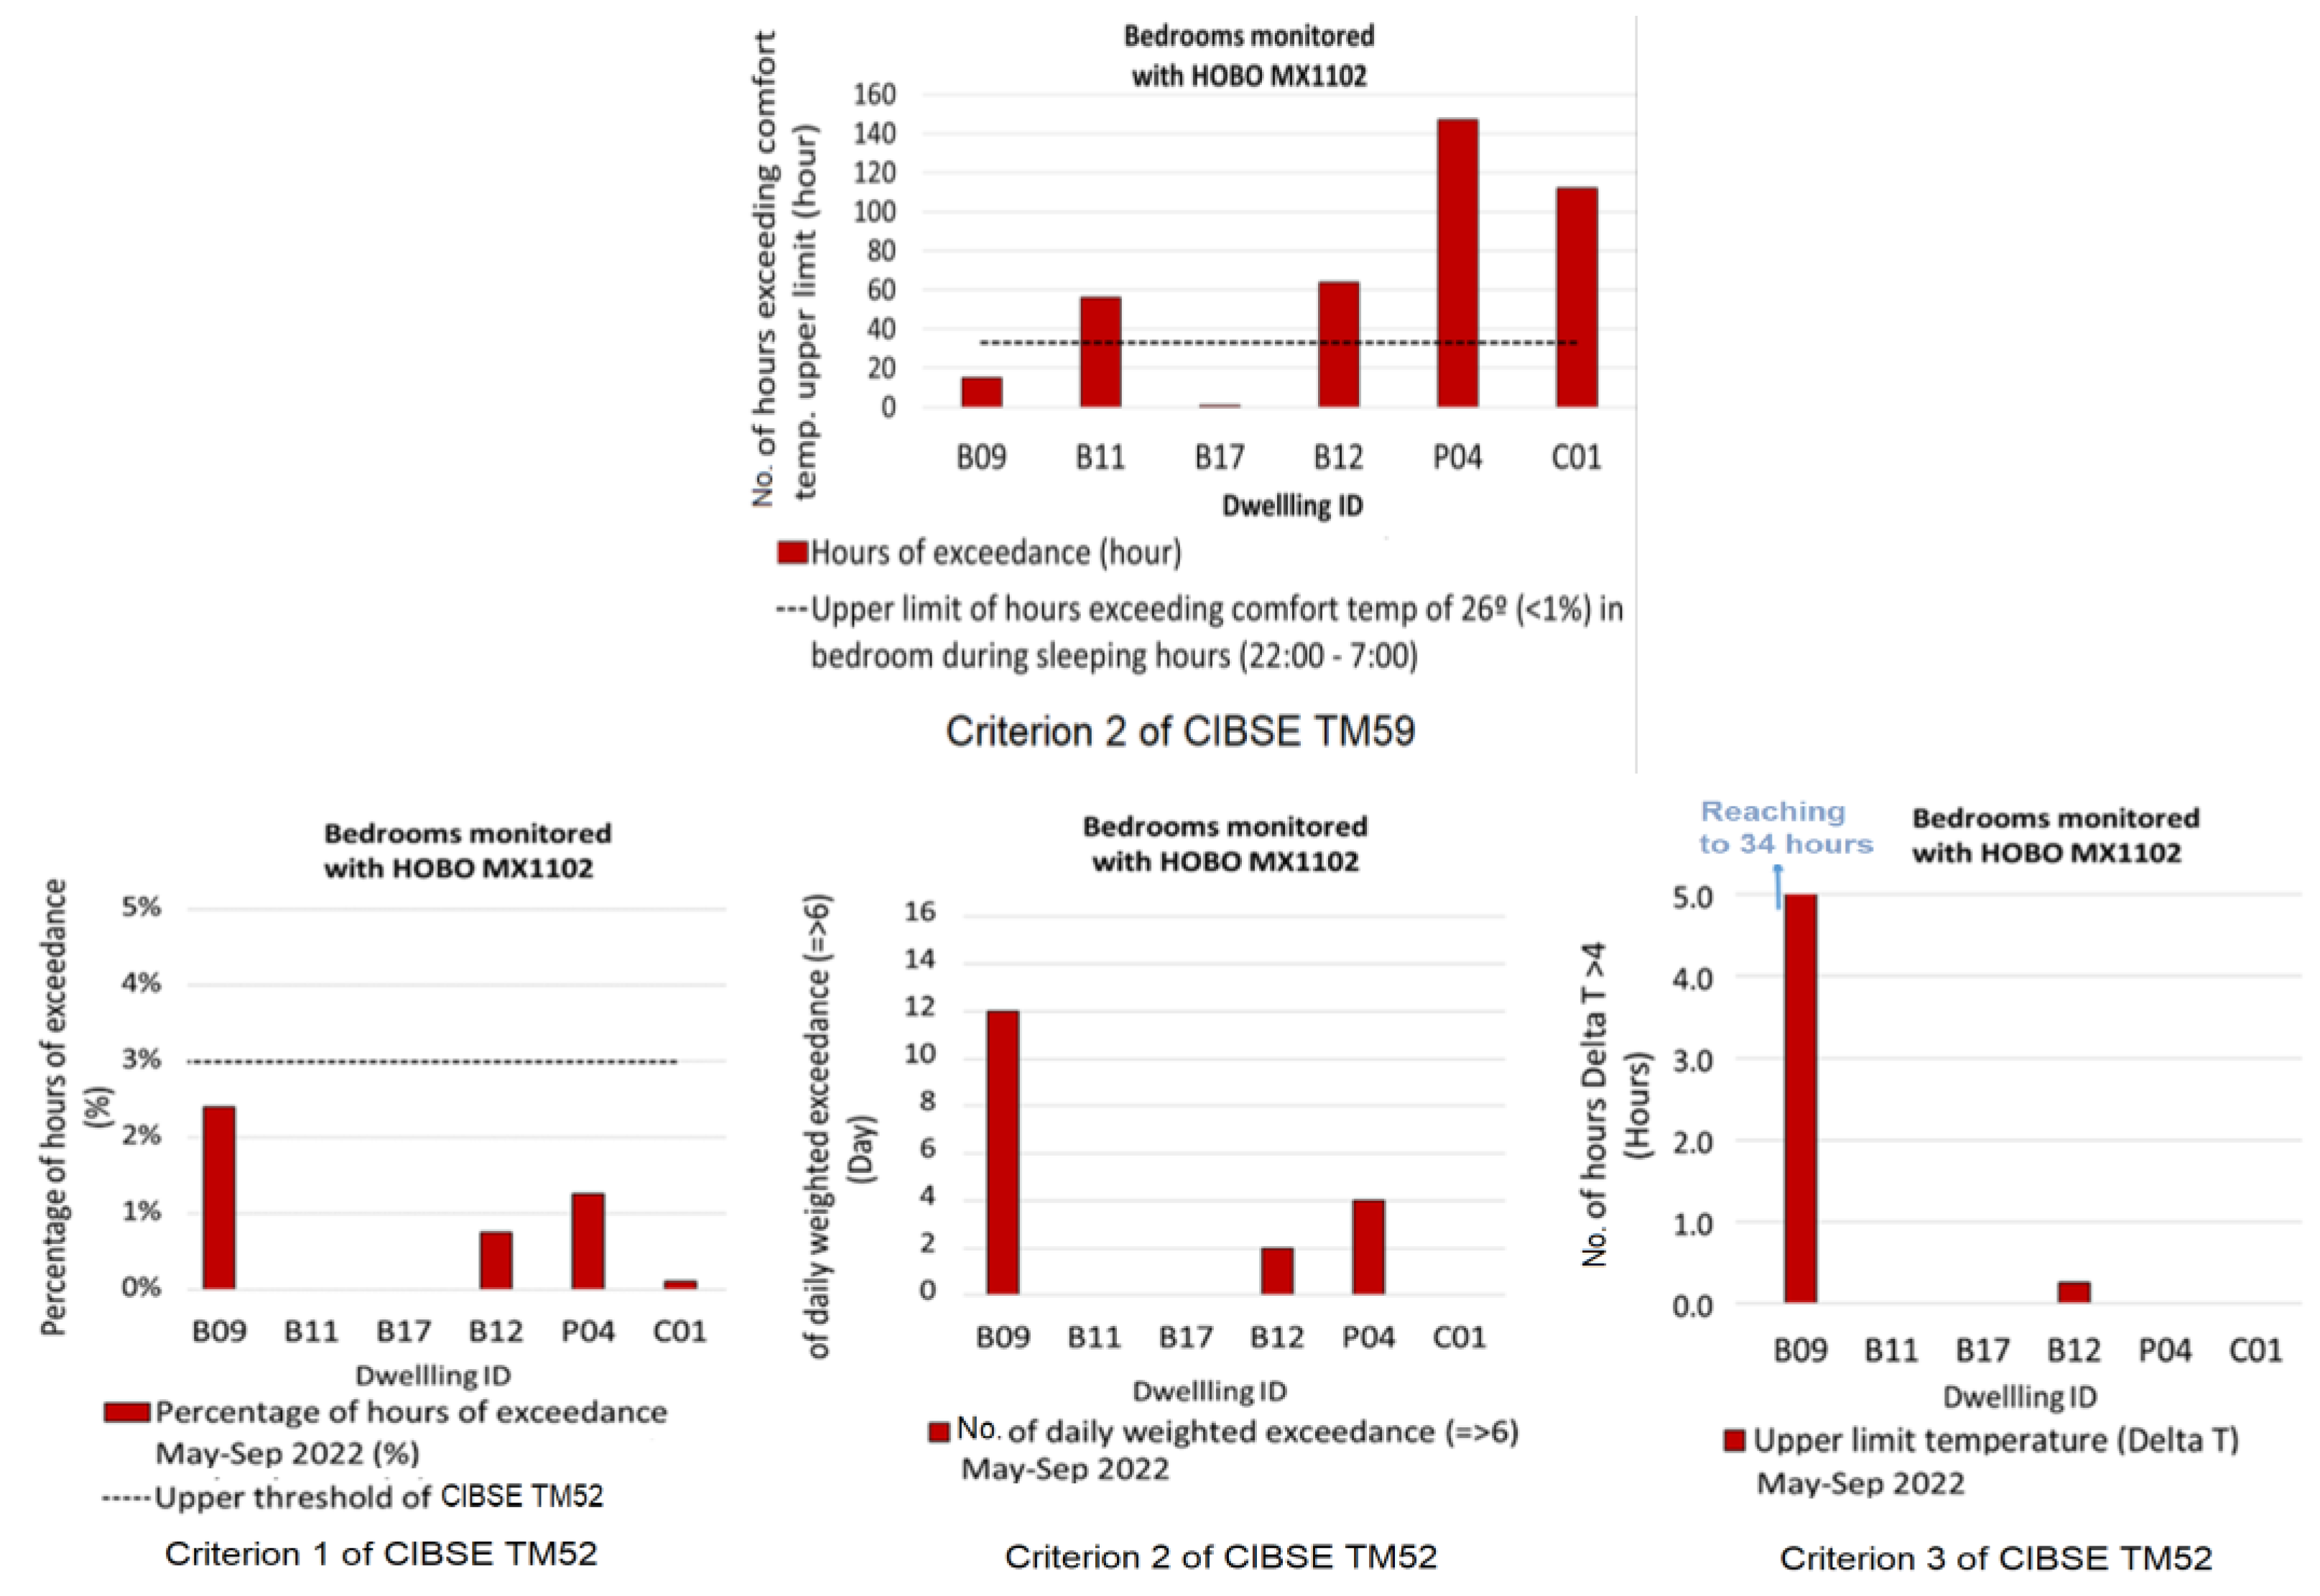
Overheating risk in the bedrooms of six dwellings was assessed against the three criteria of CIBSE TM52 for the period of May–September 2022. Considering the 24/7 occupancy pattern for bedrooms recommended by CIBSE TM59, and with sleeping hours happening between 22:00 and 7:00, the bedrooms of ground−floor flat B09 and top-floor flat B12 (facing west) were classed as overheated (Figure 8, top). The bedroom of flat B09, which received strong afternoon–evening solar glare on the west façade, well exceeded criteria 2 and 3 of the CIBSE TM52 limits, confirming the key role of protecting façades from excess solar glare in summer. However, the CIBSE TM59 assessment identified that five out of six bedrooms were classed as overheated due to exceeding an upper comfort temperature of 26 °C for more than 1% of annual hours in flats B11, B12, and P04 and bungalow C01 (Figure 8, bottom). Interestingly, ground−floor flat B09 passed criterion 2 of CIBSE TM59 during sleeping hours despite failing criteria 2 and 3 of CIBSE TM52, indicating that night-time ventilation was enough to remove excess heat during sleeping hours.

Figure 8.
CIBSE TM52 assessment: percentage of hours of exceedance (criterion 1) (down-left), daily weighted exceedance (criterion 2) (down-middle), upper limit temperature (criterion 3) (down-right), and hours exceeding upper limit of comfort temperature of 26 °C during sleeping hours (criterion 2 of CIBSE TM59) (top) for the bedrooms of six dwellings in the non-heating season of 2022 (May-September).
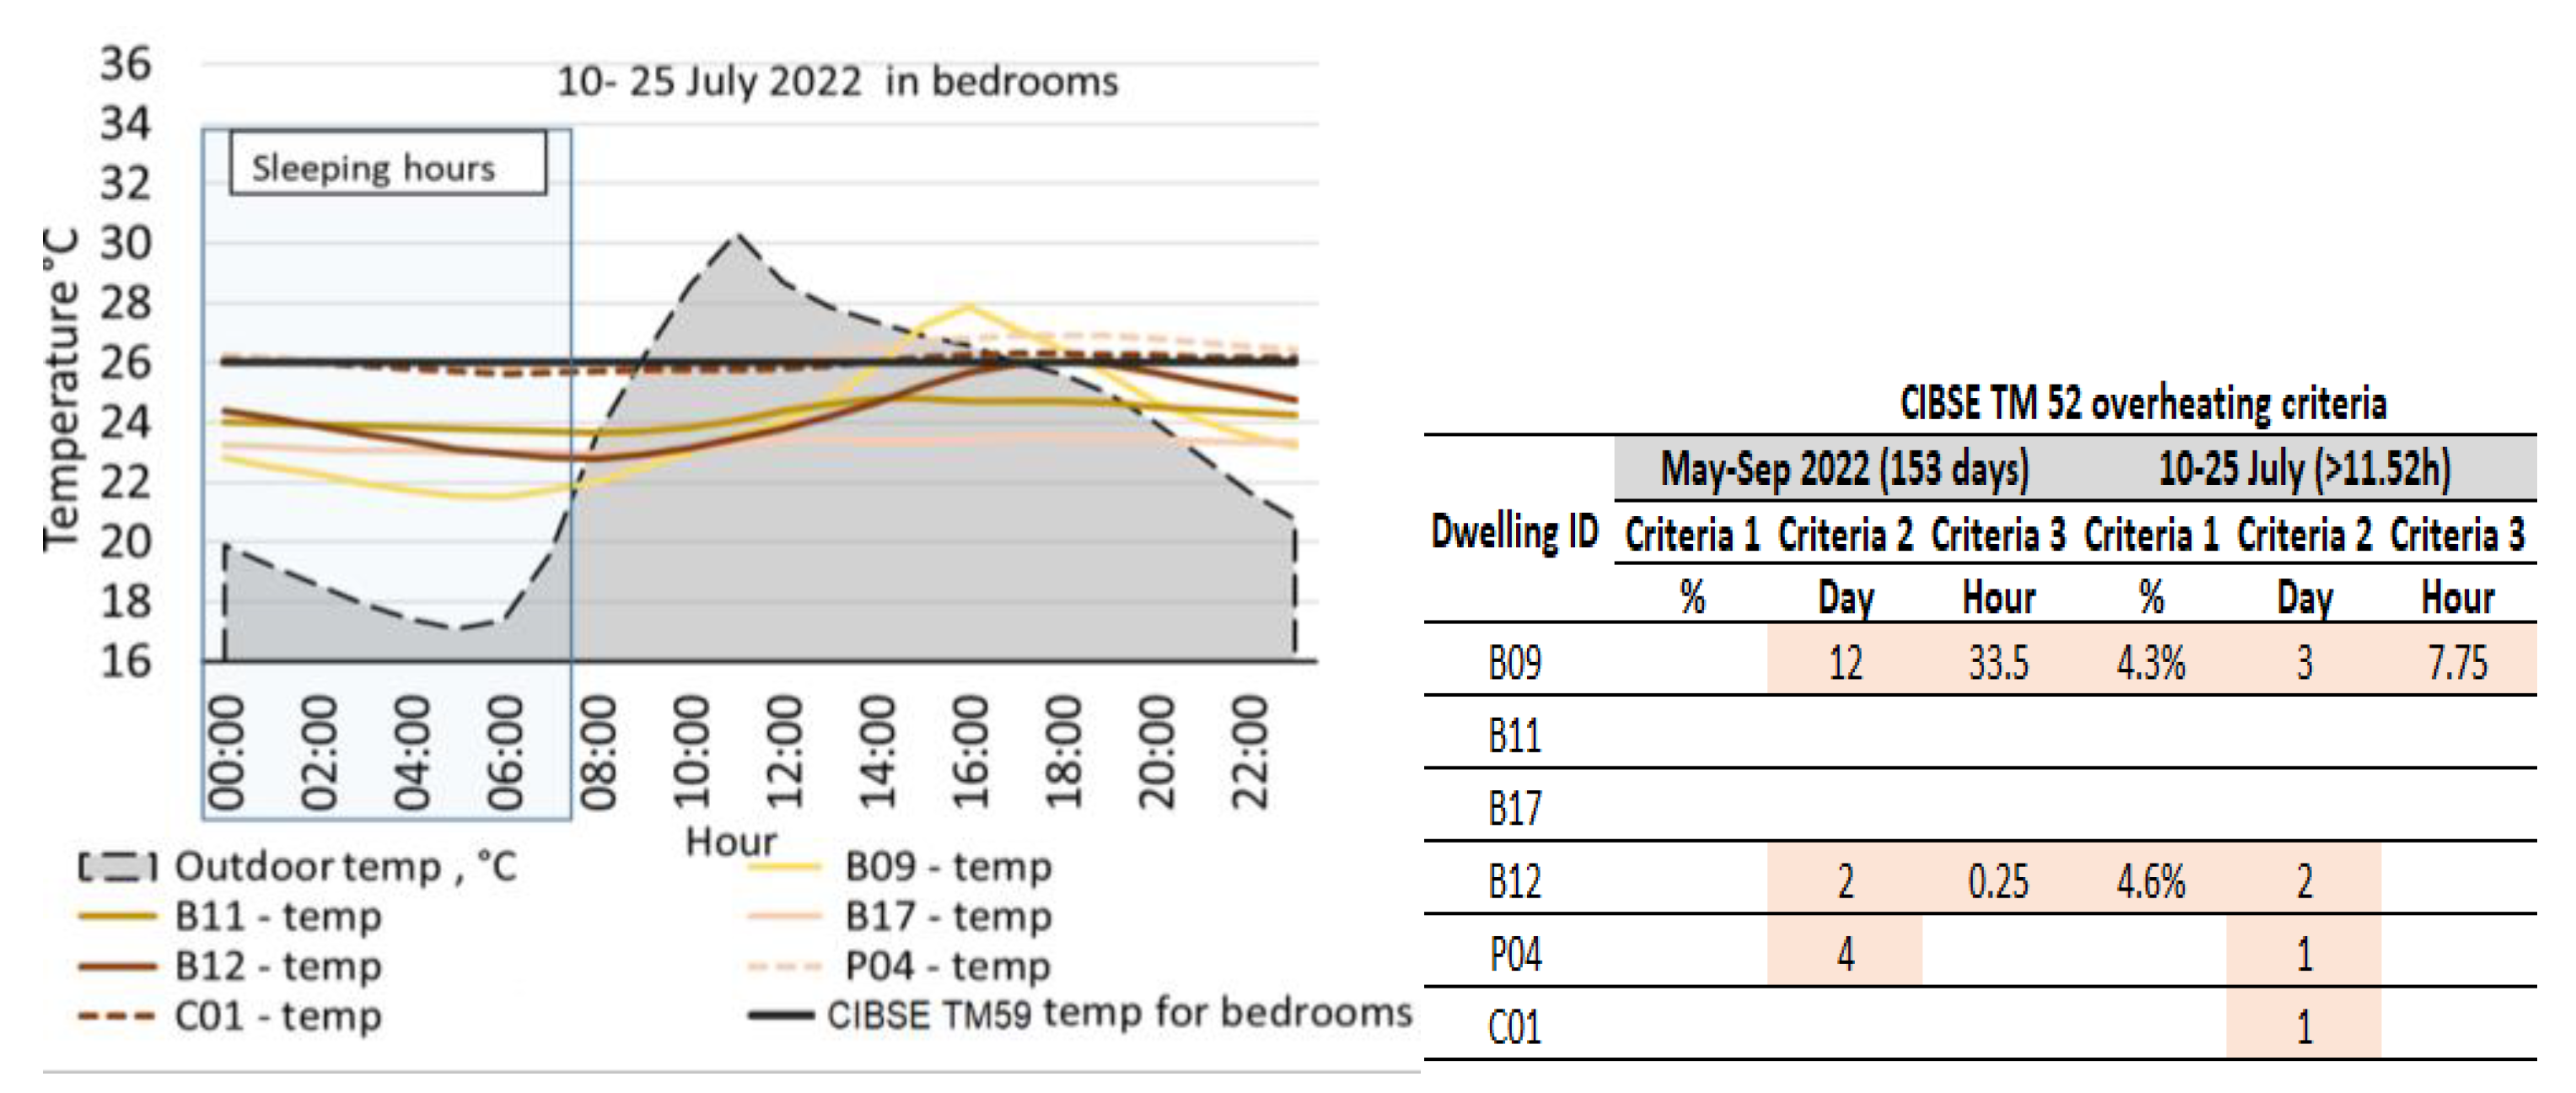
The CIBSE TM52 assessment was undertaken during a record-breaking heatwave between 10 and 25 July 2022, and it identified two overheated bedrooms (ground-floor flat B09 and top-floor flat B11) (Figure 9, right). However, bungalow C01 and top-floor flat P04 failed criterion 2 of CIBSE TM59, exceeding the 1% threshold of the upper comfort temperature limit during sleeping hours (22:00–7:00), indicating that dwellings with upgraded cavity wall insulation are at a higher risk of overheating during an extreme heatwave period. Daily mean temperature profiles were also examined across the bedrooms of the six dwellings during the record-breaking heatwave between 10 and 25 July (Figure 9, left), identifying wide variations across the bedrooms that saw a rise in indoor temperature after 8:00 in the morning, peaking in the afternoon at around 16:00. It was evident that the indoor temperature across flats B09 and P04 and bungalow C01 exceeded the comfort threshold of 26 °C for bedrooms during the unoccupied hours. This is possibly due to limited window opening, inadequate natural ventilation, and strong afternoon solar glare, leading to higher indoor temperatures. The mean daily indoor temperature profiles also confirmed how the strong afternoon–evening sun affected the indoor temperature in the south-facing bedroom of flat P04 and the west-facing bedroom of flat B09, which experienced maximum peak temperatures of 26 °C and 28 °C, respectively.
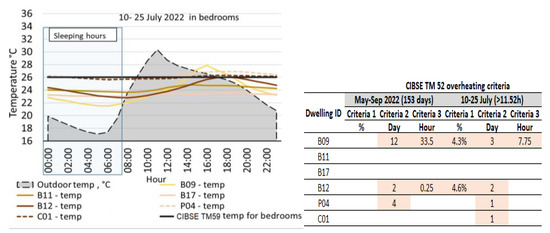
Figure 9.
Mean daily indoor temperature across six bedrooms during the extreme heatwave period of 10–25 July 2022 (left) and CIBSE TM52 assessment for bedrooms (right) during the extreme heatwave period of 10–25 July 2022.
4.3. Air Change Rate (ACH) and CO2 Levels in Bedrooms
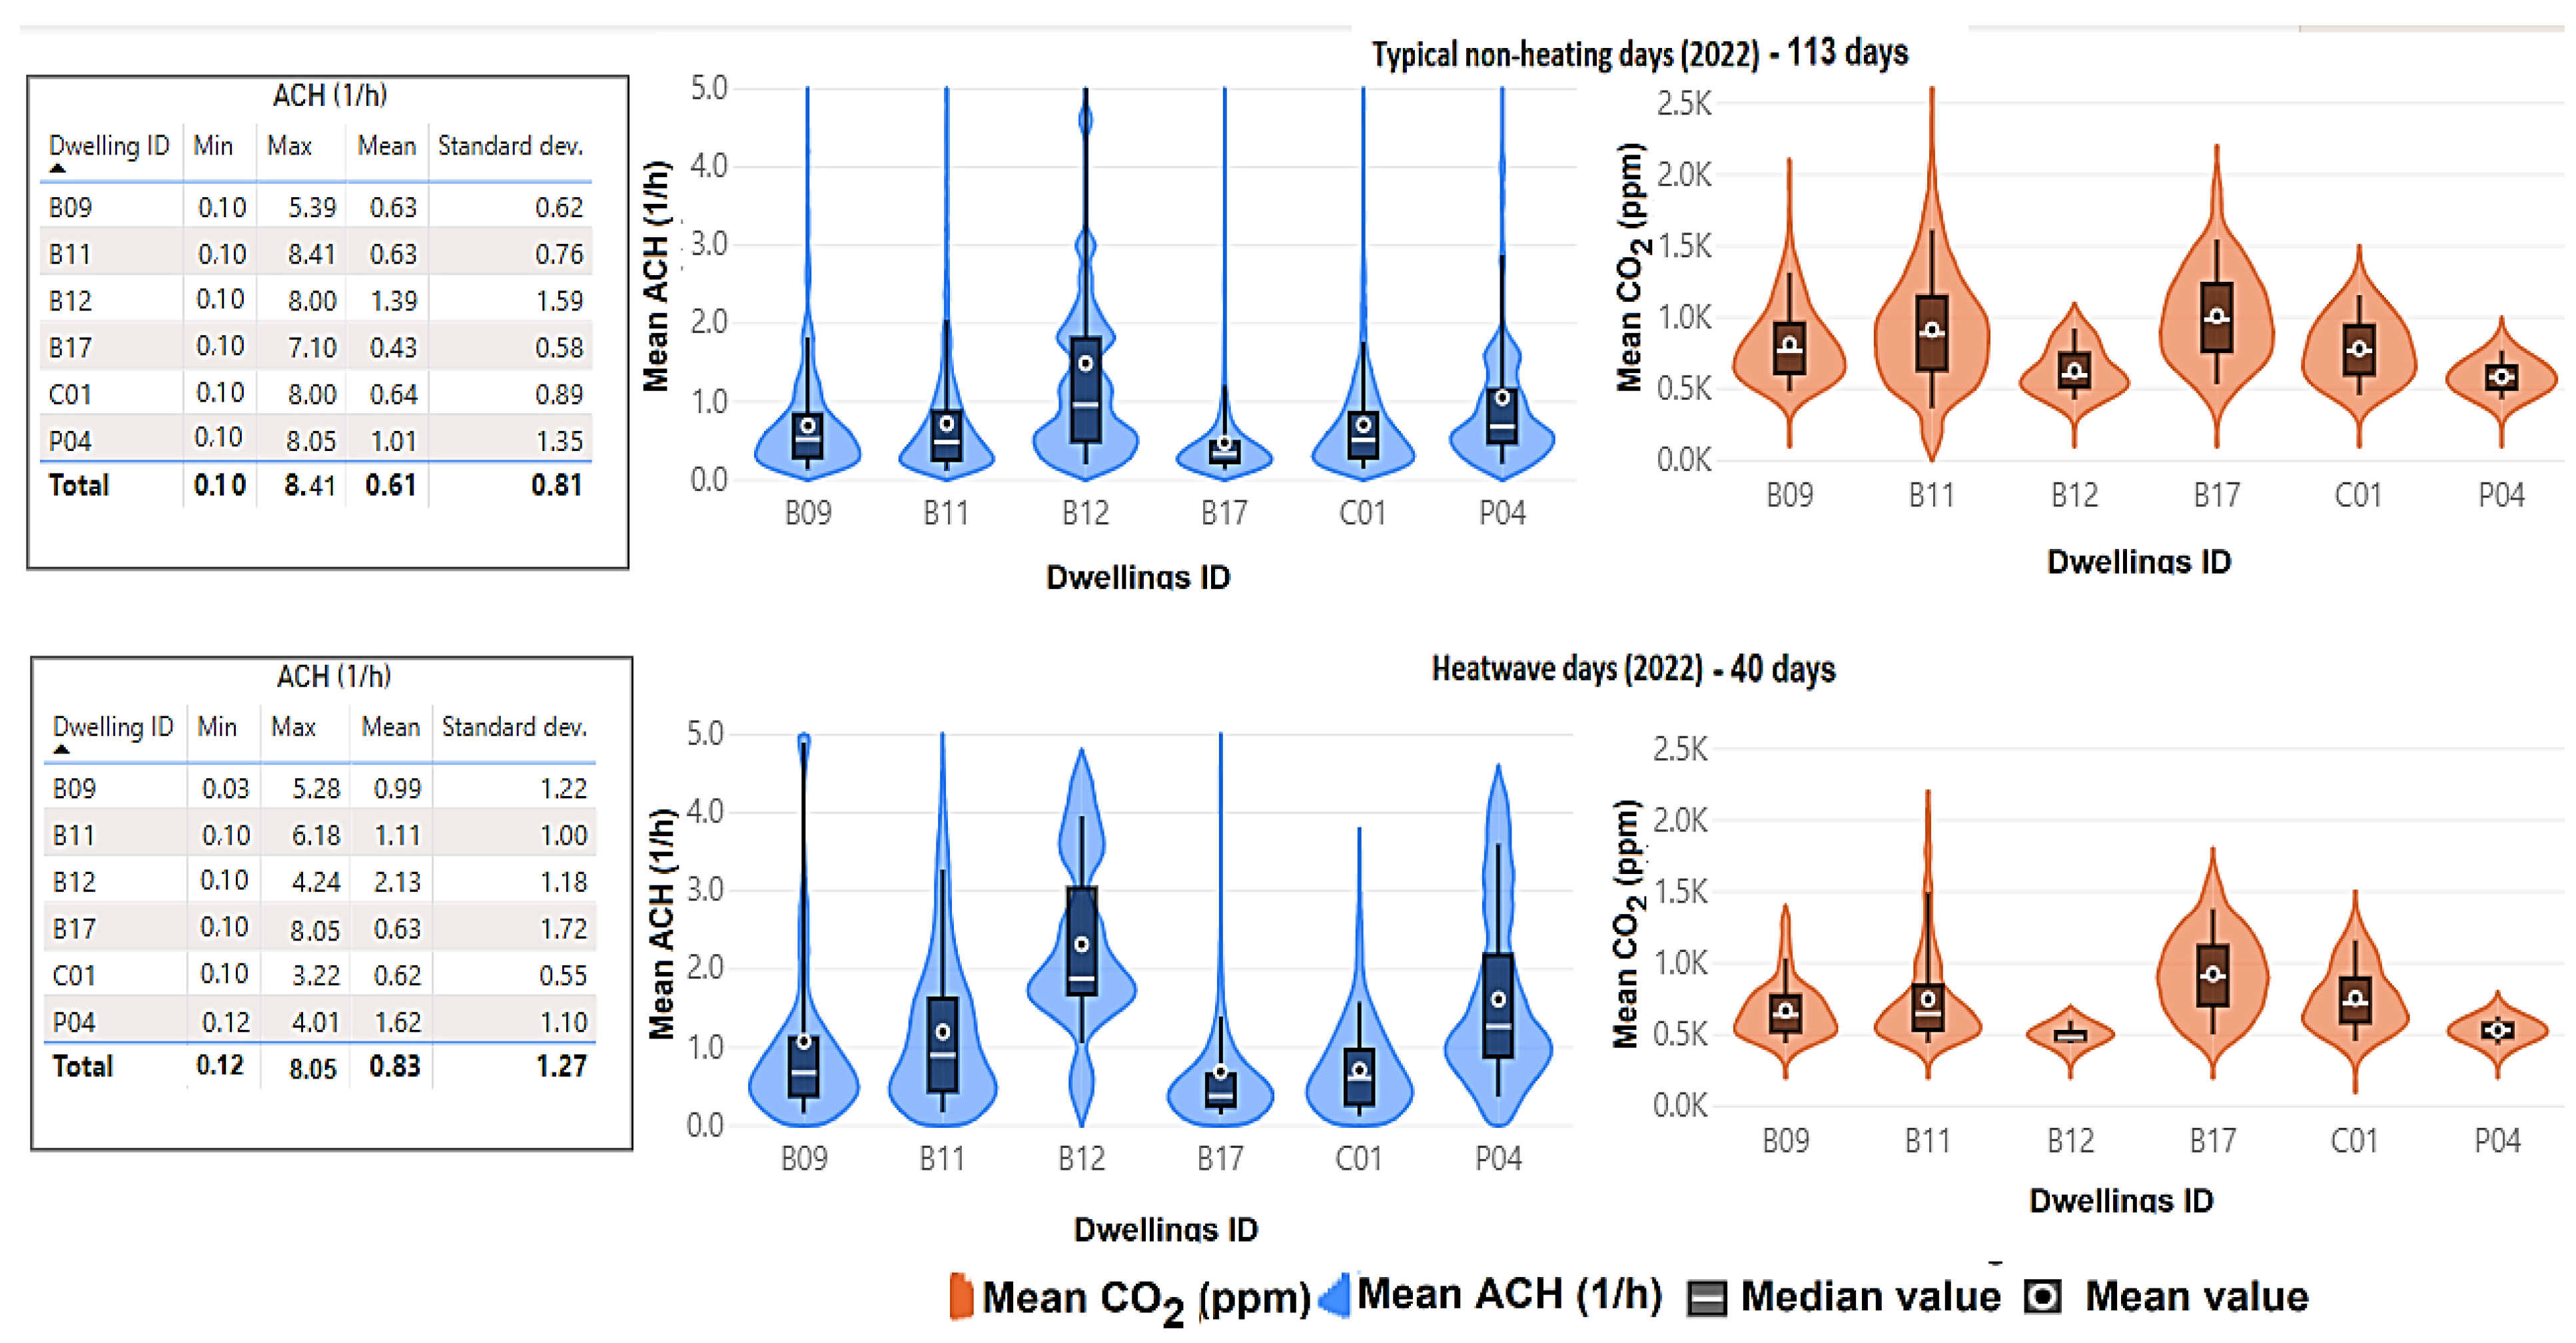
To identify the impact of air change on mitigating overheating risk in dwellings, the air change rate (ACH) associated with ventilation and infiltration was calculated using a CO2-based decay method for May–September 2022 as detailed in the Methods and Case Study section (Section 3.5). The diagnostic analytic was tested by López-García, Lizana [42] on three dwellings during the summer periods. This assessment was carried out for the bedrooms of six dwellings that were continuously monitored with HOBO MX1102 devices (i.e., flats B09, B11, B12, B17, and P04 and bungalow C01). The distribution of CO2 levels (ppm) and the calculated ACH during May–September 2022, as well as the descriptive statistics of ACH during (a) non-heatwave days (113 days) and (b) extreme heatwave periods (40 days) in the May–September period, are presented in Figure 10 below. The mean CO2 levels were at the highest level and above 850 ppm where the dwellings experienced a mean ACH of 0.4 to over 0.6 , indicating poor ventilation, as observed in flats B09, B11, and B17 with mean values ranging between 0.6 and over 1.1 during the heatwave days, showing differences between residents’ behaviour.

Figure 10.
Distribution of indoor CO2 levels (ppm) and ACH () of the monitored bedrooms during typical non-heating days of 2022 (113 days) (top) and heatwave days of the non-heating season of 2022 (40 days) (bottom) across the six dwellings.
During the heatwaves, the mean ACH values in flats B09 and B11 increased to over 1 from 0.6 , which was observed during non−heatwave days. The rise in the ACH in these flats during hot days reduced the mean CO2 level to below 550 ppm from over 850 ppm. Despite this, flat B09 experienced overheating in bedrooms, indicating the possible impact of limited window opening, poorly insulated building envelopes, and a lack of shading devices, especially for west-facing glazing. CO2 levels stayed above 900 ppm in flat B17 during both periods, with no significant changes identified in the mean ACH rate, which increased to 0.6 from 0.4 , although the flat passed the criteria of CIBSE TM52 and CIBSE TM59, possibly due to the observed internal shading devices. On the other hand, flats B12 (facing west) and P04 (facing south) experienced the highest mean ACH during the heatwave period (2.13 and 1.62 , respectively) with a mean CO2 level of 500 ppm. Despite this, the flats failed criterion 2 of CIBSE TM59. This was possibly due to the lack of shading devices to prevent the build−up of excess heat and limited window opening.
Window Opening State
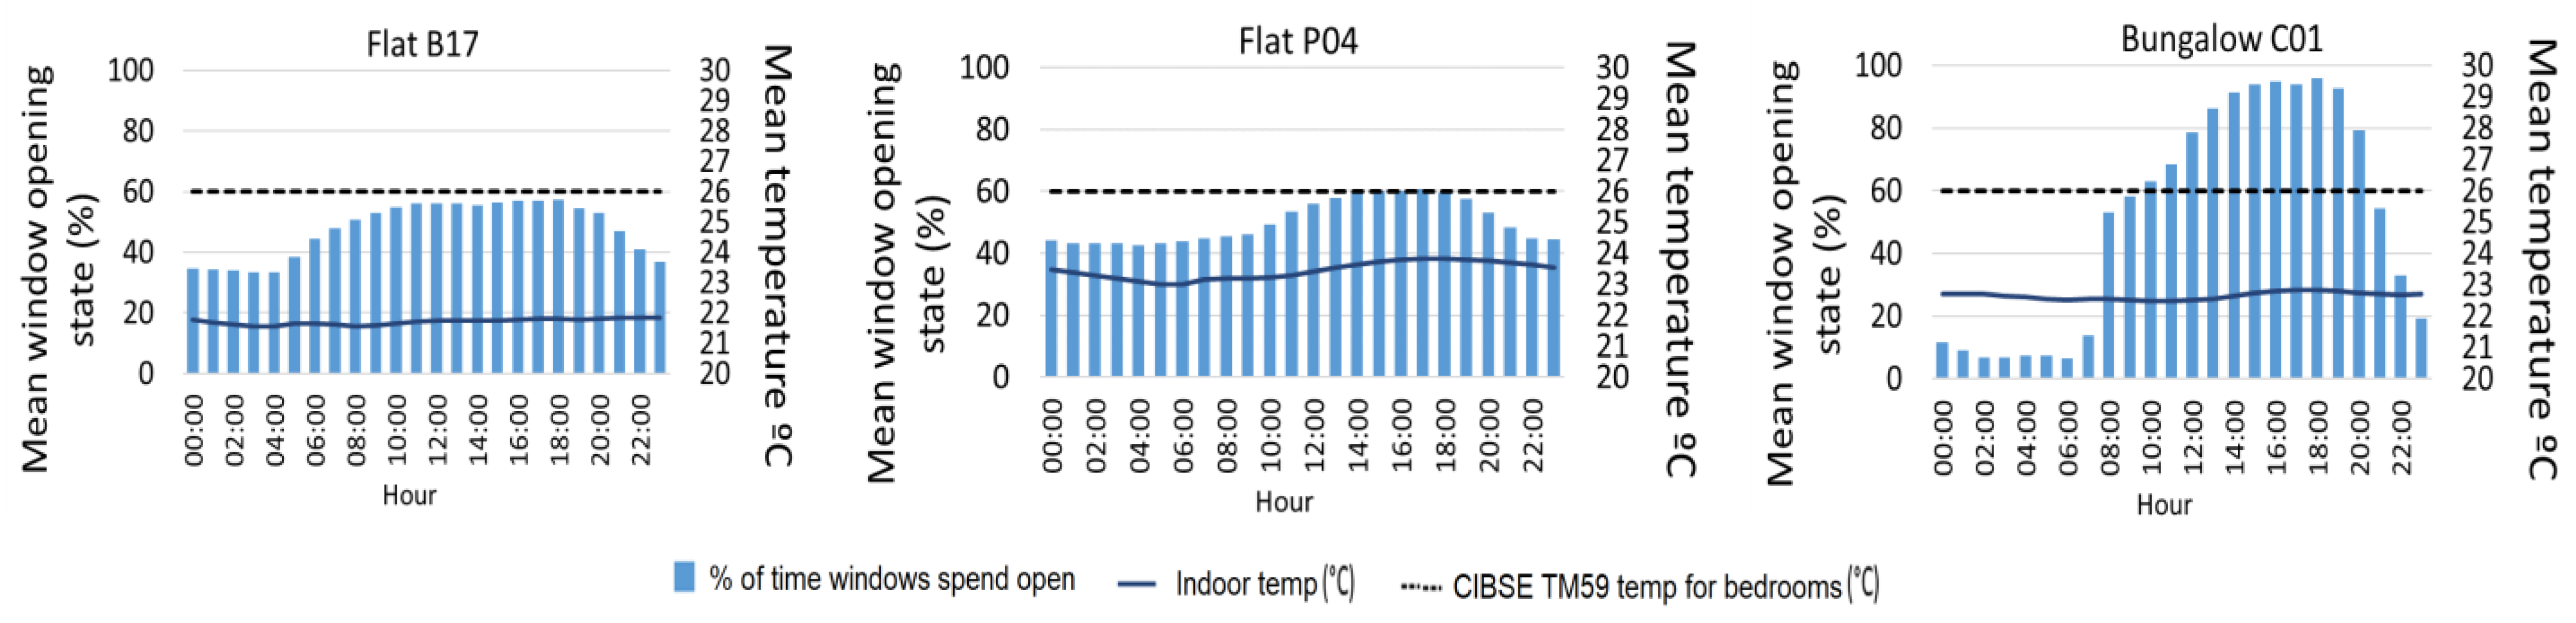
The impact of residents’ window opening behaviour was monitored in a subset of three dwellings in the bedrooms during the non-heating season of 2022 to relate the effect of the air change rate (ACH) and window opening state. The window opening profiles of the three dwellings (i.e., flats B17 and P04 and bungalow C01) that are presented in Figure 11 identified a wide variation between the residents’ window opening behaviour in relation to outdoor temperature.
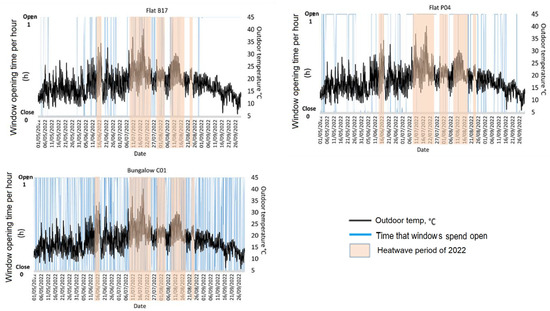
Figure 11.
Window opening state profiles over an hourly course per day during the non-heating season of 2022 (May–September) in bedrooms across a subset of three dwellings.
Whereas the residents of flats P04 and B17 frequently kept their windows open during the summer and the heatwave periods that happened between June and August, the resident of bungalow C01 regularly tended to open and close the windows, regardless of the heatwave periods that happened (Figure 11). In contrast, flat P04 was found to increase the window opening periods during heatwave days, possibly to increase natural ventilation in order to remove excessive heat, as the air change rate (ACH) assessment also found. However, despite the increase in the window opening periods in this flat during the heatwave periods, the bedroom experienced overheating in line with the CIBSE TM59 assessment methods, indicating that natural ventilation was not adequate on its own. Interestingly, flat B17 passed the CIBSE 59 overheating assessment for its bedroom during the record-breaking heatwave in 10–25 July despite a mean ACH of 0.62 , which is lower than the value of 1.63 that was identified in flat P04. This was possibly due to internal shading devices that were observed during site visits.
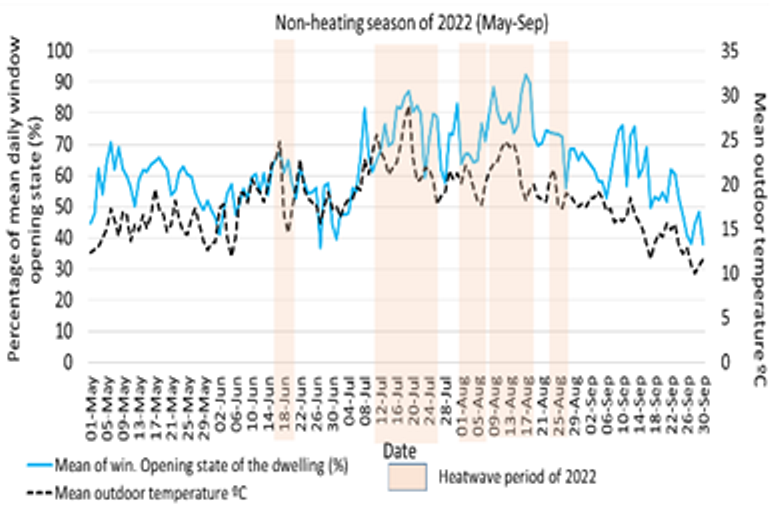
The mean daily window opening state (%), the mean difference between outdoor and indoor temperature (−, °C), and the mean outdoor temperature during May–September 2022 presented in Table 5 confirm that residents’ window opening behaviour was subject to outdoor temperature, with principal windows being largely opened during the heatwave periods. However, since flat P04 and bungalow C01 experienced overheating in their bedrooms, it is likely that the combination of window/bedroom orientation, window opening state, type of shading devices, and energy efficiency of the building envelope affected the indoor temperature. This is notable in flat P04 (south-facing) with no shading device and a mean window opening state of 50%, which failed criterion 2 of CIBSE TM59, as compared to flat B17 (south facing) with an interior shading device and always−open windows that met criteria 1 and 2 of CIBSE TM59. Although the bedroom’s window was kept open for over 50% of the May–September period in well−insulated bungalow C01 (facing north–east), the bungalow experienced overheating in the bedroom, indicating the effect of improved cavity wall insulation in retaining heat.
Table 5.
Temperature difference between indoor and outdoor environment, principal window opening ratio (left), mean window opening ratio, and outdoor temperature profile (right) during the non-heating season of 2022 with heatwaves.
The mean daily indoor temperature profiles and mean window opening states observed across the bedrooms of the three dwellings during the non-heating season of 2022 (May–Sep) confirm variations in residents’ window opening behaviour, as presented in Figure 12, indicating how resident preferences in opening the windows affected the indoor temperature. It was apparent that keeping windows open in flat B17 could keep the mean indoor temperature well below the recommended temperature of 26 °C for bedrooms, possibly due to internal shading devices. Although the windows were kept open around 50% of the time in bungalow C01, rising to above 80% during the day-time from 12:00 to 20:00, the bedroom was classed as overheated despite facing north−east. This was possibly due to limited window opening overnight and a lack of night-time ventilation to remove excess heat. This was particularly vital in dwellings with the upgraded cavity wall insulation.
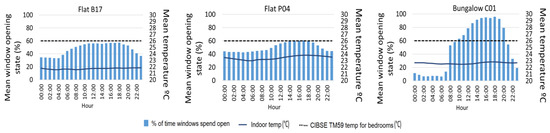
Figure 12.
Mean daily window opening states and indoor temperature profiles across three dwellings during the non-heating season of 2022 with heatwaves.
In line with the impact of the window opening state and natural ventilation on indoor temperature, indoor CO2 levels were found to correlate with the window opening period across the three dwellings, as presented in Table 6. The moderate-to-strong negative correlations between the mean daily indoor CO2 level and window opening state (−0.6 < R < −0.8) across the three dwellings confirm the significant influence of the window opening state on removing indoor CO2, as compared to the weak-to-moderate positive correlations between the mean daily indoor temperature and window opening state (0.3 < R < 0.4). This indicates that, although opening windows for an extended period can help to improve indoor air quality in bedrooms, it can increase overheating risk during times when excessive solar gain is expected. This implies the key role of implementing passive design strategies in preventing solar gain during the non-heating season. The moderate−to−strong correlation that was identified between indoor and outdoor temperatures (0.5 < R < 0.6), as well as outdoor temperature and window opening state (0.9 < R < 1.0), imply why solar heat gain through building envelopes and heat retention through shading devices may have a stronger impact on indoor temperature than natural ventilative cooling.
Table 6.
Mean daily window opening ratio in relation to indoor temperature and CO2 levels during May–Sep 2022 and the record-breaking heatwave period in 10–25 July.
4.4. Passive Performance Assessment
The thermal performance in the bedrooms of a subset of six dwellings was examined through a heat balance map by dividing building performance into four thermal stages. The map was developed according to the positive and negative influence of the total heat flux (±), as well as ventilation and infiltration load (±), as detailed in the Methods and Case Study section (Section 3.5).
As presented in Table 7, 4% to over 8% of the monitored period in bedrooms fell within stage 1 on heat modulation due to the thermal mass opportunity. This indicates that the majority of the dwellings did not have the advantage of thermal mass to hold heat during the day-time and release it at night, when night-time natural ventilation can purge excess heat and cool the building fabric, helping to reduce peak day-time temperatures. On the other hand, 10% to 44% of the monitored period fell within thermal stages 2 and 3 on solar and heat gain, with the majority covering stage 3 (37% to 44%), implying a high solar gain, inefficient building envelopes, and poor natural ventilation in removing excess heat. When dwellings fell within stages 2 and 3, the mean ACH rate was found to be between 0.5 and 2.5 across the dwellings that experienced overheating in their bedrooms, failing criterion 2 of CIBSE TM59 (Table 7). This indicates that, although flats P04 and B12 experienced higher ACH rates of 1.5 and 2.5 in their bedrooms, respectively, than those of flat B11 and bungalow C01, with mean ACH rate of 0.5 to 0.9 , all dwellings experienced overheating in their bedrooms, indicating that natural ventilation was not adequate to cool down the bedrooms, and further action needs to be taken to improve building performance in summer months, such as installing external shading devices. As is evident, flat B17 did not experience overheating in its bedroom during the non-heating season of 2022 despite a low mean ACH rate of 0.4 to 0.6 , which was observed in thermal stages 2 and 3. This was possibly due to internal shading devices that were installed in the flat to control solar glare.
Table 7.
Mean ACH rates and indoor temperature per thermal stage (top), and heat balance map (bottom) across the bedrooms of six dwellings in the non-heating season of 2022.
Interestingly, across the bedrooms, 30% to over 47% of the monitored period fell within stage 4 on heat dissipation during the May–September 2022 period. Despite this, the majority of the dwellings experienced overheating in their bedrooms, indicating that ventilative cooling in summer is not enough to remove excess heat from the bedrooms.
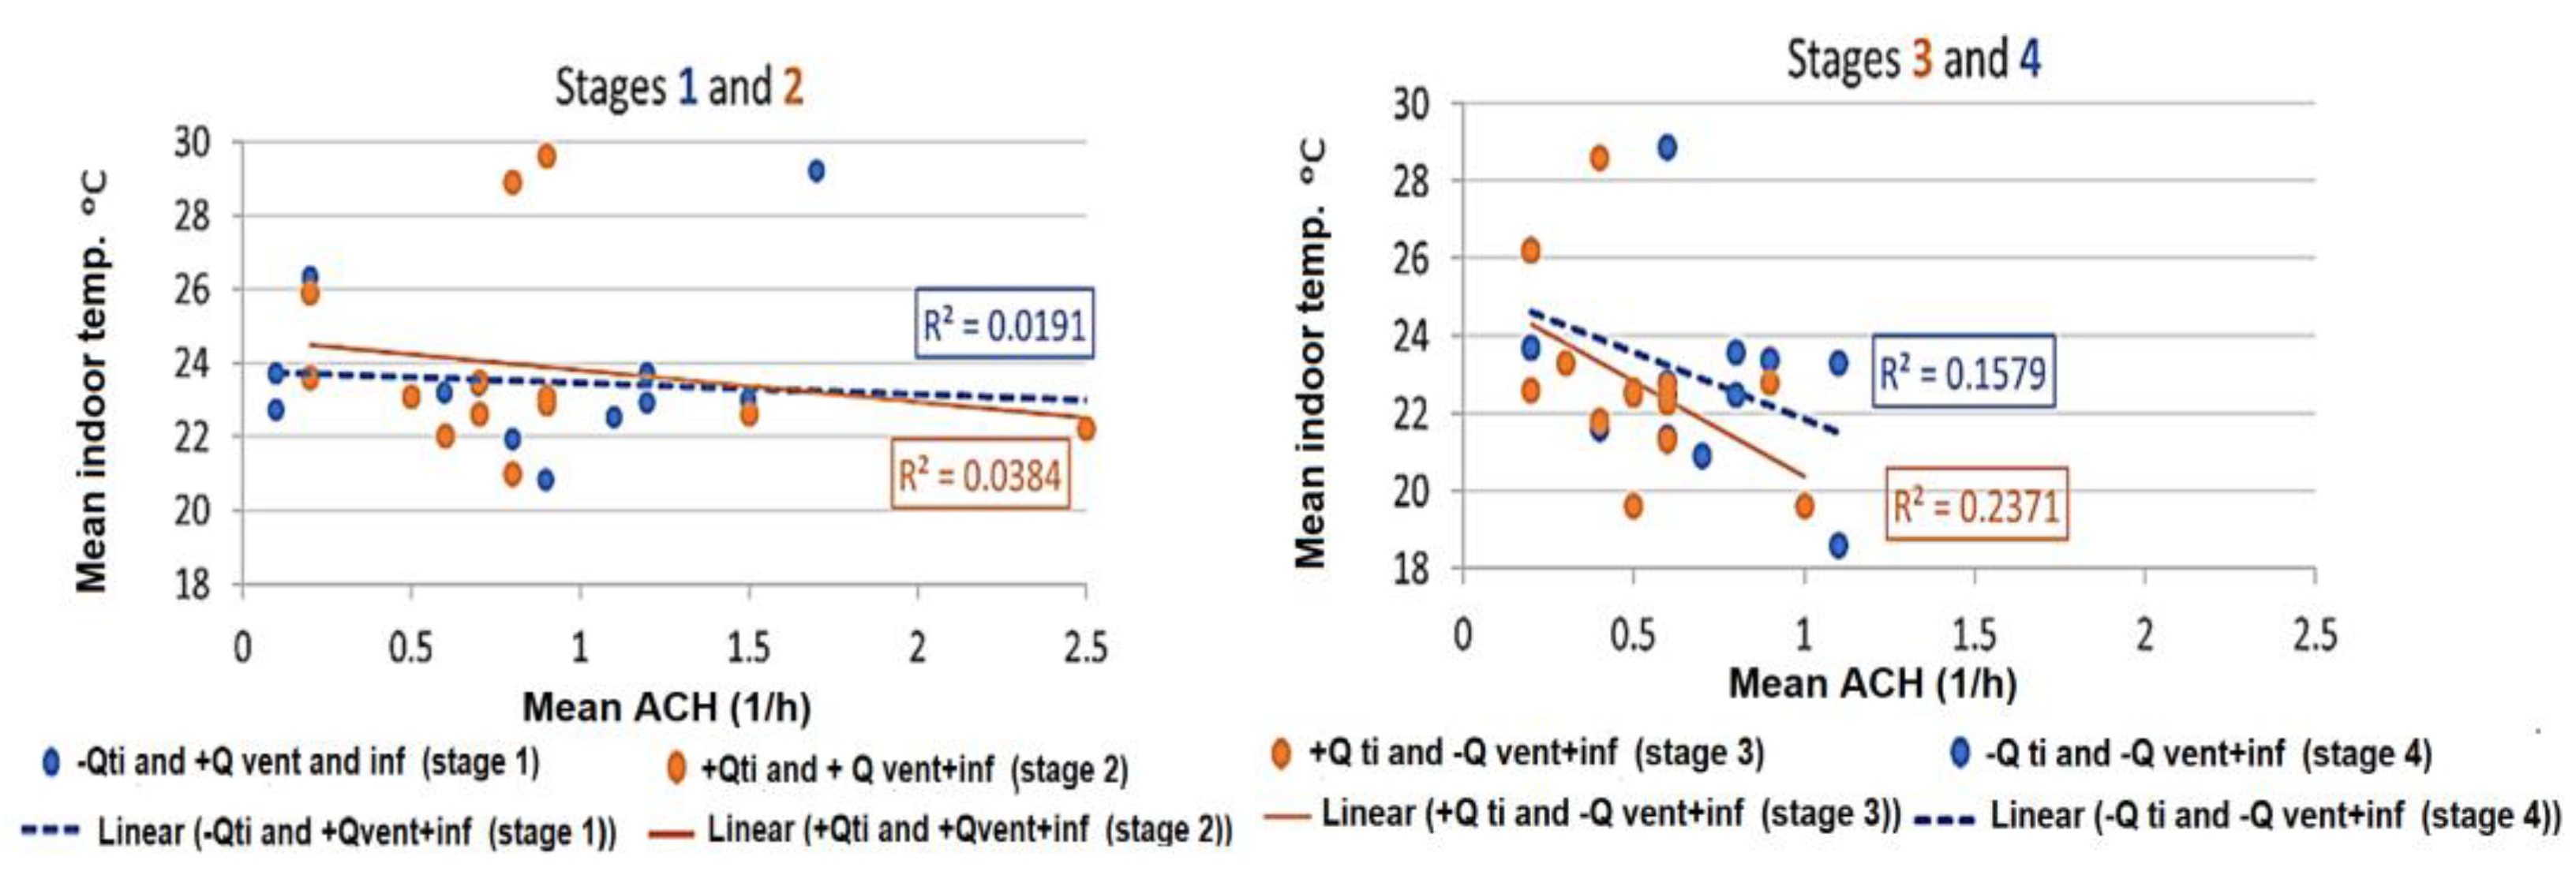
Figure 13 presents the association between the mean indoor temperature and the mean ACH in bedrooms across the subset of six dwellings, with thermal stages 1 and 2 (left) on heat modulation and solar and heat gain, as well as thermal stages 3 and 4 on solar and heat gain and heat dissipation, identifying moderate negative correlations (0.4 < R < 0.5) in stages 3 and 4. This indicates that the majority of dwellings had the benefit of favourable natural ventilation in removing excess heat when the outdoor temperature was lower than the indoor temperature, although some dwellings experienced overheating in stage 3, implying the lack of shading devices to avoid solar heat gain in summer. A very weak negative correlation between the mean ACH and the mean indoor temperature in stages 1 and 2 shows that, when the outdoor temperature was higher than the indoor temperature, natural ventilation on its own was not enough to remove excess heat.
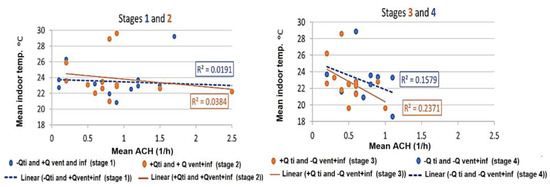
Figure 13.
Correlation between mean indoor temperature and ACH in thermal stages 1 and 2 when outdoor temperature was higher than indoor temperature (left) and in thermal stages 3 and 4 (right) when outdoor temperature was lower than indoor temperature.
4.5. Thermal Comfort Survey
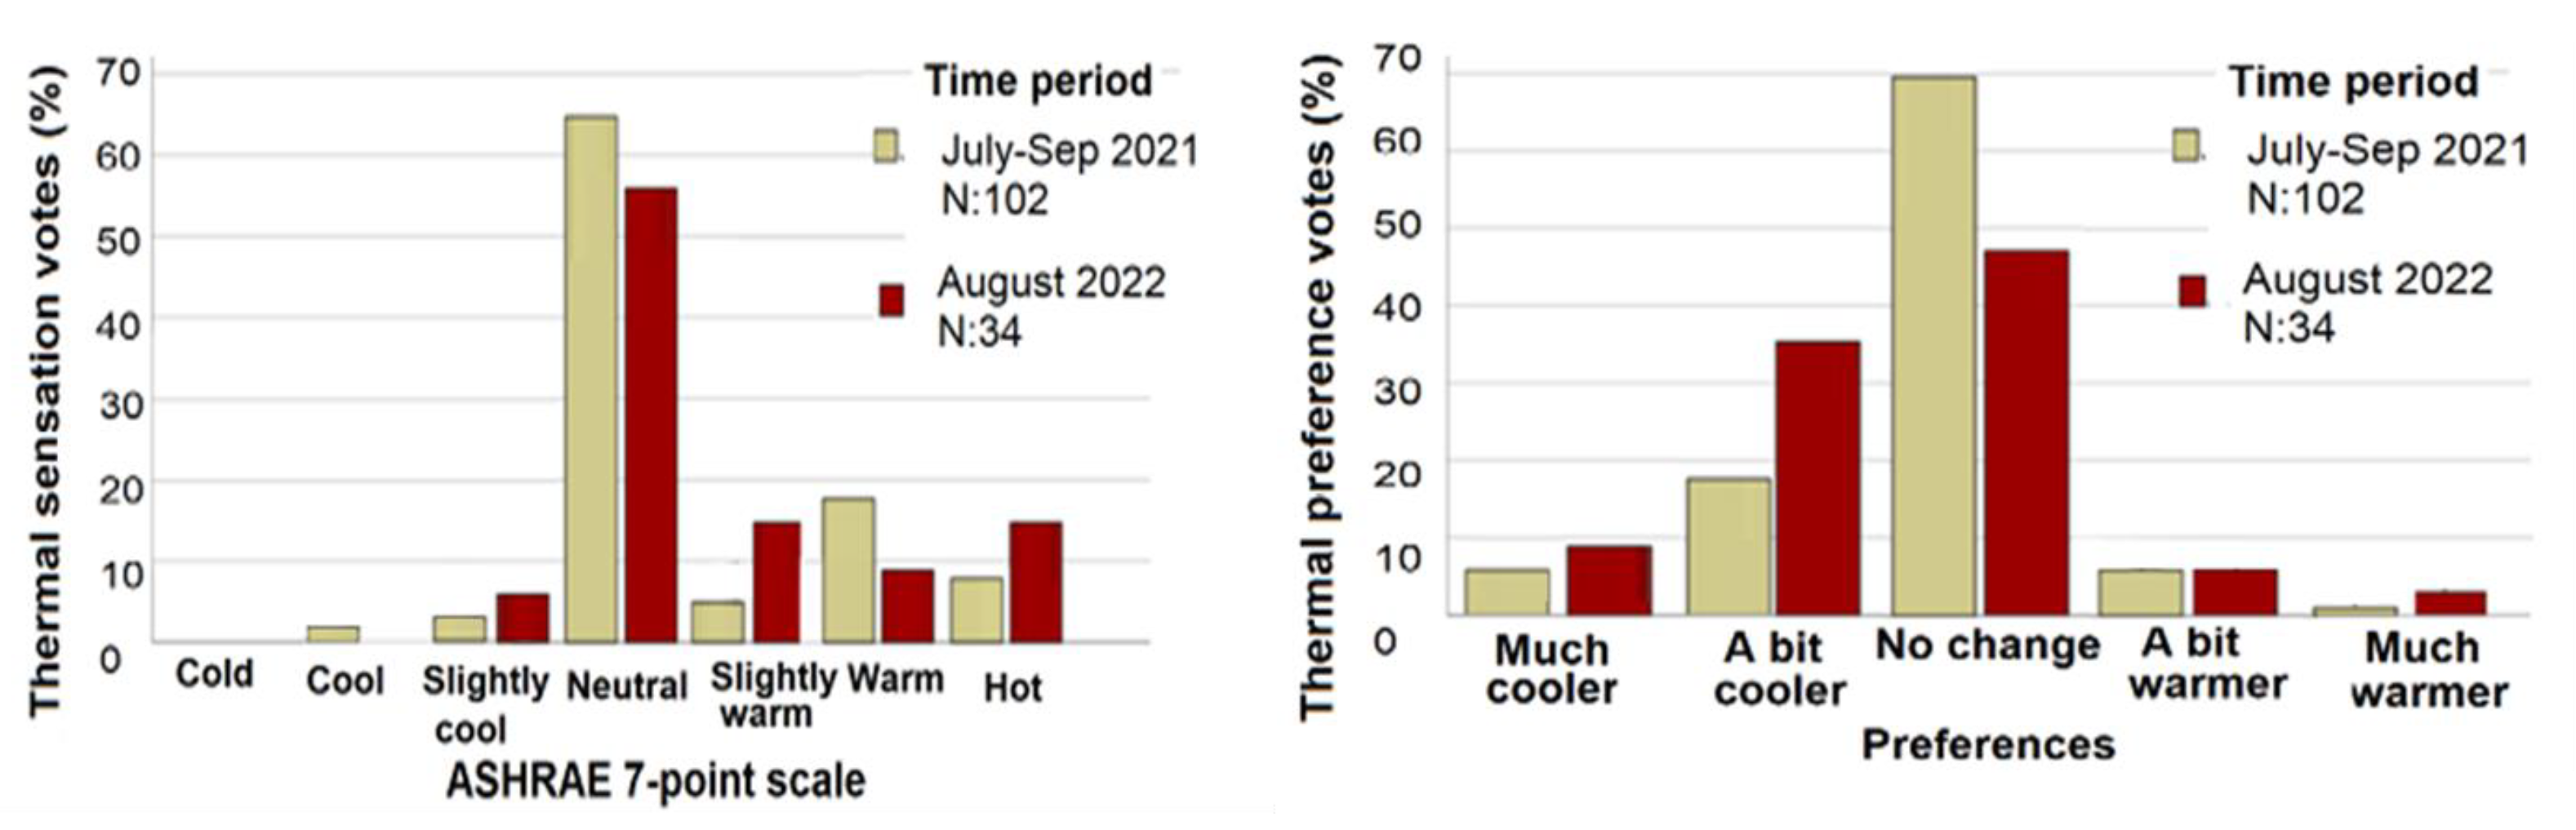
The insights obtained from examining the monitored indoor environments across the 24 dwellings over the two summers were supported by the responses of residents of a subset of 22 dwellings (Figure 14). The surveys were conducted in the living rooms of the dwellings, gathering 102 and 24 responses in 2021 and 2022, respectively. The indoor temperature was recorded simultaneously using an Extech device, showing a mean indoor temperature of 26 °C in summer 2021 (varying between 21 °C and 32 °C), as compared to summer 2022, which saw a 5% increase in the mean indoor temperature, which was observed at 27 °C and over during the heatwave periods in August 2022.
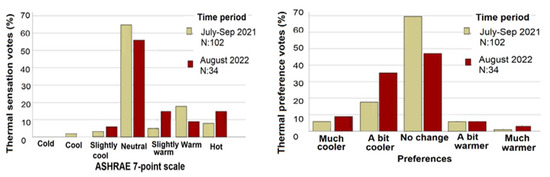
Figure 14.
Residents’ thermal sensation votes using 7-point ASHRAE scale (left), residents’ thermal preference votes (right) during the thermal comfort survey in typical summer of 2021 and during summer 2022 with heatwave.
Although the observed mean indoor temperature in summer 2022 increased by 5%, as compared to the typical summer in 2021, the majority of the residents perceived their indoor thermal environments in both summers to be comfortable, covering 73% and 77% of the responses in the three central categories of the ASHRAE thermal sensation scale (slightly cool, neutral, and slightly warm), representing thermally acceptable conditions (Figure 14). However, the five-point scale’s thermal preference votes confirm that the majority of residents preferred to be cooler during heatwave days, covering 45% of the votes in summer 2022, as compared to the typical summer in 2021 when only one-fourth of residents preferred a cooler indoor environment, and 70% of them preferred no change.
5. Discussion
This study reveals that, with a relatively small rise (6%) in the mean outdoor temperature, around half of the case study dwellings experienced overheating in their living rooms in the record-breaking heatwaves of 2022, with the majority being top-floor flats and bungalows facing south−west and south. This indicates thermal discomfort for residents and a higher health risk for vulnerable and elderlies during the heatwave days. The residents’ responses to the thermal comfort surveys confirm this, with over 45% of the respondents preferring to be in a cooler environment. This implies the key role of incorporating passive design measures such as internal and external shading devices alongside heat pumps, especially in dwellings facing south and south–west, to mitigate summertime overheating without negatively affect the heat pumps’ performance in winter. Whereas external shading reduces the solar heat gain of dwellings in summer, in the heating−dominated climate of the UK, the use of fixed shading devices can reduce solar gain in winter [47,48]. In such circumstances, the passive control of solar gain can be achieved through movable overhangs and side fins to protect façades from excessive solar gain in summer, while still providing passive solar gain in winter. Despite being less effective, external shutters, sliding panels, and movable and internal blinds, as well as installations of windows with a lower g-value, can still protect indoor spaces from excessive solar gain in summer without negatively effecting the energy efficiency of dwellings in winter [49]. Studies have found that shading and low g-value windows are more effective in flats due to the higher ratio between window area and internal volume [50]. To obtain the maximum benefit from shading devices all year round, it is vital to improve residents’ knowledge and understanding of controlling windows and shading.
Although the mean ACH rate increased by over 36% in the bedrooms in the subset of six dwellings during the heatwave periods in the non-heating season of 2022 (40 days), as compared to non-heatwave days (113 days), the majority of bedrooms experienced overheating in the summer, failing the CIBSE TM59 assessment. It is likely that the increased window opening, which accounted for an increase in the ACH during the heatwave period, also drew in unwanted summer heat gain from outside due to elevated temperatures. This is supported by the fact that indoor CO2 levels remained over 600 ppm in flat P04, which was also classed as an overheated dwelling despite an increased ACH of up to 1.62 and a higher frequency of window opening during heatwave days. Based on the SAP assessment of internal temperature in summer [51], the ACH rate could have been effective enough to naturally ventilate the rooms if the factors contributing to excess internal temperatures, including solar gain (taking account of orientation, shading, and glazing transmission), ventilation (taking account of window opening in hot weather), and thermal capacity, were mitigated. It is apparent that air circulation was not effective enough to cool down the bedrooms during the non-heating season of 2022, indicating the need for a holistic approach to tackle overheating that combines incorporating appropriate shading devices, natural and night-time ventilation, and thermal mass, alongside the use of mechanical fans, which, in fact, help improve the energy efficiency of heat pumps in winter.
The passive performance assessment of the bedrooms of the subset of dwellings confirms that the majority of the dwellings did not have the advantage of thermal mass to hold in heat during the day-time and release it overnight to purge excess heat and cool the building fabric, and natural ventilative cooling on its own was not enough to cool down the dwellings. Although the ACH was identified to be useful in assessing the potential risk of overheating caused by the lack of natural ventilation in removing excess heat using a CO2-based decay method, characterising the dwellings into four thermal stages through a heat balance map, together with evaluating air change rates per thermal stage could help to identify the level of heat vulnerabilities across the case study dwellings. This can support the improvement of building performances based on residents’ natural ventilation behaviours, infiltration, and the thermal properties of the façade to reduce the risk of summertime overheating.
In line with the UK government’s plan to install 600,000 heat pumps by 2028 across dwellings on a large scale, and with the rapid rise in summertime temperatures, low−carbon reversible heat pumps with cooling modes can be an opportunity to provide comfortable indoor spaces where increased natural ventilation is not sufficient to cool them down and where passive design elements cannot protect façades from strong solar glare in summer. This holistic approach is particularly vital following the 6% rise in the mortality rate in the UK during summer 2022 with a record-breaking heatwave, highlighting the lack of appropriate planning by the government and policy measures to address overheating, particularly in social housing dwellings with heat pumps. Since the government aims to introduce the Future Homes Standard by 2025 [52], which requires new dwellings to be constructed with world−class levels of energy efficiency, future policies should include measures to alleviate overheating via passive designs (i.e., natural ventilation, external shading, building orientation, and glazing). Providing passive cooling measures through enhanced ventilation and shading devices that also allow solar gain in winter, along with increasing residents’ understanding about heat management [49], can help tackle summertime overheating in homes located in places with temperate climates like the UK.
6. Conclusions
This study uses an empirical approach to examine the extent of summertime overheating across 24 naturally ventilated social housing dwellings co−located in a socially deprived area in Oxford (UK), retrofitted with GSHPs. Overheating was found to be prevalent across the majority of top-floor flats and bungalows in the non-heating season of 2022 with a record-breaking heatwave in 10–25 July, indicating that dwellings with more exposed area, particularly those with south−west and south glazing, were at a greater risk. The lack of appropriate shading devices and insufficient air change also affected the extent of summertime overheating, as confirmed by high indoor CO2 levels and a low ACH of 0.6 and below, which were observed during the non-heating season of 2022 with a record-breaking heatwave. The passive building performance assessment confirmed that, even though the mean ACH rate increased in bedrooms across the majority of dwellings during the extreme heatwave period in July, the dwellings experienced overheating in their bedrooms, indicating that natural ventilation was not adequate to remove excess heat. Further actions need to be taken to improve building performance in summer months, such as installing appropriate internal and external shading devices to reduce solar heat gain in summer.
It is apparent that implementing passive design measures, such as external shading devices, alongside the installation of reversible low−carbon heat pumps, will become necessary as we move towards a warming climate, which will help to provide more comfortable indoor environments in summer while ensuring year−round thermal comfort. The majority of the monitored dwellings in this study were occupied by the elderly or residents with low incomes who were not only vulnerable to heat but also unable to afford active forms of cooling. It is vital to deploy passive design measures as a part of home energy retrofits to not only improve the energy efficiency of the dwellings for heating seasons but also to reduce the extent of overheating in summer. This requires an integrated low−carbon and adaptive retrofit approach, enabling dwellings to stay warm in winter and cool in summer.
Author Contributions
Conceptualisation, R.G. and S.Z.; methodology, R.G. and S.Z.; formal analysis, S.Z. and R.G.; investigation, S.Z. and R.G.; resources, R.G. and S.Z.; data curation, S.Z. and R.G.; writing—original draft preparation, S.Z. and R.G.; writing—review and editing, R.G. and S.Z.; supervision, R.G.; funding acquisition, R.G. All authors have read and agreed to the published version of the manuscript.
Funding
This study is supported by the EPSRC−funded EnergyRev−Core project (EP/S031723/1) and EnergyRev Plus project on user influence tools (EP/S03188X/1).
Institutional Review Board Statement
The study was conducted in accordance with the Oxford Brookes University Research Ethics Committee (UREC registration no. 201499).
Informed Consent Statement
Informed consent was obtained from all subjects involved in the study.
Data Availability Statement
The data presented in this study are available on request from the corresponding author. The data are not publicly available due to privacy.
Conflicts of Interest
The authors declare no conflict of interest. The funders had no role in the design of the study; in the collection, analyses, or interpretation of data; in the writing of the manuscript; or in the decision to publish the results.
References
- ONS. Excess Mortality during Heat−Periods: 1 June to 31 August 2022; Office for National Statistics (ONS) and UK Health Security Agency (UKHSA): London, UK, 2022.
- Ormandy, D.; Ezratty, V. Thermal discomfort and health: Protecting the susceptible from excess cold and excess heat in housing. Adv. Build. Energy Res. 2016, 10, 84–98. [Google Scholar] [CrossRef]
- Vandentorren, S.; Bretin, P.; Zeghnoun, A.; Mandereau−Bruno, L.; Croisier, A.; Cochet, C.; Ribéron, J.; Siberan, I.; Declercq, B.; Ledrans, M. August 2003 heat wave in France: Risk factors for death of elderly people living at home. Eur. J. Public Health 2006, 16, 583–591. [Google Scholar] [CrossRef] [PubMed]
- Skea, J.; Shukla, P.; Kılkış, Ş. Climate Change 2022: Mitigation of Climate Change; Cambridge University Press: Cambridge, MA, USA, 2022. [Google Scholar]
- HM Government. UK Climate Change Risk Assessment 2022; Defra—Department for Environment Food and Rural Affairs: London, UK, 2022.
- Met Office. UK Climate Projections: Headline Findings. 2022. Available online: https://www.metoffice.gov.uk/binaries/content/assets/metofficegovuk/pdf/research/ukcp/ukcp18_headline_findings_v4_aug22.pdf (accessed on 18 December 2022).
- HM Government. The Ten Point Plan for a Green Industrial Revolution; HM Government: London, UK, 2020.
- Lomas, K.J.; Porritt, S.M. Overheating in buildings: Lessons from research. Build. Res. Inf. 2017, 45, 1–18. [Google Scholar] [CrossRef]
- Pathan, A.; Mavrogianni, A.; Summerfield, A.; Oreszczyn, T.; Davies, M. Monitoring summer indoor overheating in the London housing stock. Energy Build. 2017, 141, 361–378. [Google Scholar] [CrossRef]
- Beizaee, A.; Lomas, K.J.; Firth, S.K. National survey of summertime temperatures and overheating risk in English homes. Build. Environ. 2013, 65, 1–17. [Google Scholar] [CrossRef]
- Morey, J.; Beizaee, A.; Wright, A. An investigation into overheating in social housing dwellings in central England. Build. Environ. 2020, 176, 106814. [Google Scholar] [CrossRef]
- HM Government. The Building Regulation. Part L: Conservation of Fuel and Power; HM Government: London, UK, 2010.
- MHCLG. English Housing Survey—Headline Report 2017–18; Department for Levelling Up, Housing and Communities (Formely, Ministry of Housing, Communities & Local Government): London, UK, 2019. [Google Scholar]
- Statista. England: Share of Socially Rented Households 2000–2021. 2022. Available online: https://www.statista.com/statistics/286509/england−number−of−social−rented−households/ (accessed on 19 December 2022).
- HM Government. Overheating—The Building Regulation 2010—Approved Document O; Department for Levelling Up, Housing and Communities: London, UK, 2021.
- Sameni, S.M.T.; Gaterell, M.; Montazami, A.; Ahmed, A. Overheating investigation in UK social housing flats built to the Passivhaus standard. Build. Environ. 2015, 92, 222–235. [Google Scholar] [CrossRef]
- Drury, P.; Watson, S.; Lomas, K.J. Summertime overheating in UK homes: Is there a safe haven? Build. Cities 2021, 2, 970–990. [Google Scholar] [CrossRef]
- Lomas, K.; Watson, S.; Allinson, D.; Fateh, A.; Beaumont, A.; Allen, J.; Foster, H.; Garrett, H. Dwelling and household characteristics’ influence on reported and measured summertime overheating: A glimpse of a mild climate in the 2050’s. Build. Environ. 2021, 201, 107986. [Google Scholar] [CrossRef]
- Jang, J.; Natarajan, S.; Lee, J.; Leigh, S.-B. Comparative Analysis of Overheating Risk for Typical Dwellings and Passivhaus in the UK. Energies 2022, 15, 3829. [Google Scholar] [CrossRef]
- Gardinar, A. Deepening Our Understanding of Summertime Overheating in Homes; CCC Secretariat, Ed.; Climate Change Committee: London, UK, 2022.
- Kerr, D.W.; Reeves, A. Low-Carbon Social Housing Retrofit and Overheating Risk: A Review; De montfort University: Leicester, UK, 2021. [Google Scholar]
- Haggag, M.; Hassan, A.; Elmasry, S. Experimental study on reduced heat gain through green façades in a high heat load climate. Energy Build. 2014, 82, 668–674. [Google Scholar] [CrossRef]
- Tink, V.; Porritt, S.; Allinson, D.; Loveday, D. Measuring and mitigating overheating risk in solid wall dwellings retrofitted with internal wall insulation. Build. Environ. 2018, 141, 247–261. [Google Scholar] [CrossRef]
- Vellei, M.; Ramallo-González, A.P.; Coley, D.; Lee, J.; Gabe−Thomas, E.; Lovett, T.; Natarajan, S. Overheating in vulnerable and non−vulnerable households. Build. Res. Inf. 2017, 45, 102–118. [Google Scholar] [CrossRef]
- Baborska-Narożny, M.; Stevenson, F.; Grudzińska, M. Overheating in retrofitted flats: Occupant practices, learning and interventions. Build. Res. Inf. 2017, 45, 40–59. [Google Scholar] [CrossRef]
- Mavrogianni, A.; Taylor, J.; Davies, M.; Thoua, C.; Kolm−Murray, J. Urban social housing resilience to excess summer heat. Build. Res. Inf. 2015, 43, 316–333. [Google Scholar] [CrossRef]
- Coley, D.; Kershaw, T.; Eames, M. A comparison of structural and behavioural adaptations to future proofing buildings against higher temperatures. Build. Environ. 2012, 55, 159–166. [Google Scholar] [CrossRef]
- Mavrogianni, A.; Pathan, A.; Oikonomou, E.; Biddulph, P.; Symonds, P.; Davies, M. Inhabitant actions and summer overheating risk in London dwellings. Build. Res. Inf. 2017, 45, 119–142. [Google Scholar] [CrossRef]
- Murtagh, N.; Gatersleben, B.; Fife−Schaw, C. Occupants’ motivation to protect residential building stock from climate−related overheating: A study in southern England. J. Clean. Prod. 2019, 226, 186–194. [Google Scholar] [CrossRef]
- Mitchell, R.; Natarajan, S. Overheating risk in Passivhaus dwellings. Build. Serv. Eng. Res. Technol. 2019, 40, 446–469. [Google Scholar] [CrossRef]
- CIBSE. TM52—The Limits of Thermal Comfort: Avoiding Overheating in European Buildings; The Chartered Institution of Building Services Engineers: London, UK, 2013. [Google Scholar]
- CIBSE. TM59—Design Methodology for the Assessment of Overheating Risk in Homes; The Chartered Institution of Building Services Engineers: London, UK, 2017. [Google Scholar]
- Hughes, C.; Natarajan, S. Summer thermal comfort and overheating in the elderly. Build. Serv. Eng. Res. Technol. 2019, 40, 426–445. [Google Scholar] [CrossRef]
- Sousa, G.; Jones, B.M.; Mirzaei, P.A.; Robinson, D. A review and critique of UK housing stock energy models, modelling approaches and data sources. Energy Build. 2017, 151, 66–80. [Google Scholar] [CrossRef]
- Yannas, S.; Rodríguez-Álvarez, J. Domestic overheating in a temperate climate: Feedback from London Residential Schemes. Sustain. Cities Soc. 2020, 59, 102189. [Google Scholar] [CrossRef]
- Ridley, I.; Bere, J.; Clarke, A.; Schwartz, Y.; Farr, A. The side by side in use monitored performance of two passive and low carbon Welsh houses. Energy Build. 2014, 82, 13–26. [Google Scholar] [CrossRef]
- Ridley, I.; Clarke, A.; Bere, J.; Altamirano, H.; Lewis, S.; Durdev, M.; Farr, A. The monitored performance of the first new London dwelling certified to the Passive House standard. Energy Build. 2013, 63, 67–78. [Google Scholar] [CrossRef]
- Lowe, R.; Altamirano, H.; Wingfield, J.; Chiu, L.; Burman, E.; Plaskett, J.; Waters, O.; Dancey, D. Innovate UK Building Performance Evaluation. One Brighton—Ongoing Monitoring. Phase 2: In-Use Performance & Post Occupancy Evaluation. 2014. Available online: https://buildingdataexchange.org.uk/wp-content/uploads/2015/11/450009-One-Brighton-ongoingmonitoring.pdf (accessed on 13 April 2023).
- CIBSE. Guide A: Environmental Design; Chartered Institute of Building Services Engineers (CIBSE): London, UK, 2006. [Google Scholar]
- De Dear, R.J.; Brager, G.S. Thermal comfort in naturally ventilated buildings: Revisions to ASHRAE Standard 55. Energy Build. 2002, 34, 549–561. [Google Scholar] [CrossRef]
- Pyrgou, A.; Santamouris, M. Probability Risk of Heat−and Cold−Related Mortality to Temperature, Gender, and Age Using GAM Regression Analysis. Climate 2020, 8, 40. [Google Scholar] [CrossRef]
- López−García, E.; Lizana, J.; Serrano−Jiménez, A.; Díaz−López, C.; Barrios−Padura, Á. Monitoring and analytics to measure heat resilience of buildings and support retrofitting by passive cooling. J. Build. Eng. 2022, 57, 104985. [Google Scholar] [CrossRef]
- Met Office. UK Climate Change in Action. 2022. Available online: https://www.metoffice.gov.uk/about−us/press−office/news/weather−and−climate/2022/heatwave−threshold−changes (accessed on 5 October 2023).
- You, Y.; Niu, C.; Zhou, J.; Liu, Y.; Bai, Z.; Zhang, J.; He, F.; Zhang, N. Measurement of air exchange rates in different indoor environments using continuous CO2 sensors. J. Environ. Sci. 2012, 24, 657–664. [Google Scholar] [CrossRef]
- Bhamare, D.K.; Rathod, M.K.; Banerjee, J. Passive cooling techniques for building and their applicability in different climatic zones—The state of art. Energy Build. 2019, 198, 467–490. [Google Scholar] [CrossRef]
- Song, Y.-l.; Darani, K.S.; Khdair, A.I.; Abu-Rumman, G.; Kalbasi, R. A review on conventional passive cooling methods applicable to arid and warm climates considering economic cost and efficiency analysis in resource-based cities. Energy Rep. 2021, 7, 2784–2820. [Google Scholar] [CrossRef]
- Swainson, M.; Henderson, J.; Wright, W. Solutions to Overheating in Homes: Evidence Review; Zero Carbon Hub, Building Research Establishement (BRE): London, UK, 2016. [Google Scholar]
- McLeod, R.S.; Swainson, M. Chronic overheating in low carbon urban developments in a temperate climate. Renew. Sustain. Energy Rev. 2017, 74, 201–220. [Google Scholar] [CrossRef]
- Lomas, K. Summertime overheating in dwellings in temperate climates. Build. Cities 2021, 2, 487–494. [Google Scholar] [CrossRef]
- Bouhi, N.; Edwards, M.; Canta, A.; Fielding, V.; Chikte, S.; Reynold, J. Addressing Overheating Risk in Existing UK Homes; Climate Change Committee (CCC): London, UK; ARUP: London, UK, 2022.
- BRE. The Government’s Standard Assessment Procedure for Energy Rating of Dwellings (SAP); Building Research Establishement: Hertfordshire, UK, 2012. [Google Scholar]
- Sowter, C. The Future Homes Standard: Changes to Part L and Part F of the Building Regulations for New Dwellings; Policy Commons: London, UK, 2020. [Google Scholar]


Disclaimer/Publisher’s Note: The statements, opinions and data contained in all publications are solely those of the individual author(s) and contributor(s) and not of MDPI and/or the editor(s). MDPI and/or the editor(s) disclaim responsibility for any injury to people or property resulting from any ideas, methods, instructions or products referred to in the content. |
© 2023 by the authors. Licensee MDPI, Basel, Switzerland. This article is an open access article distributed under the terms and conditions of the Creative Commons Attribution (CC BY) license (https://creativecommons.org/licenses/by/4.0/).