Article

Effect of Single and Double Moment Microphysics Schemes and Change in Cloud Condensation Nuclei, Latent Heating Rate Structure Associated with Severe Convective System over Korean Peninsula †

1
Korea Institute of Atmospheric Prediction Systems (KIAPS), Seoul 07071, Republic of Korea
2
India Meteorological Department (IMD), MoES, New Delhi 110003, India
3
National Centre for Atmospheric Research (NCAR), Boulder, CO 80307, USA
*
Authors to whom correspondence should be addressed.
This paper is an extended version of our paper published in the AGU Fall Meeting, 1–17 December 2020.
Atmosphere 2023, 14(11), 1680; https://doi.org/10.3390/atmos14111680
Submission received: 1 September 2023 / Revised: 28 October 2023 / Accepted: 29 October 2023 / Published: 13 November 2023
(This article belongs to the Section Meteorology)

Abstract

:
To investigate the impact of advanced microphysics schemes using single and double moment (WSM6/WDM6) schemes, numerical simulations are conducted using Weather Research and Forecasting (WRF) model for a severe mesoscale convective system (MCS) formed over the Korean Peninsula. Spatial rainfall distribution and pattern correlation linked with the convective system are improved in the WDM6 simulation. During the developing stage of the system, the distribution of total hydrometeors is larger in WDM6 compared to WSM6. Along with the mixing ratio of hydrometeors (cloud, rain, graupel, snow, and ice), the number concentration of cloud and rainwater are also predictable in WDM6. To understand the differences in the vertical representation of cloud hydrometeors between the schemes, rain number concentration (Nr) from WSM6 is also computed using particle density to compare with the Nr readily available in WDM6. Varied vertical distribution and large differences in rain number concentration and rain particle mass is evident between the schemes. Inclusion of the number concentration of rain and cloud, CCN, along with the mixing ratio of different hydrometers has improved the storm morphology in WDM6. Furthermore, the latent heating (LH) profiles of six major phase transformation processes (condensation, evaporation, freezing, melting, deposition, and sublimation) are also computed from microphysical production terms to deeply study the storm vertical structure. The main differences in condensation and evaporation terms are evident between the simulations due to the varied treatment of warm rain processes and the inclusion of CCN activation in WDM6. To investigate cloud–aerosol interactions, numerical simulation is conducted by increasing the CCN (aerosol) concentration in WDM6, which simulated comparatively improved pattern correlation for rainfall simulation along with intense hydrometer distribution. It can be inferred that the change in aerosol increased the LH of evaporation and freezing and affected the warming and cooling processes, cloud vertical distribution, and subsequent rainfall. Relatively, the WDM6 simulated latent heating profile distribution is more consistent with the ERA5 computed moisture source and sink terms due to the improved formulation of warm rain processes.

1. Introduction

Parameterisation of cloud microphysics signifies an important source of ambiguity in numerical simulations of organised deep convection as grid resolving scale precipitation at fine resolution is determined by microphysical schemes. Microphysics directly affects the buoyancy and hence the convective fluxes through the condensate loading and latent heating/cooling, which affect the storm dynamics. Inadequacies in representations of clouds have impacts on latent and radiative heating and results in inadequacy in the circulation and hydrological cycle [1]. Robust interactions between the cloud microphysics (which governs the precipitation) and the large-scale dynamics consequently regulate the organisation of the convection through the heating distribution influenced by the phase transition among different hydrometeors [2,3]. The large-scale thermal state of the atmosphere affects clouds, dynamics, and hydrological processes. Feedback from microphysics to dynamics through the latent heat release is the main phenomenon that affects the convection [4,5,6,7,8,9,10,11,12,13,14]. Microphysics schemes explicitly characterise the moist convective processes and strongly affect the convective-scale simulations [15,16]. Further cloud microphysical processes play an important role in warm-season precipitating systems by directly affecting the cold pool strength (rainfall evaporation) and latent heating (condensation) as well as indirect influences on gravity waves and cloud-radiation interaction. Hence, proper representation of cloud microphysics is crucial for simulating clouds and is one of the most important aspects to reduce the uncertainties in the numerical forecasts/simulations.
In the past, numerical models have relied on Eulerian approach to depict clouds, thermodynamics, and microphysics variables. Over time, the sophistication of microphysics has progressively increased from simple representations of bulk masses of cloud including different ice particle types and bulk hydrometeor concentrations to complex schemes (bin or spectral schemes) that evolve the hydrometeor size distributions within each model grid cell [17]. Bulk schemes assume an underlying shape for hydrometeor size distribution and predicts one or more bulk quantities of the distribution. In contrast, bin microphysics schemes explicitly predict the detailed evolution of size distribution and are computationally expensive, which are not feasible for most applications [18]. On the other hand, bulk microphysics schemes use a gamma distribution function [19] to represent the particle size distribution of water species using the intercept, slope, and shape parameters. The recent development of bulk microphysics schemes incorporates the prediction of several moments for hydrometeor size distributions [18,20].
Even though there is raise in computational cost, increasing the moments enhances the degrees of freedom and allows more flexible treatment of particle size distributions; one improvement in bulk microphysics schemes is the prediction of two moments of hydrometeor size spectra rather than one (implies mixing ratio). In a single moment (1M) scheme, the slope parameter is controlled by predicting the mixing ratio of all hydrometeor species with a fixed intercept, whereas in a double moment (2M) scheme, the intercept varies with additional prediction of the total number concentration. Furthermore, 2M schemes have more degrees of freedom to represent the hydrometeor particle size distribution and outperform 1M schemes in representing the convective structure and stratiform coverage [18,21]. The prognostic equations of the raindrop number concentration in 2M schemes can produce the large rain drops in a reasonable concentration for a heavily precipitating rainband compared to a 1M scheme. 2M schemes also require the cloud condensation nuclei (CCN) information to predict the cloud droplet number concentration to account the important effects of cloud–aerosol interactions [22,23,24]. It is to be noted that the double-moment schemes are extensively used to treat droplet activation and cloud–aerosol interaction through the prediction of the droplet number concentration [25,26]. However, both 2M schemes cannot accurately describe the cloud droplet spectrum evolution whereas the triple-moment (3M) condensation scheme can provide a detailed evolution of cloud drop spectra [27], which reinstates the necessity to consider 3M schemes for further improvement in simulations.
Numerous 2M schemes have been developed and utilised in a variety of applications [20,26,28]. For organised deep convection, key processes that are affected by using 2M vs. IM schemes include particle size sorting and rain evaporation [18,28]. It has been reported that 2M schemes reduced the rain evaporation in the trailing stratiform region of a squall line comparative to 1M, leading to increased stratiform precipitation at the surface. Similarly weaker cold pools in supercell simulations produced by the 2M scheme compared to 1M of the same led to an improvement when compared against the observations [26].
As the cloud microphysics parameterisation accounts for the formation of different hydrometeors and the vertical distribution of cloud, other important aspect of cloud microphysics is to model the warm and cold cloud physics. Compared to warm cloud microphysics, the modelling of cold cloud microphysics is complex as it applies to temperatures lower than 0 °C, which involve ice crystals, and adds the additional complexity of ice processes like heterogeneous ice nucleation, secondary production mechanisms of ice crystals [9,29,30]. Microphysics of warm clouds include the growth of cloud droplets in warm clouds (condensation, fall speed of droplets, collection, accretion of cloud droplets by rain drops, collision, and coalescence) [31], while cold rain is produced by the microphysical processes of mixed-phase and cold clouds (melting of ice-phase hydrometeors). In detail, the microphysics of cold clouds includes homogeneous, heterogeneous, and contact nucleation, the concentration of ice particles in clouds, crystal growth (vapour phase, aggregation, riming), the formation of precipitation, and cloud modification.
Cold cloud microphysics affects the organised convection primarily via extra latent heating (cooling) by freezing (melting) processes and slower the fall speed of ice, implying a longer residence time in the atmosphere. It is important to note that the formulation of warm and cold cloud microphysics plays major role in the simulation of any type of weather and climate event. Studies [32] have shown the advantage of using liquid only microphysics schemes for the simulation of deep convection. However, later studies also demonstrated the significance of ice cloud microphysics on the structure and intensity of deep convective systems [15]. The main ambiguity in parameterising the ice microphysics is the type and number of ice species representation and the depiction of ice-phase processes such as appropriate number and type of ice-phase categories [33]. The main features include terminal fall-speed/size and density/size relationships that vary widely among different ice categories in bulk schemes [33].
Furthermore, recognising the importance of cloud–aerosol interactions in cloud microphysics and radiative properties [22,24,34], a prognostic treatment of CCN particles is introduced for newer schemes to activate cloud droplets. For instance, [35] evaluated three options of increasing complexity to characterise the hydrometeor species (namely, two-class ice, three-class ice with one moment, and three-class ice with two moments) in predicting the super cooled liquid water of winter storms. Therefore, it is important to note that the representation of warm and cold cloud microphysics affects the storm dynamics and explicitly represents moist convection and strongly impacts the convective-scale simulations [15,16]. Moreover, the dynamics and lifetime of atmospheric clouds have been coupled to entrainment and turbulent fluxes [36] due to the scale dependence of the cloud microphysical response to turbulent entrainment and mixing parameterisation, which affects the warm cumulus and stratus clouds [37,38], and subsequently affects the rainfall simulations [39,40,41] because of the boundary layer processes on the cloud system. Furthermore, it is also important to note that studies by [37,42] introduced the entrainment-mixing mechanisms into 2M schemes to realistically represent the precipitation simulations. Apart from this, both the 1M and 2M schemes have issues of the spurious broadening of cloud droplet spectra, which ultimately affect the representation of rainfall distribution from numerical simulations that require the need to consider multi-moment schemes (three-moment) schemes [27].
Latent heat (LH) release is the main source of energy for severe local convective storms and large-scale atmospheric circulation as it drives the global winds and weather systems [43] through the redistribution of energy and maintains the large-scale circulation of tropical atmosphere and the way that large-scale circulation responds depends on the vertical distribution of temperature change following deep convection [44]. For example, the LH released by phase change processes (warm and cold phase) can reshape the thermal profile and redistribute the moisture in the vertical direction [45]. Moreover, the transformation of water vapour into cloud hydrometeors results in phase change processes [9,46,47]. Several scientific studies have been conducted to understand the LH structure in severe convective environments over various parts of the world [8,48,49,50,51] but the sensitivity to LH structure to different moment schemes has been the least explored.
Furthermore, the formulation of cloud condensation nuclei/ice nuclei activation from water vapour may also affect the latent heating–cooling structure and convective fluxes. It is important to note that the representation of warm and cold cloud microphysical processes is dependent on the number of moments of the microphysics schemes. Even though many studies have been conducted to study the sensitivity of low moment (1M) to high order moment (2M) schemes, the investigation of the effect of microphysical moments on transformation processes is limited. While many studies suggest important differences using 1M and 2M schemes, comparing the sensitivity arising due to important aspects of the microphysics (number and type of ice species) has received little attention. In particular, the microphysical transformation terms (1M/2M) in the schemes vary and influence the latent heating/cooling processes that affect the storm dynamics. As the choice of microphysics (different moments) affects the warm- and cold-cloud processes and related diabatic heating–cooling rates that connect the convective-scale cloud microphysical processes to local thermodynamics and large-scale dynamics, it is important to investigate the effect of the latent heating rates on the storm dynamics, which forms the basis of this study.
Consequently, the main objective of the present work is to examine the choice of different moment bulk microphysics schemes on the simulation of a mesoscale convective system over the Korean Peninsula in terms of rainfall distribution (precipitation characteristics, spatial distribution, intensity) and storm dynamics. In the current study, two key aspects of the bulk microphysics schemes (double class versus single class) sensitivity to numerical simulations in terms of the number concentration and cloud–aerosol interactions (inclusion of cloud condensation nuclei (CCN)) are investigated. As microphysics directly influence the buoyancy and henceforth the convective fluxes through the condensate loading and latent heating/cooling, the effect of microphysics on storm dynamics is also studied by examining the latent heating rate structure. Following the study by [9], where the simulation of the latent heating rate using the microphysical process in a severe convective storm environment was discussed, the current study investigates the effect of single and double moment schemes on the vertical distribution of the latent heating rate and consequence on storm structure. The article is organised as follows. The case description is provided in Section 2. The numerical model set up framework and methodology, along with the datasets utilised, are described in Section 3. A brief description in the differences in the single vs. double moment schemes are presented in Section 4. The results of the microphysics parameterisation scheme sensitivity and the effect of changing the cloud condensation nuclei (CCN) are investigated in Section 5, followed by conclusions in Section 6.

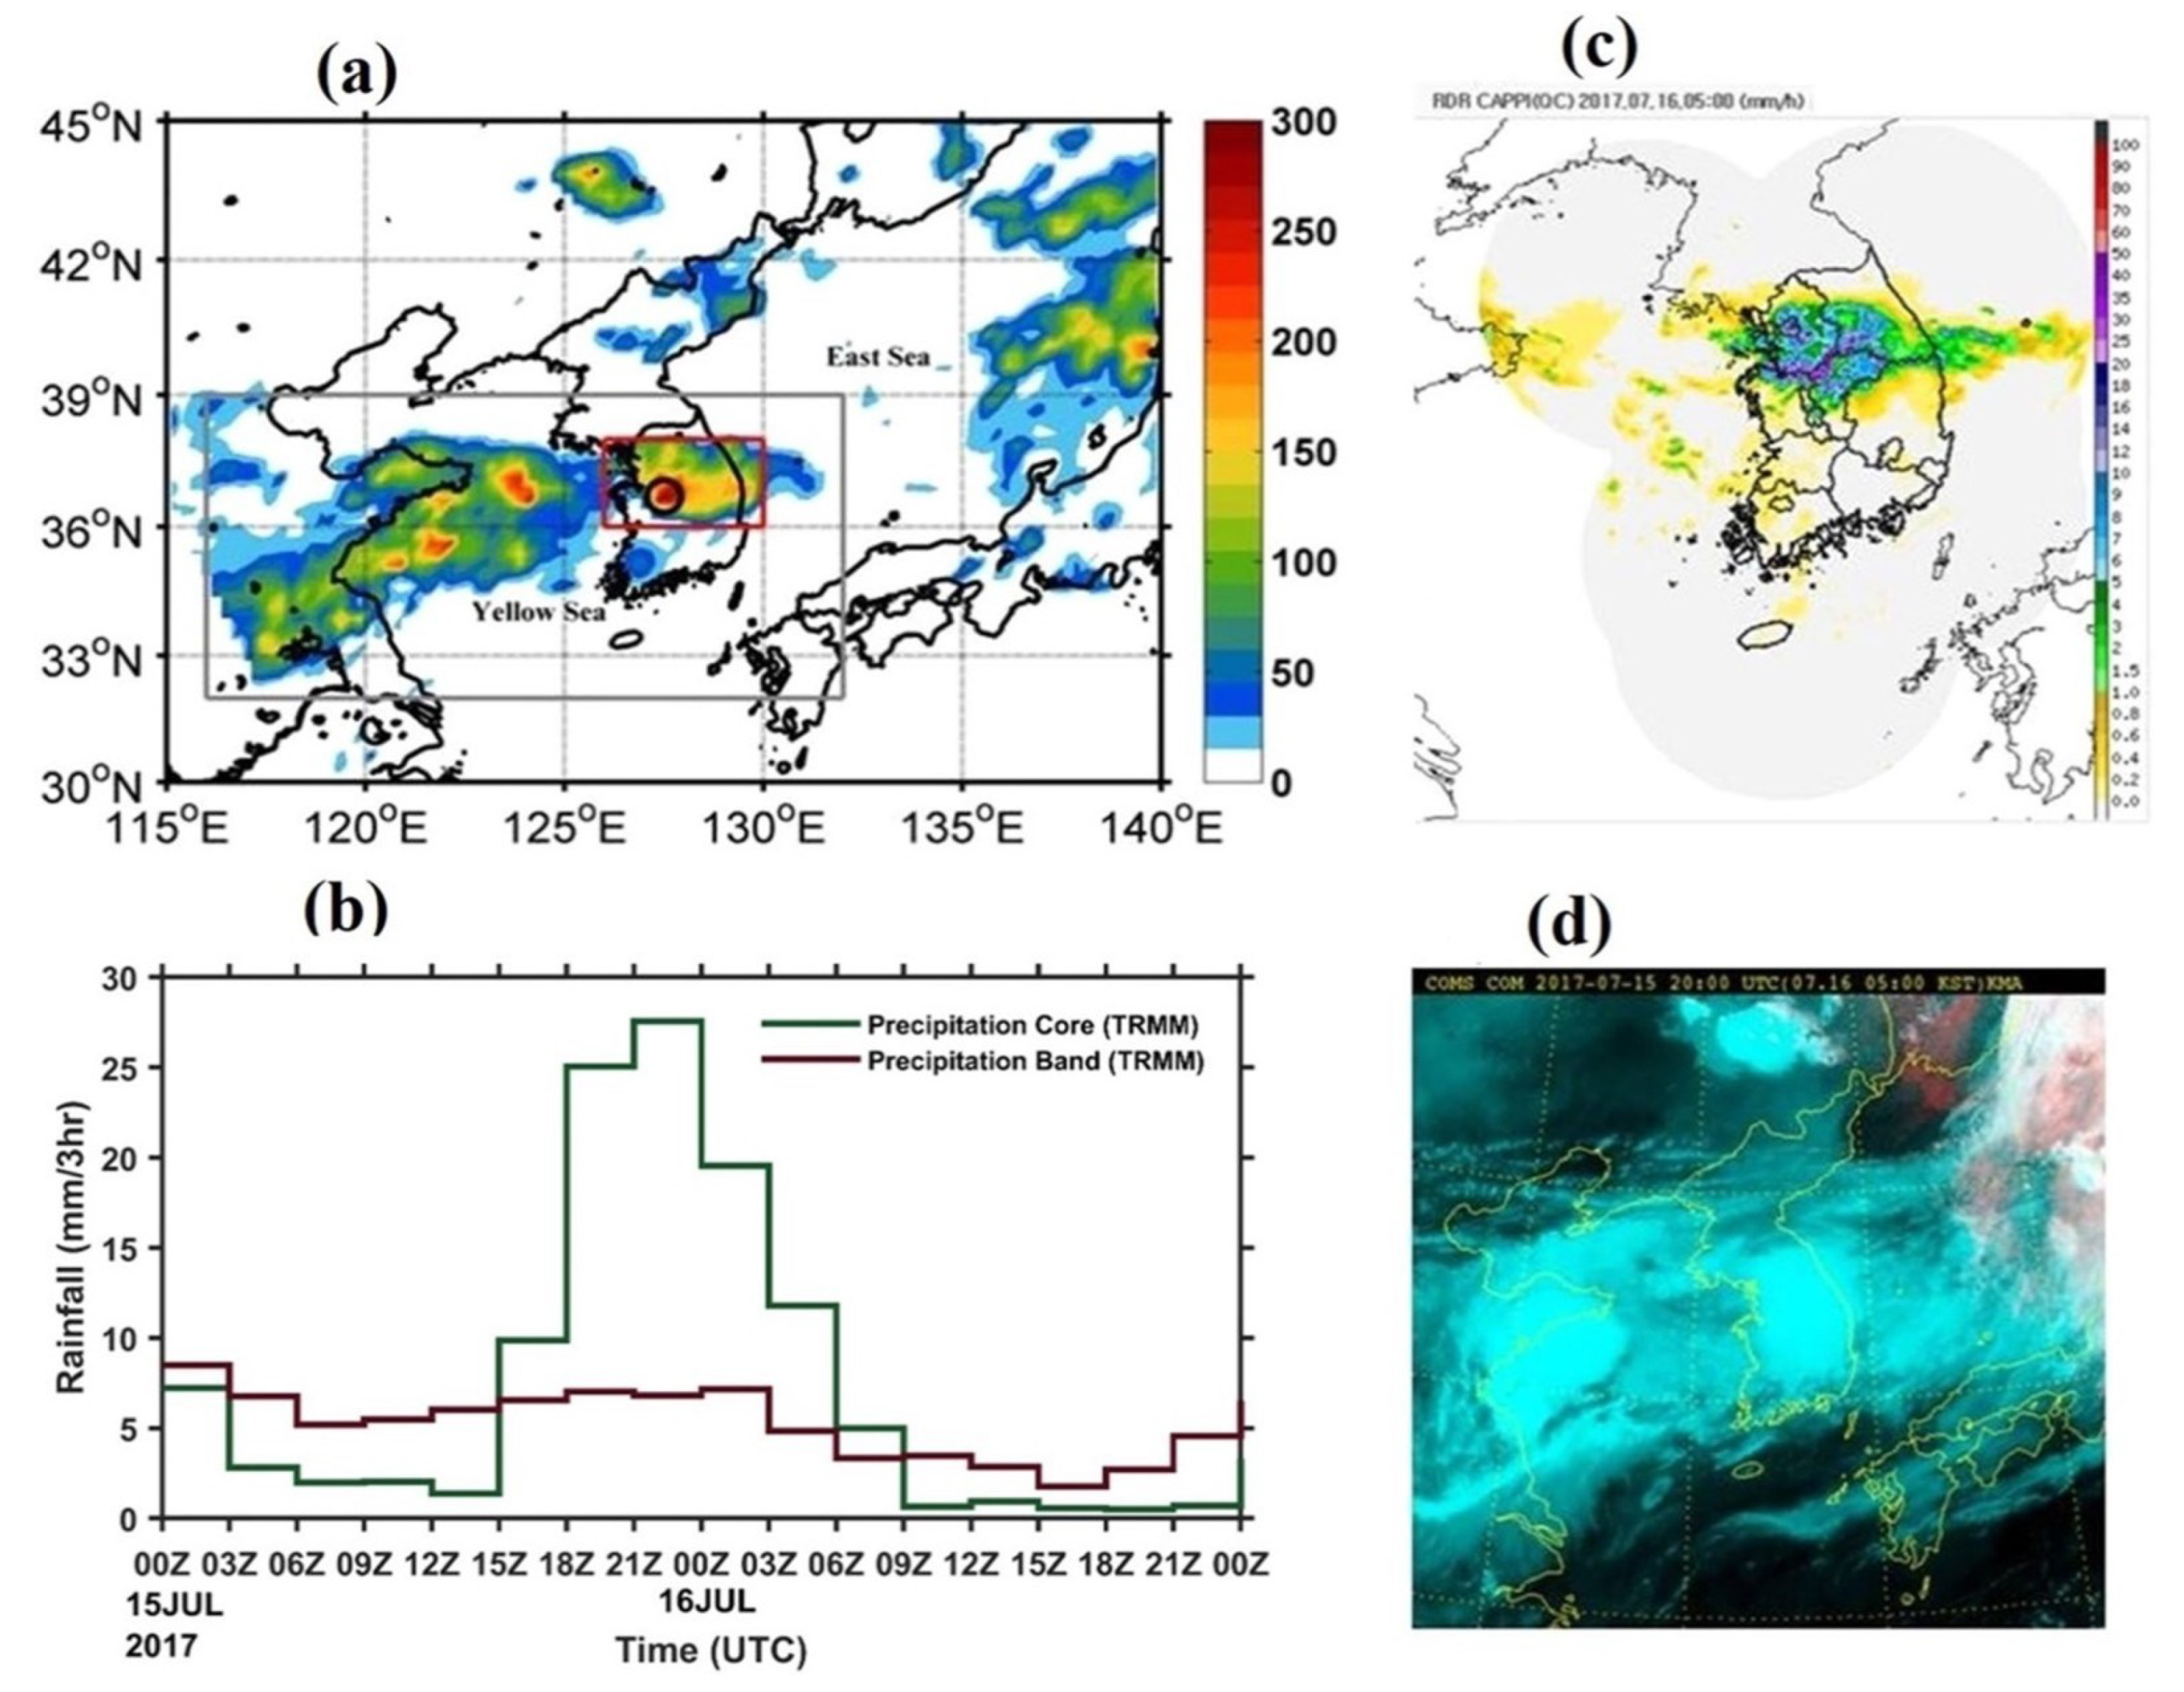
2. Case Description and Synoptic Features

Several platforms (TRMM, DWR, satellite imagery) have portrayed the passage of the MCS over the Korean Peninsula (Figure 1). The 48-h accumulated rainfall (0000 UTC 15 July to 0000 UTC 17 July 2017) from TRMM displayed a precipitation band that extended from eastern China and the Yellow Sea to the Korean Peninsula (Figure 1a), with the maximum precipitation over the Cheongju region (black open circle in red box in Figure 1a). It is evident that the Korean Peninsula received rainfall in association with the movement of a mesoscale convective system (MCS) that developed during the Changma season over Korea [52]. A more detailed description on the synoptic forcing responsible for the MCS formation is available at [9,53]. Time series of the area averaged 3-h rainfall over the maximum precipitation band (116–132° E, 32–39° N) and precipitation core (126–130° E, 36–38° N) from the TMPA observations showed that rainfall over the precipitation core (over Korean Peninsula) started at 1500 UTC 15 July 2017, whereas rainfall over the precipitation band is evident from 0000 UTC 15 July 2017 (Figure 1b), related to MCS propagation. The incidence of large cloud band over the Cheongju region in response to system passage is apparent from the weather radar and satellite imagery from KMA (Figure 1c,d).

3. Numerical Model Configuration

Nested domain numerical simulations with two-way nesting are conducted to explore the microphysical processes and latent heating rate structure in the storm environment. The Weather Research and Forecasting (WRF) model V3.9.1 is employed in the current study. It is a fully compressible, non-hydrostatic model with an Arakawa C grid system. Further details can be found in [54]. Four nested computational grids from outer to inner domains with 210 × 210, 244 × 244, 331 × 331, and 406 × 406 grid points with grid increments of 27, 9, 3, and 1 km, respectively, are shown with the innermost domain covering the Cheongju region (Figure 2). NCEP FNL data (1° × 1° resolution) at 00 UTC 15 July 2017 are provided as the model’s initial conditions. For the numerical configuration, the same setup utilised in [9,53] is utilised. In the model setup, physics options for cumulus, radiation, and microphysics, based on the Korean Integrated Model (KIM) [55] developed by the Korea Institute of Atmospheric Prediction System (KIAPS), are considered for the simulation. A newly developed cumulus scheme that considers scale-aware capability in the cloud-base mass flux, convective inhibition, and convective cloud water detrainment [56,57] is used. A radiation scheme with a revised two-stream approximation and a reduced number of random samples (G-packed) in a radiation package [58] is utilised. For planetary boundary layer physics, the scale-aware scheme [59] is considered, which denotes subgrid-scale turbulent transport in the boundary layer at gray-zone resolutions by modulating the effects of grid size dependency on vertical heat transport. For microphysics, the WRF single-moment 6-class scheme (WSM6) and WRF double-moment 6-class scheme (WDM6) [60], which characterises the comprehensive bulk microphysical process. WDM6 comprises the prognostic water substance variables for water vapour, clouds, rain, ice, snow, and graupel. Besides the mixing ratio (WSM6), WDM6 also enhances the prognostic number concentration of cloud and rainwater, henceforth it is a double-moment warm rain microphysics scheme. Furthermore, this scheme also enables the investigation of the aerosol effects on the cloud properties and precipitation processes with a prognostic variable of CCN. The activated CCN number concentration is predicted and formulated by means of the drop activation process based on Twomey’s relationship between the number of activated CCN and supersaturation, which enables a level of complexity to be added to the traditional bulk microphysics schemes through the explicit CCN-cloud drop concentration production [61]. A more detailed description on single- and double-moment schemes follows in the next section.
Using this numerical model setup (Figure 2), WRF simulations are conducted for 48 h, and the model simulations are compared against the TRMM and AWS (spatial distribution of rainfall); and the simulated latent heating profiles are validated using the ERA5 reanalysis datasets.

4. Brief Description of Single Vs. Double Moment Scheme

In general, bulk microphysics schemes use a gamma distribution function [19] to characterise the particle size distribution of water species through the intercept, slope, and shape parameters. In a 1M scheme, the slope parameter is only controlled by predicting the mixing ratio of all hydrometeor species, whereas in a 2M scheme, the intercept can be varied with an additional prediction of the total number concentration. 2M schemes have more freedom to represent the hydrometeor’s particle size distribution, which can outperform single-moment schemes in representing the convective structure and stratiform coverage [18,21]. The gamma distribution for precipitating hydrometeor classes for single- and double-moment schemes can be described as
Nx(D) = Nox Dµx e−λxD
where Nx(D) (m−4) characterises the number concentration of the diameter (D) of particles of a given hydrometeor class (x) and diameter (D); Nox (m−4) is referred to as the intercept parameter; λx is the shape parameter and µx is the slope parameter that determines the degree of freedom of the particle size distribution curve, respectively [62], where x = c, r, s, g, i corresponds to five hydrometeor categories (cloud water, rain, snow, graupel, and cloud ice, respectively). These parameters are formulated as functions of the number concentration Nx and mixing ratio qx. In 1M schemes, Nx is specified as fixed Nox, and together with the predicted qx enables control of the slope parameter. In 2M schemes, Nx and qx are both prognostic variables, therefore the slope and intercept parameters can be handled with flexibility.
WSM6 and WDM6 both are based on the parameterisation of [63] and have similar parameterisation for cold-phase hydrometeors, which are handled in the 1M approach, but No is allowed to vary with temperature. Compared to WSM6, WDM6 has three additional prognostic variables: cloud condensation nuclei and number concentrations of cloud and rain, therefore WDM6 can be viewed as a partial 2M scheme whose ice-phase categories belong to a 1M scheme, whereas the warm rain species belong to a 2M scheme. The double-moment approach for the bulk microphysics scheme allows for more flexibility of the size distribution, enabling the mean diameter to evolve in contrast to the single-moment approach. This has become a more promising method to improve the microphysical processes in mesoscale modelling, even though it requires more computational time than the single-moment approach [60,64]. 2M schemes also require the CCN information when the CCN number concentration is predicted and formulated using the drop activation process based on Twomey’s relationship [65] between the number of activated CCN (na) and supersaturation (Sw), represented as (na = CSkw, where k is the parameter), which enables a level of complexity to be added to the traditional bulk microphysics schemes through the explicit CCN-cloud drop concentration feedback. One important feature of WDM6 is the activation of CCN, and the number concentration is predicted and formulated based on activated CCN (na) and supersaturation (Sw) [60]. Accurate 3D CCN information is an important aspect of model simulations. However, obtaining real-time CCN information in both the horizontal and vertical directions is difficult. Thus, we chose an initial value of 100 cm−3 for the CCN number concentration in this study, as in [60], and tested a larger value (1000 cm−3)
Furthermore, the formulation of warm-rain processes such as auto-conversion and accretion in the WDM6 scheme is based on the studies of [25]. For other source and sink terms in warm-rain processes, the formulas in the WSM6 scheme were adopted. However, the microphysics processes in the WDM6 scheme, even if the same formula is applied, work differently from those in the WSM6 scheme due to the predicted number concentrations of cloud water and rain, which in turn indirectly influence the ice processes. [60] demonstrated that compared to the simulation of an idealized 2D thunderstorm with the WSM6 scheme, the higher drop concentrations in the convective core versus lower drop concentrations in the stratiform region are distinct in the WDM6. A marked radar bright band near the freezing level was produced with the WDM6 microphysics scheme. Meanwhile, the WSM6 scheme extended strong reflectivity to the ground level over the stratiform region [61]. Precipitation, latent heat, and cloud radiative forcing in connection with deep convective clouds are strongly related to cloud microphysical processes that can be modulated by aerosols serving as cloud condensation nuclei (CCN) and ice nuclei (IN). For cloud–aerosol interactions, a famous theory is that an increase in the aerosol concentration can supress warm rain due to increased droplet number but reduced droplet size. This allows for more cloud droplets to be lifted to the altitudes above the freezing level, inducing stronger ice microphysical processes (droplet freezing, riming and deposition) that release the larger latent heating by invigorating convective updrafts (cold phase invigoration [43,66].
Another theory states increase in the aerosol content can enhance droplet nucleation, particularly secondary nucleation, after warm rain initiates, which promotes condensation due to a larger integrated droplet surface area associated with a higher number of small droplets [52]. The main contrast between the schemes is, WDM6 double-moment scheme predicts the number concentration of cloud and rainwater, which are added into the WRF single-moment 6-class (WSM6) scheme [41,67], however, the ice-phase microphysics is identical for both the WDM6 and WSM6 schemes [67] and for particle distribution, all hydrometeors follows the exponential distribution in WSM6 whereas in WDM6, the liquid (solid) hydrometeors follow the gamma (exponential) distribution, respectively [60].

Computation of Latent Heating Rate from Microphysical Process

In the current study, the latent heating (LH) rate is computed based on different microphysical transformation process production rates using both the WSM6 and WDM6 schemes. More details are provided in Appendix A, and a flowchart is accessible in Figure S1 of [9]. To explore the cloud microphysical processes and LH, six categories including condensation, evaporation, melting, freezing, sublimation, and deposition processes, which produce heat release/absorption during the phase transition, are considered. The latent heating rate calculation is based on [9,68,69].
qcond = Lv × (Pr_cond + Pr_cact)/Cpm
qevp = Lv × (Pr_evap + Pr_revp + Pr_gevp + Pr_sevp)/Cpm
qfrz = Lf × (Pr_ihmf + Pr_ihtf + Pr_gfrz + Pr_iacr + Pr_gacr + Pr_sacr + 2 × Pr_aacw)/Cpm
qmlt = Lf × (Pr_smlt + Pr_gmlt + Pr_imlt + Pr_seml + Pr_geml)/Cpm
qdep = (Ls × Pr_idep + Pr_sdep + Pr_gdep + Pr_igen)/Cpm
qsub = (Ls × Pr_isub + Pr_ssub + Pr_gsub)/Cpm
qnet = qcond + qevp + qfrz + qmlt + qdep + qsub
where qcond, qevp, qfrz, qdep, and qsub are the latent heating rates of major transformation processes (condensation, evaporation, freezing, melting, deposition, and sublimation, respectively). Lv, Lf, and Ls correspond to the LH constant associated with vaporisation, fusion, and sublimation, respectively, and Cpm′ is the specific heat constant. The conversion rate of each microphysical process is given by P, followed by the abbreviated name (i.e., Pr_cond, Pr_revp, etc.) in kg kg−1 s−1. And the net latent heating rate is the sum of the latent heating rate terms from the six major transformation processes.

5. Results and Discussion

5.1. Spatial Distribution of Rainfall in the Innermost Domain

To investigate the characteristics of the latent heating rates in the convective environment, the developing and dissipating stages of the MCS are considered based on the rainfall observations of TRMM (Figure 3b). A dense network of automatic weather station (AWS) observations are gridded using a spatial linear interpolation technique to compare the model simulations. The AWS and TRMM observations showed a large patch of rainfall associated with the convective system (Figure 3a,b). It is noticed that the WRF model with single- and double-moment microphysics captured the rainfall related to MCS passage, however, the rainfall is underestimated with an eastward shift (Figure 3c,d). The rainfall distribution showed that among the schemes, there is spatial difference in intensity and distribution. Improved pattern correlation is evident in WDM6 (0.59) compared to WSM6 (0.58) against the TRMM observations. The spatial location of the heavy rainfall patch (red rectangle in Figure 3) is better captured in WDM6 compared to WSM6. However, the spatial distribution of rainfall is not properly simulated in both schemes compared to the TRMM observations.
To examine the latent heating rate structure in different stages of the system, the grid box region (127.7–128.1° E and 36.9–37.3° N) is considered for analysis. It is to be noted that the system has developed as part of synoptic frontal forcing, and when the system moved over the grid box region, it is already in the developing stage. Temporal distribution from the TRMM and WRF (Figure 3e) simulations showed a gradual increase in rainfall from 06 UTC 15 July 2017 to 18 UTC 15 July 2017 (considered as developing/mature stage), and a decrease in rainfall is noticed from 21 UTC 15 July 2017 to 09 UTC 16 July 2017 (considered as dissipating stage of the system). During the developing stage, TRMM shows the rainfall amount reaching up to ∼55 mm/3 h (green line), and the model could capture the rainfall reaching up to 40 mm/3 h (brown line), however, it underestimated. A gradual decrease in the rainfall is evident in both the observations and model runs during the dissipating stage. Even though there are discrepancies, the spatial and temporal distribution of rainfall is well-represented in the model simulation.
To better understand the differences in rainfall distribution between the schemes (convective structure and temporal evolution of rainfall), the total cloud hydrometeors (Figure 4) are evaluated over the precipitation core region (red rectangle in Figure 3). The domain averaged vertical profiles of the condensates obtained from WDM6 and WSM6 experiments, and their differences are plotted (Figure 4). The distribution of the total hydrometeors is dominant in WDM6 compared to WSM6.
To distinguish the differences between the microphysical schemes, vertical distribution of both the total and individual hydrometeors during developing and dissipating stages of the severe convective system are analysed (Figure 4). Vertical distribution of the total cloud hydrometeors showed the varied distribution between the schemes (WDM6/WSM6). Overall, WDM6 showed more hydrometeor content compared to WSM6 in the developing stage.
The vertical profiles of individual hydrometeors (qc, qi, qr, qs, qg) are averaged over the precipitation core region in various stages of the system (Figure 5). During the developing stage, the mean distribution of individual hydrometeors (qc, qr, qs, qg) dominated in WDM6 (solid line) compared to WSM6 (dotted solid line), particularly more rain and cloud water mixing ratio are noticed in WDM6. Both schemes followed a similar distribution of solid hydrometeors (qi, qs, qg) related to cold-rain processes above the freezing level, however, the intensity is greater in WDM6, whereas the liquid hydrometeors (qr, qc) in connection to the warm-rain processes has showed larger differences in distribution. Increased qr in WDM6 in the lower levels can be attributed to the active conversion of cloud droplets to rain. An increase in qs distribution (WDM6) can be due to the effective conversion from cloud ice to snow through the snow accretion as reported in previous studies [60]. However, both simulations produced similar profiles for ice (qi) as WDM6 follows the cold-rain processes of WSM6 and the additional processes in the WDM6 scheme may not affect the ice-phase properties directly, so this must originate from the difference from warm-rain processes. In the dissipating stage, more qc and less qs are noticed in WDM6 (WSM6), however, the other hydrometeors produced similar profiles in both schemes.
To further address the differences between the schemes, the distribution of rain number concentration (Nr) is investigated (Figure 6). It is important to note that Nr is a prognostic variable in WDM6 whereas a diagnostic variable in WSM6. For comparison, Nr is also computed using WSM6 [33]. Details are provided in Table 1. High Qc at lower levels in WDM6 can be attributed to the presence of cloud condensation nucleation. The higher Nr in the double-moment approach led to enhanced evaporation below, with a few raindrops dropping to the ground over the stratiform region.

5.2. Assessing the Rain Number Concentration

WDM6 has vastly diverse cloud water and rainwater distribution structures compared to WSM6; as cloud water and rain number concentrations are included in WDM6, the auto-conversion rate of cloud water into rain and the accretion rate of cloud water by rain are also changed (Figure 5). Furthermore, higher rainwater areas are in lower levels and closer to the surface in WSM6 whereas more rainwater (Figure 5) is evident in relatively higher levels as more cloud water has been converted to form rainwater against the lower cloud water number concentration (Figure 6). More rainwater in the higher levels is noticed in WDM6 as more cloud water transformed to form rainwater against the lower cloud water number concentration.
As the warm rain physics for clouds and rain are alike for both single- and double-moment schemes, the differences among the two simulations are mostly due to the prognostic rain number concentration in the WDM6 scheme. To further investigate the differences in the vertical distribution of the total cloud hydrometeors, the rain number concentration is plotted. Basically, in WDM6, the rain number concentration is a prognostic variable that is not available in WSM6 and is computed based on the particle density [60]. Higher values of Nr are evident in WDM6 compared to WSM6. The rain particle mass is also greater, and the vertical distribution is also different due to the varied assumptions of the rain number concentrations in both schemes. Size-sorting is clear in WDM6 from the rain particle mass (Figure 6e) as smaller droplets evaporate at higher levels and larger droplets reach lower levels. The resulting change in the mean fall speed also contributed to the top-heavy qr profile (Figure 5). WSM6 maintained a more uniform size distribution (Figure 6b) through the precipitating layer and has similar mean size to WDM6 (Figure 6e) near the surface along with rain rates. These differences in rain number concentration between the schemes contributed to the varied representation of the rain mixing ratio profile. Furthermore, WDM6 (Figure 6f) simulated more rain particle mass at the surface in the developing stage compared to WSM6 (Figure 6e), which could be due to enhanced melting of solid ice elements.
Furthermore, the cloud mixing ratio along with cloud number concentration is also investigated (Figure 7), considerable differences in vertical distribution is noticed between the schemes (top panel, Figure 7), which can be attributed to the inclusion of the number concentration in WDM6, which affects the cloud particle mass (lower panel, Figure 7). Significant differences in vertical distribution of cloud mixing ratio are noticed between the schemes (top panel, Figure 7), which can be due to the inclusion of number concentration in WDM6, which affects the cloud particle mass (lower panel, Figure 7). The cloud droplet sizes in WDM6 are generally smaller than in WSM6. The formation of rain seems to deplete the number of cloud droplets and did not affect the mean droplet mass in the double-moment scheme. In the single-moment scheme, the number is specified, so the mean droplet mass is reduced as rain forms, but the overall qc profile distribution is similar during the developing stage (left panel, Figure 5) and few differences are noted at lower levels in the dissipating stage (right panel, Figure 5).
Differences between the single- and double-moment schemes (WDM6/WSM6) can be attributed to the prognostic versus diagnostic rain number concentrations in microphysical terms. The 2M approach allows for more flexibility in size distribution, permitting the mean diameter to evolve in contrast to the 1M approach and improved the simulation of the cloud vertical structure and storm dynamics. For source and sink terms in warm-rain processes, the formulae in WSM6 are adopted. The formulation of warm-rain processes are similar in both WSM6/WDM6; however, the prognostic treatment of the number concentration of cloud and rain can influence the ice processes indirectly and affect the simulation. It is to be recalled that due to the differences in warm-rain processes, rainfall simulations from WSM6 and WDM6 have a different precipitation distribution (Figure 3).
To further examine the intrinsic differences among the microphysics schemes, the latent heating profiles of major transformation processes (condensation, evaporation, and freezing, melting, deposition, and sublimation terms) are analysed (Figure 8). The latent heating and cooling rates caused by the phase change processes of water are vital for providing the energy source for the convective system, thus modifying the vertical temperature structure. Diabatic heating–cooling processes at varying heights in diverse microphysics schemes are obtained by averaging the tendencies at each grid pixel in the convective or stratiform region.
It is evident that a varied vertical distribution is evident between the schemes; particularly in the developing stage (around 18 UTC), the net heating rate is more uniform, however, it is multicellular in WDM6. For further investigation, individual heating rates from major transformation processes (condensation, evaporation, melting, freezing, sublimation, and deposition) are studied. Major differences are evident from the condensation and evaporation processes in connection with the warm-rain processes. These can be related to the inclusion of CCN activation and rain number concentration in the WDM6, which further impact the warm-rain processes. In detail, increased (reduced) LH evaporation in WDM6 during the developing (dissipating) stages (Figure 9) can be attributed to differences in the predicted rain size distribution intercept parameter in WDM6, which was specified as constant in WSM6. In the developing stage, rain evaporation tends to be higher in WDM6 as the smaller droplets are concentrated there. [18] further demonstrated that in an idealized 2D storm experiment, the double-moment scheme enhanced the precipitation activities by reducing the rain evaporation in the trailing stratiform region compared to the 1M scheme, leading to amplified stratiform precipitation at the surface, a weakened cold pool, and a more realistic vertical profile of radar reflectivity, whereas the convective activities in the convection core region are weakened due to differences in the rain evaporation rate through variable raindrop size distribution. In contrast, the heating rate (deposition, freezing, melting) related to cold-cloud processes does not show many differences between the simulations as both schemes followed the same assumptions regarding cold cloud microphysical processes. In terms of organized deep convection, key processes that are affected by using two-moment versus one-moment schemes include particle size sorting and rain evaporation [20,21,26].
The mean latent heating profiles during the developing and dissipating stages between the single- and double-moment schemes showed that more condensation, freezing, and deposition (warming process) are evident in WDM6 (Figure 10a) along with high evaporation (cooling processes) compared to WSM6 (Figure 10c). During the dissipating stage, overall, more evaporation is evident in WDM6 (Figure 10b) compared to WSM6 (Figure 10d). It is noticed that the change in cold-cloud processes along with CCN activation affected the vertical distribution of the cloud and storm dynamics, and subsequently the rainfall distribution.

5.3. Impact of Change in CCN

The aerosol effects on the cloud rain properties and surface precipitation are also investigated by varying the initial CCN number concentration to understand the effect of CCN in the vertical structure of cloud and storm dynamics. Aerosol distributions can influence the cloud droplet size distributions, warm- and cold-rain processes and affect the depth of mixed phase regions. The effect of increasing the aerosols on deep convective clouds and differences in aerosol effects for two microphysics schemes are examined. Furthermore, the impact of changing the aerosol concentration on the vertical structure of the storm is also investigated by varying the number and mass of aerosols at the initial time. In the control experiment, the initial CCN number concentration of (100 cm−3) is employed in the WDM6 microphysics scheme. Additional experiments by changing the CCN to 1000 cm−3 are also considered for study. Accumulated rainfall distribution with a change in the aerosol conditions in the model simulations are investigated (Figure 11).
It is evident that the pattern correlation improved to 0.615 with increase in CCN (Figure 11c), which signifies the importance of aerosols on the cloud vertical distribution and subsequent rainfall. For a deeper investigation, the LH profiles are also studied. Figure 12 shows the simulated cloud hydrometeors, LH rates and reflectivity from the numerical simulations based on different initial CCN number concentrations. Increased CCN (1000) resulted in differences in the total hydrometeor content, net heating rate; the main differences are noticed in the heating rate terms of freezing and rain evaporation. An amplified LH rate for evaporation and freezing is noted with an increase in CCN concentration. Greater freezing of cloud droplets and associated latent heat release above the freezing level can increase the hail growth and enhance the cold-rain processes, affecting the vertical distribution of cloud.
To be consistent with the previous observational studies, relatively elevated drop concentrations in the convective core due to collision–coalescence versus low drop concentrations in the stratiform region due to the enhanced rain formation by the melting process of ice particles are reproduced by the double-moment approach [60].
Greater freezing of cloud droplets and associated latent heat release above the 0 °C isotherm can enhance the growth of large hail and cold-rain processes. Aerosol distributions can influence the cloud droplet size distribution, warm-rain process, cold-rain process, and the depth of mixed phase regions. Furthermore, the hydrometeor content, LH distribution, and LH of evaporation and absorption by freezing is increased (right panel, Figure 12), which alter the warm- and cold rain processes, vertical distribution of cloud, and subsequent rainfall.
To study the effect of the net latent heating rate on microphysical processes, the contribution of different microphysical processes from WRF simulations (1M, 2M, and change in CCN) is also investigated (Figure 13).
Between the 1M and 2M schemes, the inclusion of CCN in the later has an impact on the condensation, deposition, and ice generation terms. In 1M, a high contribution from snow deposition and ice generation is evident, however, in 2M, lower values of ice deposition and ice generation is noted along with the contribution from graupel accretion, a deposition which is missing in 1M. An increase in CCN also showed a similar contribution with a slight increase in contribution from ice generation and graupel accretion. For cooling processes, in the 1M scheme contribution of sublimation (snow, graupel, ice) is evident, however, from cloud evaporation it is very low, which is more notable in 2M. For 2M, a contribution from evaporation (rain, cloud), sublimation (snow), and melting is noted. Similar features are also noted with an increase in CCN simulation (Figure 13).

5.4. Evaluation of Simulated Net Latent Heating Rate with Diabatic Heating Rate Terms from ERA5 Analysis

To compare the simulated latent heating rate from both the 1M and 2M schemes, heat source and moisture sink terms (Q1, Q2) are computed (Figure 14) based on Yanai et al., (1973) [45] using ERA5 reanalysis data (ECMWF Reanalysis v5, https://climate.copernicus.eu/, accessed on 28 September 2023). In general, Q1 describes the total diabatic heating associated with the surface heat flux, latent heating, and radiation (Figure 14d), and Q2 (Figure 14e) represents the latent heating due to condensation and evaporation processes and sub-grid scale heat flux.
From Figure 14, it is noticed that the Q2 profile based on ERA5 (Figure 14e) is reasonably matching with the simulated net latent heating rate from WDM6 (Figure 14b) compared to WSM6 (Figure 14a). In particular, the multicell structure is clearer in WDM6. A comparison of the heating terms with the simulated latent heating process can be further helpful to assess and discriminate the specific heating processes in the atmosphere. It is also evident that significant differences are noted with changes in the microphysical processes. Therefore, it is a helpful proxy to test the sensitivity of different microphysical schemes and further improve the microphysics and convective processes.

6. Conclusions

Current study deals with the effect of different microphysical schemes on the simulation of a mesoscale convective system formed over the Korean Peninsula associated with the frontal forcing (Changma front). Warm moist air intrusion by a south-westerly low-level flow towards the Korean Peninsula has created an unstable atmosphere favourable for severe convection. Four nested domain (27, 9, 3, 1 km) simulations using the two-way nesting method are considered for simulation using the WRF model. Numerical experiments are conducted by changing the cloud microphysics options (WRF and KIM physics) to examine the sensitivity as the microphysics largely affect the storm dynamics and precipitation simulations. Particularly in terms of organised deep convection, key processes are influenced by using two-moment versus one-moment schemes including particle size sorting and rain evaporation [18,70]. Model simulations are evaluated using the AWS and TRMM measurements. For a deeper investigation of the differences in single- and double-moment microphysical schemes, latent heating rates are computed using microphysical transformation terms. Differences in the simulations between the schemes are thoroughly investigated by examining the rain particle mass. Furthermore, the effect of change in the cloud condensation nuclei (aerosol content) on the vertical growth of the cloud also examined.
Based on the temporal evolution of rainfall distribution, developing and dissipating stages over the precipitation core region are considered. Six categories of phase transformation processes (condensation, evaporation, deposition, sublimation, freezing, and melting) that represent the heat release or absorption during different phases of the severe convective system are considered for latent heat computation [9,47]. Over the innermost domain, the model simulated rainfall against the AWS observations revealed that the spatial distribution of rainfall is better simulated in WDM6 with improved pattern correlation. The distribution of the sum of the total hydrometeors dominated in WDM6 compared to WSM6. The individual distribution of liquid hydrometeors (rain, cloud) is comparatively higher in WDM6 with fewer differences in solid hydrometeors in the developing stage. Furthermore, WDM6 produced more spread than WSM6 below the melting layer due to its double-moment treatment of warm-rain processes. In the dissipating stage, WSM6 and WDM6 have similar vertical spread structures for solid hydrometeors due to their similar ice-phase formulas.
Further investigation of the rain number concentration (Nr) showed higher values of Nr in WDM6 compared to WSM6. The rain particle mass is also greater in WDM6, and the vertical distribution is different due to the varied assumptions of rain number concentrations in both the schemes. Differences between the single- and double-moment schemes (WDM6/WSM6) can be attributed to the prognostic versus diagnostic rain number concentrations in the microphysical terms. The updated warm rain physics (e.g., auto conversion and accretion processes based on the stochastic collection equation) and the double-moment approach for liquid species appeared to improve the performance of the WDM6 scheme in comparison to WSM6. An increase in CCN (aerosol) enhanced the rainfall distribution with more hydrometeor distribution. It can be inferred that the change in aerosol increased the net latent rate due to an increase in the LH evaporation and freezing process due to variations in the warm- and cold-cloud processes, cloud vertical distribution, and subsequent rainfall. Compared to WSM6, the simulated LH profile from WDM6 is more consistent with the source and sink terms computed from ERA5.
The present study thus demonstrates that the inclusion of the number concentration of rain and cloud, and cloud condensation activation along with the mixing ratio of cloud hydrometeors in WDM6 improved the storm morphology over different stages of the system. Although only one case study was performed, the present results (evaluation of latent heating profiles) suggest a strategy for further improving the microphysics schemes. Further investigation can be carried out with more case scenarios (different geographical regions, background forcing mechanisms, and modelling experiments), which forms the basis of future study. To generalise the latent heating structure, more cases over different regions are necessary as the cloud vertical structure varies based on the geographical region and season [53,71]. A more vigorous examination of varying weather systems (thunderstorms, monsoon depressions, and tropical cyclones, etc.) is required to provide broader results, and more case studies need to be examined to draw statistically significant conclusions. Uncertainty in the sampling strategies of observational and reanalysis products (TRMM/ERA5) can also limit the validation of model simulations [72]. Furthermore, sophisticated microphysics parameterisation schemes (multi-moment, bin type) can also be evaluated, which may have more flexibility to describe the microphysical processes. In addition, the scale dependence of the cloud microphysical response to turbulent entrainment-mixing parameterisations also needs to be accounted for as it affects the warm cumulus and stratus clouds [37,38]. Thus, the current study is very useful for both research and operational applications viz., deep evaluation and the further development of physics modules for both cumulus and microphysics and their interactions [9]. Choosing the right physics schemes for a severe convective event (season/region wise), particularly for regional NWP models, is needed to improve the operational forecasting. Even with continuous improvement in different components of the NWP models [8,73,74,75]), the location and intensity forecast of these severe convective systems are still challenging, so also monitoring these prognostic products, along with the basic and diagnostic meteorological parameters, can provide added guidance to improve the nowcast warnings [76] of these MCSs, which have great socio-economic importance.

Author Contributions

Conceptualization, A.M.; Methodology, A.M. and J.D.; Software, A.M.; Validation, J.D.; Formal analysis, A.M.; Investigation, A.M.; Resources, R.-S.P., S.C.B. and M.M.; Data curation, A.M.; Writing—original draft, A.M.; Writing—review & editing, A.M. and J.D.; Visualization, A.M.; Supervision, J.D.; Funding acquisition, R.-S.P. All authors have read and agreed to the published version of the manuscript.

Funding

This work was carried out through the R&D project “Development of a Next-Generation Numerical Weather Prediction Model by the Korea Institute of Atmospheric Prediction Systems (KIAPS)”, funded by the Korea Meteorological Administration (KMA2020-02212).

Institutional Review Board Statement

Not applicable.

Informed Consent Statement

Not applicable.

Data Availability Statement

Data employed from various platforms (TRMM, AWS NCEP FNL, ERA5, WRF model output) to prepare the graphics used in the present study are accessible at https://doi.org/10.5061/dryad.9kd51c5q3 (accessed on 29 August 2023).

Acknowledgments

Special thanks to Song-You Hong, KIAPS, for his kind encouragement and in providing the necessary resources to conduct this study as well as initiating this collaborative work with NCAR, USA. The first author would also like to acknowledge Hyun-Joo Choi, KMA, Sooya Bae, and Ji-Young Han for their cooperative discussions and Tae-Hun Kim, KIAPS, for essential suggestions. Public access to the WRF model (https://www2.mmm.ucar.edu/wrf/users/, accessed on 28 September 2023), FNL data (https://rda.ucar.edu/datasets/ds083.2/, accessed on 28 September 2023), and TMPA observations ((https://pmm.nasa.gov/data-access/downloads/trmm, accessed on 28 September 2023) by the NCAR, NCEP, and NASA teams, is greatly acknowledged. The authors would like to acknowledge the KMA for providing the AWS observations. Data analysis and graphics were conducted using MATLAB (https://www.mathworks.com/products/matlab.html, accessed on 28 September 2023), the M_Map mapping package (https://www.eoas.ubc.ca/~rich/map.html, accessed on 28 September 2023), NCL (https://www.ncl.ucar.edu/, accessed on 28 September 2023), and grads (http://cola.gmu.edu/grads/, accessed on 28 September 2023). The first author would like to acknowledge M. Rajeevan, NCESS, MoES, Trivandrum, India for his continuous encouragement and support as well as P. Mukhopadhyay, IITM, Pune, India for the constructive comments. Special thanks to Vijay S. Thallapragada, NOAA, USA, D.R. Pattanaik, IMD, New Delhi, India, Ashok Kumar Das, IMD, New Delhi, India, Rahul Saxena, IMD, New Delhi, India and Kamaljit Ray, MoES, New Delhi, India for their encouragement. Special thanks to the three anonymous reviewers and the editor for their careful examination of the manuscript, which helped to improve the quality of the manuscript.

Conflicts of Interest

The authors declare no conflict of interest.

Appendix A

AbbreviationDescription of Production Rates of Microphysical Transformation Terms
(Lim and Hong, 2010) [60]
Pr_condcondensation/evaporation rate of cloud water
Pr_cactActivation of cloud condensation nuclie
Pr_rautautoconversion of cloud water into rain
Pr_sautautoconversion of cloud ice into snow
Pr_gautautoconversion of snow into graupel
Pr_revpevaporation-condensation rate of rain
Pr_sevpevaporation of melting snow
Pr_gevpevaporation of melting graupel
Pr_idepdeposition-sublimation rate of ice
Pr_sdepdeposition-sublimation rate of snow
Pr_gdepdeposition/sublimation rate of graupel
Pr_imltinstantaneous melting of cloud ice
Pr_smltmelting of snow
Pr_gmltmelting of graupel
Pr_semlenhanced melting of snow
Pr_gemlenhanced melting rate of graupel
Pr_racwaccretion of cloud water by rain
Pr_sacwaccretion of cloud water by snow
Pr_gacwaccretion of cloud water by graupel
Pr_gacraccretion of rain by graupel
Pr_sacraccretion of rain by snow
Pr_iacraccretion of rain by cloud ice
Pr_racsaccretion of snow by rain
Pr_gacsaccretion of cloud ice by graupel
Pr_raciaccretion of cloud ice by rain
Pr_gaciaccretion of cloud ice by graupel
Pr_saciaccretion of cloud ice by snow
Pr_igengeneration (nucleation) of ice from vapor

References

  1. Waliser, D.E.; Li, J.-L.F.; Woods, C.P.; Austin, R.T.; Bacmeister, J.; Chern, J.; Del Genio, A.; Jiang, J.H.; Kuang, Z.; Meng, H.; et al. Cloud ice: A climate model challenge with signs and expectations of progress. J. Geophys. Res. 2009, 114, D00A21. [Google Scholar] [CrossRef]
  2. Dudhia, J. Numerical study of convection observed during the winter monsoon experiment using a mesoscale two-dimensional model. J. Atmos. Sci. 1989, 46, 3077–3107. [Google Scholar] [CrossRef]
  3. Seifert, A.; Beheng, K.D. A two-moment cloud microphysics parameterization for mixed-phase clouds. Part 1: Model description. Meteorol. Atmos. Phys. 2006, 92, 45–66. [Google Scholar] [CrossRef]
  4. Choudhury, A.D.; Krishnan, R. Dynamical response of the South Asian monsoon trough to latent heating from stratiform and convective precipitation. J. Atmos. Sci. 2011, 68, 1347–1363. [Google Scholar] [CrossRef]
  5. Hazra, A.; Goswami, B.N.; Chen, J.-P. Role of interactions between aerosol radiative effect, dynamics and cloud microphysics on transitions of monsoon intraseasonal oscillations. J. Atmos. Sci. 2013, 70, 2073–2087. [Google Scholar] [CrossRef]
  6. Hazra, A.; Chaudhari, H.S.; Pokhrel, S.; Saha Subodh, K. Indian summer monsoon precipitating clouds: Role of microphysical process rates. Clim. Dyn. 2016, 46, 2551–2571. [Google Scholar] [CrossRef]
  7. Hong, S.Y.; Noh, Y.; Dudhia, J. A new vertical diffusion package with an explicit treatment of entrainment processes. Mon. Weather Rev. 2006, 134, 2318–2341. [Google Scholar] [CrossRef]
  8. Madhulatha, A.; Rajeevan, M. Impact of different parameterization schemes on simulation of mesoscale convective system over south-east India. Meteorol. Atmos. Phys. 2018, 130, 49–65. [Google Scholar] [CrossRef]
  9. Madhulatha, A.; Dudhia, J.; Park, R.S.; Rajeevan, M. Simulation of latent heating rate from the microphysical process associated with Mesoscale Convective System over Korean Peninsula. Earth Space Sci. 2022, 9, e2022EA002419. [Google Scholar] [CrossRef]
  10. Osuri, K.K.; Mohanty, U.C.; Routray, A.; Niyogi, D. Improved prediction of Bay of Bengal tropical cyclones through assimilation of Doppler weather radar observations. Mon. Weather Rev. 2015, 143, 4533–4560. [Google Scholar] [CrossRef]
  11. Pattanaik, D.R.; Kumar, A.; Rao, Y.R.; Mukhopadhyay, B. Simulation of monsoon depression over India using high resolution WRF Model—Sensitivity to convective parameterization schemes. Mausam 2011, 62, 305–320. [Google Scholar] [CrossRef]
  12. Rajeevan, M.; Kesarkar, A.; Thampi, S.B.; Rao, T.N.; Radhakrishna, B.; Rajasekhar, M. Sensitivity of WRF cloud microphysics to simulations of a severe thunderstorm event over Southeast India. Ann. Geophys. 2010, 28, 603–619. [Google Scholar] [CrossRef]
  13. Rajeevan, M.; Rohini, P.; Niranjan Kumar, K.; Srinivasan, J.; Unnikrishnan, C.K. A study of vertical cloud structure of the Indian summer monsoon using CloudSat data. Clim. Dyn. 2013, 40, 637–650. [Google Scholar] [CrossRef]
  14. Tao, W.K.; Lang, S.; Zeng, X.; Shige, S.; Takayabu, Y. Relating convective and stratiform rain to latent heating. J. Clim. 2010, 23, 1874–1893. [Google Scholar] [CrossRef]
  15. Gilmore, M.S.; Straka, J.M.; Rasmussen, E.N. Precipitation uncertainty due to variations in precipitation particle parameters within a simple microphysics scheme. Mon. Weather Rev. 2004, 132, 2610–2627. [Google Scholar] [CrossRef]
  16. Putnam, B.J.; Xue, M.; Jung, Y.; Zhang, G.; Kong, F. Simulation of polarimetric radar variables from 2013 CAPS spring experiment storm-scale ensemble forecasts and evaluation of microphysics schemes. Mon. Weather Rev. 2017, 145, 49–73. [Google Scholar] [CrossRef]
  17. Grabowski, W.W.; Morrison, H.; Shima, S.I.; Abade, G.C.; Dziekan, P.; Pawlowska, H. Modeling of cloud microphysics: Can we do better. Bull. Am. Meteorol. Soc. 2019, 100, 655–672. [Google Scholar] [CrossRef]
  18. Morrison, H.; Thompson, G.; Tatarskii, V. Impact of cloud microphysics on the development of trailing stratiform precipitation in a simulated squall line: Comparison of one and two-moment schemes. Mon. Weather Rev. 2009, 137, 991–1007. [Google Scholar] [CrossRef]
  19. Ulbrich, C.W. Natural variations in the analytical form of the raindrop size distribution. J. Clim. Appl. Meteorol. 1983, 22, 1764–1775. [Google Scholar] [CrossRef]
  20. Milbrandt, J.A.; Yau, M.K. A multimoment bulk microphysics parameterization. Part II: A proposed three-moment closure and scheme description. J. Atmos. Sci. 2005, 62, 3065–3081. [Google Scholar] [CrossRef]
  21. Dawson, D.T.; Xue, M.; Milbrandt, J.A.; Yau, M.K. Comparison of evaporation and cold pool development between single-moment and multimoment bulk microphysics schemes in idealized simulations of tornadic thunderstorms. Mon. Weather Rev. 2010, 138, 1152–1171. [Google Scholar] [CrossRef]
  22. Khain, A.P.; BenMoshe, N.; Pokrovsky, A. Factors determining the impact of aerosols on surface precipitation from clouds: An attempt at classification. J. Atmos. Sci. 2008, 65, 1721–1748. [Google Scholar] [CrossRef]
  23. Ming, Y.; Ramaswamy, V.; Donner, L.J.; Phillips, V.T.J.; Klein, S.A.; Ginoux, P.A.; Horowitz, L.W. Modeling the interactions between aerosols and liquid water clouds with a self-consistent cloud scheme in a general circulation model. J. Atmos. Sci. 2007, 64, 1189–1209. [Google Scholar] [CrossRef]
  24. Wang, C. A modeling study of the response of tropical deep convection to the increase of cloud condensation nuclei concentration: 1. Dynamics and microphysics. J. Geophys. Res. Atmos. 2005, 110, D21211. [Google Scholar] [CrossRef]
  25. Cohard, J.M.; Pinty, J.P. A comprehensive two-moment warm microphysical bulk scheme. I: Description and tests. Q. J. R. Meteorol. Soc. 2000, 126, 1815–1842. [Google Scholar]
  26. Morrison, H.C.J.A.; Curry, J.A.; Khvorostyanov, V.I. A new double-moment microphysics parameterization for application in cloud and climate models. Part I: Description. J. Atmos. Sci. 2005, 62, 1665–1677. [Google Scholar] [CrossRef]
  27. Zhang, J.; Sun, J.; Deng, W.; Ma, Y. Newly developed multiparameter bulk cloud schemes. Part I: A new triple-moment condensation scheme and tests. J. Atmos. Sci. 2022, 79, 2645–2684. [Google Scholar] [CrossRef]
  28. Khairoutdinov, M.; Kogan, Y. A new cloud physics parameterization in a large-eddy simulation model of marine stratocumulus. Mon. Weather. Rev. 2000, 128, 229–243. [Google Scholar] [CrossRef]
  29. Heymsfield, A.J.; Kramer, M.; Luebke, A.; Brown, P.; Cziczo, D.J.; Franklin, C.; Lawson, P.; Lohmann, U.; McFarquhar, G.; Ulanowski, Z.; et al. Cirrus clouds. Meteorol. Monogr. 2017, 58, 2.1–2.26. [Google Scholar] [CrossRef]
  30. Phillips, V.T.; Donner, L.J.; Garner, S.T. Nucleation processes in deep convection simulated by a cloud-system-resolving model with double-moment bulk microphysics. J. Atmos. Sci. 2007, 64, 738–761. [Google Scholar] [CrossRef]
  31. Tölle, M.H.; Krueger, S.K. Effects of entrainment and mixing on droplet size distributions in warm cumulus clouds. J. Adv. Model. Earth Syst. 2014, 6, 281–299. [Google Scholar]
  32. Weisman, M.L.; Klemp, J.B.; Rotunno, R. Structure and evolution of numerically simulated squall lines. J. Atmos. Sci. 1988, 45, 1990–2013. [Google Scholar] [CrossRef]
  33. Morrison, H.; Milbrandt, J.A. Comparison of two-moment bulk microphysics schemes in idealized supercell thunderstorm simulations. Mon. Weather Rev. 2011, 139, 1103–1130. [Google Scholar] [CrossRef]
  34. Ramanathan, V.C.P.J.; Crutzen, P.J.; Kiehl, J.T.; Rosenfeld, D. Aerosols, climate, and the hydrological cycle. Science 2001, 294, 2119–2124. [Google Scholar] [CrossRef]
  35. Reisner, J.; Rasmussen, R.M.; Bruintjes, R.T. Explicit forecasting of supercooled liquid water in winter storms using the MM5 mesoscale model. Q. J. R. Meteorol. Soc. 1998, 124, 1071–1107. [Google Scholar] [CrossRef]
  36. Kumar, B.; Götzfried, P.; Suresh, N.; Schumacher, J.; Shaw, R.A. Scale dependence of cloud microphysical response to turbulent entrainment and mixing. J. Adv. Model. Earth Syst. 2018, 10, 2777–2785. [Google Scholar] [CrossRef]
  37. Xu, X.; Lu, C.; Liu, Y.; Luo, S.; Zhou, X.; Endo, S.; Wang, Y. Influences of an entrainment–mixing parameterization on numerical simulations of cumulus and stratocumulus clouds. Atmos. Chem. Phys. 2022, 22, 5459–5475. [Google Scholar] [CrossRef]
  38. Zhu, L.; Lu, C.; Xu, X.; He, X.; Li, J.; Luo, S.; Wang, Y.; Wang, F. The Probability Density Function Related to Shallow Cumulus Entrainment Rate and Its Influencing Factors in a Large-Eddy Simulation. Adv. Atmos. Sci. 2023, 1–15. [Google Scholar] [CrossRef]
  39. Byun, U.Y.; Hong, J.; Hong, S.Y.; Shin, H.H. Numerical simulations of heavy rainfall over central Korea on 21 September 2010 using the WRF model. Adv. Atmos. Sci. 2015, 32, 855–869. [Google Scholar] [CrossRef]
  40. Flaounas, E.; Bastin, S.; Janicot, S. Regional climate modelling of the 2006 West African monsoon: Sensitivity to convection and planetary boundary layer parameterisation using WRF. Clim. Dyn. 2011, 36, 1083–1105. [Google Scholar] [CrossRef]
  41. Hong, S.-Y.; Lim, J.-O.J. The WRF single-moment 6-class microphysics scheme (WSM6). J. Korean Meteorol. Soc. 2006, 42, 129–151. [Google Scholar]
  42. Wang, J.J.; Li, X.; Carey, L.D. Evolution, structure, cloud microphysical, and surface rainfall processes of monsoon convection during the South China Sea Monsoon Experiment. J. Atmos. Sci. 2007, 64, 360–380. [Google Scholar] [CrossRef]
  43. Rosenfeld, D.; Lohmann, U.; Raga, G.B.; O’Dowd, C.D.; Kulmala, M.; Fuzzi, S.; Reissell, A.; Andreae, M.O. Flood or drought: How do aerosols affect precipitation? Science 2008, 321, 1309–1313. [Google Scholar] [CrossRef] [PubMed]
  44. Bhat, G.S.; Chakraborty, A.; Nanjundiah, R.S.; Srinivasan, J. Vertical thermal structure of the atmosphere during active and weak phases of convection over the North Bay of Bengal: Observation and model results. Curr. Sci. 2002, 83, 296–302. [Google Scholar]
  45. Yanai, M.; Esbensen, S.; Chu, J.H. Determination of bulk properties of tropical cloud clusters from largescale heat and moisture budgets. J. Atmos. Sci. 1973, 30, 611–627. [Google Scholar] [CrossRef]
  46. Hong, S.Y.; Sunny Lim, K.S.; Kim, J.H.; Jade Lim, J.O.; Dudhia, J. Sensitivity study of cloud-resolving convective simulations with WRF using two bulk microphysical parameterizations: Ice-phase microphysics versus sedimentation effects. J. Appl. Meteorol. Climatol. 2009, 48, 61–76. [Google Scholar] [CrossRef]
  47. Madhulatha, A.; Dudhia, J. Effect of single and double moment microphysics schemes and change in CCN, latent heating rate structure associated with severe convective system over Korean Peninsula. AGU Fall Meet. Abstr. 2022, 2020, A045-08. [Google Scholar]
  48. Bhaskar Rao, D.V.; Hari Prasad, D. Sensitivity of tropical cyclone intensification to boundary layer and convective processes. Nat. Hazards 2007, 41, 429–445. [Google Scholar] [CrossRef]
  49. Lee, S.S.; Donner, L.J. Effects of cloud parameterization on radiation and precipitation: A comparison between single-moment microphysics and double-moment microphysics. TAO Terr. Atmos. Ocean. Sci. 2011, 22, 4. [Google Scholar] [CrossRef]
  50. Mukhopadhyay, P.; Mahakur, M.; Singh, H.A.K. Interaction of large scale and mesoscale environment leading to formation of intense thunderstorms over Kolkata. Part I: Doppler radar and satellite observations. J. Earth Syst. Sci. 2009, 118, 441–466. [Google Scholar] [CrossRef]
  51. Prabha, T.V.; Khain, A.; Maheshkumar, R.S.; Pandithurai, G.; Kulkarni, J.R.; Konwar, M.; Goswami, B.N. Microphysics of Premonsoon and monsoon clouds as seen from in situ measurements during the cloud aerosol interaction and precipitation enhancement experiment (CAIPEEX). J. Atmos. Sci. 2011, 68, 1882–1901. [Google Scholar] [CrossRef]
  52. Chen, S.J.; Lee, D.K.; Tao, Z.Y.; Kuo, Y.H. Mesoscale convective system over the yellow sea—A numerical case study. Meteorol. Atmos. Phys. 1999, 70, 185–199. [Google Scholar] [CrossRef]
  53. Madhulatha, A.; Choi, S.J.; Han, J.Y.; Hong, S.Y. Impact of different nesting methods on the simulation of a severe convective event over South Korea using the Weather Research and Forecasting Model. J. Geophys. Res. Atmos. 2021, 126, e2020JD033084. [Google Scholar] [CrossRef]
  54. Skamarock, W.C.; Klemp, J.B.; Dudhia, J.; Gill, D.O.; Barker, D.M.; Duda, M.; Huang, X.Y.; Wang, W.; Powers, J.G. A Description of the Advanced Research WRF Version 3; NCAR Technical Note NCAR/TN-468+STR; University Corporation for Atmospheric Research: Boulder, CO, USA, 2008; p. 123. [Google Scholar]
  55. Hong, S.-Y.; Kwon, Y.C.; Kim, T.-H.; Kim, J.-E.E.; Choi, S.-J.; Kwon, I.-H.; Kim, J.; Lee, E.-H.; Park, R.-S.; Kim, D.-I. The Korean Integrated Model (KIM) System for global weather forecasting. Asia-Pac. J. Atmos. Sci. 2018, 54 (Suppl. S1), 267–292. [Google Scholar] [CrossRef]
  56. Han, J.Y.; Hong, S.Y.; Sunny Lim, K.S.; Han, J. Sensitivity of a cumulus parameterization scheme to precipitation production representation and its impact on a heavy rain event over Korea. Mon. Weather Rev. 2016, 144, 2125–2135. [Google Scholar] [CrossRef]
  57. Kwon, Y.C.; Hong, S.Y. A mass-flux cumulus parameterization scheme across gray-zone resolutions. Mon. Weather Rev. 2017, 145, 583–598. [Google Scholar] [CrossRef]
  58. Baek, S. A revised radiation package of G-packed McICA and two-stream approximation: Performance evaluation in a global weather forecasting model. J. Adv. Model. Earth Syst. 2017, 9, 1628–1640. [Google Scholar] [CrossRef]
  59. Shin, H.; Hong, S.Y. Representation of the subgrid-scale turbulent transport in convective boundary layers at gray-zone resolutions. Mon. Weather Rev. 2015, 143, 250–271. [Google Scholar] [CrossRef]
  60. Lim, K.S.S.; Hong, S.Y. Development of an effective double-moment cloud microphysics scheme with prognostic cloud condensation nuclei (CCN) for weather and climate models. Mon. Weather Rev. 2010, 138, 1587–1612. [Google Scholar] [CrossRef]
  61. Hong, S.Y.; Lim, K.S.S.; Lee, Y.H.; Ha, J.C.; Kim, H.W.; Ham, S.J.; Dudhia, J. Evaluation of the WRF double-moment 6-class microphysics scheme for precipitating convection. Adv. Meteorol. 2010, 2010, 707253. [Google Scholar] [CrossRef]
  62. Park, S.Y.; Lim, K.S.S. Implementation of Prognostic Cloud Ice Number Concentrations for the Weather Research and Forecasting (WRF) Double-Moment 6-Class (WDM6) Microphysics Scheme. J. Adv. Model. Earth Syst. 2023, 15, e2022MS003009. [Google Scholar] [CrossRef]
  63. Lin, Y.-L.; Farley, R.D.; Orville, H.D. Bulk parameterization of the snow field in a cloud model. J. Clim. Appl. Meteor. 1983, 22, 1065–1092. [Google Scholar] [CrossRef]
  64. Houze, R.A., Jr. Cloud and precipitation structure of mesoscale systems in GATE. In Impact of GATE on Large-Scale Numerical Modeling of the Atmosphere and Ocean; National Academy of Sciences: Woods Hole, MA, USA, 1979; pp. 100–108. [Google Scholar]
  65. Twomey, S. The nuclei of natural cloud formation part II: The supersaturation in natural clouds and the variation of cloud droplet concentration. Geofis. Pura Appl. 1959, 43, 243–249. [Google Scholar] [CrossRef]
  66. Khain, A.; Rosenfeld, D.; Pokrovsky, A. Aerosol impact on the dynamics and microphysics of deep convective clouds. Q. J. R. Meteorol. Soc. J. Atmos. Sci. Appl. Meteorol. Phys. Oceanogr. 2005, 131, 2639–2663. [Google Scholar] [CrossRef]
  67. Hong, S.Y.; Dudhia, J.; Chen, S.H. A revised approach to ice microphysical processes for the bulk parameterization of clouds and precipitation. Mon. Weather Rev. 2004, 132, 103–120. [Google Scholar] [CrossRef]
  68. Guo, C.W.; Xiao, H.; Yang, H.L.; Qi, T. Simulation of the microphysical processes and effect of latent heat on a heavy rainfall event in Beijing. Atmos. Oceanogr. 2014, 7, 521526. [Google Scholar] [CrossRef]
  69. Hjelmfelt, M.R.; Roberts, R.D.; Orville, H.D.; Chen, J.P.; Kopp, F.J. Observational and numerical study of a microburst line-producing storm. J. Atmos. Sci. 1989, 46, 2731–2744. [Google Scholar] [CrossRef]
  70. Dudhia, J.; Hong, S.Y.; Lim, K.S. A new method for representing mixed-phase particle fall speeds in bulk microphysics parameterizations. J. Meteor. Soc. Jpn. 2008, 86A, 33–44. [Google Scholar] [CrossRef]
  71. Madhulatha, A.; Rajeevan, M.; Mohan, T.S.; Thampi, S.B. Observational aspects of tropical mesoscale convective systems over southeast India. J. Earth Syst. Sci. 2020, 129, 65. [Google Scholar] [CrossRef]
  72. Rauniyar, S.P.; Protat, A.; Kanamori, H. Uncertainties in TRMM-Era multisatellite-based tropical rainfall estimates over the Maritime Continent. Earth Space Sci. 2017, 4, 275–302. [Google Scholar] [CrossRef]
  73. Madhulatha, A.; George, J.P.; Rajagopal, E.N. All-sky radiance simulation of Megha-Tropiques SAPHIR microwave sensor using multiple scattering radiative transfer model for data assimilation applications. J. Earth Syst. Sci. 2017, 126, 24. [Google Scholar] [CrossRef]
  74. Madhulatha, A.; Park, R.S.; Kang, J.Y.; Kim, T.H.; Hong, S.Y. Evaluation of cloud hydrometers from Korean Integrated Model (KIM) using multi reanalysis products and satellite observations. AGU Fall Meet. Abstr. 2019, 2019, 2856. [Google Scholar]
  75. Wu, D.; Dong, X.; Xi, B.; Feng, Z.; Kennedy, A.; Mullendore, G.; Gilmore, M.; Tao, W.K. Impacts of microphysical scheme on convective and stratiform characteristics in two high precipitation squall line events. J. Geophys. Res. Atmos. 2013, 118, 11119–11135. [Google Scholar] [CrossRef]
  76. Madhulatha, A.; Rajeevan, M.; Venkat Ratnam, M.; Bhate, J.; Naidu, C.V. Nowcasting severe convective activity over southeast India using ground-based microwave radiometer observations. J. Geophys. Res. Atmos. 2013, 118, 1–13. [Google Scholar] [CrossRef]
Figure 1. 48-h accumulated rainfall in mm (00 UTC 15 July 2017–00 UTC 17 July 2017) using (a) TRMM Multisatellite Precipitation Analysis (TMPA) observations, (b) time series of three hourly accumulated rainfall (mm) over the precipitation core (126–130° E, 36–38° N, solid red box in (a)) and precipitation band (116–132° E, 32–39° N, solid grey box in (a)). (c) Radar image of rainfall rate and (d) satellite image (KMA) at 20 UTC of 15 July 2017. Black open circle in (a) represents the Cheongju region.
Atmosphere 14 01680 g001
Figure 2. (a) Nested domain model configuration along with orography shaded (m), (b) Zoomed innermost domain.
Atmosphere 14 01680 g002
Figure 3. Spatial distribution of 48 h accumulated precipitation in mm (00 UTC 15 July 2017–00 UTC 17 July 2017) using (a) AWS, (b) Tropical Rainfall Measuring Mission (TRMM), (c) WRF model numerical simulation (WSM6), (d) WDM6, and (e) temporal distribution of rainfall between the TRMM and WRF model simulations over the precipitation core region.
Atmosphere 14 01680 g003
Figure 4. Time height distribution of the total hydrometeor distribution over the precipitation core region. (a) WDM6, (b) WSM6, and (c) difference between the schemes.
Atmosphere 14 01680 g004
Figure 5. The vertical distribution of different hydrometeors averaged over the developing and dissipating stages of the severe convective system (solid line (dotted solid line) corresponds to the WDM6 (WSM6) schemes).
Atmosphere 14 01680 g005
Figure 6. Time height distribution of the (a,b) rainwater mixing ratio, (c,d) rain number concentration, and (e,f) rain particle mass (×106) over the precipitation core region in the WSM6 (left panel) and WDM6 (right panel) schemes.
Atmosphere 14 01680 g006
Figure 7. Time height distribution of the (a,b) cloud water mixing ratio over the precipitation core region from the WSM6 (left panel) and WDM6 (right panel) schemes and the (c) cloud number concentration and (d) cloud particle mass from WDM6.
Atmosphere 14 01680 g007
Figure 8. Net latent heating rate computed based on microphysical transformation terms using both (a) WSM6 and (b) WDM6.
Atmosphere 14 01680 g008
Figure 9. Latent heating rate terms of major transformation process (a,g) Condensation, (b,h) Freezing, (c,i) Deposition, (d,j) Evaporation, (e,k) Melting, and (f,l) Sublimation using WSM6 (left panel), WDM6 (right panel) schemes.
Atmosphere 14 01680 g009
Figure 10. Mean latent heating profiles of the major transformation process during the developing (a,c) and dissipating stages (b,d) of MCS in WDM6 (top panel) and WSM6 (bottom panel).
Atmosphere 14 01680 g010
Figure 11. The 48-h accumulated rainfall in mm (00 UTC 15 July 2017–00 UTC 17 July 2017) (a) TRMM, (b) WDM6, (c) WDM6 (CCN1000), and (d) WSM6.
Atmosphere 14 01680 g011
Figure 12. Vertical Distribution of (a,f) Total hydrometeors, (b,g) net latent heating rate, LH due to (c,h) freezing, (d,i) rain evaporation, and (e,j) reflectivity in the WDM6 (left panel) and WDM6 with CCN_1000 (right panel).
Atmosphere 14 01680 g012
Figure 13. Contribution of different microphysical processes from different WRF simulations during the developing phase of the system (warming processes: (a,c,e) and cooling processes: (b,d,f)).
Atmosphere 14 01680 g013
Figure 14. Time height cross section of the simulated net latent heating rate (Kh−1) from the WRF simulations: (a) WSM6, (b) WDM6, (c) WDM_CCN1000, and ERA5 reanalysis. (d) Heat Source (Q1) and (e) moisture sink (Q2) terms.
Atmosphere 14 01680 g014
Table 1. Formulation of the size distribution of rain and cloud in single- and double-moment schemes.
Nr Size DistributionWSM6/WDM6NRλR exp[−(λRDR)]
NRλR2 exp[−(λRDR)]
Nc size DistributionWSM6/WDM6Constant value with Nc = 3 × 10⁸ m−3
nc(Dc) = 3Ncλc3D2cexp[−(λcDc)3]
Disclaimer/Publisher’s Note: The statements, opinions and data contained in all publications are solely those of the individual author(s) and contributor(s) and not of MDPI and/or the editor(s). MDPI and/or the editor(s) disclaim responsibility for any injury to people or property resulting from any ideas, methods, instructions or products referred to in the content.

