

Dynamics of the Magnetotail Plasma Sheet Current
The Johns Hopkins University Applied Physics Laboratory (JHU/APL), Laurel, MD 20723-6099, USA
Atmosphere 2023, 14(2), 222; https://doi.org/10.3390/atmos14020222
Submission received: 28 November 2022
/
Revised: 12 January 2023
/
Accepted: 17 January 2023
/
Published: 20 January 2023
(This article belongs to the Section Upper Atmosphere)
Abstract
:Magnetospheric plasma can be investigated as a continuum by adopting magnetic field B and plasma flow u as primary parameters in the Bu paradigm or as a collection of individual particles by adopting electric field E and electrical current j as primary parameters in the Ej paradigm. It is pointed out that each paradigm has its merits and limitations. This viewpoint is illustrated further by examining several topics in magnetospheric research. The magnetic flux transport in substorm dipolarization is examined with the Ej paradigm to show why the Bu paradigm may be inappropriate in some cases due to the violation of the frozen-in condition for the validity of the Bu paradigm. There is no guarantee that large-scale plasma dynamics can always be treated accurately by the Bu paradigm. The disturbance revealed in the current disruption (CD) phenomenon has unique characteristics that can be more readily understood with the Ej paradigm. In a case study, the power dissipation in CD is evaluated to about an order of magnitude higher than that in the electron diffusion region associated with magnetic reconnection (MR). Two prominent plasma instabilities, namely tearing instability (TI) and cross-field current instability (CCI), are discussed and their relevance to substorm onset is evaluated. The mating instability developed conceptually is also briefly discussed. The development of azimuthal auroral beads (ABs) on auroral arcs formed prior to substorm onset is analyzed to show that CCI can predict well their wavelength, growth rate, and period simultaneously. In contrast, the observed azimuthal structures in ABs are inconsistent with TI that produces only meridian structures in the ionosphere. Overall, the physical insights gained in the Ej paradigm are helpful in achieving a deep understanding of several magnetospheric phenomena.
1. Introduction
Plasma is the most abundant matter in the universe. The long-range force associated with its electric charge content has led to many behaviors quite distinct from other forms of matter. It is convenient to treat it as a continuous medium. The prevalence of this viewpoint has led to some researchers adopting its embedded magnetic field B and its bulk flow u as the primary parameters in the treatment of magnetospheric dynamics. This approach is called the Bu paradigm [1], which is based on the use of ideal magnetohydrodynamics (MHD) and is expected to be invalid when the frozen-in field is not satisfied. On the other hand, there are phenomena that are difficult, if not impossible, to reconcile with the Bu paradigm. A different paradigm adopting its embedded electric field E and its current density j as the governing parameters is called the Ej paradigm [2,3,4,5,6]. Both paradigms have their pros and cons.
The existence of dualism to treat plasma dynamics is not unique. For example, electromagnetic waves can be treated well by Maxwell’s equation in many circumstances. However, the photoelectric effect cannot be understood without adopting the photon as a primary quantum entity for such an effect. In the past, there have been some debates on which paradigm is superior to the other, initiated by the Bu paradigm researchers insisting that it is the only correct approach [7,8,9]. However, these arguments have been addressed by the Ej paradigm [10,11] with the conclusion that which paradigm is better is highly dependent on the magnetospheric phenomenon under investigation. Insisting on one paradigm being superior to the other to treat all magnetospheric problems would be inappropriate for scientific pursuits.
In this article, magnetotail phenomena and instabilities associated with the electric current nature of the magnetotail plasma sheet are discussed to highlight distinct advantages in understanding these activities from the Ej paradigm. As a background to this paradigm, a schematic diagram of the Earth’s magnetotail is illustrated in Figure 1 where the primary electric currents are labelled. They are the cross-tail current, the ring current, and the field-aligned current. The cross-tail current flows from the dawn side of the magnetotail to the dusk side. The ring current encircles the Earth. The field-aligned current links the magnetotail current to the ionosphere.
The topics covered here include (1) the magnetic flux transport in substorm dipolarization, (2) the basic properties of current disruption phenomenon and its high level of power dissipation, (3) two prominent plasma instabilities that are often considered for current sheet disturbances in the magnetotail, and (4) formation of azimuthal auroral beads (ABs) on pre-substorm-onset auroral arcs and predictions of their characteristics (wavelength, growth rate, and period). In topic (1), the effectiveness in magnetic flux transport using the Ej paradigm will be evaluated to show why the Bu paradigm is not appropriate to address magnetic flux transport in some cases. In topic (2), current disruption (CD) properties are illustrated to show its departure from the Bu paradigm. The power dissipation in CD is estimated and compared with that in the electron diffusion region for magnetic reconnection (MR). In topic (3), two prominent plasma instabilities, tearing instability (TI) and cross-field current instability (CCI), in the magnetotail are discussed to reveal their characteristics, and in topic (4) kinetic features in ABs formation in pre-substorm-onset activities are used to show the predictions from CCI in reproducing the basic features of these ABs that are not compatible with TI.
2. Materials and Methods
Materials used are based on measurements from spacecraft in the Earth’s magnetotail as well as ground-based stations that monitor space disturbances. The methods used are based on the well-known Newtonian mechanics equations and Maxwell’s equations. For example, the integral form of the Ampere’s law is used to infer the current density embedded in a layer bordered by two satellites separated only in the z-direction, with one above the layer and the other below the layer [12]. The embedded current density Ji (i = x, y) is given by
where is the permeability of free space, Bobs is the observed magnetic field, and the line integral is calculated on a rectangular loop. For i = y, the loop lies on the XZ plane with the short segments in the x-direction and the long segments in the z-direction to join the two satellites. Similarly for i = x, the loop lies on the YZ plane with the short segments in the y-direction and the long segments in the z-direction.
The magnitude of field-aligned current in the ionosphere J||,i is given by [13,14,15]
where Bi is the magnetic field in the ionosphere, m is the mass density, is the perpendicular current density in the magnetosphere, and is plasma flow vorticity. It is estimated in that, for the magnetotail plasma sheet, the second and third terms in Equation (2) are small in comparison with the first term.
The generalized Ohm’s law is used to examine the transport of magnetic flux:
where U and Ue are the plasma and electron bulk flows, respectively, is the permittivity of free space, is the electron plasma frequency, n is the number density, is the electron dynamic pressure tensor, is the ensemble average of the product of E and n fluctuations, and is the ensemble average of the cross product of and B fluctuations. If E = −U B, magnetic flux is frozen-in with the fluid motion. This is called the frozen-in condition (FIC), and magnetic flux can then be visualized as being transported by the plasma flow U.
A method used in wave analysis is to examine the temporal development of the wave from the wave dispersion relation. The momentum equation is used to evaluate the temporal behavior of electric and magnetic fields of the wave with their dependence on time as , where is a complex quantity. If the imaginary part is positive, the wave will grow exponentially, and an instability will develop.
3. Results and Discussion
3.1. Magnetic Flux Transport
A magnetospheric substorm is a major space disturbance that poses several unanswered questions [16,17]. An important feature is the reconfiguration of the magnetic field in the magnetosphere at substorm onset. Prior to its onset, the magnetic field in the near-Earth magnetosphere is stretched considerably along its tail axis. At the onset, the near-Earth magnetic field is relaxed to become stronger and dipole-like. This reconfiguration, often referred to as dipolarization, requires prominent changes in the magnetic field content in the near-Earth region. In the Bu paradigm, such a change can only be made by transporting magnetic flux from one region to another. The procedure relies on verifying the FIC to be valid so that the plasma flow can be used to accomplish the transport. Such an essential assumption in addressing dipolarization during a substorm can be evaluated in the Ej paradigm by explicitly calculating the agreement between the two quantities E and −U B for all three components. If the equality is not valid for any one component, the FIC is invalid and magnetic flux cannot be considered as being transported by the plasma flow.
Magnetic structures from Earthward reconnection flows have been observed to show transient large northward swings in the magnetic field called dipolarization fronts (DFs), and [18,19,20,21,22,23,24,25,26]. Refs. [27,28] referred to the magnetic flux transport with DFs as dipolarizing flux bundles (DFBs). Ref. [29] reported a multi-case study of 18 cases of DFBs, and an evaluation of the FIC of these events with the generalized Ohm’s law has been made [30].
Figure 2 shows a DFB on 27 February 2009. The 3 s spin-averaged Bz component in GSM coordinates for the four spacecrafts P1, P2, P3, and P4 is shown in the first column. The error bars are calculated based on the standard deviation of the mean (SDM) of the spin-averaged values from measurements at a higher resolution of 0.25 s. The Ux component in GSM coordinates based on the combined measurements from ESA and SST is shown in the second column. The comparison between the measured 3 s spin-averaged Ey component in the dsl coordinates (dsl is the despun satellite coordinates and is close to GSE coordinates) and the value of the −(U B)y component using U and B in the dsl coordinates is shown in the third column. The use of the dsl coordinates is better than GSE or GSM coordinates because the electric field is measured at this coordinate system and is therefore a more accurate way to compare the two quantities for the validity of FIC. Only the y-component is examined here because it is usually the largest component of these quantities. The error bars on Ey are derived from the SDM of the spin-averaged values based on measurements at a higher resolution of 0.125 s. The error bars on the −(U B)y component are based on the SDM of the magnetic field since no uncertainties are provided for U at the fast time resolution.
The DFB interval is highlighted in the figure. Prior to the arrival of DFB, the Bz component was quite small. A magnetic dip for ~1–2 min appeared at the front of the DFB ahead of sharp enhancement of the Bz component. Two of the dips had negative values. Earthward flows increased significantly in DFB. The comparison between the two frozen-in parameters shows generally good agreement; therefore, magnetic flux can be considered to be transported by plasma flow in this event.
Another example of DFB on 5 March 2009 is shown in Figure 3, which exhibits significant differences between the two quantities in FIC evaluation. In this event, there were substantial differences in the Bz component (from ~3 to ~10 nT), including its peak values (from ~12 to ~30 nT), within the DFB intervals among the four satellites. The magnetic dips ahead of the DFB were relatively small and did not become negative. Earthward flows were seen within the DFB for all satellites. Some significant tailward flows also occurred right after the DFB in P5 and P4.
The difference between the two FIC parameters can be quantified by comparing the magnitude of Ey and −(U B)y. This comparison (=|Ey/(U B)y|) is called the comparison ratio (CR). In calculating CR, it is limited to intervals when the electric field exceeds 0.5 mV/m to eliminate times of low-level electric fluctuations. Two criteria can be set up. For a lenient criterion, the FIC is invalid when CR is more than two because the two FIC parameters differ by more than a factor of two. A stricter criterion can be used to describe the situation when the magnitude of Ey differs from the magnitude of (U B)y by 50%. In this event, CR is 0.7–10.6, 1.6–3.0, 0.9–2.6, and 0.7–2.5 for P2, P3, P5, and P4, respectively, demonstrating that the magnetic flux cannot be considered as being carried by the plasma flow with either criterion. An examination of all 18 cases reported by [29] shows that 9 of them did not satisfy the FIC under the lenient criterion. For the stricter criterion, as much as 94% of DFB do not satisfy the FIC. Therefore, the Bu paradigm is highly inaccurate for magnetic flux transport consideration.
It is estimated that the amount of transported magnetic flux needed in the near-Earth region for a substorm is ~0.5–1 GWb [31]. An individual DFB can transport an accumulated magnetic flux of ~0.1–2.2% of the requirement, indicating that it would require a minimum of ~50 DFBs for the amount needed in a substorm interval [30]. A similar conclusion is reached by [32]. Substorm dipolarization from magnetic flux transport belongs to large-scale plasma dynamics in the magnetosphere. Therefore, contrary to the expectation expressed in [9], there is no guarantee that large-scale plasma dynamics can always be treated accurately by the Bu paradigm.
3.2. Current Disruption
A rather unexpected behavior of the near-Earth magnetic field was discovered by [33] with the spacecraft Charge Composition Explorer (CCE). The satellite was at ~9 RE in the midnight sector of the magnetotail. The onset of the high-level magnetic field fluctuations, which is a marked signature of CD and shown in Figure 4, was preceded by ~1 min onset by Pi2 pulsation at Kakioka station. The occurrence of Pi2 pulsation is a typical indicator of a substorm onset.
A more complete description of CD is as follows. The CD phenomenon has been identified by large magnetic fluctuations predominantly around the central plasma sheet where Bz >> Bx, By. The Bz fluctuations can reach a level such that δBz/Bzo (Bzo is the Bz value before CD onset) is of the order one or larger. It typically lasts for several minutes, and Bz may become negative to overcome even a strong initial background magnetic field component. CD is accompanied by particle energization from the associated intense electric field. The local current becomes filamentary and may reverse its direction. A distinct feature of CD, unlike MR, is that the associated plasma flow pattern is not governed by the Bz polarity. The FIC is often not satisfied. Furthermore, the Bz component is significantly enhanced after CD with the relaxation of a stretched magnetic field to a more dipolar appearance. Several features of CD are illustrated in Figure 5.
The CD activities are unrelated to MR. It has been shown in a detailed case study that the CD activity site approached the satellite from the Earthward side, as revealed by the remote sensing capability from the ion sounding technique [34]. If it were related to MR, the Bz component would be negative tailward of the MR site. However, observation indicated that the Bz component was strongly positive, contrary to the anticipated behavior of the Bz component pattern tailward of an MR site.
The basic structures in CD have never been produced by global simulations using the fluid equations in the Bu paradigm. However, particle-in-cell (PIC) simulations in the Ej paradigm have been reported to produce these structures [35,36]. The physical process for the disturbance is attributed to cross-field current instability by [35] and to ballooning/interchange instability by [36].
How current density changes during CD is demonstrated well by observations on 28 February 2009 when two of the THEMIS satellites were almost at an identical location on the XY plane but were separated by ~0.6 RE in the z-location. This fortuitous situation occurred at the start of a magnetospheric substorm as indicated by the auroral indices at the top panel of Figure 6. The magnetic field components at P4 and P5 were given by the second and third panels, respectively. The current densities Jx,y embedded within P4 and P5 are calculated based on the formula Equation (1) in Section 2.
The second last panel of Figure 6 shows the dissipation parameters in both x- and y-directions using different colors. The last panel shows the average electric field of the two satellites, also in both x- and y-directions using different colors. Note that since the power dissipation is mainly caused by the electric field, the role of CCI in power dissipation during a substorm is the rapid magnetic field changes as a result of current changes caused by the CCI.
There was a slight increase in Jy from 100 to 107 kA/RE and a slight decrease in Jx from 31 to 25 kA/RE just before CD onset. At CD onset, a sharp drop in Jy (from 107 to 63 kA/RE) occurred, accompanied by a substantial increase in Jx (from 25 to 42 kA/RE). These changes suggest a part of Jy was directed Earthward initially. There were large fluctuations in both Jx and Jy with occasional magnitudes larger than their initial magnitudes, which is interpreted as turbulence occurring in CD with current filamentation and transient local changes. The value of Jx even became negative at several short intervals. At the end of the interval, Jy and Jx settled down to 63 and 11 kA/RE, respectively; these changes represent a reduction of 41% and 56% in Jy and Jx, respectively.
One may make an estimate to the overall power dissipation in CD. The average value of dissipation during the time interval from 2:24:20 to 2:26:50 is 4.38 GW/RE2. Choosing the z-dimension of CD to be the z-separation of P4 and P5 (~0.6 RE), the x-dimension of CD is the ion gyroradius instead of the convective length of the structure. For the CD interval (02:24:18 to 02:26:17 UT), the ion gyroradius is ~391 km ~0.061 RE with the average Bz of 20.4 nT and average ion temperature of 6.1 keV. The total power dissipation is ~31 W/m in the y-direction. This dissipation can be compared with that of the electron diffusion region detected by MMS-3 [37], which is 0.2–0.3 nW/m3. Its x- and z-dimensions in units of electron Debye length de are 12–17 de (350–500 km) and 1–2 de (30–60 km), respectively. The xz-area is 1.1–3.0 m2, leading to a total dissipation of 2.1 W/m in the y-direction, which is about one order of magnitude smaller than that in CD. This result is primarily due to the small dimensions of the electron diffusion region, but MR can be assumed to exist for a long time since it is not clear when MR may be terminated. On the other hand, CD only lasts for a few minutes and by itself cannot be compared with the substorm duration. However, multiple CDs such as in an avalanche system are envisioned to occur during a substorm interval [10,38,39]. Therefore, these two processes may yield comparable total dissipation during a substorm.
3.3. Plasma Instabilities
There are several plasma instabilities proposed for the onset of substorms that are related to the magnetotail plasma sheet. They are tearing instability, cross-field current instability, lower-hybrid drift instability, drift kink/sausage instability, current-driven Alfvénic instability, Kelvin–Helmholtz instability, and entropy anti-diffusion instability. A review of these instabilities has been documented in [35]. Here, only two prominent instabilities that had been updated since then are discussed below.
For simplicity, multiscale current sheets are not considered here. There are several nonlinear dynamics processes involved in a multiscale current sheet that can give rise to a significant destruction of its equilibrium, although they are not classified as plasma instabilities, e.g., “aging” of magnetotail thin current sheet [40] and offset of marginal stability by electron pressure anisotropy [41]. There are also other current sheet equilibria that may lead to its drastic changes, such as a super-thin current sheet [42] and equilibrium offset from a mixture of regular and chaotic charged particle motions [43]. Some of these processes are recently discussed in some details in [44].
3.3.1. Tearing Instability
This instability was first proposed by [45]. With the adoption of a Harris current sheet, the growth rate γ is found to be
where ue is the electron thermal speed, ρe is the electron gyroradius, Ti and Te are the ion and electron temperatures, L is the half-thickness of the Harris current sheet, and kx is the wavenumber of the tearing mode in the x-direction. Even for an extremely long wavelength mode with >> 1, the growth rate is extremely slow with an e-folding time of ~1 h, unsuitable to account for the short substorm onset time scale. Ref. [46] introduced an ion tearing mode with a growth rate γion to be
assuming a long wavelength mode of << 1 and >> 1. It is shown that even a small component of the magnetic field normal to the current sheet can stabilize this tearing instability by electron compressibility [47,48]. However, ref. [49] have presented arguments that for a multiscale magnetotail the instability electric field may penetrate to the electron magnetized region and destabilize the current sheet. This possibility remains to be evaluated.
3.3.2. Cross-Field Current Instability
The instability CCI consists of the modified two-stream instability and the ion Weibel instability. A simplified picture of these two modes was illustrated in [50]. Both of these instabilities lie on the same dispersion surface and are driven by a relative motion between ions and electrons perpendicular to the local magnetic field. Oblique whistler waves are excited. In the modified two-stream mode, excited waves propagate nearly perpendicular to the magnetic field while the waves in the ion Weibel mode propagate close to the magnetic field. For a configuration where the magnetic field z, and wave propagation is in the YZ plane at an angle θ from the z-axis, i.e., k = kxx+ kyy = k cos θ, together with cold plasma and electrostatic limit assumptions, the dispersion relation equation is found to be
where ω, ωpe, ωpi, and Ωe are wave frequency, electron plasma frequency, ion plasma frequency, and electron gyrofrequency, respectively, and Vo is the ion drift relative to the electrons. For a small angle θ ≈ me/mi, with ξi = (ω − kyVo)/kvi, ξe = ω/kve (vi and ve are the ion and electron thermal speeds), the real frequency ωr and growth rate γ of the excited wave are
For a hot plasma with electron gyrorotation, the growth rate expression becomes rather complicated to a lengthy expression dependent on several parameters. The full expression of plasma dispersion relation equation is documented in [35].
3.4. Auroral Beads
Phenomena occurring near the substorm onset provide important clues for identifying the physical process for substorm onset. In particular, just before the auroral breakup at substorm onset, azimuthal structures develop along the breakup auroral arc during some tens of seconds beforehand. Such spatial structures, discovered from global auroral images by Viking UVI, were first reported by [51] and named as auroral beads (ABs). The ABs’ brightness increases exponentially with the approach to the substorm onset time [52]. At present, more details on ABs are available and provide very stringent observational constraints for the physical process. Three mechanisms for ABs occurrence are proposed, namely plasma flow braking [15,53], near-Earth plasma instabilities such as cross-field current instability [54], and ballooning/interchange instability [55]. Another instability developed conceptually without rigorous theoretical treatment to show an appropriate dispersion relation equation is called the mating instability [56]. It starts with the assumption that the ABs are independent from the substorm onset process. This assumption is primarily based on the observation that auroral breakup can occur with substantial delay from the appearance of ABs. However, a counter argument to this reasoning is that the auroral breakup occurs at the nonlinear stage of the instability, which is delayed by about three growth times of the instability. Since the instability growth rate depends on the in situ environment where the instability is excited, the delay can be quite variable, as shown in observations. The delay can be long if the growth rate is slow.
The combined properties of spatially periodic structures and their exponential growth of brightness naturally lead to the consideration of plasma instabilities (e.g., [4,51,57,58,59,60,61,62,63,64,65,66,67,68,69,70,71,72,73,74,75,76,77,78]). It is worth noting that TI is not suitable to account for azimuthal structures of ABs because it produces spatial structures mainly along the north–south direction rather than the azimuthal direction in the ionosphere.
There is a wide range for different wavelengths corresponding to different growth rates so that there is no “universal” wavelength, period, or growth rate for all ABs. The work in [74] (denoted hereafter as N16) provides a severe challenge in ABs studies in that there are three properties of ABs linked simultaneously, namely wavelength, growth rate, and period. A correct theory needs to show that these properties do match their values from observations.
Prior to the N16 publication, it was known that ABs’ brightness has a distinct growth rate besides their wavelength. Ref. [53] expanded the plasma flow braking idea by postulating that ABs are caused by plasma flow braking at the stop layers where auroral streamers enter the dipolar region. This plasma flow braking model can account for the wavelength of the ABs well but has not yet predicted any exponential growth of their brightness.
The proposal of ballooning/interchange instability as the cause of ABs is based on PIC simulation [55]. This proposal would be strengthened if simultaneous wavelength, period, and growth rate inferred theoretically could be demonstrated to match with these parameters in ABs observations. However, since no theorical work is performed to derive the dispersion relation equation in [55], this task becomes unrealizable. On the other hand, the dispersion relation equation for CCI has been formulated, and so it can be used to relate these three parameters for ABs in individual cases. This work is described below.
The starting point to solve the dispersion relation equation for CCI is to define the plasma parameters in the magnetospheric site linking the ABs. Since these plasma parameters are unknown, it is necessary to explore what they are together with the downstream distance for the excited site. This is performed through trial and error in solving the CCI dispersion relation equation [54]. The ranges of parameters used are 0.1–3 cm−3 for number density N, 5–40 nT for magnetic field B, 0.1–10 keV for ion temperature Ti, 0.05–5 keV for electron temperature Te, and 0.01–1 ue for the relative drift Vd between ion and electron populations, where ue is the electron thermal speed. The amplification factor A linking the ionospheric scale to the magnetospheric scale ranges from ~11 to ~33 by A = 14 + (33 − 14) (r/6 − 1), where r is the downstream distance. The solution obtained from this procedure, however, does not guarantee a unique set of plasma parameters.
Figure 7 shows the parameters used to reproduce the characteristics of westward propagating ABs (WABs) with the parameter set N = 1 cm−3, B = 10 nT, Ti = 9 keV, Ti/Te = 7, and Vd = 0.036 Vd ~ 2.6 VA, where VA is the local Alfvén speed. The median values given in N16 are 98.7 ± 28.7 km for ionospheric wavelength, 0.04 ± 0.03/s for growth rate, and 18 ± 6 s for period. The shaded region in Figure 7a denotes the upper and lower limits (based on median ± quarters) of the ionospheric wavenumber in N16 (0.045–0.083 /km). Three solutions with the CD site at downstream distances of 10, 11, and 12 RE are shown. All solutions have peaks within the observed range with only a slight difference between them. The observed median value of 0.064/km matches extremely well with the peak of the red curve for 11 RE. The shaded region in Figure 7b denotes the upper and lower limits (again based on median ± quarters) of the period in N16 (12–24). The three solutions shown reproduce the associated periods quite well with the red curve for 11 RE fitting the best within the observed ranges of period and wavenumber. The combined results indicate that CCI reproduces simultaneously the growth rate, the wavenumber, and period well within the observed limits for WABs with excitation near 11 RE.
Simplified pictures of dynamo/load sites and field-aligned currents (FACs) generation from CD can be visualized in the following. The CCI disturbance generates a condition showing opposite signs of J⊥ and on the west and east sides of the CD. From Equation (2), opposite signs of FACs are produced. This is shown in more detail in Figure 8. The meridian view (a) shows that CD causes dipolarization and magnetic field lines to collapse Earthward. The electrons tend to tie to the magnetic field lines due to their gyromotion and move Earthward while the ions lag behind. Even with a partial slippage of magnetic field line from the electrons, the differential motions of ions and electrons will create a net positive charge at the tailward end of the CD site and a net negative charge at the Earthward end, leading to an Earthward-directed electric field and J•E < 0, i.e., a dynamo created by the CD site. Electrons at the Earthward side move down along the magnetic field line to reduce the net negative charge and generate an upward FAC. Similarly, electrons from the ionosphere move upward along the magnetic field line to reduce the net positive charge at the tailward end of the CD site. This in turn produces a downward FAC as shown. These FACs close in the ionosphere to produce an equatorward current. The magnetospheric electric field is transmitted to the ionosphere by the magnetic field lines and produces an equatorward electric field, leading to J•E > 0, i.e., a load powered by the dynamo in the CD site.
Figure 8b shows an equatorial cut of the CD site. Dipolarization creates an Earthward-directed magnetic field gradient at the Earthward side of the CD site (J⊥•B < 0) and a slightly rarefied magnetic field region at the tailward side, giving a tailward-directed magnetic field gradient (J⊥•B > 0). The current J⊥ here refers to the radial component of the current in the plasma sheet. For the dawn–dusk direction, the current J⊥ here denotes the cross-tail component of the current in the plasma sheet. The product J⊥• > 0 occurs on the dawn side of CD, generating a downward FAC based on Equation (2). On the dusk side of CD, J⊥• < 0 to produce an upward FAC.
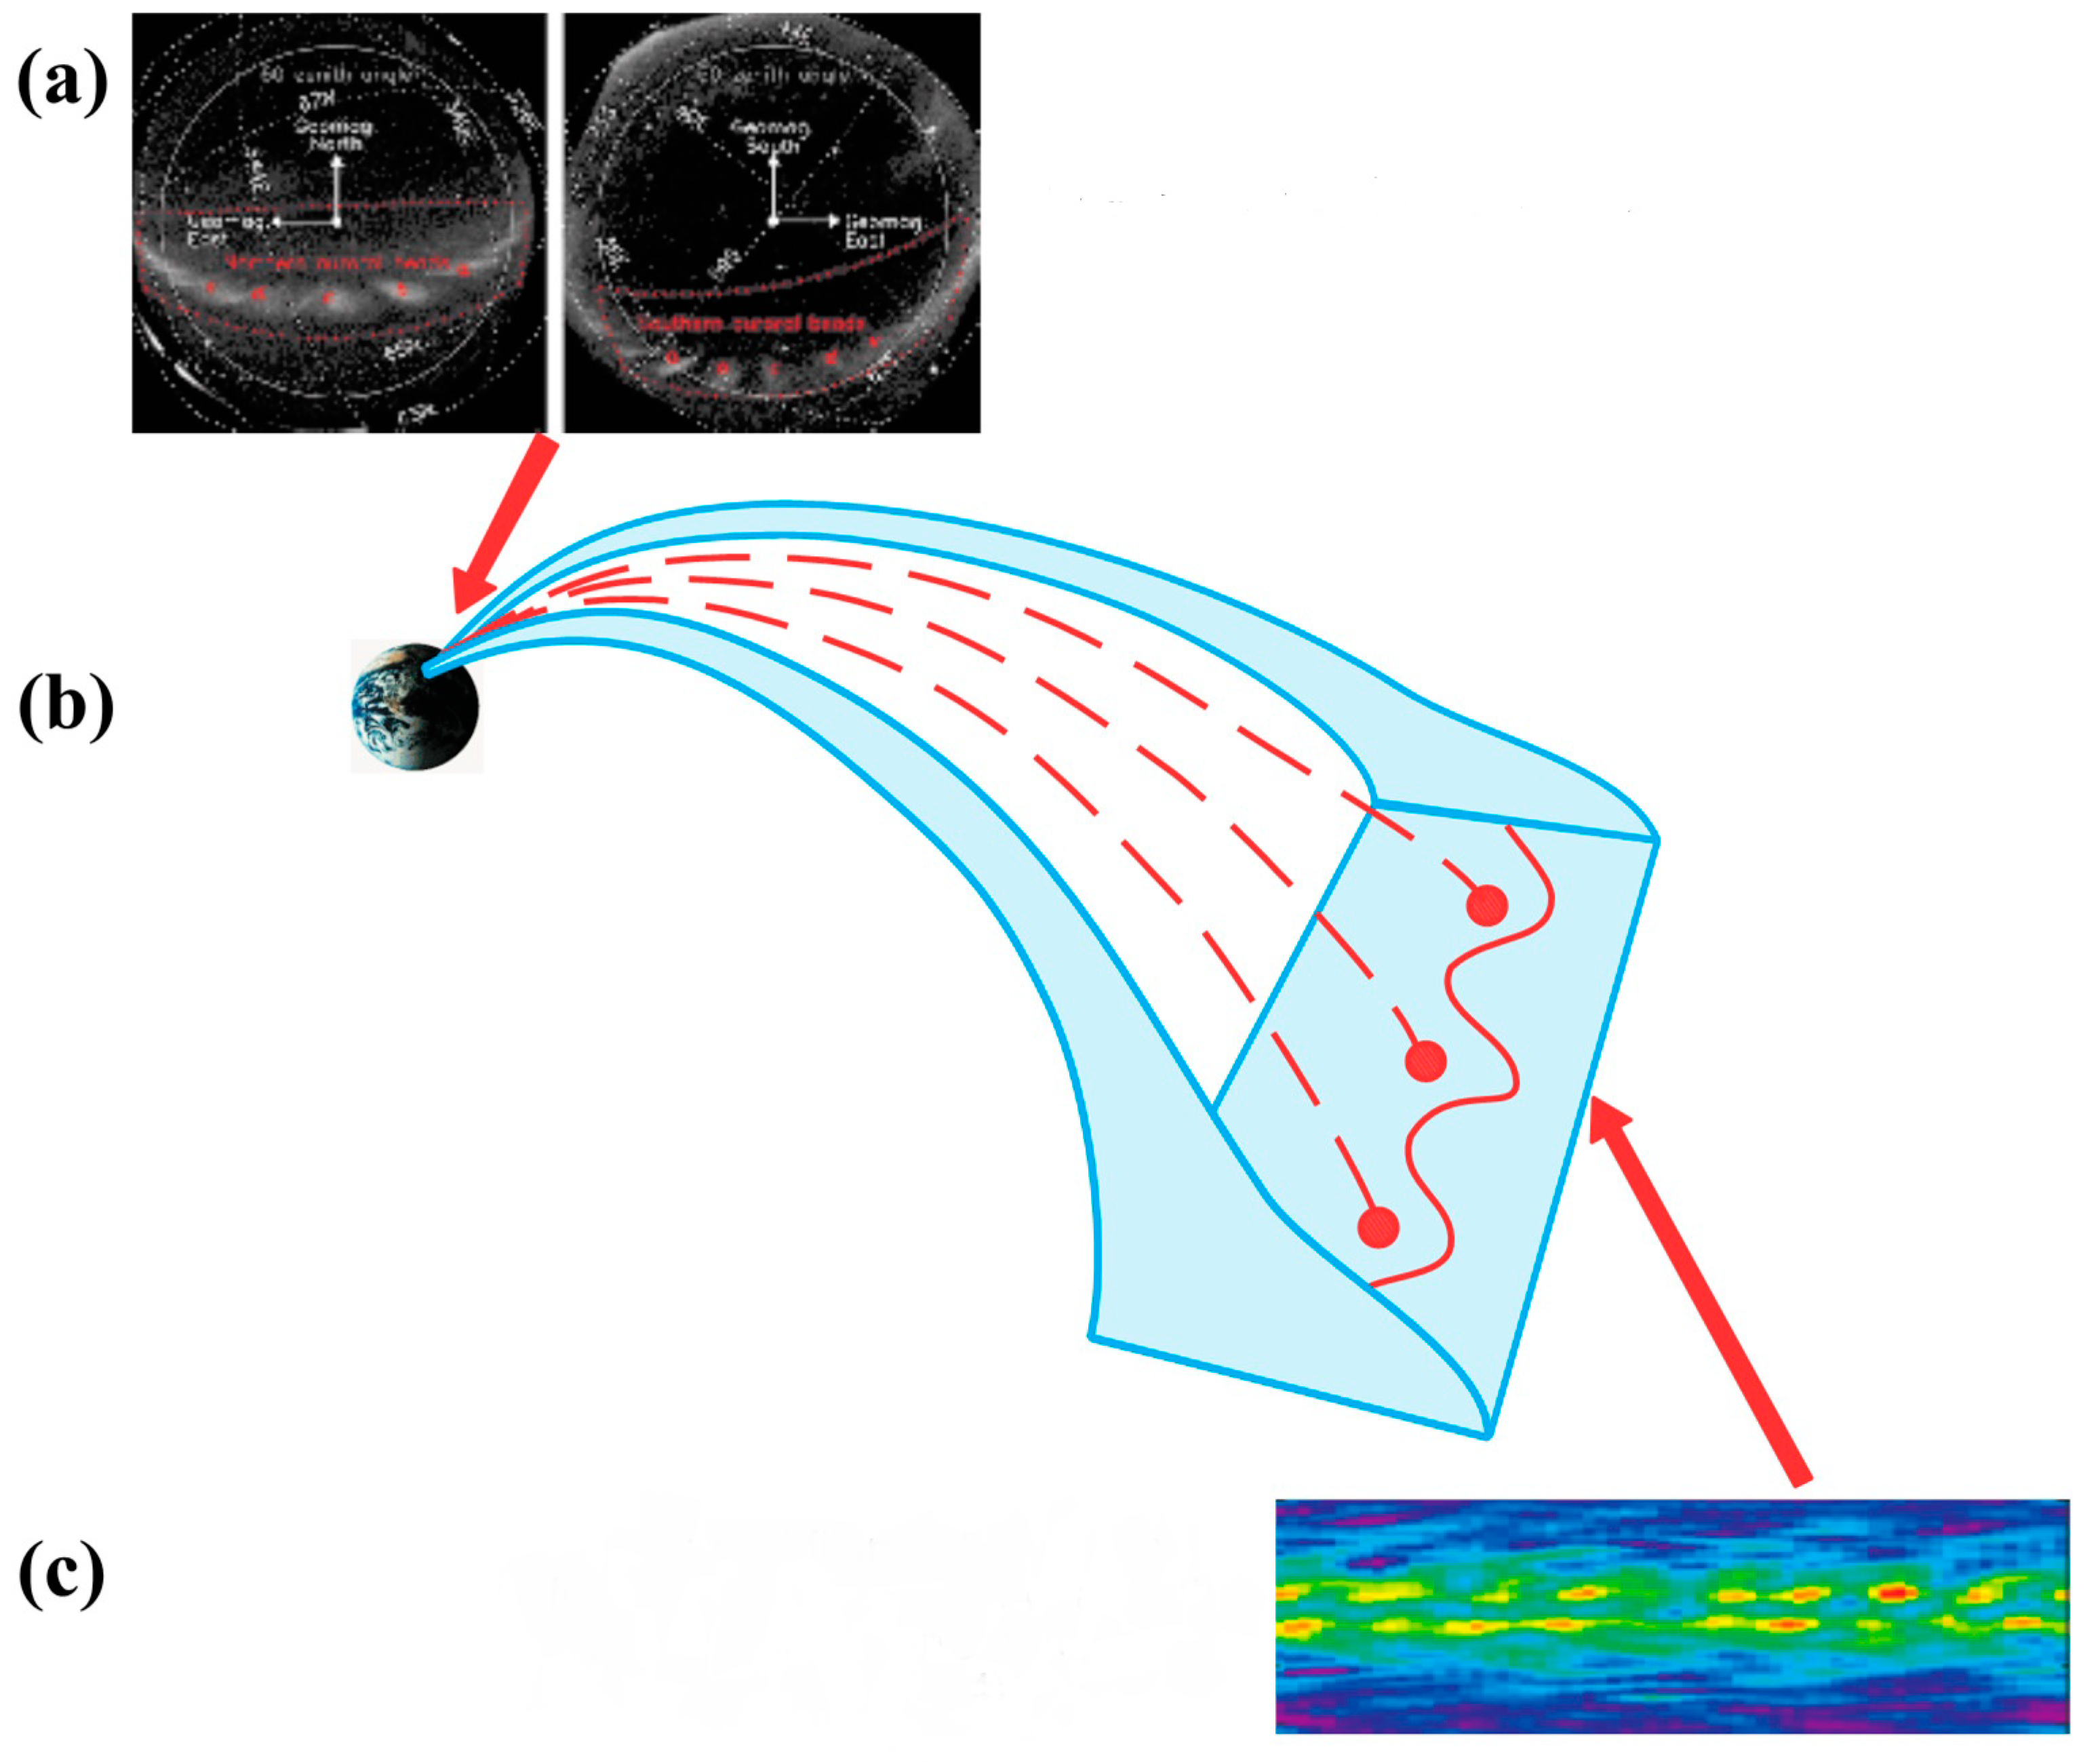
The link between ABs formation and CD is described in more details in Figure 9. The appearance of the conjugacy of ABs in Figure 9a provides compelling evidence for the mechanism to be at the equatorial plane [76]. Since the ABs are not located at the poleward edge of the auroral oval where the magnetic field lines are mapped to an MR site in the magnetotail, this valuable clue indicates that the onset process resides well within the plasma sheet. In other words, the auroral substorm onset site is not directly mapped to an MR site where the open magnetic field lines become closed ones. The ABs site in the magnetosphere likely maps along magnetic field lines to the magnetic transition region where the magnetic field configuration changes from dipolar to tail-like ([78] at ~5–15 RE downtail). Figure 9b shows the link between each ripple produced by CD in the magnetotail and the ABs in the ionosphere. Figure 9c further indicates that these CD ripples can be the result of current filamentation and field-aligned electron acceleration by CCI using PIC simulation as described in [35].
4. Conclusions
Dualism exists in magnetospheric research similar to the dualism in the treatment of electromagnetic waves with either Maxwell’s equation in a continuum medium or quantized as individual photons. For space plasma, it can be treated as a continuum or as a collection of individual particles. Due to this dualism, one can use magnetic field B and plasma flow u in a continuum medium as primary parameters in the Bu paradigm or by adopting electric field E and electrical current j in a collection of individual particles as primary parameters in the Ej paradigm. Each paradigm has its merits and limitations. Which paradigm is better is highly dependent on the magnetospheric phenomenon under investigation. No one paradigm is perfect. There is no guarantee that large-scale plasma dynamics can always be treated accurately by the Bu paradigm. Insisting on only one paradigm being superior to the other for treating all magnetospheric problems would be inappropriate and stifle innovative thinking in scientific pursuits.
Since there is a prevalent adoption of the Bu paradigm, this article aims to demonstrate that there are merits in treating magnetospheric phenomena with the Ej paradigm. With this goal, several aspects of magnetospheric dynamics are discussed with emphasis on the Ej paradigm. The advantages of this viewpoint are illustrated in the topic of magnetic flux transport during substorm dipolarization. It is shown why the Bu paradigm can be inappropriate in treating some cases of magnetic flux transport due to the violation of the frozen-in condition, a necessary condition for the application of the Bu paradigm. The disturbance generated by current disruption is found to lie outside the realm of the Bu paradigm description due to its fast temporal variation and short spatial structures. In reviewing the research based on the Ej paradigm cohesively, several significant features emerge that have not been recognized previously. In particular, in one detailed case study, the associated power dissipation in current disruption is found to be about one order of magnitude higher than that in the electron diffusion region for magnetic reconnection. The roles of tearing instability and cross-field current instability in understanding magnetotail phenomena are also examined. It is concluded that the former instability is not compatible with auroral beads formed in pre-substorm-onset auroral arcs. On the other hand, the latter instability can predict the wavelength, growth rate, and period simultaneously with a suitable choice of magnetotail parameters. The recently proposed mating instability does not provide a means to predict these parameters for comparison with observations, which is also new from the cohesive evaluation of the Ej paradigm. Overall, adopting electric field and electric current as the primary quantities in dynamic evolution provides a viable and insightful way to view magnetospheric phenomena besides using magnetic field and plasma flow as the primary dynamic drivers.
Funding
This research received no external funding.
Institutional Review Board Statement
The Institutional Review was made by the Group Supervisor without an approval number.
Informed Consent Statement
Not applicable.
Data Availability Statement
Support data are available in public data facilities: NASA CDAweb.
Conflicts of Interest
The author declares no conflict of interest.
References
- Lui, A.T.Y. Electric Current Approach to Magnetospheric Dynamics and the Distinction between Current Disruption And Magnetic Reconnection, Magnetospheric Current Systems; Ohtani, S., Fujii, R., Hesse, M., Lysak, R.L., Eds.; AGU Monograph; AGU: Washington, DC, USA, 2000; Volume 118, pp. 31–40. [Google Scholar]
- Alfvén, H. Electrical currents in cosmic plasmas. Rev. Geophys. 1977, 15, 271. [Google Scholar] [CrossRef] [Green Version]
- Yoon, P.H.; Lui, A.T.Y. Nonlinear analysis of generalized cross-field current instability. Phys. Fluids B 1993, 5, 836–853. [Google Scholar] [CrossRef]
- Yoon, P.H.; Lui, A.T.Y.; Chang, C. Lower-hybrid-drift instability operative in the geomagnetic tail. Phys. Plasmas 1994, 1, 3033–3043. [Google Scholar] [CrossRef]
- Lui, A.T.Y. Current disruption in the Earth’s magnetosphere: Observations and models. J. Geophys. Res. 1996, 101, 13067–13088. [Google Scholar] [CrossRef]
- Akasofu, S.-I. Electric current approach studying both auroral substorms and solar flares together. Front. Astron. Space Sci. 2020, 7, 4. [Google Scholar] [CrossRef]
- Vasyliunas, V.M. Time scale for magnetic field changes after sub-storm onset: Constraints from dimensional analysis. In Physics of Space Plasmas; Chang, T., Jasperse, J.R., Eds.; MIT Center for Geo/Cosmo Plasma Physics: Cambridge, MA, USA, 1996; pp. 553–560. [Google Scholar]
- Vasyliunas, V.M. Time evolution of electric fields and currentsand the generalized Ohm’s law. Ann. Geophys. 2005, 23, 1347–1354. [Google Scholar] [CrossRef] [Green Version]
- Parker, E.N. Tutorial: Newton, Maxwell, and Magnetospheric Physics, Magnetospheric Current Systems; Ohtani, S., Fujii, R., Hesse, M., Lysak, R.L., Eds.; AGU Monograph 2000; AGU: Washington, DC, USA, 2000; Volume 118, pp. 1–10. [Google Scholar]
- Lui, A.T.Y.; Chapman, S.C.; Liou, K.; Newell, P.T.; Meng, C.-I.; Brittnacher, M.; Parks, G.K. Is the dynamic magnetosphere an avalanching system? Geophys. Res. Lett. 2000, 27, 911–914. [Google Scholar] [CrossRef] [Green Version]
- Lui, A.T.Y. Time development of electric fields and currents in space plasmas. Ann. Geophys. 2006, 24, 1137–1143. [Google Scholar] [CrossRef]
- Lui, A.T.Y. Reduction of the cross-tail current during near-Earth dipolarization with multi-satellite observations. J. Geophys. Res. 2011, 116, A12239. [Google Scholar] [CrossRef]
- Sato, T.; Iijima, T. Primary sources of large-scale Birkeland currents. Space Sci. Rev. 1979, 24, 347. [Google Scholar] [CrossRef]
- Hasegawa, A.; Sato, T. Generation of Field Aligned Current during Substorm, Dynamics of the Magnetosphere; Springer: Dordrecht, The Netherlands, 1979. [Google Scholar]
- Haerendel, G. Field-aligned currents in the Earth’s magnetosphere. Geophys. Monogr. Ser. 1990, 58, 539. [Google Scholar]
- Akasofu, S.I. Polar and Magnetosphere Substorms; Astrophysics & Space Science Library: Dordrecht, The Netherlands, 1968; Volume 11, ISBN 90-277-0108-3. [Google Scholar]
- Rostoker, G.; Akasofu, S.-I.; Foster, J.; Greenwald, R.; Kamide, Y.; Kawasaki, K.; Lui, A.; McPherron, R.; Russell, C. Magnetospheric substorms-definition and signatures. J. Geophys. Res. 1980, 85, 1663–1668. [Google Scholar] [CrossRef]
- Nakamura, R.; Baumjohann, W.; Klecker, B.; Bogdanova, Y.; Balogh, A.; Rème, H.; Bosqued, J.M.; Dandouras, I.; Sauvaud, J.A.; Glassmeier, K.-H.; et al. Motion of the dipolarization front during a flow burst event observed by Cluster. Geophys. Res. Lett. 2002, 29, 1942. [Google Scholar] [CrossRef] [Green Version]
- Runov, A.; Angelopoulos, V.; Sitnov, M.I.; Sergeev, V.A.; Bonnell, J.; McFadden, J.P.; Larson, D.; Glassmeier, K.-H.; Auster, U. THEMIS observations of an earthward-propagating dipolarization front. Geophys. Res. Lett. 2009, 36, L14106. [Google Scholar] [CrossRef] [Green Version]
- Sergeev, V.; Angelopoulos, V.; Apatenkov, S.; Bonnell, J.; Ergun, R.; Nakamura, R.; McFadden, J.; Larson, D.; Runov, A. Kinetic structure of the sharp injection/dipolarization front in the flow-braking region. Geophys. Res. Lett. 2009, 36, L21105. [Google Scholar] [CrossRef]
- Zhou, X.-Z.; Angelopoulos, V.; Sergeev, V.; Runov, A. Accelerated ions ahead of earthward propagating dipolarization fronts. J. Geophys. Res. 2010, 115, A00103. [Google Scholar] [CrossRef] [Green Version]
- Zhang, X.-J.; Angelopoulos, V.; Runov, A.; Zhou, X.-Z.; Bonnell, J.; McFadden, J.P.; Larson, D.; Auster, U. Current carriers near dipolarization fronts in the magnetotail: A THEMIS event study. J. Geophys. Res. 2011, 116, A00I20. [Google Scholar] [CrossRef] [Green Version]
- Fu, H.S.; Khotyaintsev, Y.V.; André, M.; Vaivads, A. Fermi and betatron acceleration of suprathermal electrons behind dipolarization fronts. Geophys. Res. Lett. 2011, 38, L16104. [Google Scholar] [CrossRef]
- Lyons, L.R.; Nishimura, Y.; Xing, X.; Runov, A.; Angelopoulos, V.; Donovan, E.; Kikuchi, T. Coupling of dipolarization front flow bursts to substorm expansion phase phenomena within the magnetosphere and ionosphere. J. Geophys. Res. 2012, 117, A02212. [Google Scholar] [CrossRef] [Green Version]
- Huang, S.Y.; Zhou, M.; Deng, X.H.; Yuan, Z.G.; Pang, Y.; Wei, Q.; Su, W.; Li, H.M.; Wang, Q.Q. Kinetic structure and wave properties associated with sharp dipolarization front observed by Cluster. Ann. Geophys. 2012, 30, 97–107. [Google Scholar] [CrossRef] [Green Version]
- Hwang, K.; Goldstein, M.L.; Moore, T.E.; Walsh, B.M.; Baishev, D.G.; Moiseyev, A.V.; Shevtsov, B.M.; Yumoto, K. Atailward moving current sheet normal magnetic field front followed by an earthward moving dipolarization front. J. Geophys. Res. Space Physics. 2014, 119, 5316–5327. [Google Scholar] [CrossRef]
- Liu, J.; Angelopoulos, V.; Runov, A.; Zhou, X.-Z. On the current sheets surrounding dipolarizing flux bundles in the magnetotail: The case for wedgelets. J. Geophy. Res. Space Physics. 2013, 118, 2000–2020. [Google Scholar] [CrossRef]
- Liu, J.; Angelopoulos, V.; Zhou, X.-Z.; Runov, A. Magnetic flux transport by dipolarizing flux bundles. J. Geophy. Res. Space Physics. 2014, 119, 909–926. [Google Scholar] [CrossRef]
- Runov, A.; Angelopoulos, V.; Zhou, X.-Z.; Zhang, X.-J.; Li, S.; Plaschke, F.; Bonnell, J. A THEMIS multicase study of dipolarization fronts in the magnetotail plasma sheet. J. Geophys. Res. 2011, 116, A05216. [Google Scholar] [CrossRef]
- Lui, A.T.Y. Dipolarization fronts and magnetic flux transport. Geosci. Lett. 2015, 2, 15. [Google Scholar] [CrossRef] [Green Version]
- Angelopoulos, V.; Kennel, C.F.; Coroniti, F.V.; Pellat, R.; Kivelson, M.G.; Walker, R.J.; Russell, C.T.; Baumjohann, W.; Feldman, W.C.; Gosling, J.T. Statistical characteristics of bursty bulk flow events. J. Geophys. Res. 1994, 99, 21257–21280. [Google Scholar] [CrossRef] [Green Version]
- Yao, Z.H.; Liu, J.; Owen, C.J.; Forsyth, C.; Rae, I.J.; Pu, Z.Y.; Fu, H.S.; Zhou, X.-Z.; Shi, Q.Q.; Du, A.M.; et al. A physical explanation for the magnetic decrease ahead of dipolarization fronts. Ann. Geophys. 2015, 33, 1301–1309. [Google Scholar] [CrossRef] [Green Version]
- Takahashi, K.; Zanetti, L.J.; Lopez, R.E.; McEntire, R.W.; Potemra, T.A.; Yumoto, K. Disruption of the magnetotail current sheet observed by AMPTE/CCE. Geophys. Res. Lett. 1987, 14, 1019–1022. [Google Scholar] [CrossRef]
- Lui, A.T.Y. Cross-tail current evolution during substorm depolarization. Ann. Geophys. 2013, 31, 1131–1142. [Google Scholar] [CrossRef] [Green Version]
- Lui, A.T.Y. Potential plasma instabilities for substorm expansion onset. Space Sci. Rev. 2004, 113, 127–206. [Google Scholar] [CrossRef]
- Pritchett, P.L.; Coroniti, F.V. Structure and consequences of the kinetic ballooning/interchange instability in the magnetotail. J. Geophys. Res. Space Physics. 2013, 118, 146–159. [Google Scholar] [CrossRef]
- Torbert, R.B.; Burch, J.L.; Phan, T.D.; Hesse, M.; Argall, M.R.; Shuster, J.; Ergun, R.E.; Alm, L.; Nakamura, R.; Genestreti, K.J.; et al. Electron-scale dynamics of the diffusion region during symmetric magnetic reconnection in space. Science 2018, 362, 1391–1395. [Google Scholar] [CrossRef] [Green Version]
- Lui, A.T.Y.; Consolini, G. Substorm Disturbance Propagation from a Two-Dimensional Cellular Automaton Model, Multiscale Coupling of Sun-Earth Processes; Lui, A.T.Y., Kamide, Y., Consolini, G., Eds.; Elsevier: Amsterdam, The Netherlands, 2005; pp. 357–364. [Google Scholar]
- Consolini, G.; Kretzschmar, M.; Lui, A.T.Y.; Zimbardo, G.; Macek, W.M. On the magnetic field fluctuations during magnetospheric tail current disruption: A statistical approach. J. Geophys. Res. 2005, 110, A07202. [Google Scholar] [CrossRef] [Green Version]
- Zelenyi, L.M.; Delcourt, D.C.; Malova, H.V.; Sharma, A.S. “Aging” of the magnetotail thin current sheets. Geophys. Res. Lett. 2002, 29, 49-1–49-4. [Google Scholar] [CrossRef]
- Zelenyi, L.M.; Malova, H.V.; Popov, V.Y.; Delcourt, D.; Sharma, A.S. Nonlinear equilibrium structure of thin currents sheets: Influence of electron pressure anisotropy. Nonlinear Process. Geophys. 2004, 11, 579–587. [Google Scholar] [CrossRef] [Green Version]
- Grigorenko, E.E.; Zelenyi, L.M.; DiBraccio, G.; Ermakov, V.N.; Shuvalov, S.D.; Malova, H.V.; Poppov, V.Y.; Halekas, J.S.; Mitchell, D.J.; Dubinin, E. Thin current sheets of sub-ion scales observed by MAVEN in the Martian magnetotail. Geophys. Res. Lett. 2019, 46, 6214–6222. [Google Scholar] [CrossRef]
- Büchner, J.; Zelenyi, L.M. Regular and chaotic charged particle motion in magnetotail like field reversals: 1. Basic theory of trapped motion. J. Geophys. Res. 1989, 94, 11821–11842. [Google Scholar] [CrossRef]
- Zelenyi, L.M.; Malova, H.V.; Leonenko, M.V.; Grigorenko, E.E.; Popov, V.Y. Equilibrium configurations of super-thin current sheets in space plasma: Characteristic scaling of multilayer structures. J. Geophys. Res. Space Phys. 2022, 127, e2022JA030881. [Google Scholar] [CrossRef]
- Coppi, B.; Laval, G.; Pellat, R. Dynamics of the geomagnetic tail. Phys. Rev. Lett. 1966, 16, 1207–1210. [Google Scholar] [CrossRef]
- Schindler, K. A theory of the substorm mechanism. J. Geophys. Res. 1974, 79, 2803–2810. [Google Scholar] [CrossRef]
- Pellat, R.; Coroniti, F.V.; Pritchett, P.L. Does ion tearing exist? Geophys. Res. Lett. 1991, 18, 143–146. [Google Scholar] [CrossRef]
- Brittnacher, M.; Quest, K.B.; Karimabadi, H. A study of the effect of pitch angle and spatial diffusion on tearing instability using a new finite element based linear code. J. Geophys. Res. 1998, 103, 4587–4596. [Google Scholar] [CrossRef]
- Sitnov, M.I.; Schindler, K. Tearing stability of a multiscale magnetotail current sheet. Geophys. Res. Lett. 2010, 37, 8. [Google Scholar] [CrossRef]
- Lui, A.T.Y.; Chang, C.-L.; Mankofsky, A.; Wong, H.-K.; Winske, D. A cross-field current instability for substorm expansions. J. Geophys. Res. 1991, 96, 11389–11401. [Google Scholar] [CrossRef] [Green Version]
- Henderson, M.G. Implications of Viking Imager Results for Substorm Models; University of Calgary: Calgary, AB, Canada, 1994. [Google Scholar]
- Donovan, E.; Liu, W.; Liang, J.; Spanswick, E.; Voronkov, I.; Connors, M.; Syrjäsuo, M.; Baker, G.; Jackel, B.; Trondsen, T.; et al. Simultaneous THEMIS in situ and auroral observations of a small substorm. Geophys. Res. Lett. 2008, 35, L17S18. [Google Scholar] [CrossRef] [Green Version]
- Haerendel, G. Substorm onset: Current sheet avalanche and stop layer. J. Geophys. Res. Space Phys. 2015, 120, 1697–1714. [Google Scholar] [CrossRef]
- Lui, A.T.Y. Evaluation of the cross-field current instability as a substorm onset process with auroral bead properties. J. Geophys. Res. Space Phys. 2020, 123, e2020JA027867. [Google Scholar] [CrossRef]
- Pritchett, P.L.; Coroniti, F.V.; Nishimura, Y. The kinetic ballooning/interchange instability as a source of dipolarization fronts and auroral streamers. J. Geophys. Res. Space Phys. 2014, 119, 4723–4739. [Google Scholar] [CrossRef]
- Haerendel, G.; Frey, H. The onset of a substorm and the mating instability. J. Geophys. Res. Space Phys. 2021, 126, e2021JA029492. [Google Scholar] [CrossRef]
- Samson, J.C.; Wallis, D.D.; Hughes, T.J.; Creutzberg, F.; Ruohoniemi, J.M.; Greewalkd, R.A. Substorm intensifications and field line resonances in the nightside magnetosphere. J. Geophys. Res. 1992, 97, 8495–8518. [Google Scholar] [CrossRef]
- Yoon, P.H.; Lui, A.T.Y.; Sitnov, M. Generalized lower-hybrid drift instabilities in current-sheet equilibrium. Phys. Plasmas 2002, 9, 1526–1538. [Google Scholar] [CrossRef]
- Pu, Z.Y.; Korth, A.; Chen, Z.X.; Friedel RH, W.; Zong, Q.G.; Wang, X.M.; Wong, M.H.; Fu, S.Y.; Pulkkinen, T.I. MHD drift ballooning instability near the inner edge of the near-Earth plasma sheet. J. Geophys. Res. 1997, 102, 14397–14406. [Google Scholar] [CrossRef]
- Voronkov, I.; Rankin, R.; Frycz, P.; Tikhonchuk, V.T.; Samson, J.C. Coupling of shear flow and pressure gradient instabilities. J. Geophys. Res. 1997, 102, 9639–9650. [Google Scholar] [CrossRef]
- Cheng, C.Z.; Lui, A.T.Y. Kinetic ballooning instability for substorm onset and current disruption observed by AMPTE/CCE. Geophys. Res. Lett. 1998, 25, 4091–4094. [Google Scholar] [CrossRef] [Green Version]
- Friedrich, E.; Samson, J.C.; Voronkov, I.; Rostoker, G. Dynamics of the substorm expansive phase. J. Geophys. Res. 2001, 106, 13145–13163. [Google Scholar] [CrossRef]
- Cheng, C.Z. Physics of substorm growth phase, onset, and depolarization. Space Sci. Rev. 2004, 113, 207–270. [Google Scholar] [CrossRef] [Green Version]
- Samson., J.C.; Dobias, P. Explosive instabilities and substorm intensifications in the Earth’s magnetotail. In Multiscale Coupling of Sun-Earth Processes; Lui, A.T.Y., Kamide, Y., Consolini, G., Eds.; Elsevier B. V.: Amsterdam, The Netherlands, 2005; pp. 235–251. [Google Scholar]
- Saito, M.H.; Miyashita, Y.; Fujimoto, M.; Shinohara, I.; Saito, Y.; Liou, K.; Mukai, T. Ballooning mode waves prior to substorm-associated dipolarizations: Geotail observations. Geophys. Res. Lett. 2008, 35, L07103. [Google Scholar] [CrossRef]
- Liang, J.; Donovan, E.F.; Liu, W.W.; Jackel, B.; Syrjasuo, M.; Mende, S.B.; Frey, H.U.; Angelopoulos, V.; Connors, M. Intensification of pre-existing auroral arc at substorm expansion phase onset: Wave-like disruption during the first tens of seconds. Geophys. Res. Lett. 2008, 35, L17S19. [Google Scholar] [CrossRef] [Green Version]
- Rae, I.J.; Mann, I.R.; Angelopoulos, V.; Murphy, K.R.; Milling, D.K.; Kale, A.; Frey, H.; Rostoker, G.; Russell, C.T.; Watt, C.; et al. Near-Earth initiation of a terrestrial substorm. J. Geophys. Res. 2009, 114, A07220. [Google Scholar] [CrossRef] [Green Version]
- Rae, I.J.; Watt CE, J.; Mann, I.R.; Murphy, K.R.; Samson, J.C.; Kabin, K.; Angelopoulos, V. Optical characterization of the growth and spatial structure of a substorm onset arc. J. Geophys. Res. 2010, 115, A10222. [Google Scholar] [CrossRef] [Green Version]
- Keiling, A. Pi2 pulsations driven by ballooning instability. J. Geophys. Res. 2012, 117. [Google Scholar] [CrossRef]
- Liu, W.W.; Liang, J.; Donovan, E.F.; Spanswick, E. If substorm onset triggers tail reconnection, what triggers substorm onset? J. Geophys. Res. 2012, 117, A11220. [Google Scholar] [CrossRef] [Green Version]
- Kozelova, T.V.; Kozelov, B.V. Substorm-associated explosive magnetic field stretching near the earthward edge of the plasma sheet. J. Geophys. Res. Space Phys. 2013, 118, 3323–3335. [Google Scholar] [CrossRef]
- Xing, X.; Liang, J.; Spanswick, E.; Lyons, L.; Angelopoulos, V. Auroral wave structures and ballooning instabilities in the plasma sheet. J. Geophys. Res. Space Phys. 2013, 118, 6319–6326. [Google Scholar] [CrossRef]
- Kalmoni, N.M.E.; Rae, I.J.; Watt, C.E.J.; Murphy, K.R.; Forsyth, C.; Owen, C.J. Statistical characterization of the growth and spatial scales of the sub storm onset arc. J. Geophys. Res. Space Phys. 2015, 120, 8503–8516. [Google Scholar] [CrossRef]
- Nishimura, Y.; Yang, J.; Pritchett, P.L.; Coroniti, F.V.; Donovan, E.F.; Lyons, L.R.; Wolf, R.A.; Angelopoulos, V.; Mende, S.B. Statisitcal properties of substorm auroral onset beads/rays. J. Geophys. Res. Space Phys. 2016, 121, 8661–8676. [Google Scholar] [CrossRef] [Green Version]
- Lui, A.T.Y. Dipolarization front and current disruption. Geophys. Res. Lett. 2016, 43, 10050. [Google Scholar] [CrossRef]
- Motoba, T.; Hosokawa, K.; Kodokura, A.; Sato, N. Magnetic conjugacy of northern and southern auroral beads. Geophys. Res. Lett. 2012, 39, L08108. [Google Scholar] [CrossRef]
- Lui, A.T.Y. Cross-field current instability for auroral bead formation in breakup arcs. Geophys. Res. Lett. 2016, 43, 6087–6095. [Google Scholar] [CrossRef] [Green Version]
- Lui, A.T.Y.; Burrows, J.R. On the location of auroral arcs near substorm onset. J. Geophys. Res. 1978, 83, 3342–3348. [Google Scholar] [CrossRef]
Figure 1.
A schematic diagram to illustrate the primary current systems in the Earth’s magnetotail plasma sheet.
Figure 1.
A schematic diagram to illustrate the primary current systems in the Earth’s magnetotail plasma sheet.
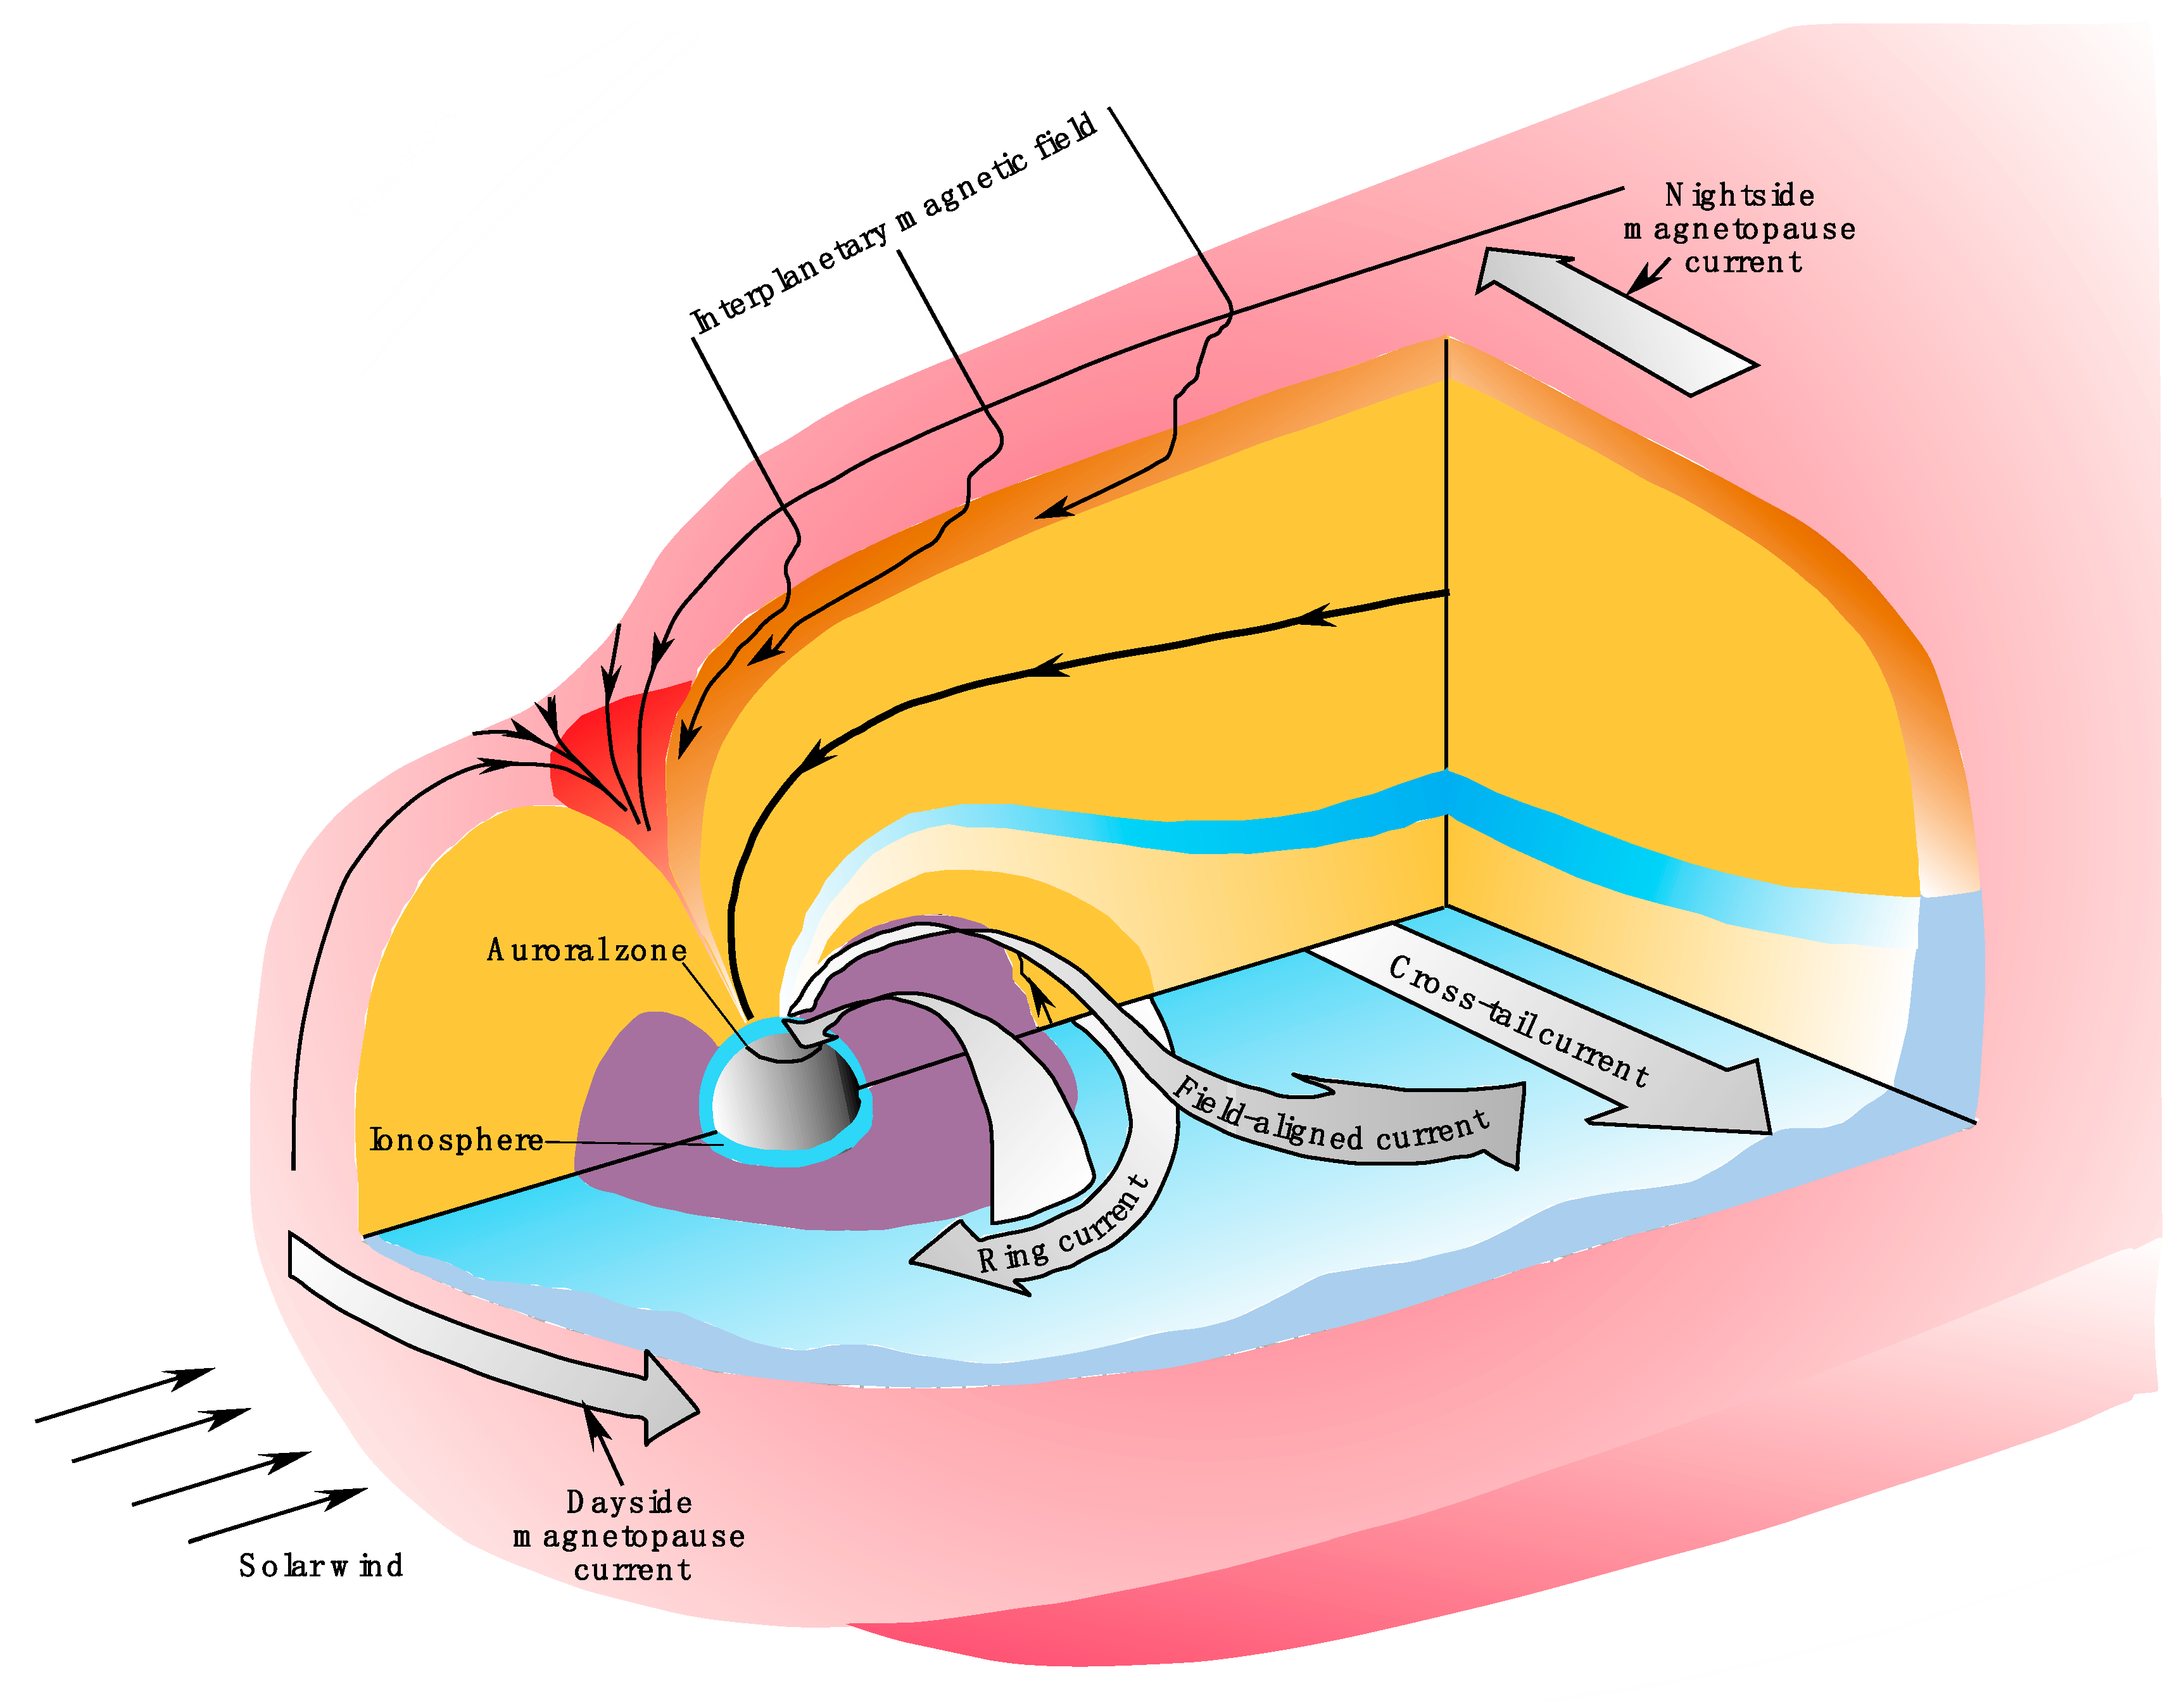
Figure 2.
The Bz component, plasma bulk flow Uxm, and comparison between Ey and −(U B)y for four THEMIS (Time History of Events and Macroscale Interactions during Substorms) satellites on 27 February 2009. The two quantities in evaluating the FIC agree reasonably well.
Figure 2.
The Bz component, plasma bulk flow Uxm, and comparison between Ey and −(U B)y for four THEMIS (Time History of Events and Macroscale Interactions during Substorms) satellites on 27 February 2009. The two quantities in evaluating the FIC agree reasonably well.

Figure 3.
The Bz component, plasma bulk flow Uxm, and comparison between Ey and –(U B)y for four THEMIS satellites on 5 March 2009. The two quantities in evaluating the FIC have significant differences.
Figure 3.
The Bz component, plasma bulk flow Uxm, and comparison between Ey and –(U B)y for four THEMIS satellites on 5 March 2009. The two quantities in evaluating the FIC have significant differences.

Figure 4.
A case of CD is shown to indicate its proximity to Earth in the usually dipolar region (left); the measured rapid fluctuations of the magnetic field components at the site (right). The components of the magnetic field: Bv is the vertical component; Bd is the declination component; Bh is the horizontal component; B_lat is the latitude angle; and B_long is the longitudinal angle.

Figure 5.
A schematic diagram to illustrate several features of CD. The sense of the y-component of the cross-tail current and the y-component of the electric field is indicated by the sign of Jy and Ey, respectively. The current and electric field can reverse their sign locally. The CD occurs in a closed magnetic field region unconnected to MR.

Figure 6.
Observations of CD on 28 February 2009 showing the AU/AL (auroral upper/auroral lower) indices, the magnetic field components in GSM coordinates at P4 and P5, current densities in the layer embedded by P4 and P5, power within the layer, and the average electric field at the two satellites at CD.

Figure 7.
Comparison of observed (a) growth rate and (b) period as a function of ionospheric wavenumber for WABs with CCI predictions. The comparison shows that the WABs characteristics can be produced best by excitation of CCI at 11 RE for the local plasma parameters as shown.
Figure 7.
Comparison of observed (a) growth rate and (b) period as a function of ionospheric wavenumber for WABs with CCI predictions. The comparison shows that the WABs characteristics can be produced best by excitation of CCI at 11 RE for the local plasma parameters as shown.

Figure 8.
The CCI disturbance generates a condition showing opposite signs of J⊥ and on the west and east sides of the CD (a), and based on Equation (2), opposite signs of FACs are produced to produce the periodic bead structure in the ionosphere (b).
Figure 8.
The CCI disturbance generates a condition showing opposite signs of J⊥ and on the west and east sides of the CD (a), and based on Equation (2), opposite signs of FACs are produced to produce the periodic bead structure in the ionosphere (b).

Figure 9.
(a) A schematic diagram to show the conjugacy of auroral beads by ground-based observations from both northern and southern hemispheres, (b) the wavelengths in the magnetospheric equatorial plane corresponding to the periodic structure of the auroral beads, and (c) the current filamentation and electron acceleration arising from CCI excitation.
Disclaimer/Publisher’s Note: The statements, opinions and data contained in all publications are solely those of the individual author(s) and contributor(s) and not of MDPI and/or the editor(s). MDPI and/or the editor(s) disclaim responsibility for any injury to people or property resulting from any ideas, methods, instructions or products referred to in the content. |
© 2023 by the author. Licensee MDPI, Basel, Switzerland. This article is an open access article distributed under the terms and conditions of the Creative Commons Attribution (CC BY) license (https://creativecommons.org/licenses/by/4.0/).
Share and Cite
MDPI and ACS Style
Lui, A.T.Y. Dynamics of the Magnetotail Plasma Sheet Current. Atmosphere 2023, 14, 222. https://doi.org/10.3390/atmos14020222
AMA Style
Lui ATY. Dynamics of the Magnetotail Plasma Sheet Current. Atmosphere. 2023; 14(2):222. https://doi.org/10.3390/atmos14020222
Chicago/Turabian StyleLui, Anthony Tat Yin. 2023. "Dynamics of the Magnetotail Plasma Sheet Current" Atmosphere 14, no. 2: 222. https://doi.org/10.3390/atmos14020222
Note that from the first issue of 2016, this journal uses article numbers instead of page numbers. See further details here.