Article

Physical Model of D-Region Ionosphere and Preliminary Comparison with IRI and Data of MF Radar at Kunming

1
China Research Institute of Radiowave Propagation, Qingdao 266107, China
2
Key Laboratory of Near Earth Space Environment, Chinese Academy of Sciences, University of Science and Technology of China, Hefei 230026, China
3
Department of Space Physics, School of Electronic Information, Wuhan University, Wuhan 430072, China
*
Author to whom correspondence should be addressed.
Atmosphere 2023, 14(2), 235; https://doi.org/10.3390/atmos14020235
Submission received: 31 December 2022 / Revised: 21 January 2023 / Accepted: 22 January 2023 / Published: 25 January 2023
(This article belongs to the Special Issue Mesosphere and Lower Thermosphere)

Abstract

:
Based on the ion continuity equation solved under chemical equilibrium, a physical model of the D-region ionosphere (60–90 km) is established. The model involves 145 ion chemical reactions and includes 23 kinds of positive ions, 11 kinds of negative ions, and electrons. The simulation results show that molecular ions, such as NO+, NO+(H2O)n, H+(H2O)n, CO3, and O3, are the main components of ions in the D-region. The diurnal change of electron density at low latitudes is more obvious than at high latitudes. Preliminary comparisons with the International Reference Ionosphere (IRI) model and observed data of Medium Frequency (MF) radar at Kunming Radio Wave Observation Station show that the model is able to describe the basic features of D-region parameters. In addition, the results show that the minimum height of the D-region lower boundary in the low latitude is approximately 65 ± 1 km, and the height during the daytime is strongly correlated with local time. Furthermore, the results also reveal that the asymmetry of electron density is observed, with higher electron density during sunset than during sunrise at 75–85 km altitude. These above results are helpful for better understanding the variation of the D-region.

1. Introduction

In recent years, there has been a growing scientific interest in the mesosphere and lower thermosphere, i.e., the D-region ionosphere (60–90 km), which is largely motivated by an acute need for a better understanding of the coupling between the upper atmosphere and the climate system [1,2,3]. In addition, the collisions between charged particles and neutrals dominate in the D-region, which leads to serious absorption of high-frequency radio waves passing through it [4]. The D-region also sufficiently affects long-wave communication [5]; however, it is difficult to directly measure with currently available technology [6,7]. To improve the methods of radio wave propagation prediction, it is necessary to conduct detection and theoretical investigation and establish a reliable D-region model [8].
The D-region model is divided into two categories: the empirical model and the physical model. The empirical model is based on experimental data. Bilitza et al. (1981) [9] developed the D-region model based on a limited series of rocket detection data. Singer et al. (1984) [10] and Pancheva et al. (1995) [11] added incoherent scattering radar data to it. Danilov et al. (1995) [12] further refined the D-region empirical model based on the rocket detection data obtained during daytime conditions in the winter. The most widely used empirical ionosphere model in the world is the International Reference Ionosphere (IRI) Model, which uses the empirical D-region model of Danilov et al. The data come from rocket detection, followed by the addition of incoherent scattering radar data [13]. FIRI-2018 was published by Friedrich et al. (2018) [14], which is a significant advancement of the earlier International Reference Ionosphere (IRI-2016) model. Gokov et al. (2020) [15] developed an empirical model in the undisturbed mid-latitude D-region of the ionosphere. The detection data based on the VLF wave were also studied for modeling of the D-region [16,17]. The theoretical model is based on the basic physical processes in the D-region. The D-region is the most complicated ionospheric region from a chemical point of view. A large number of ions are involved in the chemical reaction scheme, including atomic and molecular ions, hydrated positive ions, and negative ions. Currently, several ion chemical models have been developed [18], such as the Metra-Rowe (M-R) 6-ion model [19] established in 1982, the Sodankylä Ion- and neutral-Chemistry model (SIC) [20] established in Finland in 1983, the 8-ion model [21] established by the Russian Polar Research Institute in 1988, and the Whole Atmosphere Community Climate Model D-region (WACCM-D) model established by Verronen et al. (2016) [22]. These models are still developing. For example, the first version of SIC [20] in 1983 included 24 positive ions and 11 negative ions, followed by the enrichment of ion reactions [23] in 1991 and 1996, and the update of reaction coefficients improved by Sentman et al. (2008) [24] and Moore et al. (2016) [25]. Meteoric smoke particles are included by Megner et al. (2006) [26] and Baumann et al. (2015) [27].
Although the physical model of the D-region has been investigated by many researchers, more work still needs to be conducted to improve the understanding of the physical and chemical mechanisms of the D-region. Therefore, the model in this paper reconstructs the framework of ion chemistry with reference to the above models. A physical model can present the distribution of ion species that are of importance for understanding the structure of the lower ionosphere structure. In the following, a steady-state physical model of the D-region (60–90 km) is established, and a preliminary comparison with IRI and observed data is made. This paper is organized as follows. The model is briefly described in Section 2. Then, we present the modeled results and compare them with IRI and the observed data of MF radar at Kunming Radio Wave Observation Station in Section 3. In conclusion, the discussion and summary are given in Section 4.

2. Model Description

The physical processes that control the ionosphere are generally divided into two categories: (1) the photochemical processes that cause the generation and disappearance of ionization and (2) the transport process that causes the movement of ionized particles. The continuity equation is the basic equation describing the physical process that controls the ionosphere. The density changes of ions and electrons in the physical process in the D-region can be described by the continuity equation:
N t + ( N V ) = P L ( N )
Here, the rate of particle change is N / t , ( N V ) is the rate of change of particle density caused by the transport process, P is the rate of particle generation considering photochemical and ion chemical processes in units of time and volume, and L(N) is the rate of particle loss considering ion chemical processes in units of time and volume.
The complex and adhesion processes of particles and a large number of neutral components occur quickly in the D-region, and the ion lifetime is short, usually in the order of seconds [4]. Therefore, the transport processes in the D-region can be ignored, and the photochemical and ion chemical processes play a leading role in the D-region. Because the unit optical depth of X-rays and longer wavelength ultraviolet radiation reaches a lower height, the photochemical processes at the D-region height mainly consider solar EUV radiation (50 Å–1050 Å), Lyman-α radiation (1216 Å), and photoionization of atmospheric neutral components (N2, O2, O, NO, etc.). Furthermore, NO can be ionized by the Lyman-α radiation (the unit optical depth is around 75 km), which is an important source of ionization in the D-region of the ionosphere. Here, the empirical formula of Nicolet (1985) [28] is used to solve the rate of NO of photoionization in the spectrum of Lyman-α. Radiation from other wavelength spectral regions has a much smaller ionization rate than that of NO relative to the neutral atmosphere, and hard X-ray ionization during the ionospheric magnetostatic period is secondary. At night, the direct incoming radiation of Lyman-α is zero, and the reflection from the upper hydrogen geocorona of the atmosphere can also produce a comparable Lyman-α scattering and contribute significantly to ionization in the D-region, so we mainly consider the role of the interstellar background and corona, etc. with respect to nocturnal ionization sources [29,30,31]. The effect of high-energy particle precipitation on the D-region of the ionosphere is not considered. At present, it is only aimed at middle- and low-latitude regions.
At the height of the D-region, the ion chemical process is extremely complex. In this area, the neutral atmospheric density is very large and accounts for a large proportion. There are many kinds of small particles, such as hydrated and agglomerate positive ions, and hydrated negative ions. The collision, recombination, and attachment between particles occur frequently, which results in a very complex ion chemical process. The physical model mainly considers the following types of ion chemical reactions. (1) The combination of electrons and positive ions. Three-body reactions are particularly important. (2) The collision exchange of ions and neutral components. The type of reaction between an ion and an atom in a neutral molecule is particularly considered. (3) The composite of positive and negative ions, because negative ions are abundant only in the D-region. (4) The attachment reaction of electrons and neutral components. It is the main process of producing negative ions. Although the density of neutral particles in the D-region is large and accounts for a large proportion, neutral and neutral collision reactions can be ignored because ionized ions easily exchange charges with neutral particles with lower ionization potential, and the reaction rate is much higher than that of neutral particles.
By considering the contribution of ion chemical reactions to particle density, a steady-state physical model for the D-region (60–90 km) in mid-low latitude regions is established, which considers a steady-state ion chemical framework involving 145 reactions of 23 positive ions, 11 negative ions, 12 neutral particles, and electrons. The ion–chemical scheme of the ionospheric D-region used in our model is shown in Figure 1 and Figure 2. The chemical reaction equations involved in the framework of ion chemistry and the corresponding chemical reaction rates are obtained from references [18,22,23,32,33].
When solving the continuity equation, considering the photochemical equilibrium conditions, ignoring the transport process, and because the ion loss rate is proportional to the ion density, that is, L(N) = Ln, the continuity equation can be simplified as:
P L n = 0 ,
where P includes the ion production rate caused by photochemical processes, such as solar ultraviolet radiation, Lyman-α ray, interstellar background, and corona, and caused by ion chemical processes; L is the ion loss rate caused by the ion chemical process; and n is the density of each particle.
In the photochemical equilibrium region, the number of ion-electron pairs is always affected by the ion chemical process, but it is generally neutral, so the electron density is:
N e = i 23 n i j 11 n j ,
When solving the model, the electron temperature and the number density of neutral components (such as O, O2, He, N2, CO2, H2O, O3, NO2, HO2, OH, O2 (∆ g), and NO) need to be input. In this paper, the most widely used atmospheric model NRLMSISE [34] is used to provide the parameters of the model, such as O, O2, N2, and He, other component densities, and the neutral component, temperature Tn. At the height of the D-region, it can be approximately considered that the electron temperature Te and ion temperature Ti are equal to the neutral temperature, that is, Te = Ti = Tn. Neutral components not covered in the NRLMSIS model come from many sources [32]. Wherein, the density of NO is solved by the following formula: n N O = 0.4 × exp ( 3700 / T ) × n O 2 + 5 × 10 7 × n O . In photoionization calculation, the EUVAC model is used for solar EUV radiation flux, and the Richards cross-section parameters are used for the absorption and ionization of cross-section parameters [35]. As the ionization of the hard X-ray to the D-region increases significantly during solar disturbances, such as high solar activity years or flares, and the model does not consider the hard X-ray as an ionization source, the solar and geomagnetic conditions in low solar activity years are, therefore, selected as the input of the model during simulation. The initial values of NO+, N2+, O+, and O2+ ions and electrons are provided by IRI-2016, and the initial values of others are set to 0. The simulation height range is between 60 km–90 km with step 1. In the physical model, equilibrium is assumed to be reached at any point in time.

3. Model Output and Comparative Analysis

3.1. Model Output

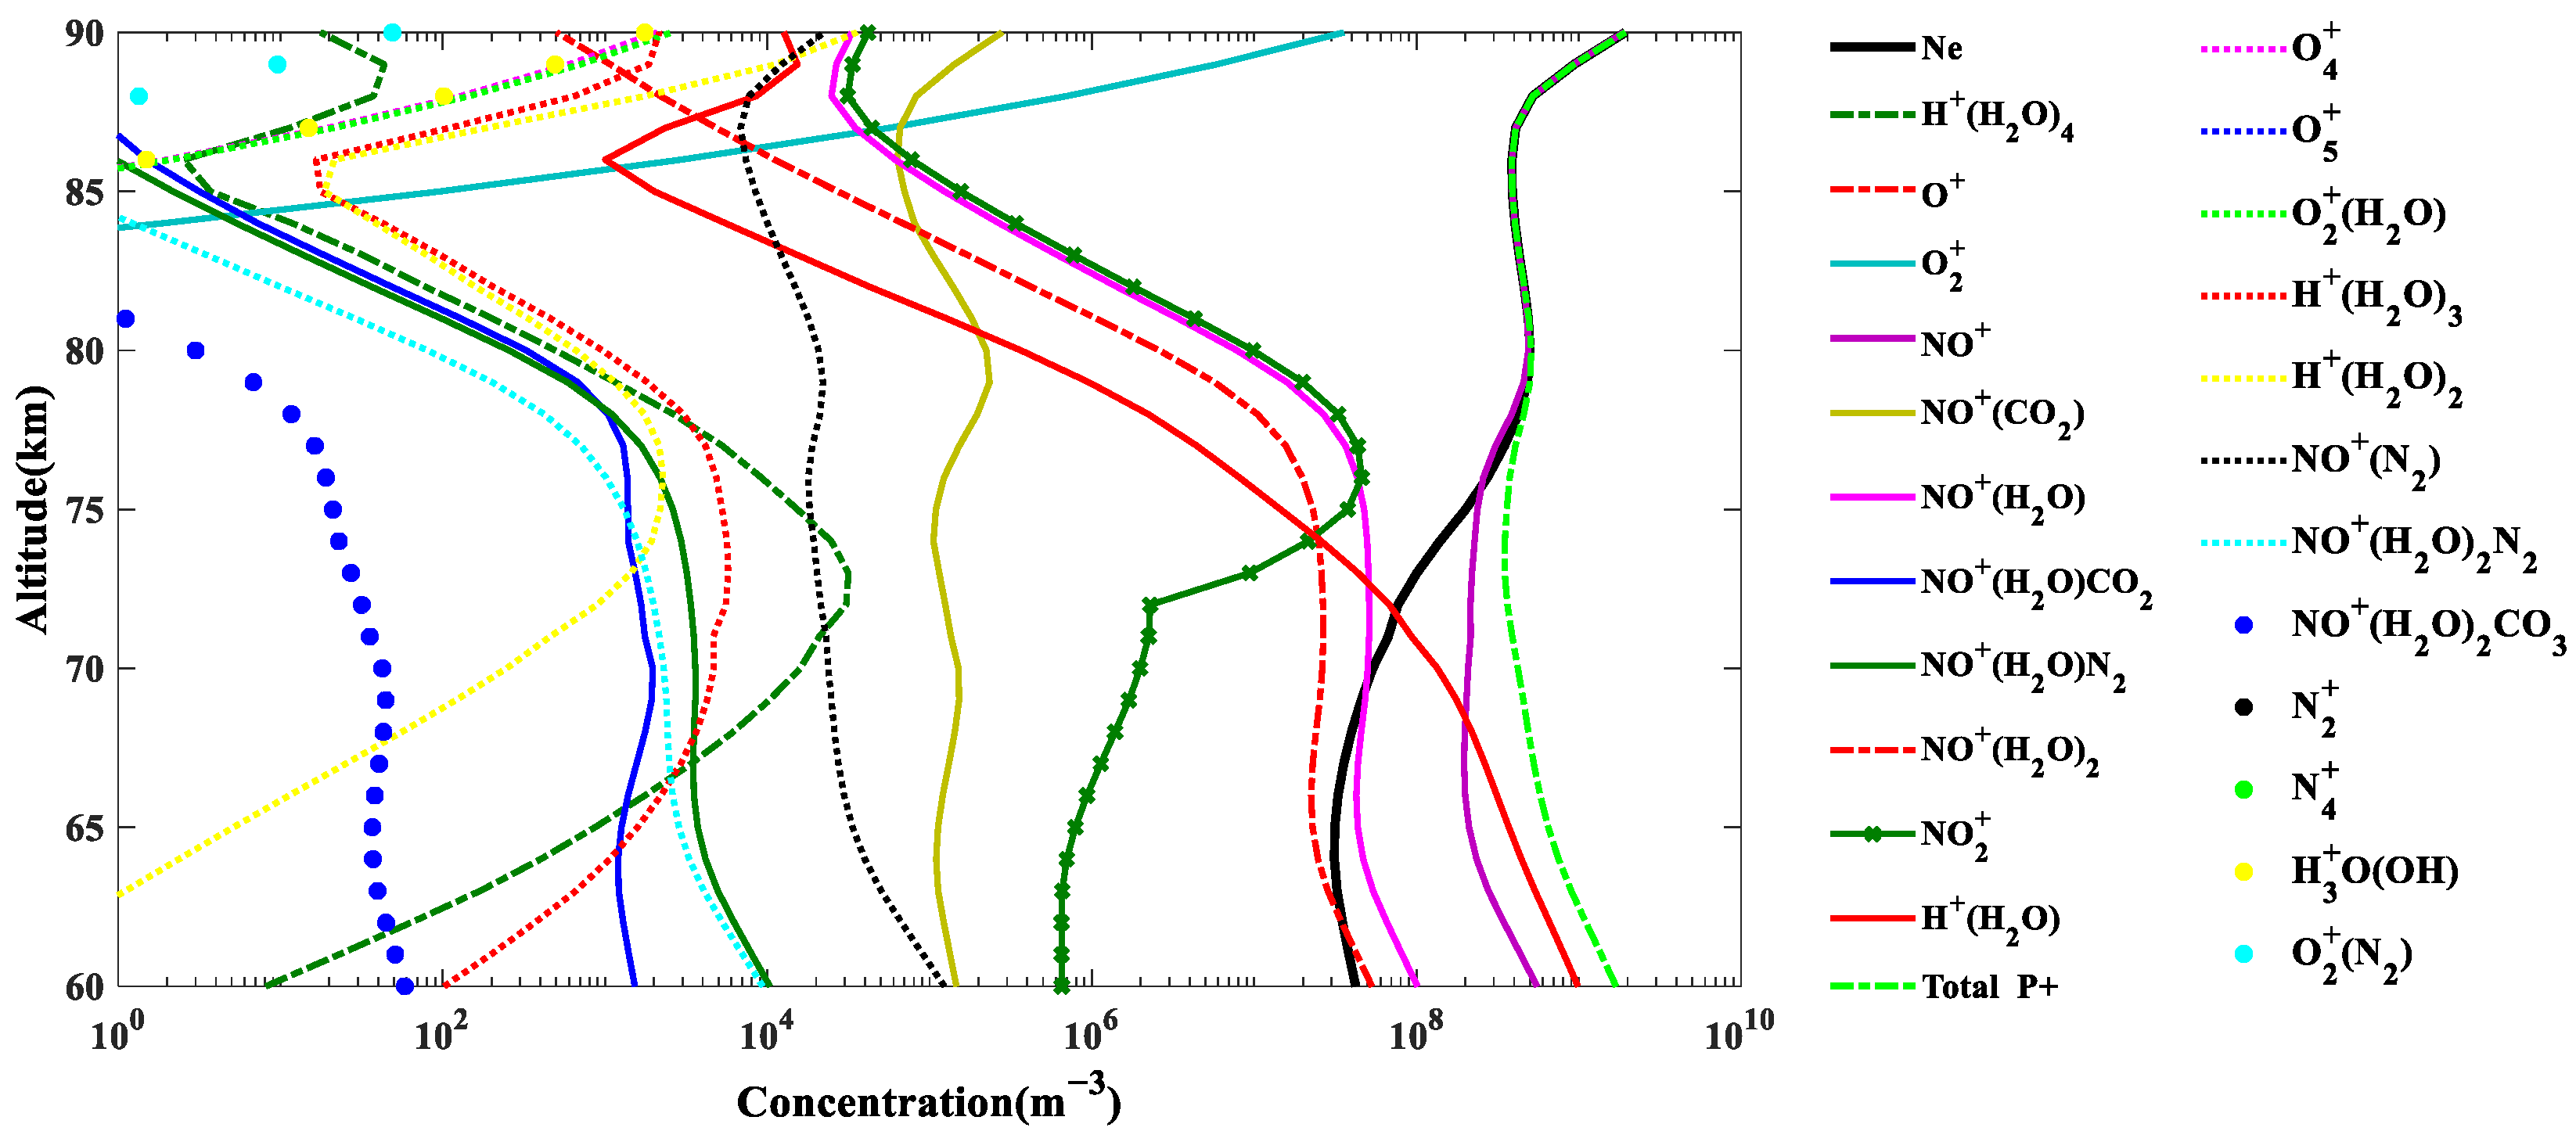
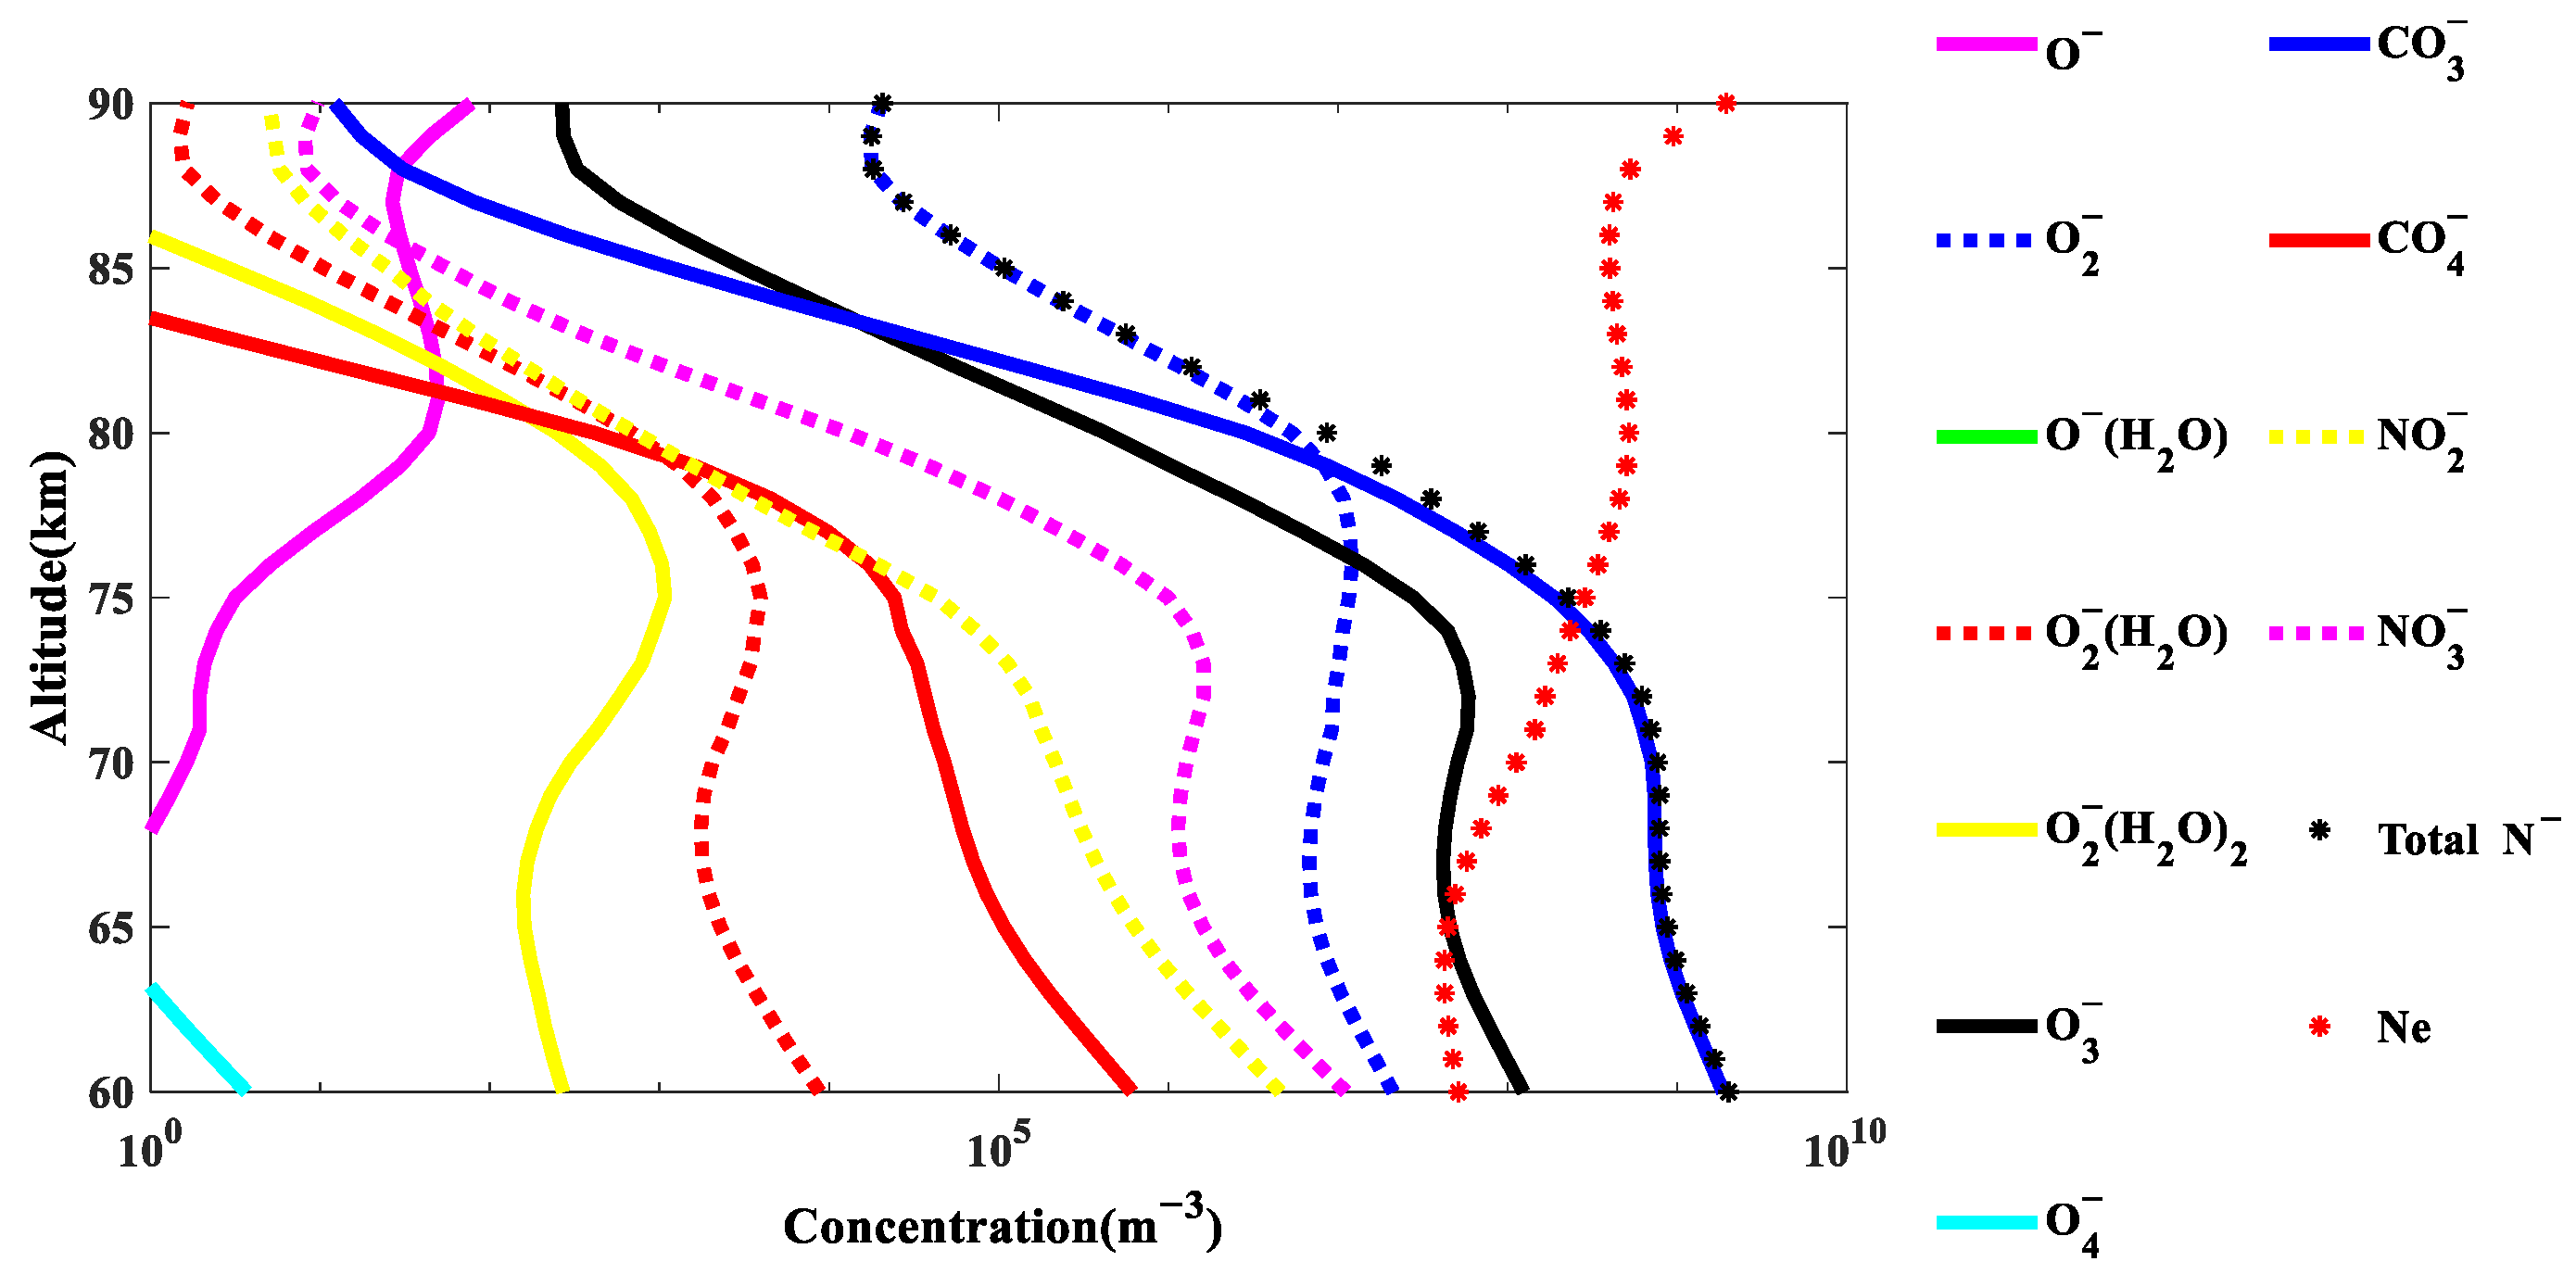
The effectiveness and stability of the model are shown by an example in this section. The solar and geomagnetic conditions (F10.7 = 70, Ap = 4) at 12:00 LT on 15 July 2009 were selected as the input of the model, and the location of Kunming Radio Wave Observation Station (25.6° N, 103.8° E) was selected as the geographic longitude and latitude. The particle concentration distribution of the D-region was obtained by solving the continuity equation. Figure 3 and Figure 4 show the distributions of positive ions, negative ions, and electron densities with height. The same longitude (103.8° E) and different latitudes (5° N, 25° N, and 45° N) were set as the input of the model, as shown in Figure 5, Figure 6 and Figure 7.
It can be seen from Figure 3 that molecular positive ions are the main components, and the proportion of atomic ions is extremely low in the D-region. In general, the concentration of the relatively large, molecular, positive ions gradually increases with the decrease of height. Above 80 km, the electron and total positive ion density are almost equal, whereas, there is a large difference between them below 80 km. The concentration of most positive ions increases with the decrease of height, and the concentration of a small amount of trace components has a peak value with the decrease of height, but these trace components have little effect on the electron density. In the D-region, NO+ accounts for a large proportion, and the electron density is greatly affected by the concentration of NO+. However, the proportion of positive ions of hydrated ions increases as the height decreases, especially below 75 km. For example, below 70 km, the proportion of H+(H2O) increases gradually with the decrease of height, and its maximum order of magnitude can reach 109 m−3, even exceeding the concentration of NO+, which has a great impact on electron density. This is because there are a large number of neutral particles, such as H2O and CO2, in the D-region, which form a large number of hydrated positive ions through physical processes, such as frequent collisions with ions.
The distribution of the main negative ions is shown in Figure 4. It is shown that molecular negative ions are the main components of the D-region, and atomic negative ions account for a relatively low proportion. In general, the total negative ion density increases with the decrease of height, various molecular negative ions generally increase with the decrease of height, and mono-atomic oxygen negative ions decrease with the decrease of height. O2 is the main component of negative ions at 80–90 km, and it is gradually replaced by CO3 and O3 as the main components below 80 km. The maximum magnitude of O3 reaches 107 m−3, and the maximum magnitude of CO3 even reaches 109 m−3. Because of the overall electric neutrality of the ionosphere, when the height decreases, the negative ions gradually increase, which has a great impact on the electron density, resulting in the electron density becoming far less than the ion density. In the D-region, electrons and a large number of neutral components (such as N2, O2, and CO2) generate a large number of negative ions (such as O2, CO3, etc.) through attachment reaction, and then generate negative ions through the collision process, resulting in the reduction of electron density.
Figure 5 shows the variation of the electron density of the model with the local time, at the same longitude (103.8° E) and different latitudes (5° N, 25° N, and 45° N). It can be seen that the D-region electron density is below 1010 m−3 in the mid-low latitude, and the electron density in the daytime is higher than that at night. Further, there is a maximum value during 12:00–13:00 LT. The variation of the electron density is roughly the same at different latitudes, which increases with the decrease of the latitude, and the variation with the local time is more obvious. The possible reason is that the D-region is more affected by the photochemical process as the latitude decreases. In low latitudes (5° N and 25° N), the electron density has a maximum at 80 km in the daytime, that is, the peak height of the D-region is about 80 km, which is more obvious with the decrease of latitude. In mid latitudes (45° N), the electron density does not have a maximum in the daytime. However, there is an obvious minimum at approximately 65 km. At night, the height of the minimum electron density is the D-region lower boundary, which decreases with the decrease of latitude.
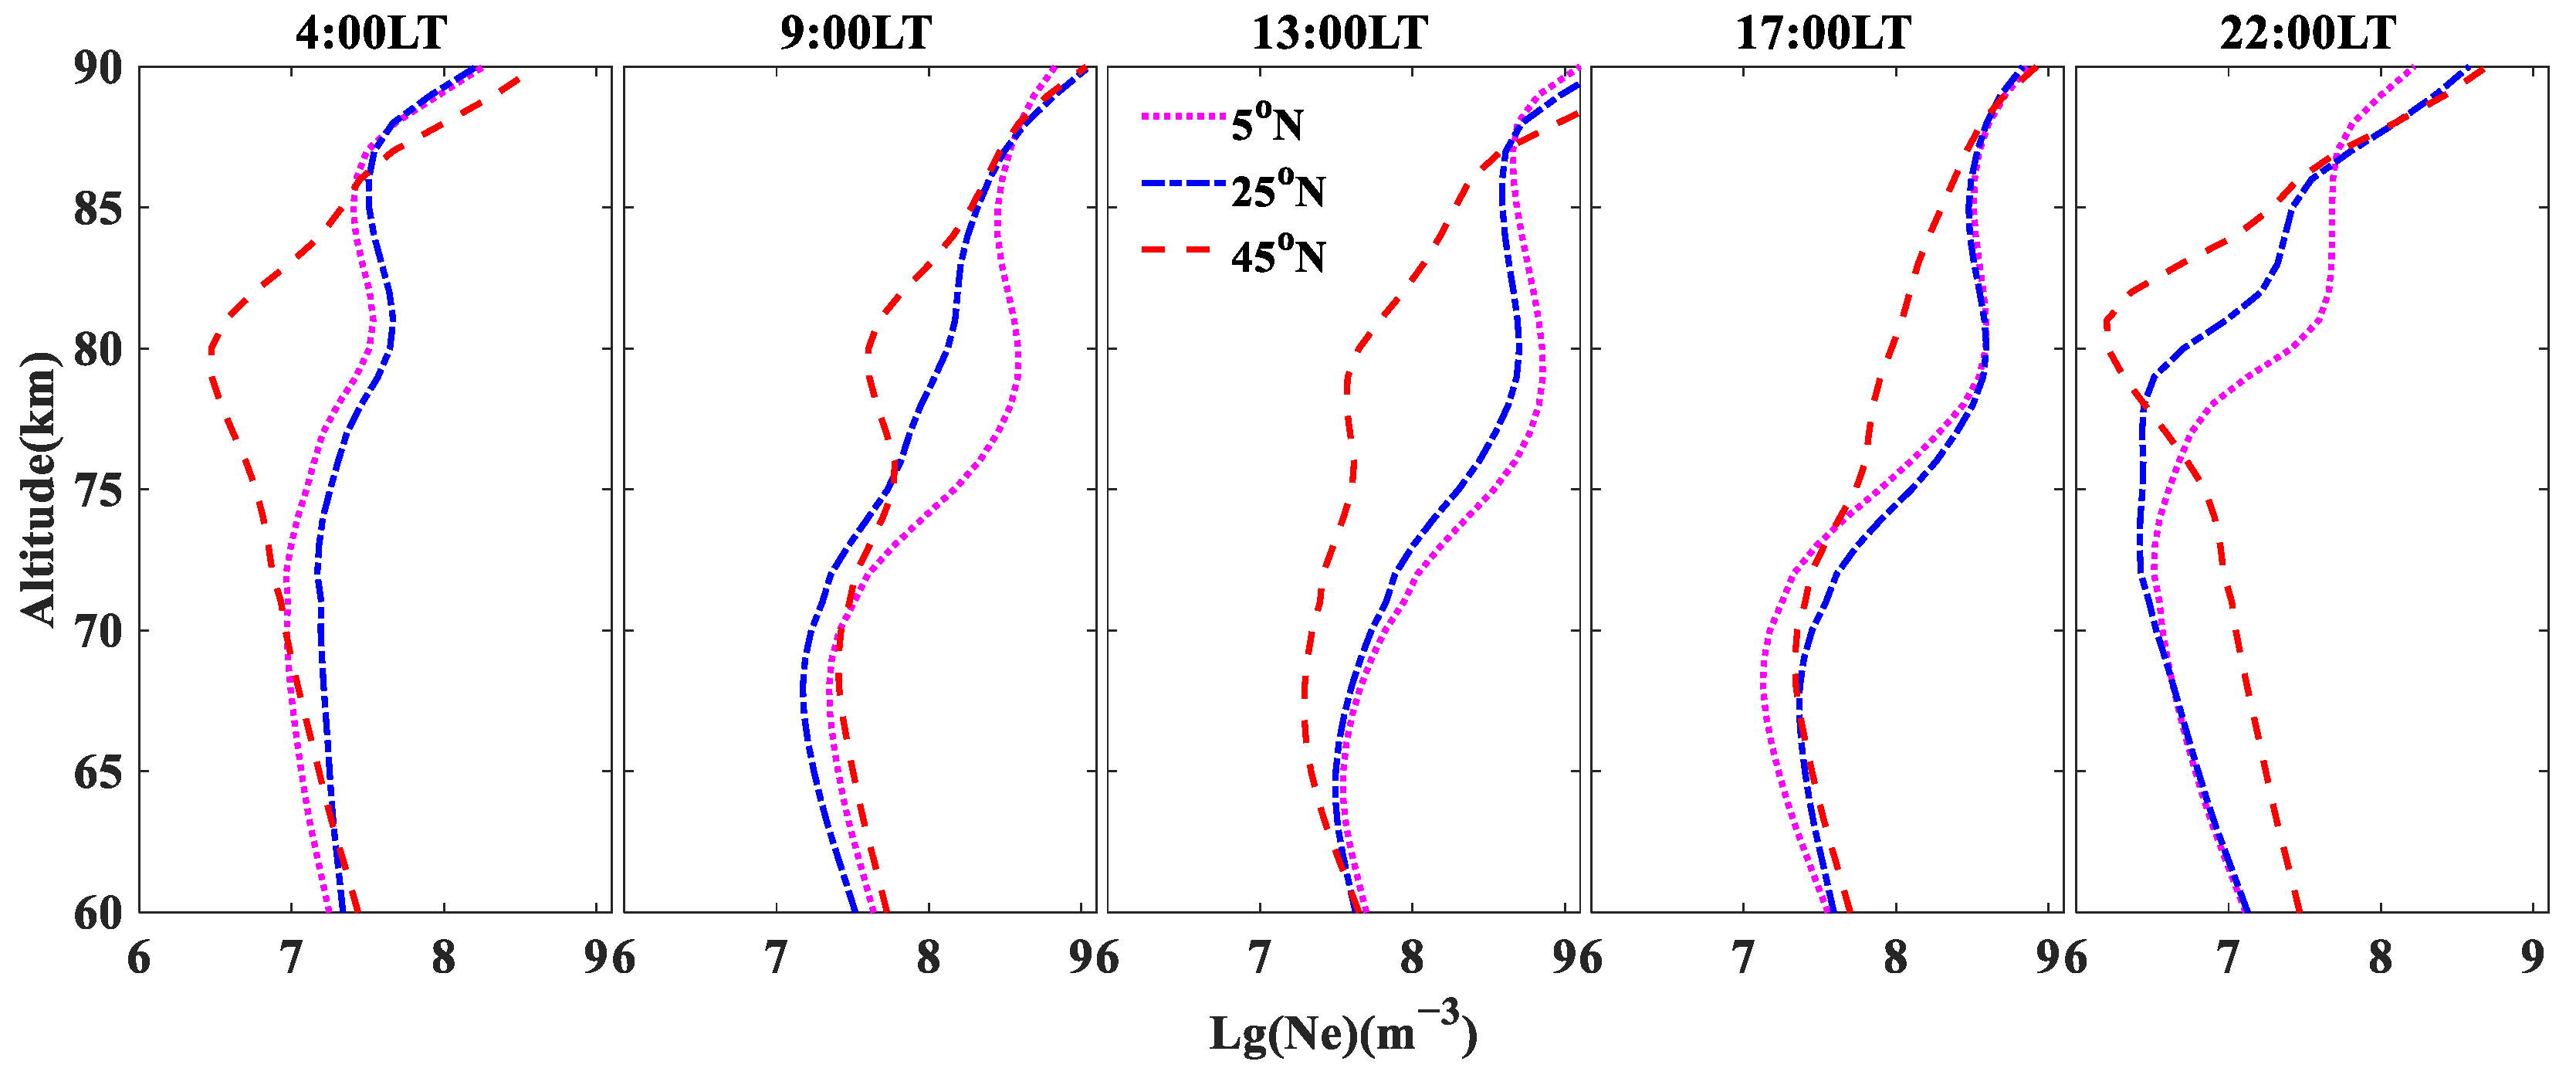
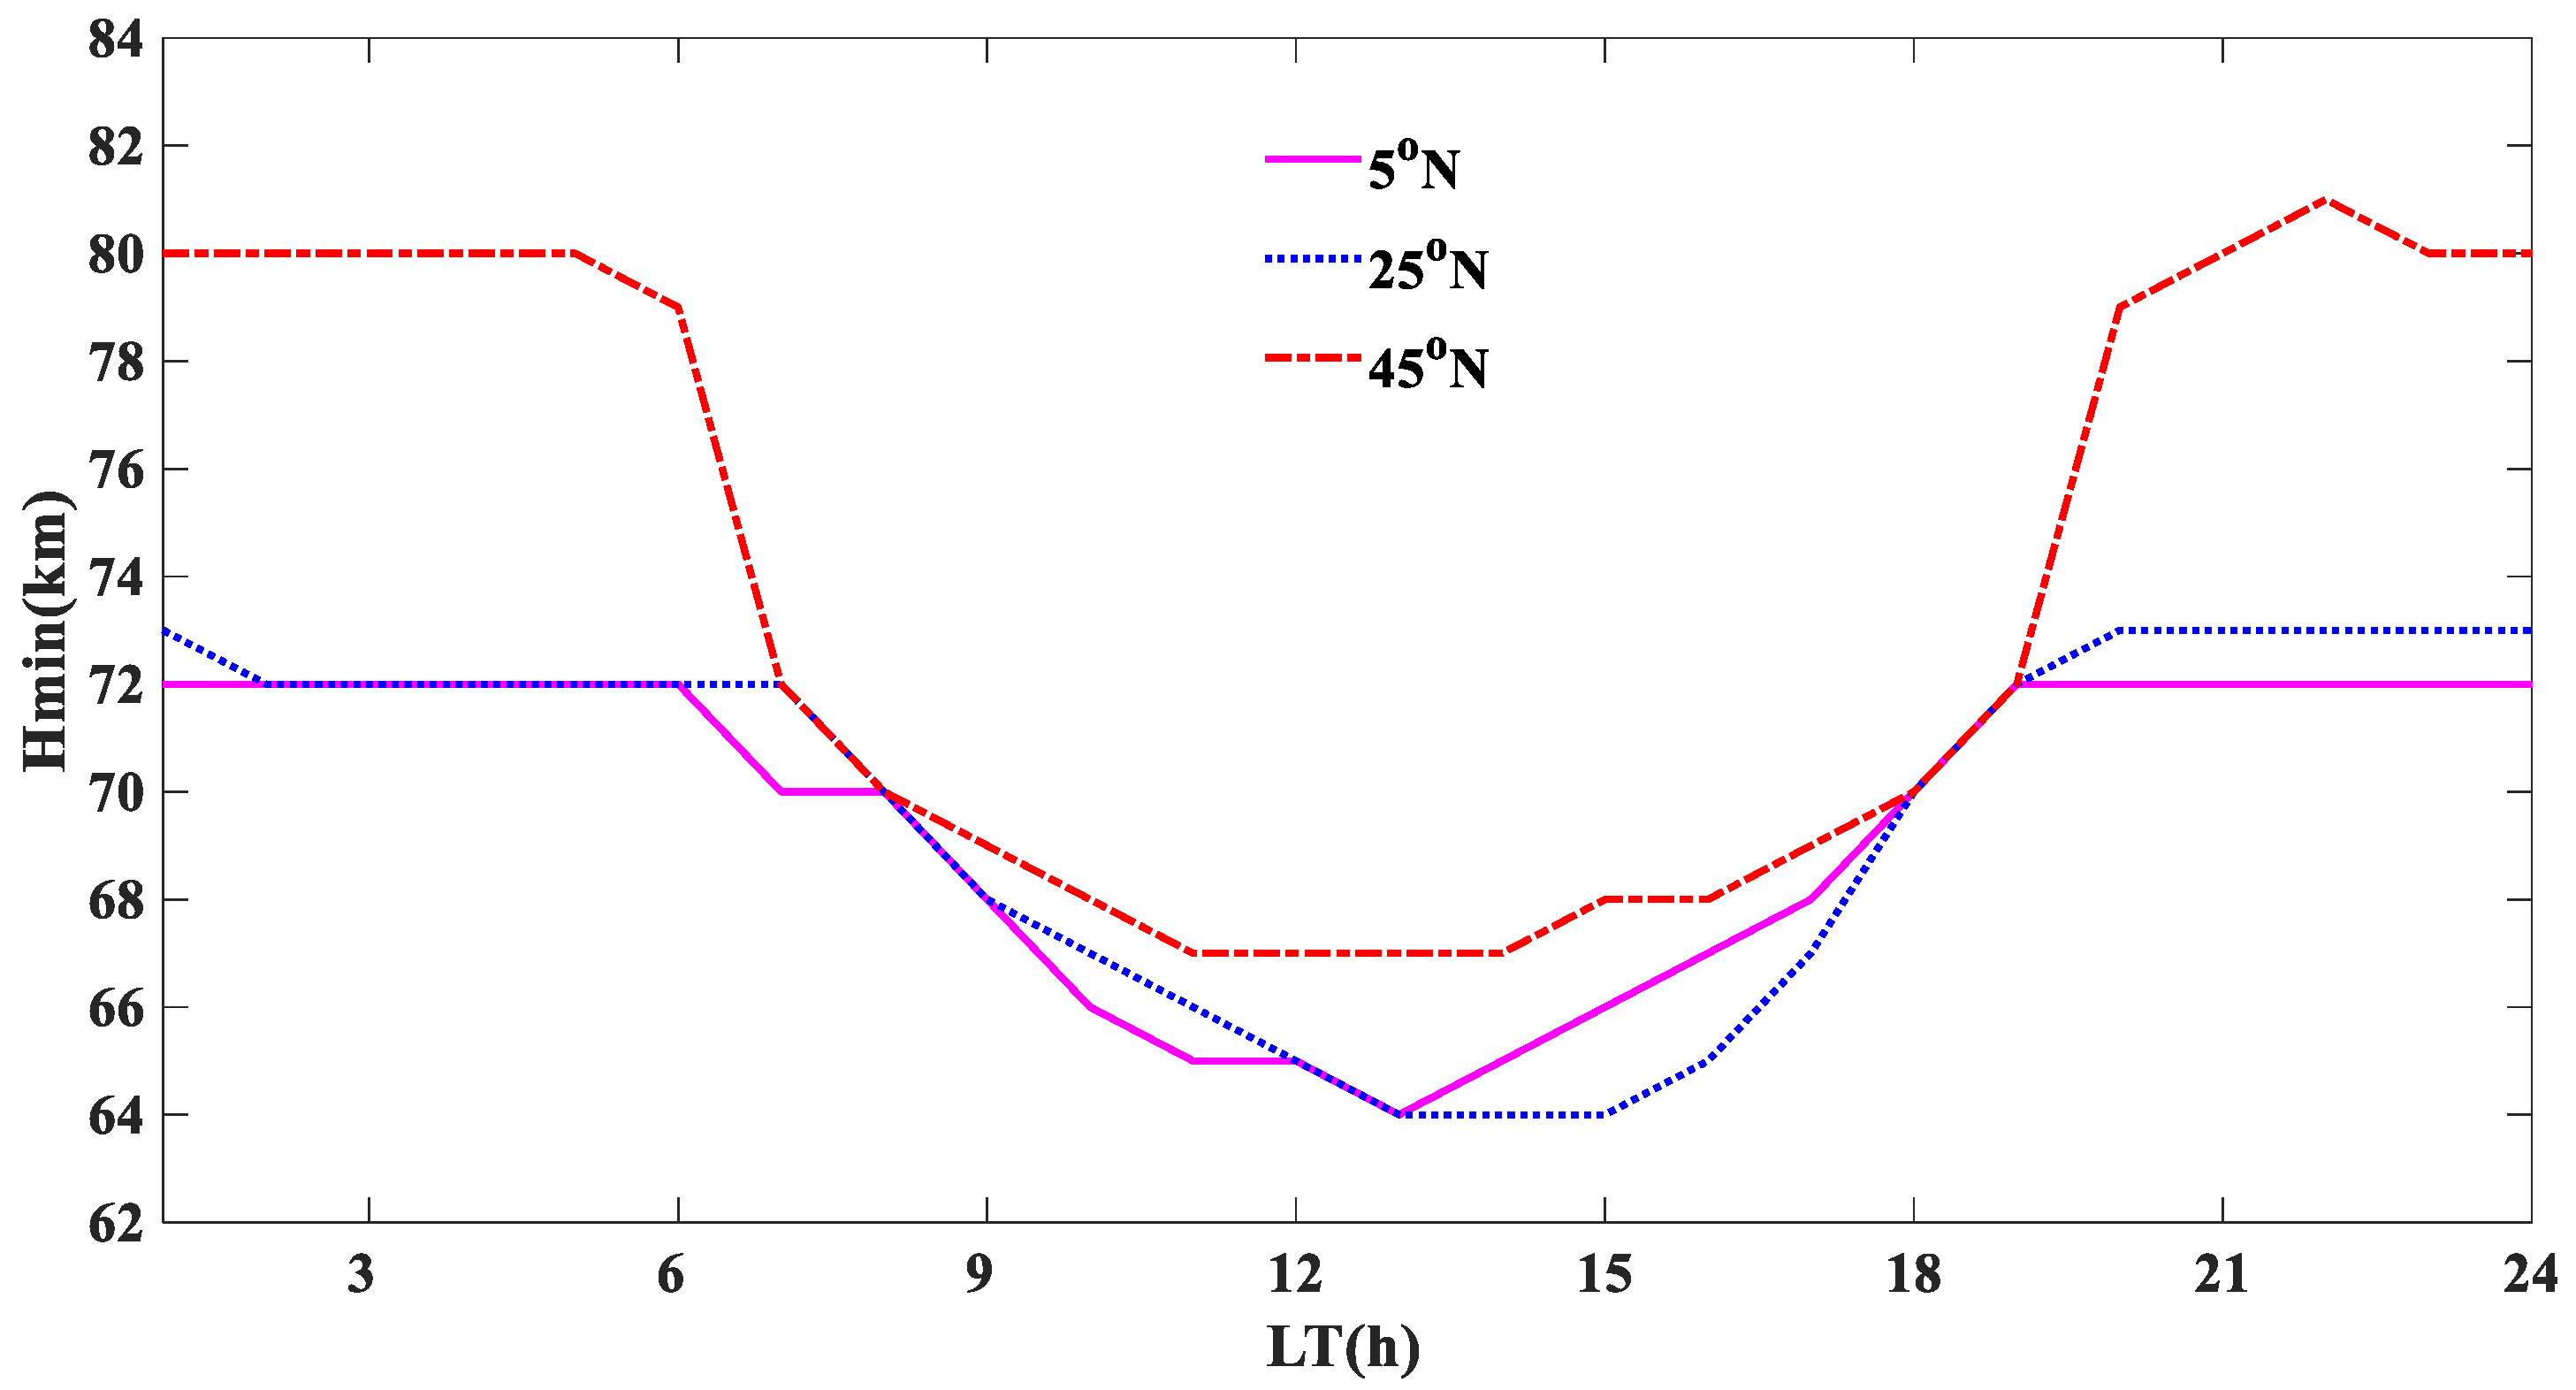
Figure 6 shows the change of the electron density with the altitude at 4:00 LT, 9:00 LT, 13:00 LT, 17:00 LT, and 22:00 LT in 2009. It can be seen that the electron density is 106–1010 m−3, and the maximum value is 5 × 10⁹ m−3 at about 13:00 LT. Further, there is a maximal value at 80 km at about 13:00 LT in low latitudes (5° N and 25° N) from Figure 5 and Figure 6. The changing trends for different LT are the same in low latitudes. With the height decreasing, the electron density decreases firstly and then increases. It has a minimum value, and the height of the minimum value varies with the local time. There is a maximum value at about 80 km, that is, the peak height of the D-region is about 80 km. In the middle latitude, the electron density decreases firstly and then increases with the decrease of the altitude. It has a minimum value, and the height of the minimum value varies with the local time. In general, the model can better reflect the variation of the peak height of the D-region in low latitude than that in mid latitude. There may be a C-region in the mid-low latitude, and it varies with the local time. However, this still needs more research or theory to prove it in the future. Figure 7 shows the change in the height of the minimum electron density (Hmin) with the local time at different latitudes. It can be seen that Hmin in the daytime decreases firstly and then increases with the local time, reaching the minimum value at noon in the daytime. However, it remains unchanged at night. In low latitudes (5° N and 25° N), the minimum value of Hmin occurs at approximately 64 km at 13:00 LT in the daytime and 72 km at night. In the middle latitude (45° N), the minimum value of Hmin occurs at approximately 67 km at 13:00 LT in the daytime and 80 km at night. In general, Hmin increases with the increase of the latitude. The reason is that the height during the daytime is strongly correlated with the solar zenith angle. It can be seen from Figure 6 and Figure 7 that the range of the D-region in the daytime is about 64–85 km, and the lower boundary of the D-region changes with the local time within 72–85 km at night in the low latitude.

3.2. Kunming MF Radar Data

The MF radar in Kunming Radio Observation Station, which is located in low latitudes, can realize the detection of the D-region and be used to verify the physical model. The main parameters of the radar are: (1) time resolution of 3 min (one operation cycle of MF radar is 3 min, in which the DAE test is carried out in 1 min, that is, every 3 min, the radar can provide a set of electron density height profile data, and an hour has 20 sets of data); (2) vertical resolution of 2 km; (3) measuring range from 50 km to 100 km in the daytime and from 80 km to 100 km at night; (4) maximum radar transmitting power of 64 kW; and (5) transmission frequency of 2.138 MHz. The most internationally recognized principle of MF radar detection of electron density in the D-region is Fresnel reflection, also called partial reflection. The refractive index gradient in the ionosphere within the altitude 60–90 km causes partial reflection of the incident electromagnetic wave, and a single layer will generate a back-scattered signal. The phase and amplitude are stable for a long time when the return signal is very strong. Then, the electron density in the D-region was retrieved by comparing the amplitude and phase strength of the returned electromagnetic wave with the amplitude and phase strength of the transmitted electromagnetic wave. The MF radar uses the DAE mode to continuously detect the electron density in the D-region. It is difficult to obtain effective electron density observation data above 85 km, although the detection range of the MF radar is 50–100 km. The back-scattered signal is very weak, or even cannot be reflected, when the electron density is high at noon, according to the Fresnel reflection principle, which may cause the loss of radar observation data. It is also difficult to detect effective observation data below 65 km due to the lower electron density, which may lead to incorrect radar data. The quality of electron density data in the daytime is better than that at night because the electron density in the D-region is relatively small at night. Further, the detected data are not accurate enough, which is the main limitation of the current observation method of the MF radar in the DAE mode [36].
The height range of the electron density data analyzed in this paper is 60–90 km. The data of the low solar activity year from 1 August 2008 to 31 July 2009 were used for the analysis in the paper. The data are processed as follows. Firstly, the data at different local hours (24 h) on the same day were averaged bin to 24 h on each day. Secondly, the data at the same local hour on different days within a month were averaged. Thirdly, the data in Spring (March, April, and May), Summer (June, July, and August), Fall (September, October, and November), and Winter (December, January, and February) were averaged. Finally, the distribution of the electron density with height change and diurnal change was obtained.

3.3. Comparison with IRI and Observed Data

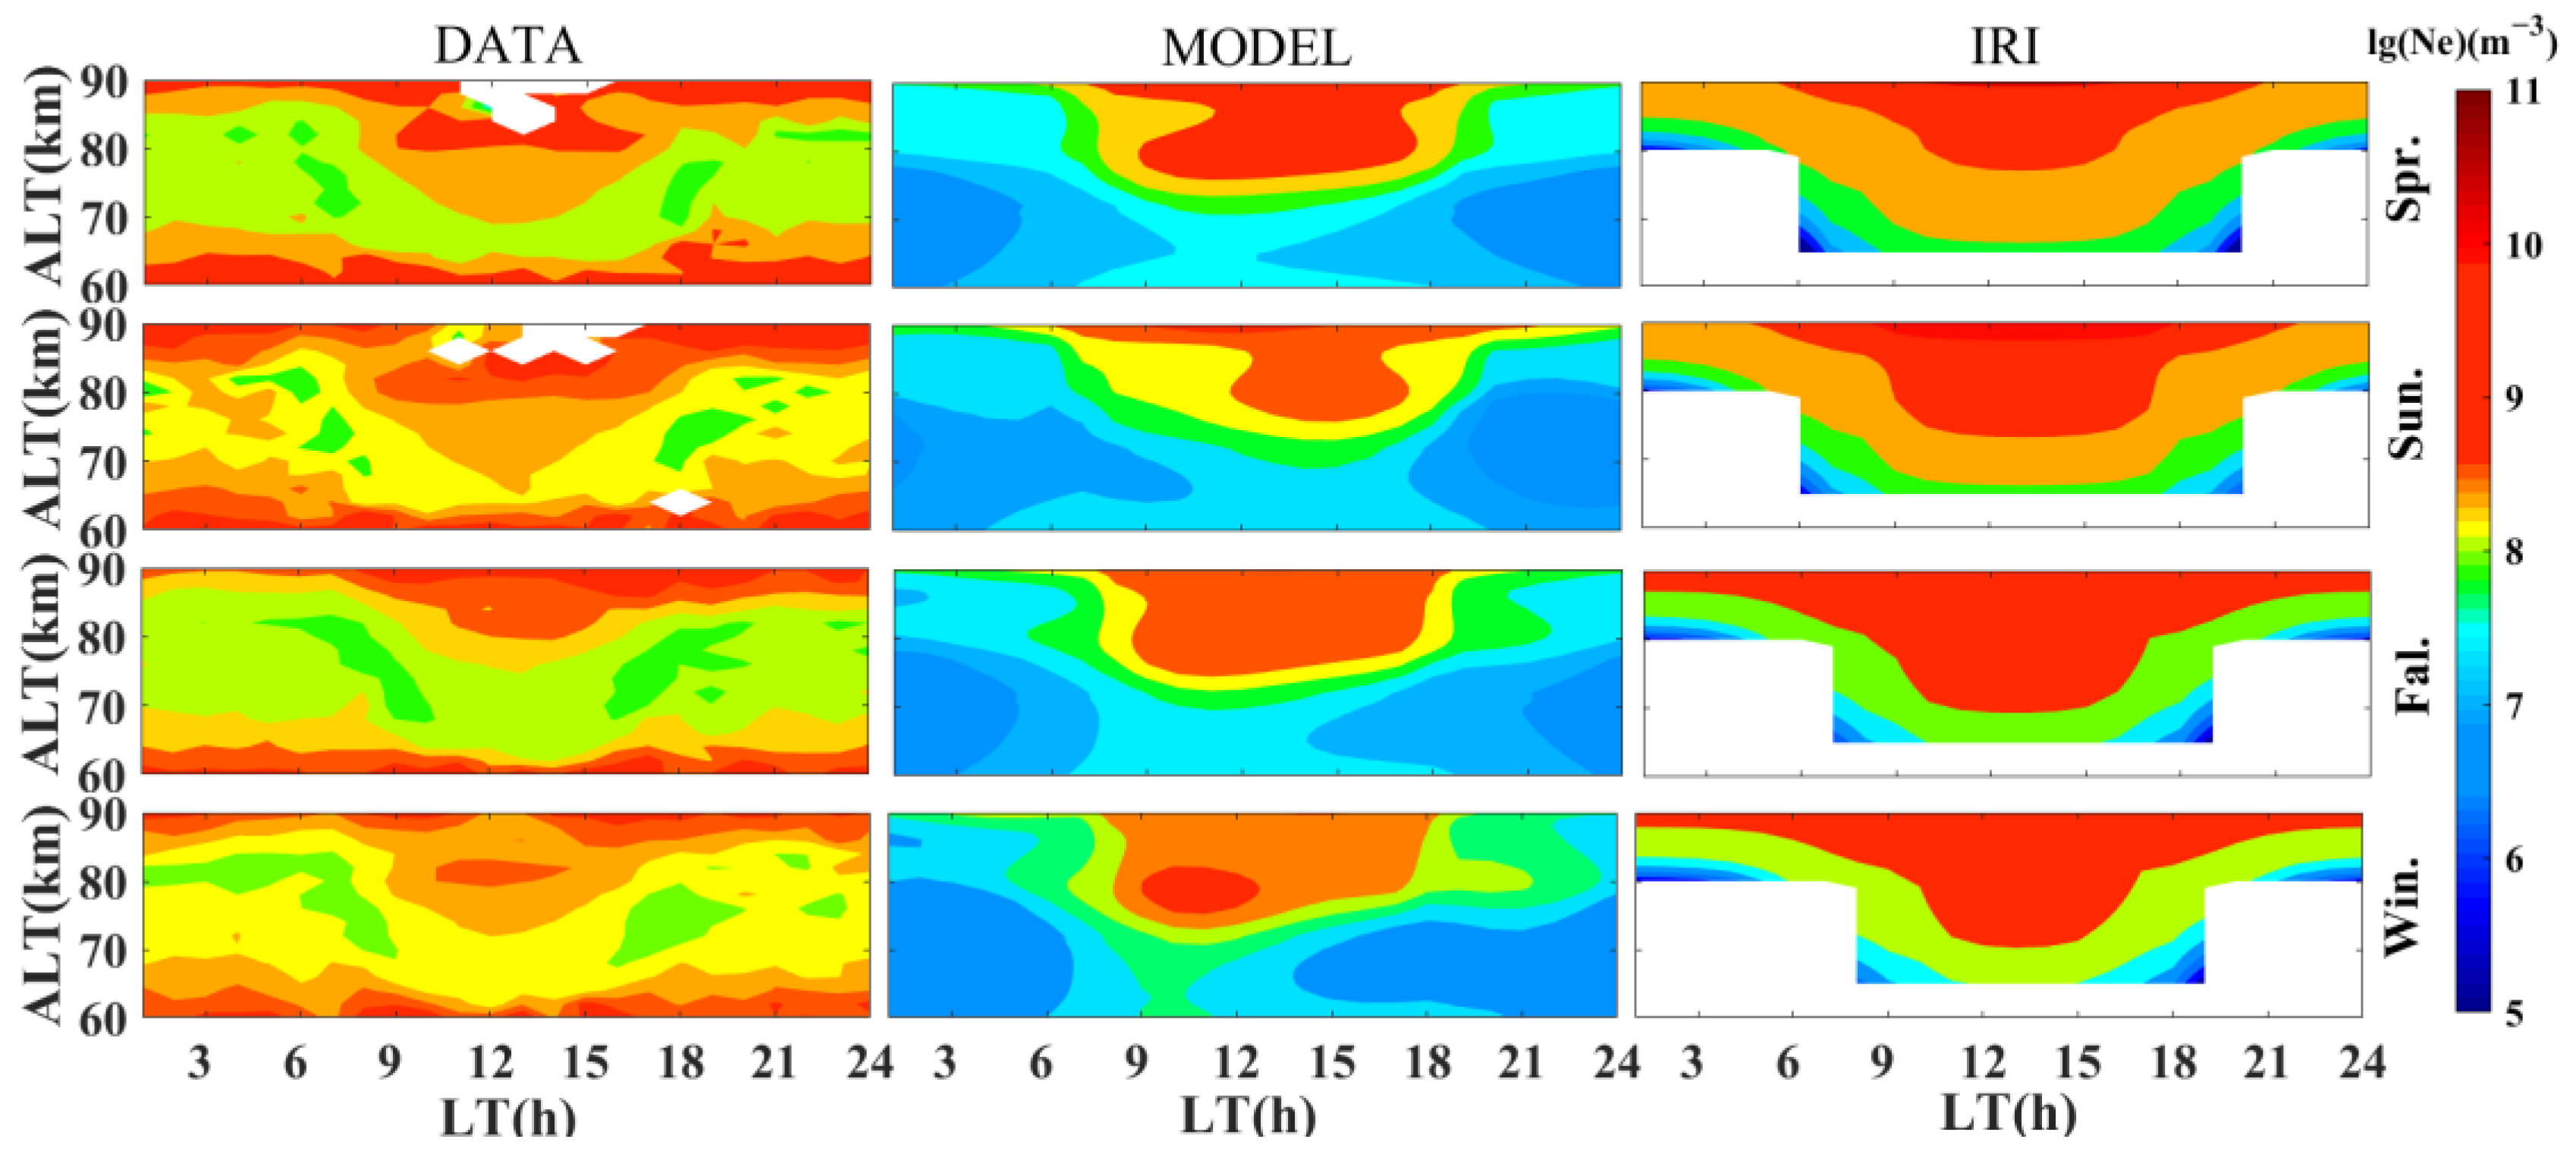
The physical model and IRI empirical model were analyzed in the same way as the MF radar data processing. Consequently, the diurnal variation of the electron density in Spring, Summer, Fall, and Winter in the low solar activity year (1 August 2008 to 31 July 2009) was obtained, as shown in Figure 8. It can be seen from the left column of Figure 8 that the data are vacant between 12:00 LT and 14:00 LT over 85 km in Spring and Summer. This is because the electron density is high at this height and time, thus the radar wave cannot be reflected after reaching this height, and the data below 65 km are large and inaccurate due to the offset absorption being very weak.
From the perspective of seasonal variation, Figure 8 shows that the average electron density from the radar data in Summer and Fall is slightly higher than that in Spring and Winter. The physical model shows that the average electron density in Spring and Fall is slightly higher than that in Summer and Winter, while the IRI in Spring and Summer is slightly higher than that in Fall and Winter, which is inconsistent with the radar data and the model. In addition, Figure 8 displays that the radar data and IRI present annual variation. However, the physical model presents semiannual variation, which may be due to the change in the solar zenith angle [17].
In terms of diurnal variation, the radar data and physical model have the same diurnal variation during the daytime, especially in the period 7:00–19:00 LT, but there are differences in magnitude. The electron density from IRI seems one order of magnitude higher than the radar data, and the radar data are half an order of magnitude higher than the physical model, especially below 75 km. They have the asymmetry of diurnal variation, and the electron density probably reaches its maximum at about 13:00 LT. It is of great importance to note that the physical model can accurately represent the state of the electron density in the night D-region, while the radar data and IRI cannot represent it well. In addition, the radar data and physical models make up for the lack of values below 65 km in the daytime and 80 km at night in IRI to some extent.
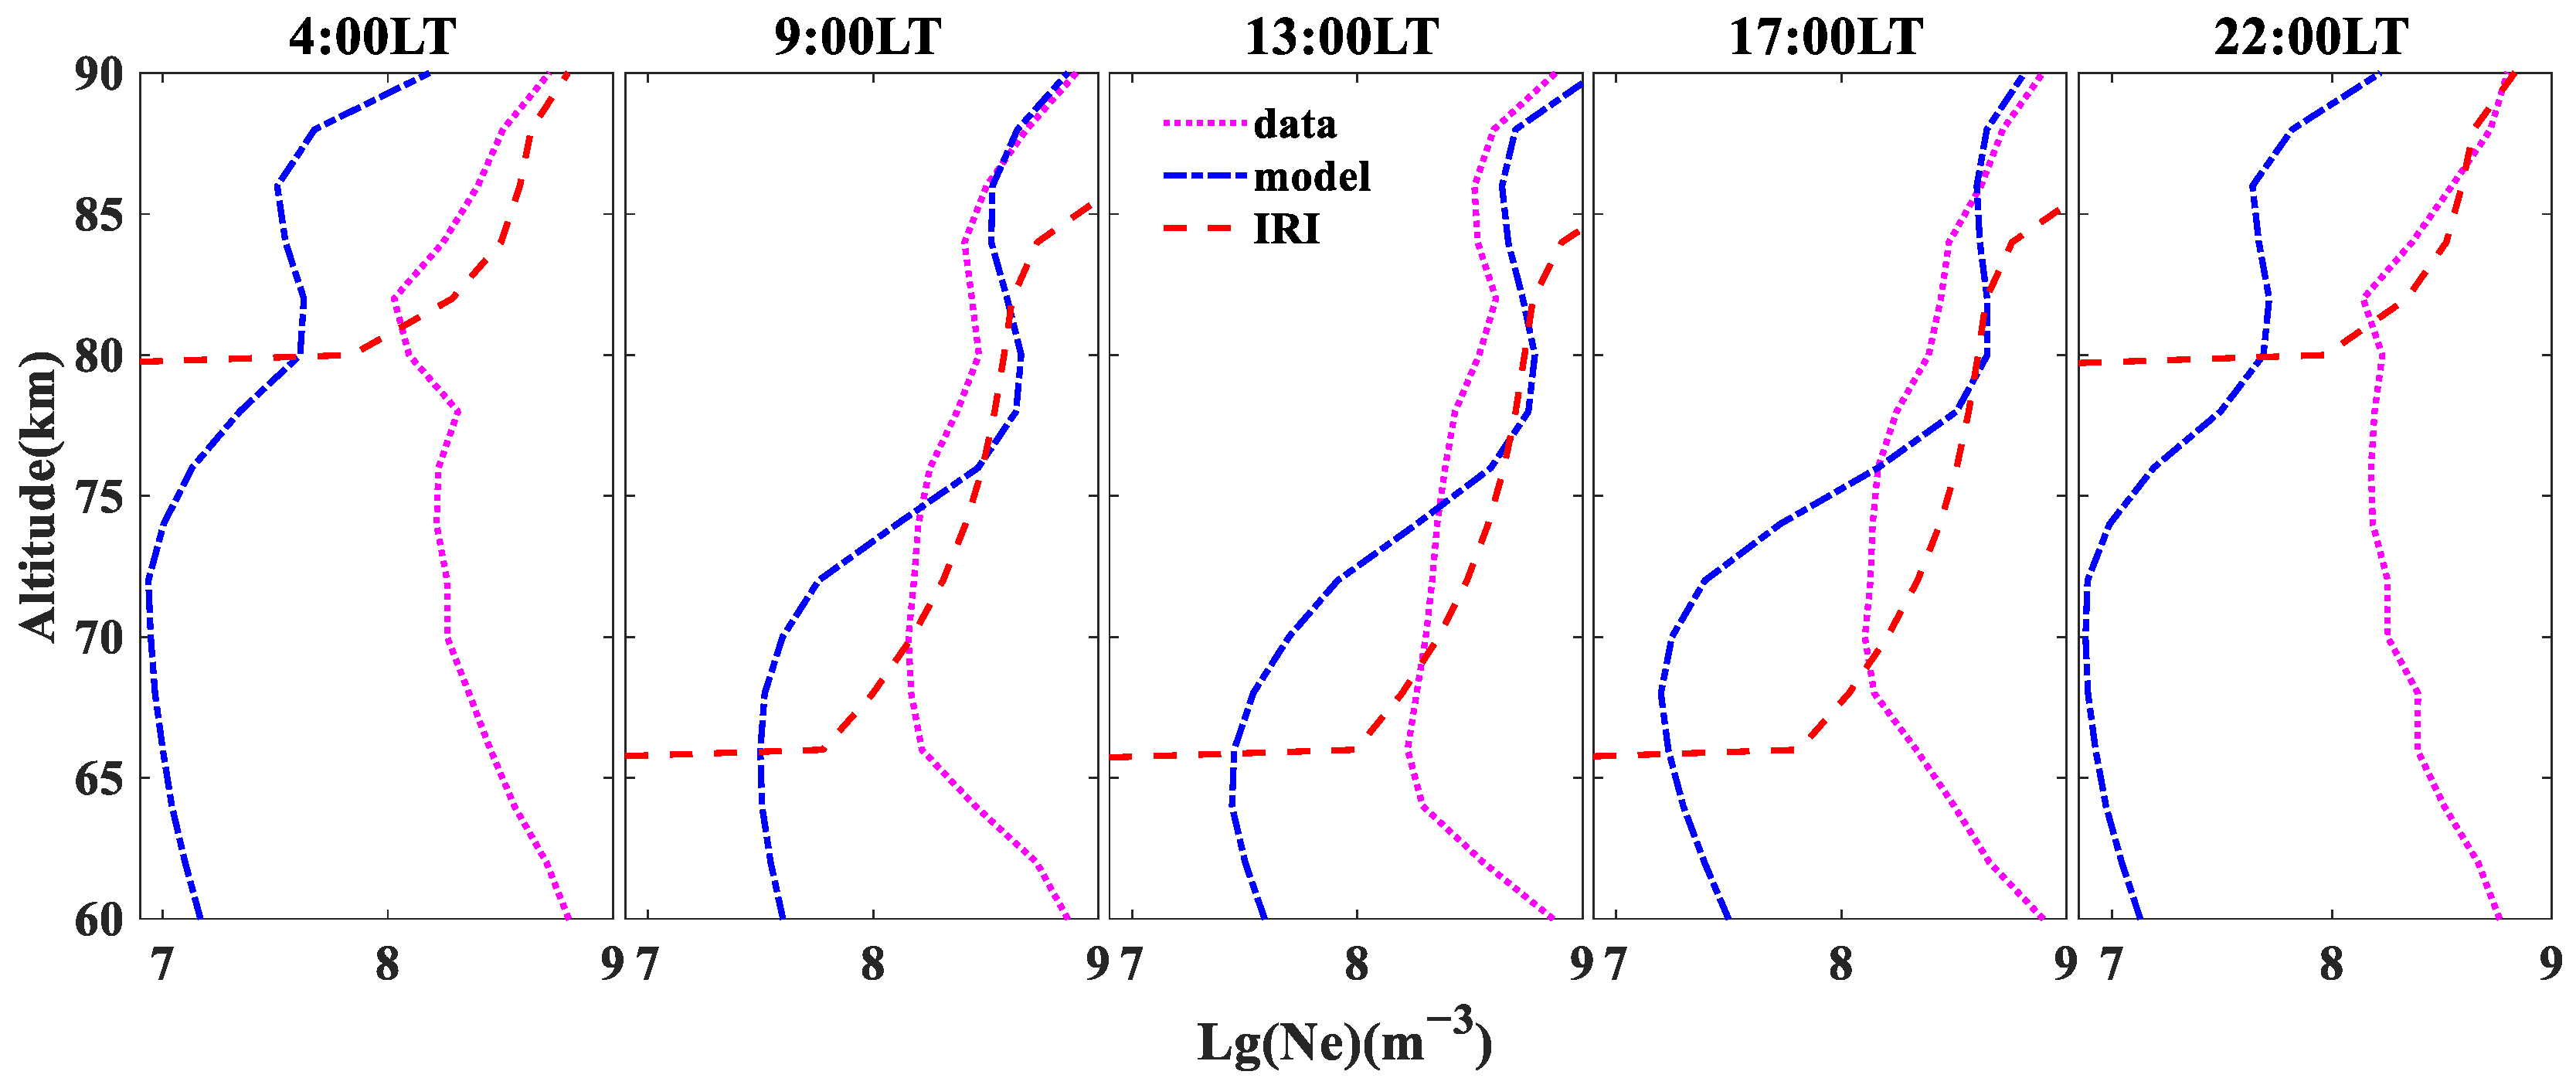
Figure 9 shows the changes in the electron density of the physical model, radar data, and IRI with the altitude at different times. It can be seen that the electron density from the radar data and IRI is about 108 m−3, which is one order of magnitude larger than the physical model at about 107 m−3 at 4:00 LT and 22:00 LT. The electron density detected by radar data over 80 km is close to the electron density calculated by IRI, which is about 5 × 10⁸ m−3, and both of them decrease with the decrease of the height. There are a lack of values below 80 km at night in IRI, but the electron density of the radar data with the value range 108–8.8 × 10⁸ m−3 decreases firstly and then increases with the decrease of the height at 9:00 LT, 13:00 LT, and 17:00 LT below 80 km. The electron density of the radar data increases gradually with the decrease of the altitude at 4:00 LT and 22:00 LT below 80 km. The electron density of the model is 107–108 m−3, which decreases firstly and then increases with the decrease of the height. In the daytime at 9:00 LT, 13:00 LT, and 17:00 LT, the physical model has an extreme value at about 80 km, and the radar data have a similar result at about 80 km at 9:00 LT and 13:00 LT, although not too obvious. The physical model has the minimum electron density for 66 km at 9:00 LT, 65 km at 13:00 LT, and 68 km at 17:00 LT, while the radar has it for 70 km at 9:00 LT, 66 km at 13:00 LT, and 70 km at 17:00 LT. The electron density of IRI decreases with the height, but there are a lack of values below 66 km.
Figure 9 shows that the electron density of the physical model rebounds below 75 km. Although the data below 65 km are inaccurate due to the factors of the radar itself, the electron density of the radar data also rebounds, similarly to the physical model. The possible reason is that the collision frequency increases gradually with an altitude below 75 km, which leads to the increase of the electron attachment reaction, negative ions, and hydrated positive ions, such as H+(H2O). However, the increment of negative ions is smaller than that of positive ions, which leads to the rise of the electron density. It seems that the C-region might exist, and similar results were obtained by VLF long-wave detection [37,38].
Figure 10 shows the variations over time of the minimum electron density corresponding to the height of the physical model, radar data, and IRI with local time. The height of the minimum electron density at night is almost without any change with local time. The height of the minimum electron density of the physical model is about 72 km at 0:00 LT–5:00 LT and 19:00 LT–24:00 LT, the radar data are about 81 km at 0:00 LT–6:00 LT and 21:00 LT–24:00 LT, and IRI is about 81 km at 0:00 LT–5:00 LT and 21:00 LT–24:00 LT. The height of the minimum electron density in the daytime decreases firstly and then increases with the local time, reducing the minimum at about 13:00 LT. The minimum value of the physical model occurs at about 65 km at 10:00 LT–15:00 LT, the minimum value of the radar data occurs at about 66 km at 12:00 LT–15:00 LT, and the minimum value of IRI occurs at about 66 km at 6:00 LT–20:00 LT. The results show that the minimum height of the D-region lower boundary in the low latitude is about 65 ± 1 km, and the height during the daytime is strongly correlated with the local time. Figure 9 and Figure 10 show that the D-region in the daytime is about 65–85 km. Similar results are obtained by VLF radar observation data [39]. The possible reasons are the D-region electron density is greatly affected by the solar zenith angle and mainly controlled by the photochemical process.
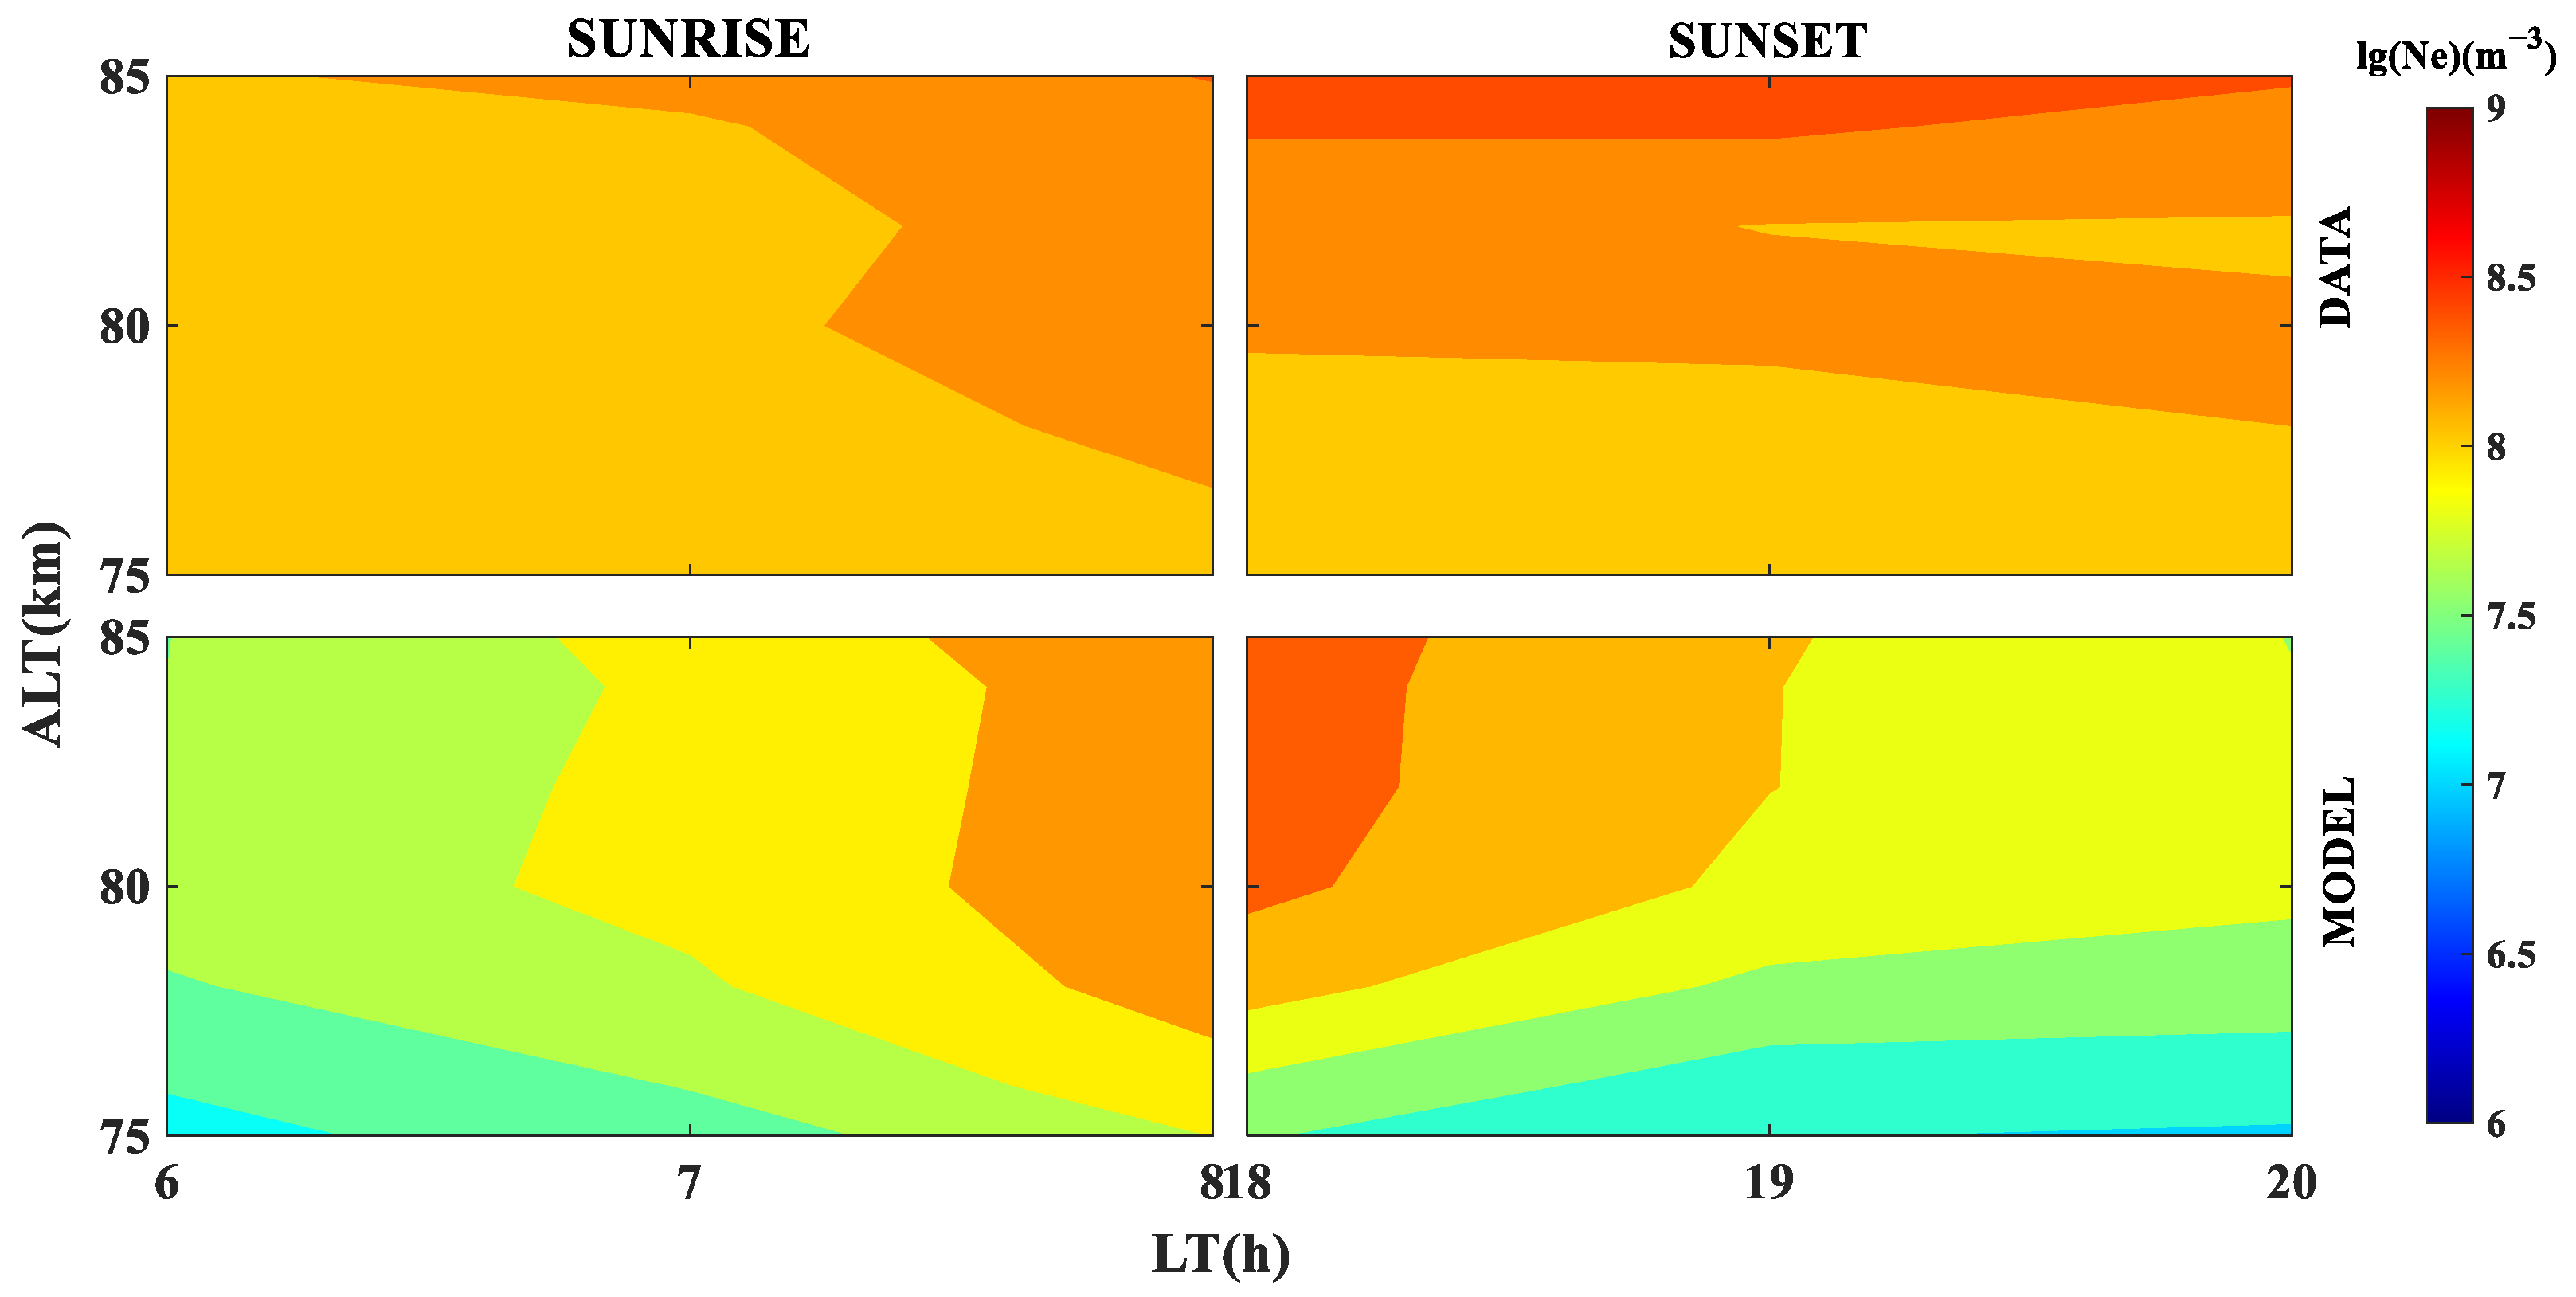
Figure 11 reveals the asymmetry between the measured electron density data and the model results for sunrise and sunset at 75–85 km. The asymmetry of the electron density means that the electron density is much higher at sunset than at sunrise. The electron density is significantly lower during sunrise when compared to sunset, as shown in the upper part of Figure 11. There is a relatively small difference in electron density during sunrise when the electron density gradually increases, as shown in the lower part of Figure 11. A possible explanation is a higher electron–ion recombination rate than the fading ionization rate during sunset. The recombination reactions are not fast enough to closely match the fading ionization rate during sunset, resulting in excess electron density [40]. At lower altitudes, electron attachment to neutrals and their detachment from negative ions play a significant role in the asymmetry, as well [41].

4. Summary and Discussion

A steady-state physical model of the D-region ionosphere is established under the condition of chemical equilibrium in the mid-low latitude in this paper. The model involves 145 ion chemical reactions, 23 positive ions, 11 negative ions, and electrons by solving the ion continuity equation. The simulation results show that molecular ions, such as NO+, NO+(H2O)n, H+(H2O)n, CO3, and O3, are the main components of ions in the D-region. The change of electron density during the day is obvious with the decrease in the latitude. The model better reflects the diurnal variation of the electron density in low-mid latitude. In the low latitude, the range of the D-region is about 64–85 km during the daytime and 72–85 km at night, and the lower boundary of the D-region changes with the local time.
In addition, the physical model is analyzed and verified by using the Kunming MF radar observation data and the IRI-2016 empirical model in the low solar activity year (1 August 2008 to 31 July 2009). The results show that the seasonal variation of the electron density of the physical model is inconsistent with the radar data and IRI model. However, the results of the radar data and models are generally consistent during the daytime. Moreover, the radar data and physical models have supplemented some data gaps of IRI to some extent. By comparing the results of the physical model with the data, it is found that the electron density at the bottom of the D-region (below 75 km) has rebounded, which implies that there might be an ionospheric C-layer. The results also show that the minimum height of the lower boundary of the D-region in the low latitude is about 65 ± 1 km, and the minimum height of the electron density during the day is strongly correlated with the local time. The asymmetry of the electron density is revealed, with higher electron density during sunset than during sunrise at 75–85 km, as the results of the model and data show.
This paper also shows that the established model has some limitations. The ion chemistry framework of the physical model and the input of neutral background components have an important influence on the calculation results. Compared with the SIC model with 400 ion reactions, although the model in this paper considers the ion chemical processes of most major components, its chemical framework still needs to be improved. Since NRLMSISE cannot provide all the neutral components required by the physical model, some of the neutral components in the model are set as fixed values, which does not accurately reflect the characteristics of local time and latitude and brings deviation to the calculation results. For example, there is a large electron density of around 80 km in winter, which may be caused by calculation errors. Because the model does not consider the effect of ionization sources, such as hard X-rays, on the D-region, to reduce its impact, this paper only uses radar data of low solar activity years for analysis. However, some data are missing due to the factors of the radar itself, resulting in inaccurate results, such as the inconsistent seasonal changes of the model and data. More observations and modeling will be conducted in the future to establish a more reliable D-region model.

Author Contributions

Conceptualization, T.X.; software, Y.H.; resources, S.S.; data curation, N.L.; writing–original draft, M.Z.; writing–review and editing, C.Z., S.G., Z.D., Y.Z. and X.L. All authors have read and agreed to the published version of the manuscript.

Funding

This study was funded by the Chinese Academy of Sciences Key Laboratory of Geospace Environment (Grants No. GE2020-01) and the National Natural Science Foundation of China (Grants No. 62201529).

Institutional Review Board Statement

Not applicable.

Informed Consent Statement

Not applicable.

Data Availability Statement

Not applicable.

Conflicts of Interest

The authors declare no conflict of interest.

References

  1. Djuth, F.T.; Sulzer, M.P.; Elder, J.H.; Wickwar, V.B. High-resolution studies of atmosphere-ionosphere coupling at Arecibo Observatory. Radio Sci. 1997, 32, 2321–2344. [Google Scholar] [CrossRef]
  2. Yi, W.; Reid, I.M.; Xue, X.; Younger, J.P.; Murphy, D.J.; Chen, T.; Dou, X. Response of neutral mesospheric density to geomagnetic forcing. Geophys. Res. Lett. 2017, 44, 8647–8655. [Google Scholar] [CrossRef] [Green Version]
  3. Pancheva, D.; Shiokawa, K.; Knizova, P.; Wan, W. Recent progress in the vertical coupling in the atmosphere-ionosphere system Preface. J. Atmos. Sol.-Terr. Phys. 2012, 90, V–VI. [Google Scholar] [CrossRef]
  4. Mitra, A.P. The D-region of the ionosphere. Adv. Space Res. 1978, 2, 12–21. [Google Scholar] [CrossRef]
  5. Kumar, A.; Kumar, S. Solar flare effects on D-region ionosphere using VLF measurements during low- and high-solar activity phases of solar cycle 24. Earth Planets Space 2018, 70, 29. [Google Scholar] [CrossRef]
  6. Mathews, J.D.; Breakall, J.K.; Ganguly, S. The measurement of diurnal variations of electron concentration in the 60–100 km ionosphere at Arecibo. J. Atmos. Terr. Phys. 1982, 44, 441–448. [Google Scholar] [CrossRef]
  7. Thomson, N.R.; Clilverd, M.A.; Rodger, C.J. Ionospheric D region VLF-measured electron densities compared with rocket-based FIRI-2018 model. J. Geophys. Res. Space Phys. 2022, 127, e2022JA030977. [Google Scholar] [CrossRef]
  8. Velásquez-García, L.; Izquierdo-Reyes, J.; Kim, H. Review of in-space plasma diagnostics for studying the Earth’s ionosphere. J. Phys. D Appl. Phys. 2022, 55, 263001. [Google Scholar] [CrossRef]
  9. Bilitza, D. Electron density in the D-region as given by the IRI. Int. Ref. Ionos.-IRI 1981, 79, 7–10. [Google Scholar]
  10. Singer, W.; Bemer, J.; Taubenheim, J. Improvement of the solar-cycle variation of IRI lower ionosphere models by means of radio wave propagation data. Adv. Space Res. 1984, 4, 79–88. [Google Scholar] [CrossRef]
  11. Mukhtarov, P.; Pancheva, D. Model of the electron density height profile in the lowest D-region. Adv. Space Res. 1995, 15, 179–182. [Google Scholar] [CrossRef]
  12. Danilov, A.; Rodevich, A.; Smirnova, N. Problems with incorporating a new D-region model into the IRI. Adv. Space Res. 1995, 15, 165–169. [Google Scholar] [CrossRef]
  13. Bilitza, D.; Altadill, D.; Truhlik, V.; Shubin, V.; Galkin, I.; Reinisch, B.; Huang, X. International Reference Ionosphere 2016: From ionosphere climate to real time weather predictions. Space Weather 2017, 15, 418–429. [Google Scholar] [CrossRef]
  14. Friedrich, M.; Pock, C.; Torkar, K. FIRI-2018, an updated empirical model of the lower ionosphere. J. Geophys. Res. Space Phys. 2018, 123, 6737–6751. [Google Scholar] [CrossRef]
  15. Gokov, A.M.; Tyrnov, O.F.; Buts, Y.V.; Kovalenko, E.N. Empirical modeling of variations of electron density in the undisturbed mid-latitude D-region of the ionosphere. Telecommun. Radio Eng. 2020, 79, 335–342. [Google Scholar] [CrossRef]
  16. McCormick, J.C.; Cohen, M.B.A. New Four-Parameter D-Region Ionospheric Model: Inferences from Lightning-Emitted VLF Signals. J. Geophy. Res. 2021, 126, e2021JA029849. [Google Scholar] [CrossRef]
  17. Thomson, N.R.; Clilverd, M.A.; Rodgers, C.J. Midlatitude ionospheric D region: Height, sharpness and solar zenith angle. J. Geophys. Res. 2017, 122, 8933–8946. [Google Scholar] [CrossRef] [Green Version]
  18. Pavlov, A.V. Photochemistry of ions at D-region altitudes of the ionosphere: A review. Surv. Geophys. 2013, 35, 259–334. [Google Scholar] [CrossRef]
  19. Torkar, K.M.; Friedrich, M. Tests of an ion-chemical model of the D-and lower E region. J. Atmos. Terr. Phys. 1983, 45, 369–385. [Google Scholar] [CrossRef]
  20. Tomko, A.A.; Ferraro, A.J.; Lee, H.S.; Mita, A.P. A theoretical model of D-region ion chemistry modifications during high power radio wave heating. J. Atmos. Terr. Phys. 1980, 42, 275–285. [Google Scholar] [CrossRef]
  21. Smimova, N.V.; Ogloblina, O.F.; Vlaskov, V.A. Modeling of the lower ionosphere. Pure Appl. Geophys. 1988, 127, 354–357. [Google Scholar]
  22. Verronen, P.T.; Andersson, M.E.; Marsh, D.R.; Kovács, T.; Plane, J.M. WACCM-D: Whole Atmosphere Community Climate Model with D-region ion chemistry. J. Adv. Model. Earth Syst. 2016, 8, 954–975. [Google Scholar] [CrossRef]
  23. Turunen, E.; Matveinen, H.; Tolvanen, J.; Ranta, H. D-region ion chemistry model. In STEP Handbook of Ionospheric Models; Utah State University: Logan, UT, USA, 1996; pp. 1–25. [Google Scholar]
  24. Sentman, D.D. Plasma chemistry of sprite streames. J. Geophys. Res. 2008, 113, D11112. [Google Scholar] [CrossRef]
  25. Kotovsky, D.A.; Moore, R.C. Photochemical response of the nighttime mesosphere to electric fieldheating—Recovery of electron density enhancements. Geophys. Res. Lett. 2016, 43, 952–960. [Google Scholar] [CrossRef]
  26. Megner, L.; Rapp, M.; Gumbel, J. Distribution of meteoric smoke—Sensitivity to microphysical properties and atmospheric conditions. Atmos. Chem. Phys. 2006, 6, 4415–4426. [Google Scholar] [CrossRef] [Green Version]
  27. Baumann, C.; Rapp, M.; Anttila, M.; Kero, A.; Verronen, P.T. Effects of meteoric smoke particles on the D region ion chemistry. J. Geophys. Res. Space Phys. 2015, 120, 10823–10839. [Google Scholar] [CrossRef] [Green Version]
  28. Nicolet, M. Aeronomical aspects of mesospheric photodissociation: Processes resulting from the solar H Lyman-alpha line. Planet Space Sci. 1985, 33, 69–80. [Google Scholar] [CrossRef]
  29. Strobel, D.F.; Young, T.R.; Meier, R.R.; Coffey, T.P.; Ali, A.W. The nighttime ionosphere: E region and lower F region. J. Geophys. Res. 1974, 79, 3171–3178. [Google Scholar] [CrossRef]
  30. Titherige, J.E. Modelling the peak of the ionospheric E-layer. J. Atmos. Solar-Terr. Phys. 2000, 62, 93–114. [Google Scholar] [CrossRef]
  31. Huba, J.D.; Joyce, G.; Fedder, J.A. Sami2 is Another Model of the Ionosphere (SAMI2): A new low-latitude ionosphere model. J. Geophys. Res. Space Phys. 2000, 105, 23035–23053. [Google Scholar] [CrossRef]
  32. Burns, C.J.; Turunen, E.; Matveinen, H.; Ranta, H.; Hargreaves, J.K. Chemical modeling of the quiet summer D- and E-regions using EISCAT electron density profiles. J. Atmos. Terr. Phys. 1991, 53, 115–134. [Google Scholar] [CrossRef]
  33. Albritton, D.J. Ion-neutral reaction-rate constants measured in flow reactors through 1977. At. Data Nucl. Data Tables 1978, 22, 1–101. [Google Scholar] [CrossRef]
  34. Emmert, J.T.; Drob, D.P.; Picone, J.M.; Siskind, D.E.; Jones, M., Jr.; Mlynczak, M.G.; Bernath, P.F.; Chu, X.; Doornbos, E.; Funke, B.; et al. NRLMSIS2.0: A whole-atmosphere empirical model of temperature and neutral species densities. Earth Space Sci. 2021, 8, e2020EA001321. [Google Scholar] [CrossRef]
  35. Richards, P.G.; Fennelly, J.A.; Torr, D.G. EUVAC: A solar EUV Flux Model for aeronomic calculations. J. Geophys. Res. Space Phys. 1994, 99, 8981–8992. [Google Scholar] [CrossRef]
  36. Muratama, Y.; Igarashi, K.; Rice, D.D. Medium frequency radars in Japan and Alaska for upper atmosphere observations. IEICS Trans. Commun. 2000, E83-B, 1996–2003. [Google Scholar]
  37. Yang, K.J. About layer C in ionospheric zone D. Chin. J. Geophys. 1986, 29, 1–7. (In Chinese) [Google Scholar]
  38. Thomson, N.R. Daytime tropical D region parameters from short path VLF phase and amplitude. J. Geophys. Res. 2010, 115, A09313. [Google Scholar] [CrossRef]
  39. Zhou, X.; Wang, J.Q.; Ma, Q.M.; Huang, Q.; Xiao, F. A method for determining D region ionosphere reflection height from lightning sky-waves. J. Atmos. Sol.-Terr. Phys. 2021, 221, 1364–6826. [Google Scholar] [CrossRef]
  40. Baumann, C.; Kero, A.; Raizada, S.; Rapp, M.; Sulzer, M.P.; Verronen, P.T.; Vierinen, J. Arecibo Measurements of D-Region Electron Densities during Sunset and Sunrise in August 2016 [dataset]. Ann. Geophys. Discuss. 2022, 40, pp. 519–530. [CrossRef]
  41. Baumann, C.; Kero, A.; Raizada, S.; Rapp, M.; Sulzer, M.P.; Verronen, P.T.; Vierinen, J. Arecibo measurements of D-region electron densities during sunset and sunrise: Implications for atmospheric composition. Ann. Geophys. Discuss. 2022, 1–17. [Google Scholar] [CrossRef]
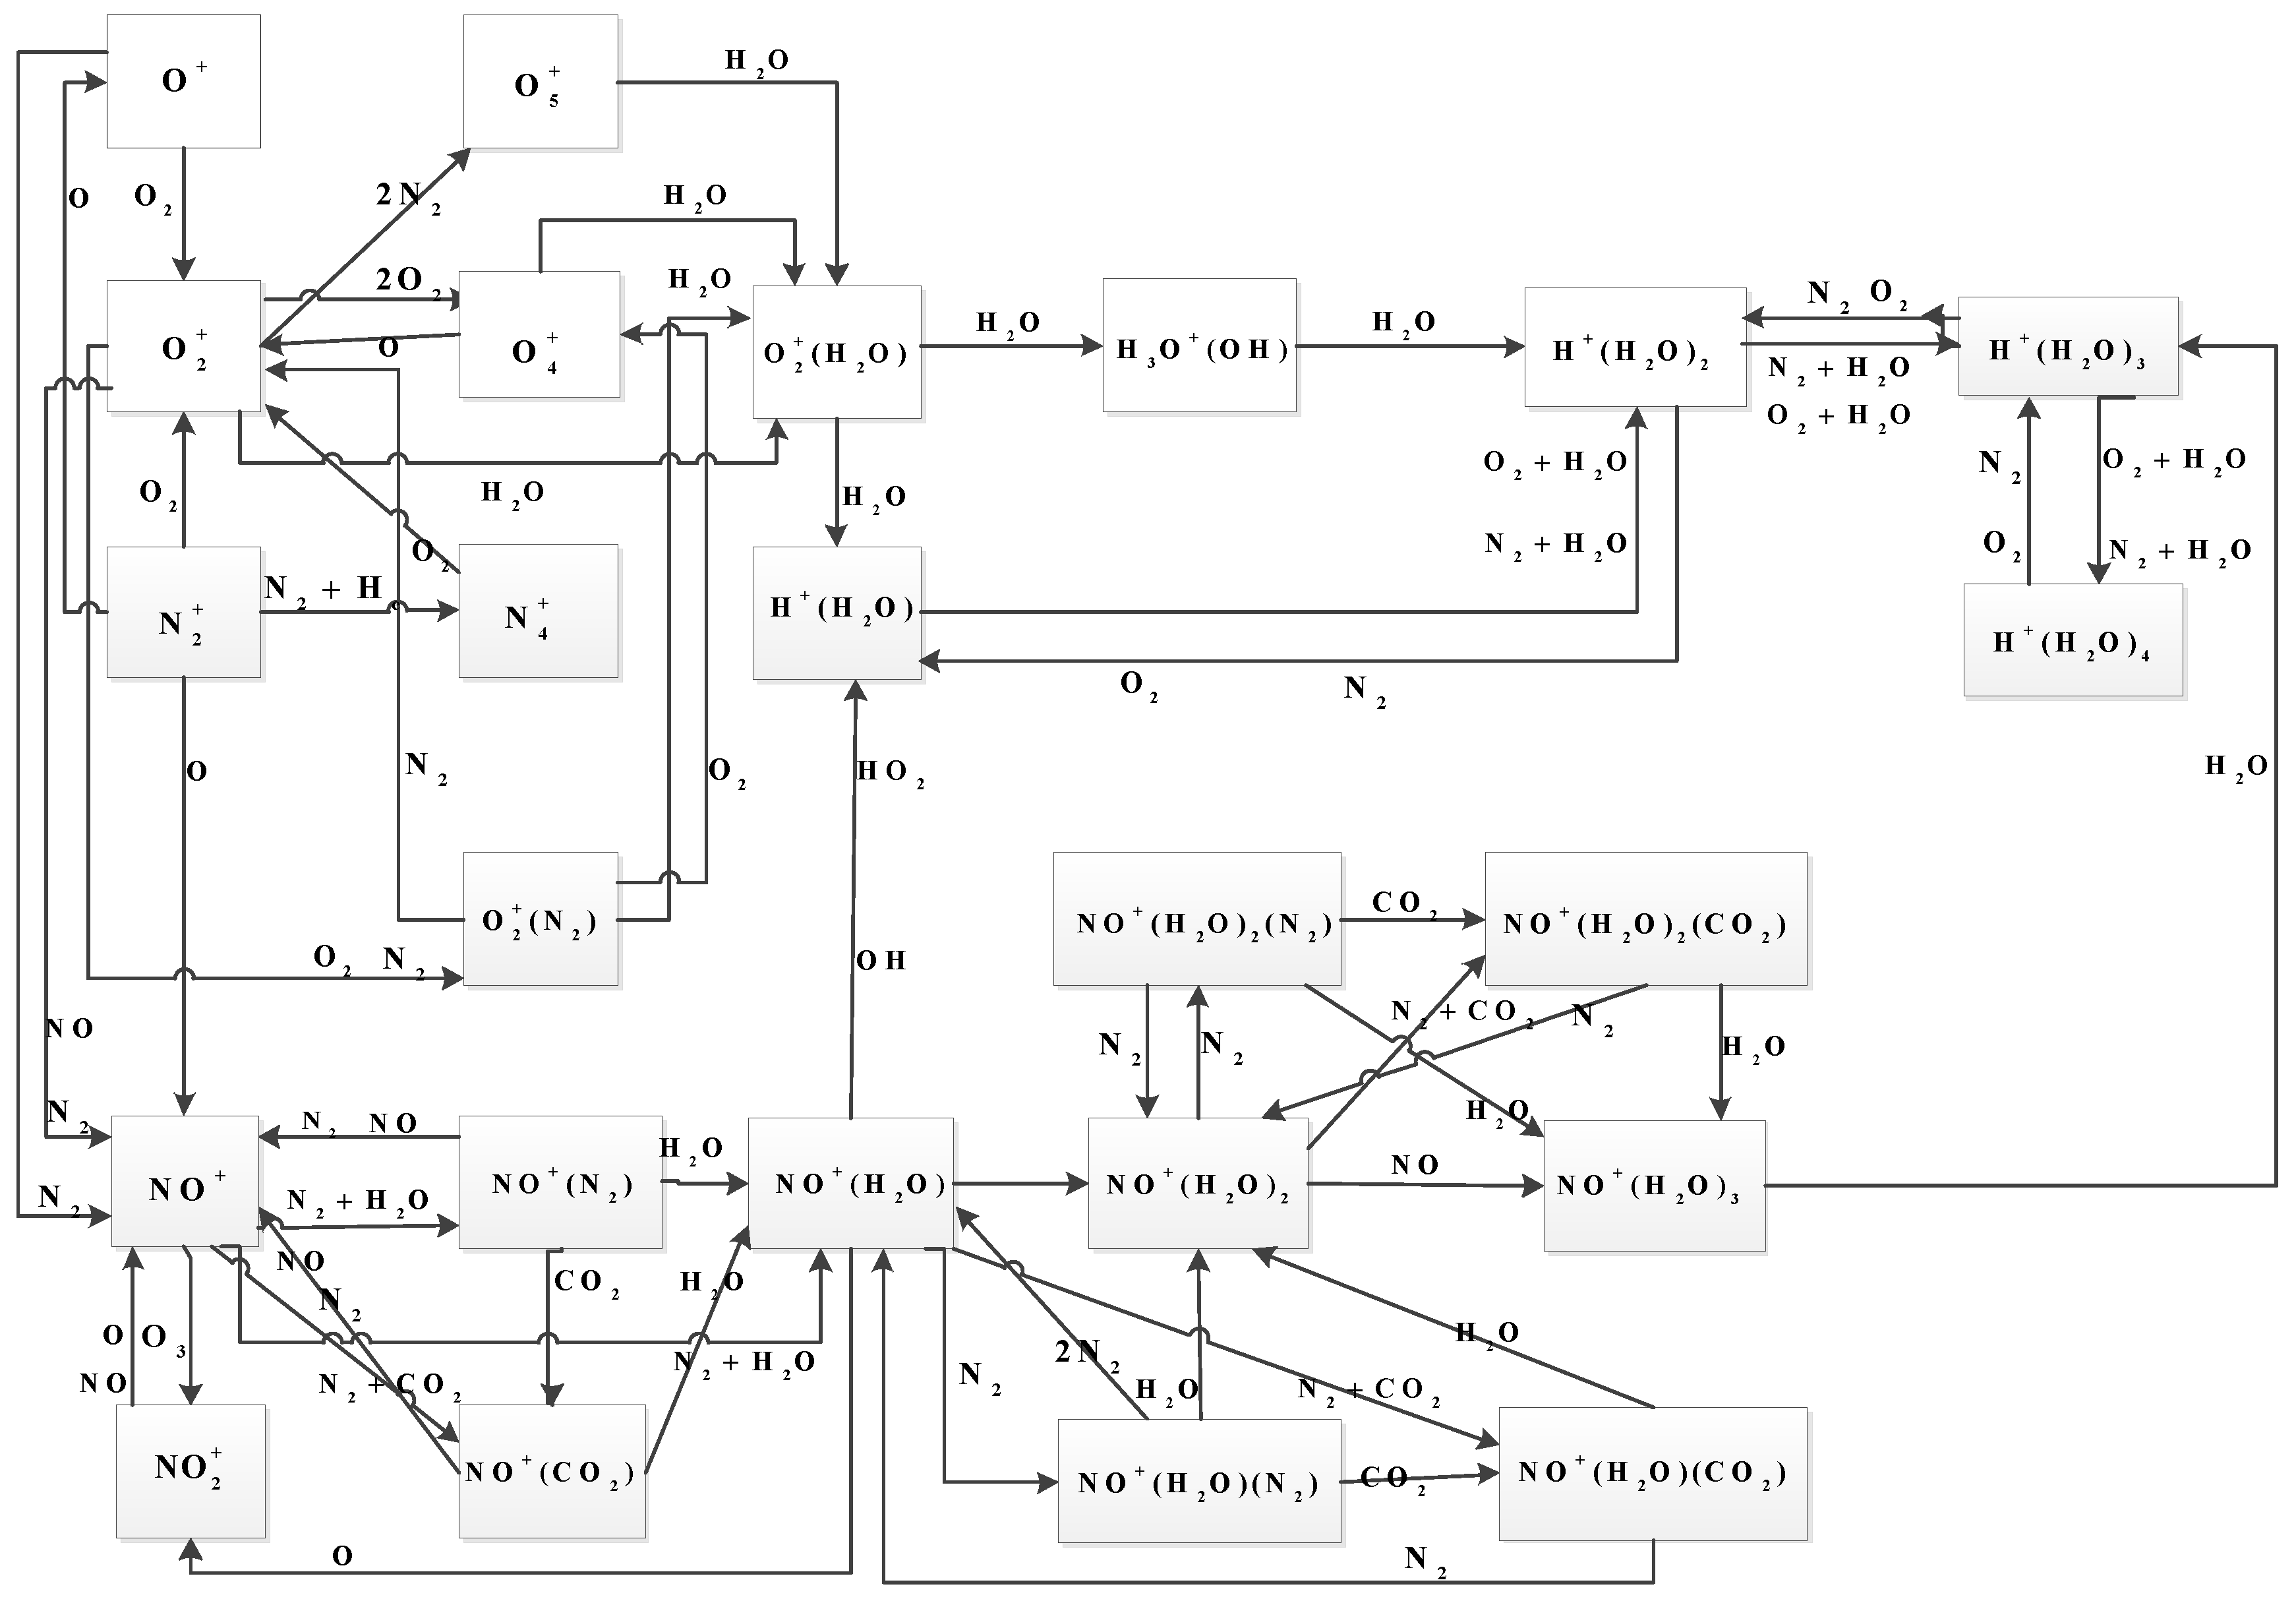
Figure 1. Main positive ion reaction scheme.
Atmosphere 14 00235 g001
Figure 2. Main negative ion reaction scheme.
Atmosphere 14 00235 g002
Figure 3. Distribution of positive ions, total positive ions, and electrons at 12:00 LT.
Atmosphere 14 00235 g003
Figure 4. Distribution of negative ions, total negative ions, and electrons at 12:00 LT.
Atmosphere 14 00235 g004
Figure 5. The variation of the electron density of the model with the local time in 2009 at different latitudes (5° N, 25° N, and 45° N) in the mid-low latitude region.
Atmosphere 14 00235 g005
Figure 6. The electron density of the physical model varies with the altitude at 4:00 LT, 9:00 LT, 13:00 LT, 17:00 LT, and 22:00 LT in the mid-low latitude region (5° N, 25° N, and 45° N).
Atmosphere 14 00235 g006
Figure 7. The height of the minimum electron density of the physical model varies with the local time in the mid-low latitude region (5° N, 25° N, and 45° N).
Atmosphere 14 00235 g007
Figure 8. Daily variation of the electron density of the model, IRI, and data in the low solar activity year.
Atmosphere 14 00235 g008
Figure 9. The electron density of the physical model, radar data, and IRI varies with the altitude at 4:00 LT, 9:00 LT, 13:00 LT, 17:00 LT, and 22:00 LT.
Atmosphere 14 00235 g009
Figure 10. The height of the minimum electron density of the physical model, radar data, and IRI varies with the local time.
Atmosphere 14 00235 g010
Figure 11. Comparison of the asymmetry of the measured electron densities with model results for sunrise (left) and sunset (right) at 75–85 km altitude.
Atmosphere 14 00235 g011
Disclaimer/Publisher’s Note: The statements, opinions and data contained in all publications are solely those of the individual author(s) and contributor(s) and not of MDPI and/or the editor(s). MDPI and/or the editor(s) disclaim responsibility for any injury to people or property resulting from any ideas, methods, instructions or products referred to in the content.