Article

Effect of Compost Derived from Urban Waste on Chard (Beta vulgaris L., var cycla) Yield and Soil GHG Fluxes in a Mediterranean Agricultural System

1
Dipartimento di Scienze e Tecnologie Ambientali, Biologiche e Farmaceutiche, Università degli Studi della Campania Luigi Vanvitelli, 8100 Caserta, Italy
2
Istituto di Ricerca sugli Ecosistemi Terrestri, Consiglio Nazionale delle Ricerche (CNR), 80128 Napoli, Italy
3
Dipartimento per la Innovazione nei Sistemi Biologici, Agroalimentari e Forestali, Università degli Studi della Tuscia, 01100 Viterbo, Italy
*
Author to whom correspondence should be addressed.
Atmosphere 2023, 14(2), 246; https://doi.org/10.3390/atmos14020246
Submission received: 13 November 2022 / Revised: 20 January 2023 / Accepted: 21 January 2023 / Published: 26 January 2023
(This article belongs to the Special Issue Greenhouse Gas Emissions from Agricultural Activities)

Abstract

:
The use of recycled materials as soil amendments and fertilizers is an important priority in the agronomic sector to valorize waste from a circular economic perspective and reduce waste disposal, reduce dependence on external inputs, and provide better climate change mitigation options. In this study, we evaluated the agroecological performance of compost derived from recycled organic matrices of urban waste (mixed composted amendment, MCA) of the metropolitan area of Rome. MCA is available in big quantities and might represent an interesting option to substitute conventional mineral nitrogen fertilizer (CF). The effect of MCA, CF, and a combination of both (MIX 1:1) was tested on crop yield and greenhouse gas emissions in a field trial on a common Mediterranean crop (Swiss chart, one season, two crop cycles). The MCA effect on crop yield was positive and comparable to CF and MIX treatments, while MCA treatment showed the lower soil mineral nitrogen (N) content. GHG emissions in the MCA treatment were comparable to those observed in CF and MIX, being overall quite low. The soil acted as a weak net CH4 sink in all treatments (−12.6 ± 6.1 μg CH4 m−2 h−1); no differences in CO2 emissions between MCA and CF or MIX treatments were observed (range 0.1−0.2 g m−2 h−1). The N2O emission intensity of MCA was slightly lower than MIX and CF treatments (0.09, 0.011, and 0.011 g N2O kg−1 crop dry weight, respectively). Overall, MCA seemed a valid alternative to CF for the tested agro-environmental indicators in the spring/summer Mediterranean conditions.

1. Introduction

Agriculture and waste management are two relevant anthropic sources of greenhouse gases (GHGs) [1,2,3,4,5]. Valorization of waste to provide recycled material to be used as a soil amendment for cultivation might respond to the growing need for smart circular economy solutions, might reduce agriculture dependence on external inputs, might reduce waste disposal, and provide better climate change mitigation options [6]. Compost from various feedstocks has proven to have positive effects on soil organic matter and crop yield [6]. Bio-waste, mainly food and garden waste and urban sewage sludge (SS), has a high potential for contributing to a circular economy through the production of high-quality fertilizers and biogas [7,8]. SS can be composted with different organic waste [9,10] in full-scale plants to generate amendments that are applied to the soil for agricultural purposes, regulated in Italy by the National Decree 75/2010. Sewage sludge composted amendment (SSCA) might have a significant potential to improve crop productivity and quality [11,12], as well as soil properties, microbial activity, and composition [13] in the Mediterranean environment.
The agricultural sector will have a critical role in the attainment of the EU 2050 climate neutrality target, and this represents one of the key objectives of the new European Farm to Fork strategy at the core of the European Green Deal. It is of fundamental importance to demonstrate that alternative soil amendments derived from waste valorization might have a similar or better emission intensity (emissions of GHG per unit of the produced crop) compared with conventional synthetic fertilizers. Due to the high variety of waste materials and application conditions, less information is available on GHG factors from specific waste recycled materials, in particular, under Mediterranean climate conditions [5,6,14,15], than for GHG emissions from mineral fertilizers and more traditional organic fertilizers, such as green compost or manure from temperate and tropical areas [16,17,18,19].
Looking at potential alternative fertilizer sources based on waste valorization, a huge opportunity is offered by recycled organic material from urban waste produced in the metropolitan area of Rome, counting more than four million inhabitants, which is processed by the company Acea Ambiente (www.gruppo.acea.it, accessed on 11 November 2022) together with waste material coming from minor municipalities of Lazio, Umbria, and Tuscany regions, with a yearly production of compost around 28 thousands of tons (27,774 tons in 2021). This product might represent a continuous source of amendment for agricultural soils of the area. We hypothesize that the mixed composted amendment (MCA) could be used as an alternative amendment to conventional fertilizer (CF), valuing the waste material and reducing dependence on external products. Therefore, the first objective of our experimental study was to observe the effect of MCA on the yield of a Mediterranean crop (Beta vulgaris L. var. cycla), and secondly, to demonstrate that GHG emissions were comparable to, or even lower than, those of the CF.

2. Materials and Methods

2.1. Experimental Set Up and Location

In this experiment we assessed the agri-environmental performance of MCA, comparing it with an equivalent application of CF on available nitrogen (N) mass basis, and with a combined mixture (MIX) of MCA and CF (1:1). A control (C) was also set without any form of added fertilizer. Firstly, we analyzed the yield of the test crop to evaluate the agronomic performance of the substrates. Secondly, to test the impact on climate change mitigation, we estimated the soil GHG fluxes. Additionally, we measured the concentration of extractable mineral N in the soil during the experimental period, as this is directly related to the risk of N losses by leaching and indirect N2O emissions.
The four treatments (C, CF, MCA, and MIX) were tested in an experimental agricultural area located in the same region where MCA was produced (Latium, Viterbo, Italy, 42.420325,12.075610, 310 m a.s.l.), in the experimental farm of the University of Tuscia. The soil is a clay loam classified as Typic Xerofluvent [20] or Dystric Fluvisol [21], with pH 7.8, organic carbon content of 1.18%, total N of 0.12%, and cation exchange capacity of 27.37 meq/100 g (soil dry weight). The soil bulk density was, on average, 0.95 ± 0.06 g cm−3 (data referring to 20 cm topsoil). The area is characterized by a typical Mediterranean climate, with warm-dry summers and cool-moist winters. Historical climatic data show a mean annual rainfall of 752 mm, mostly concentrated between October and May, and a mean annual temperature of 14 °C, with the lowest mean monthly temperature of 1.6 °C in January and the highest mean monthly temperature of 30.8 °C in August (data from Vetralla meteo station, https://www.siarl-lazio.it/E2_1.asp, accessed on 20 December 2022).

2.2. Test Crop

The test crop, Swiss chard (Beta vulgaris L., var cycla), is an important horticultural crop distributed worldwide, covering in Italy approximately an annual average of 5500 ha, generating an important income for farmers [22]. The Swiss chard is a crop with a spring-summer cycle and represents a typical irrigated horticultural crop. Swiss chard is typically harvested twice during its cropping cycle by cutting the above-ground biomass a few centimeters above soil level and letting new leaves resprout for the second growth cycle.
For this experiment, the Swiss chard (Olter sementi, Milan, Italy) was sown, on the 15 May 2013, in straight lines, with 25 cm of space between rows and 5 cm between plants in the same row (crop density of 60 plants per m2). The plots received drip irrigation almost on a daily basis. Harvesting occurred on 2 July and 24 July 2013, i.e., 48 and 70 days after seeding. Fertilization was applied one day after seeding, on the 14 May 2013and no further fertilization occurred between the two harvesting cycles. For fertilization purposes, we provided about 75 kg N/ha to the crop, which represents the recommended dose in the study area (Latium region) for Swiss chard.

2.3. Experimental Design and Soil Treatments

The soil of the experimental area (½ hectare) was tilled on the 12 April 2013and then divided into 16 plots of 12 m2 each, separated by two meter-wide corridors to minimize plot disturbance during GHG sampling and land management practices. For this study, four different treatments were tested on the Swiss chard crop, each done on four replicates (12 m2 plots each). The four treatments applied to the soil included: 4 control plots (C) which received no fertilizer; 4 plots that received conventional fertilization (CF) of 75 kg N ha−1 of synthetic fertilizer as NPK (Start UP NPK 15-8-15 + 2 MgO + 25 SO3, ammonium, and urea 50%–50%, Agripoint, Latina, Italy); 4 plots which received 35 tons of MCA ha−1; 4 plots which received half doses of both NPK and MCA compost (MIX). The 16 plots were randomly allocated to the four treatments. Mineral fertilizer and MCA were incorporated into the soil by harrowing.
The certified urban waste and sewage sludge compost (MCA) was provided by the company Acea Ambiente (Rome, Italy) and was certified for chemical, physical, and biological characteristics suitable for agricultural use, according to the Italian law, Decree no. 75/2010. The same characteristics of the tested MCA are provided in Table 1. The amount of MCA added to the soil, 35 tons ha−1 is a quantity of organic fertilizer generally used in the area for this type of crop. Based on mineralization kinetics, measured in preliminary laboratory incubations at 30 °C and 20 °C in Tuscia labs, it was calculated that 75 kg N/ha of mineralizable cumulative N [23,24] could be reached in approximately 90–100 days after application, considering the average between the two tested temperatures (20° and 30 °C,). The N mineralization curves leveled around 120–122 days of incubation, reaching an average cumulative mineral N value of 83.7 kg N/ha, about 10% of the total N content of MCA compost (Table 1).

2.4. Field Sampling and Determination of GHG Soil-Atmosphere Exchange

Soil GHG fluxes were measured 1 day before the fertilization event, thereafter the soil-atmosphere gas exchange was measured with high frequency immediately after the fertilizer was added to the soil, progressively increasing the time sampling interval up to 7 days. This allowed us to define the shape of the N2O emission curve, which typically has a big emission peak that develops within the first 7–10 days after fertilization, followed by an exponentially decreasing trend of emissions that fades away in 3–4 weeks. Overall GHG fluxes were measured 14 times between 13 May 2013 and 25 July 2013.
To measure the soil-atmosphere gas exchange, two different analytical procedures were used for CO2 fluxes and N2O and CH4 fluxes.
Soil CO2 fluxes were measured in the field using an infrared gas analyzer coupled with a closed dynamic chamber (pp system, UK) [25]. The dynamic chamber was placed, at the moment of sampling, on high-density polyvinyl chloride collars (7 cm diameter, 10 cm depth), which were inserted, at the beginning of the experiment, into the soil down to 5 cm depth. Three collars for each plot were used, for a total of 12 collars per treatment and 48 collars for each sampling event.
N2O and CH4 fluxes were determined using closed static chambers (20 cm high × 15 cm in diameter) made of high-density polyvinyl chloride, which was placed on bases (7 cm high × 15 cm in diameter, 5 cm depth) [26] inserted in the soil down to 5 cm depth for the whole duration of the experiment. Two bases for each plot were used, for a total of 8 chambers per treatment and 32 chambers for each sampling event. To estimate the gas accumulation over time in each chamber, three gas samples (time 0, 30, and 60 min) were taken from each chamber through a gas sampling port provided with a three-way stopcock, and the gas was stored in 20 mL pre-evacuated air-tight vials. The concentrations of N2O and CH4 were determined, within a couple of days from sampling, by gas chromatography (Trace GC Ultra—Thermo Scientific, Milan, Italy) using a flame ionization detector (FID) and an electron capture detector (ECD). The gas chromatograph was provided with front-flush and back-flush systems that allowed the measurement of both N2O and CH4 on the same gas sample (3 mL), as described in Castaldi et al. 2013 [26]. Columns were filled with Porapak 80–100 Q and maintained at 60 °C. Pure nitrogen (purity grade 5.5) was used as the carrier gas. Calibrated standards (4 concentrations, Air Liquide Italia) were injected in duplicate every 20 samples to allow for instrumental drifting. Flux rates were determined via linear regression of the three sampling points for each chamber and by applying a temperature and pressure correction. GHG flux samplings were generally done between 8 and 10 a.m. Soil temperature (HI93510 thermometer, Hanna Instruments Canada Inc., Laval, QC, Canada) and volumetric soil water content (ThetaProbe ML2, Delta-T Device Ltd., Cambridge, UK) were measured (0–5 cm depth) 5 cm from the chamber edge, at each sampling date. Soil water content was also expressed as water-filled pore space % (WFPS) equal to 100 × θv)/ε, where θv is the volumetric water content measured with the ThetaProbe, and ε is the total porosity (ε = 1 − bulk density/particle density). WFPS% is often used to evaluate the effect of soil water content on gas fluxes as it is directly related to gas diffusivity through soil pores. A particle density value of 2.6 g cm−3 was used for the studied soil.
GHG fluxes were represented as hourly rates of gas emission (or CH4 uptake) or as cumulative gas emissions, obtained by summing the hourly flux rates measured over the 13 sampling events after fertilization and expressing them per unit of land area (m−2). Concerning N2O fluxes, we calculated the N2O fertilizer-induced emission (FIE) as the difference between the cumulative N2O flux in the plots treated with fertilizer and the cumulative N2O flux in the control plots, with the latter considered the baseline value of N2O emissions. By diving the values of FIE for the amount of added or available N fertilizer, we then obtained the N2O-N emission factors (EF) for the analyzed fertilizers (EF = kg N − N2O/ kg N added). Another indicator used to estimate the climate sustainability of the specific management/fertilizer was the N2O emission intensity (EI) of the crop production, i.e., the total amount of direct N2O emitted in each treatment expressed per unit of crop produced, both referred to the same surface unit (hectare).

2.5. Soil Available Mineral N and Plant Biomass Analyses

Fresh soil was sampled once a week (10 cm depth cores), starting from one week after fertilization, to determine the concentration of soil available mineral N. Three sub-samples were taken from each plot to provide one composite sample per plot (4 soil composite replicates per treatment). Fresh soil was first sieved (2 mm mesh sieve) and then available NH4+ and NO3 were immediately extracted by shaking 20 g of soil with a solution of 0.5 M K2SO4 (1:5) for one hour on a rotary shaker. Then the extracts were filtered with Whatman 42 paper, and NH4+ and NO3 concentrations were measured by potentiometric analysis using ion-selective electrodes for NH4+ (ORION, Model 95–12) and NO3 (ORION, Model 97–07), connected to a portable pH/ISE-meter (ORION, Model 290A) [25].
The crop yield of the whole plant was measured at the end of each growth cycle. In each plot, whole chard plants (roots included) were sampled in a sub-portion (1 m2) of the plot where no chamber was placed to avoid interference with gas sampling by soil compression or disturbance. In the remaining part of the field, the harvest was obtained by cutting the above-ground biomass to allow the plants to resprout for a second harvesting cycle. Sampled plants were rinsed with tap water to remove soil residuals and then roots and shoots were separated and oven-dried at 105 °C for 3 days to quantify their dry weight.

2.6. Statistical Analyses

A one-way analysis of variance was used to compare the 4 treatments for each sampling date separately for all the analyzed variables. A normality test (Kolmogorov-Smirnov, with Lilliefors correction) was performed before running parametric tests (software Sigma Plot 14.0, Jandel Scientific). When the difference was significant (p < 0.05), an “all pairwise” comparison was carried out using the “Student–Newman–Keuls test”.

3. Results

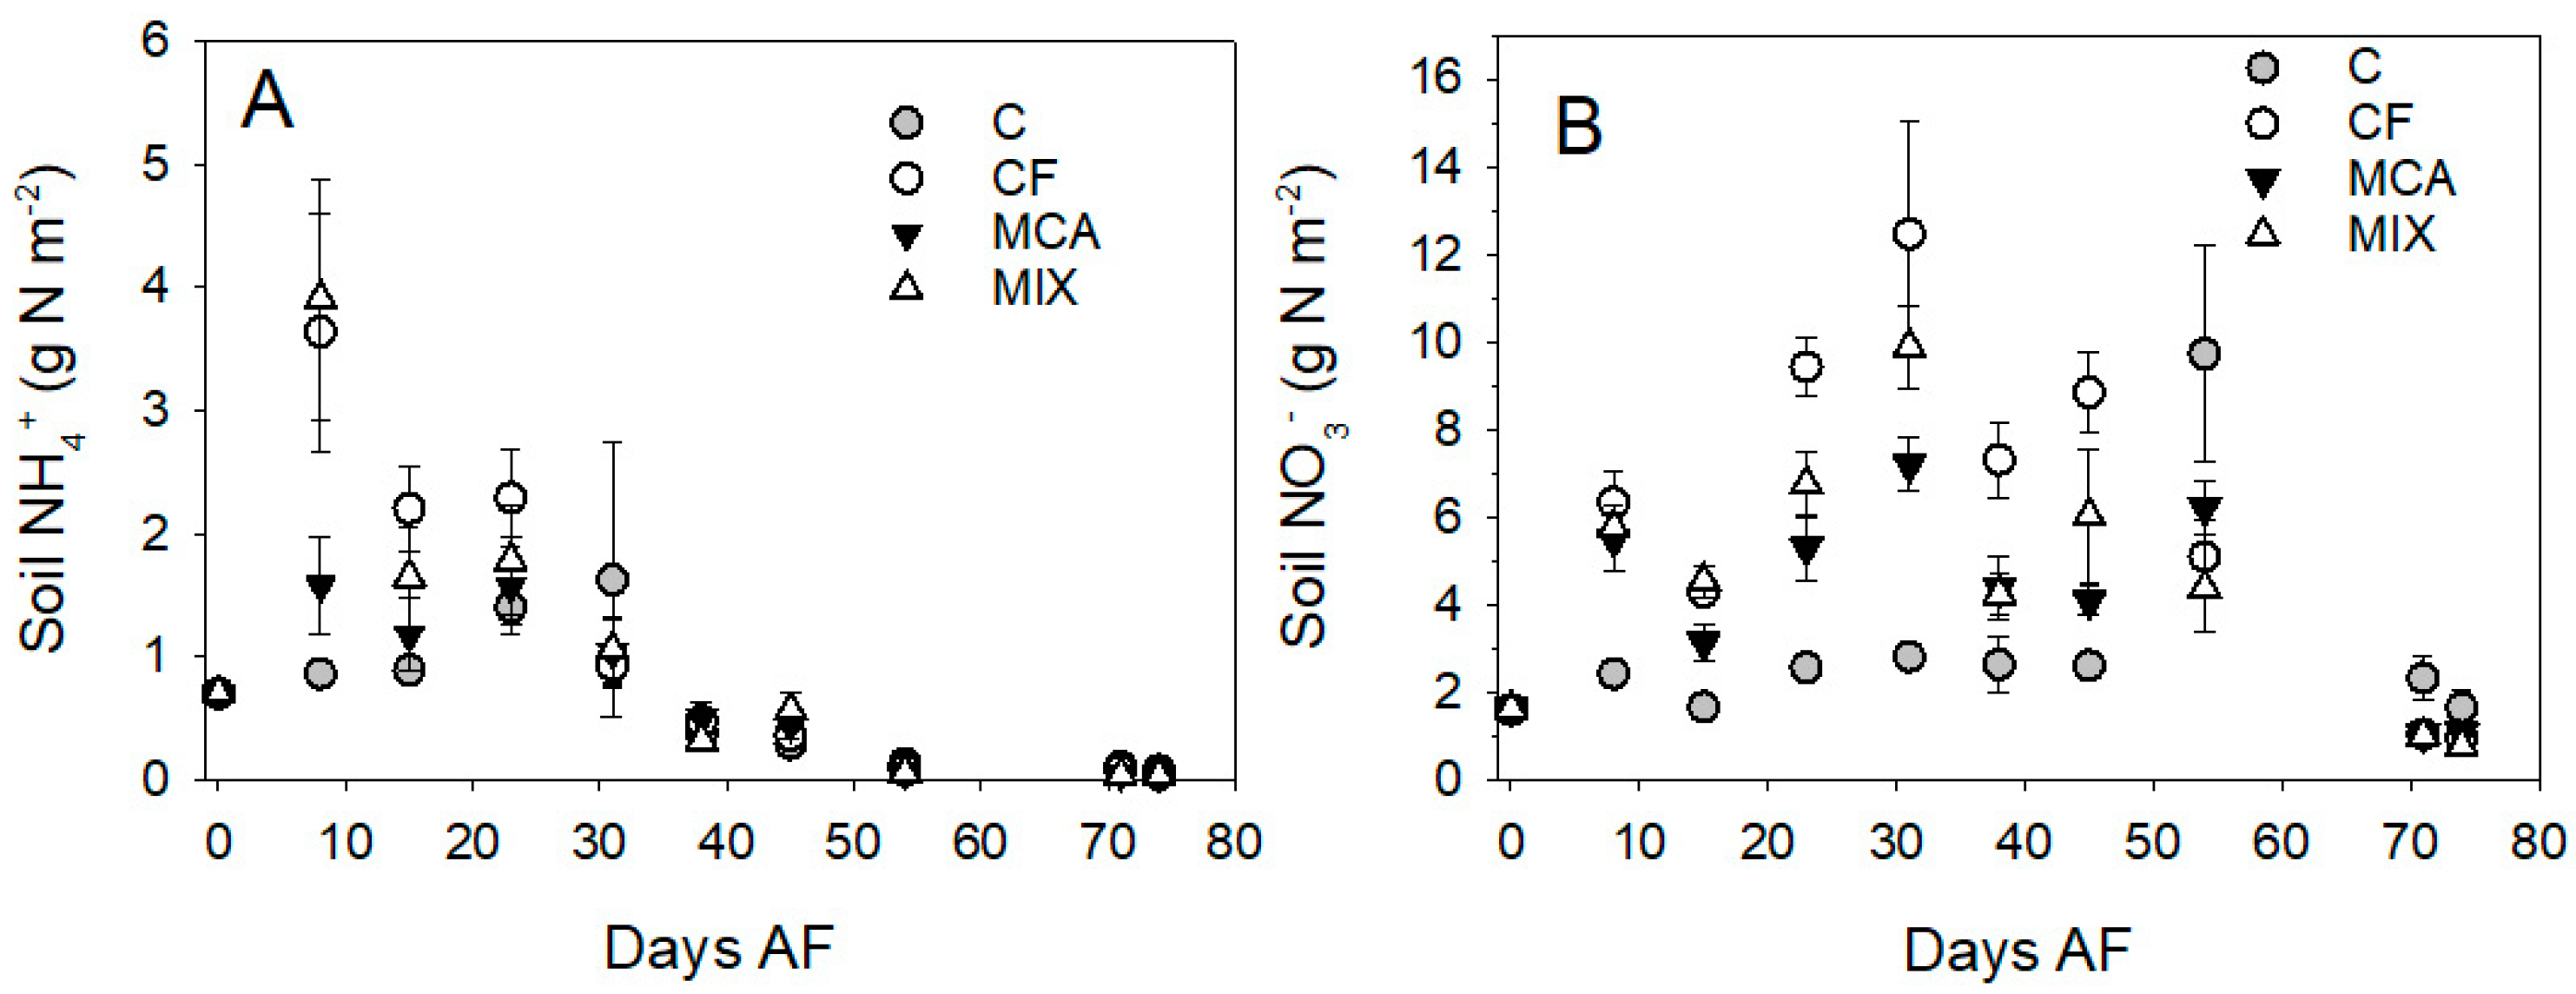
3.1. Effect of Fertilization on Crop Yield and Available Mineral N

Above ground, below ground, and total plant dry biomass of Swiss chard at the first harvest, 48 days after seeding, were significantly higher in the fertilized plots compared with control plots (Table 2), while no significant difference was observed among fertilization treatments, however, on average, higher crop yields were reached in the MIX treatment. The shoot/root ratio of biomass was similar in all treatments and varied from a minimum of 5.75 in the control to a maximum of 6.21 in the MCA treatment. The crop biomass at the second harvest, 70 days after seeding, was on average higher than the biomass measured in the first harvest. This was particularly evident in the control treatment, as no significant difference in total biomass yield was observed among the 4 treatments in this second harvesting. The shoot/root ratio was lower in this second cycle (2.8–3.6). Despite the comparable crop productivity in the 3 fertilization treatments, the soil available mineral N in MCA and MIX treatments was 60% and 30% lower, respectively, than the mineral N measured in CF in the first cropping cycle, and 50% lower in the second cropping cycle. The overall mineral N trend showed a total mineral N concentration that increased over the first 40 days, with significant differences between the control and CF treatment and declined after 60 days to arrive at day 70 after fertilization with no significant differences among treatments (Figure 1A,B). Nitrate was the prevalent form of mineral N (Figure 1B), even in the CF treatment that received 75 kg of N ha−1 in the form of ammonium salt and urea (1:1), indicating a very active nitrifying activity.

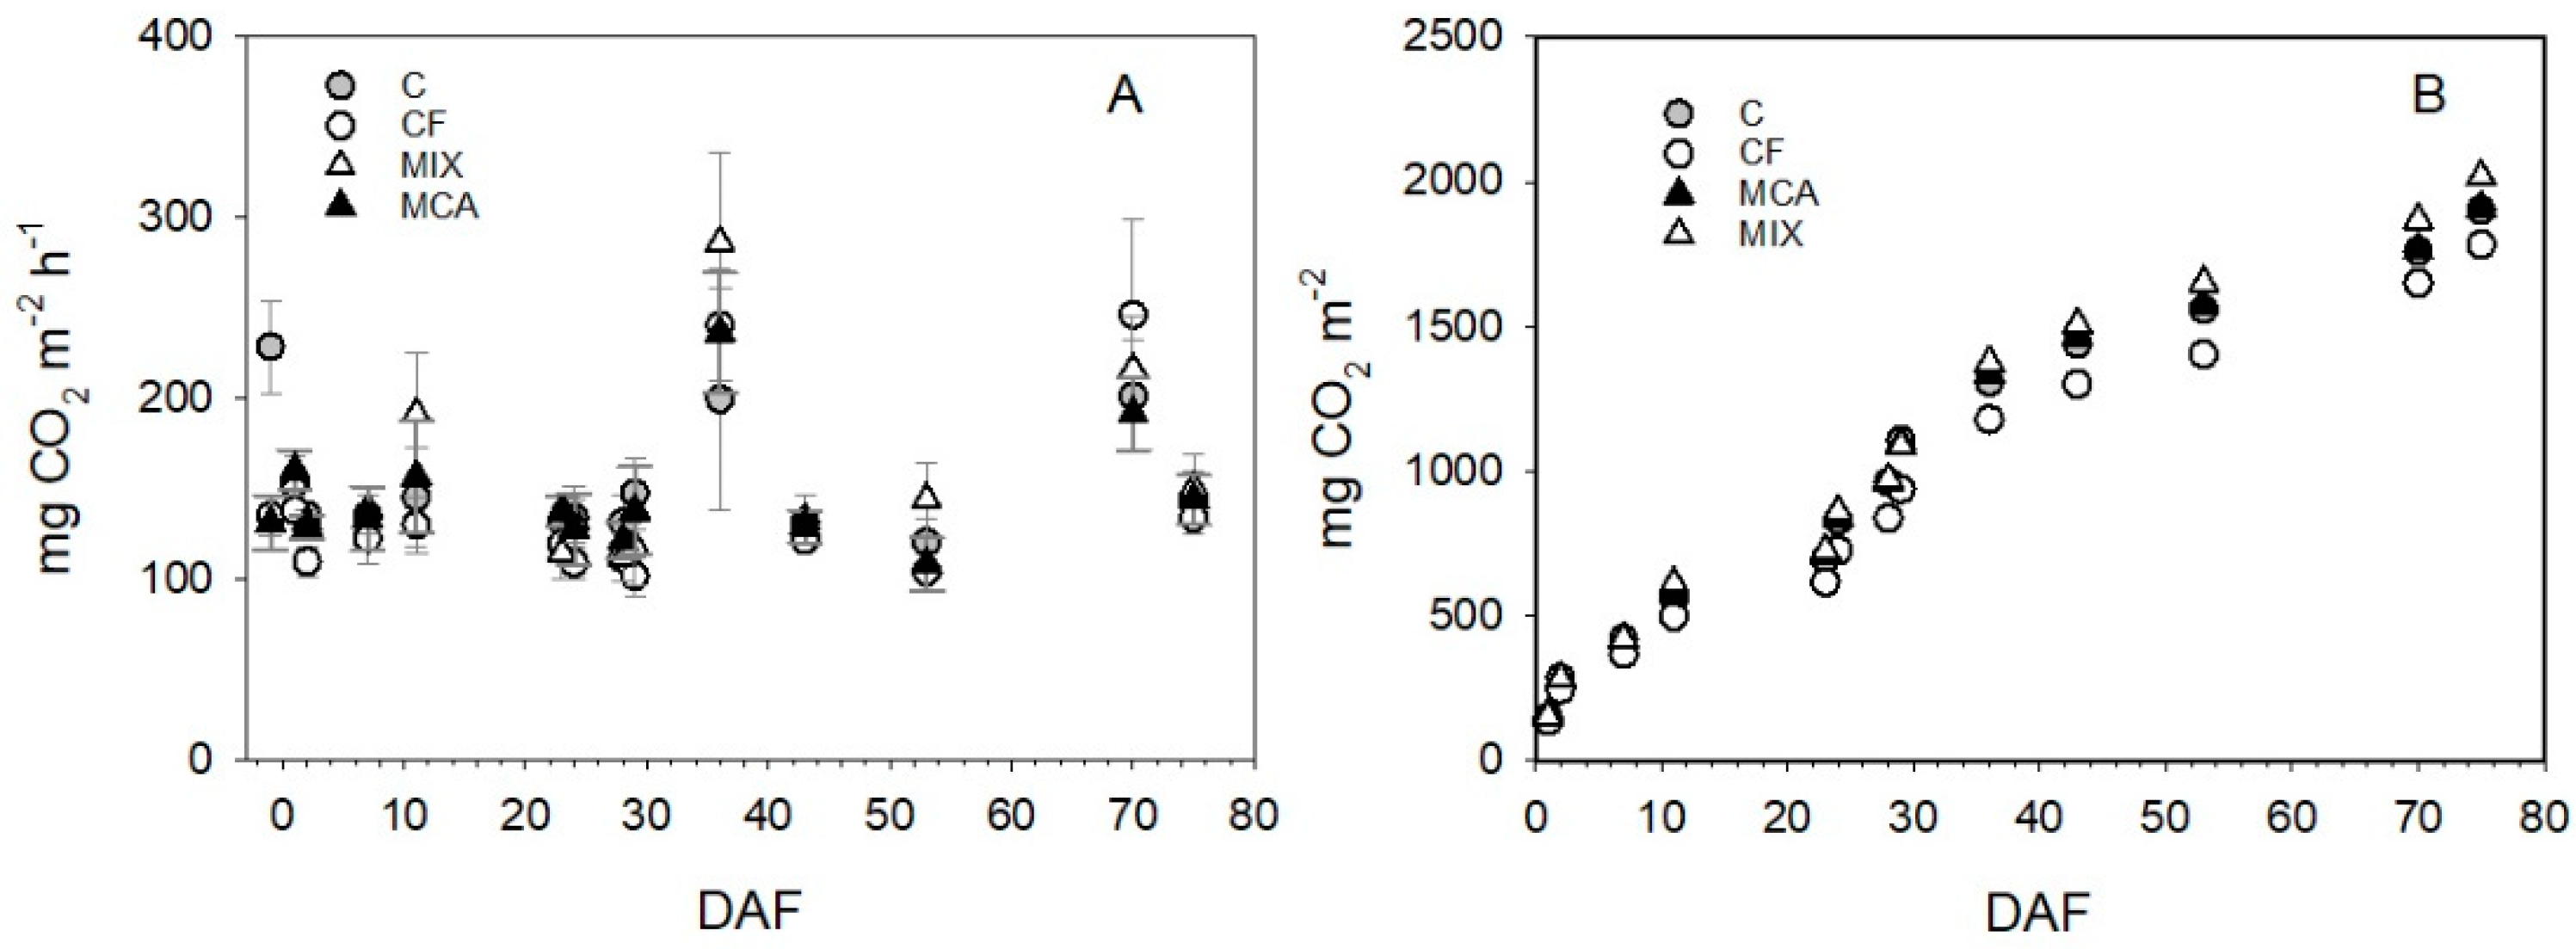
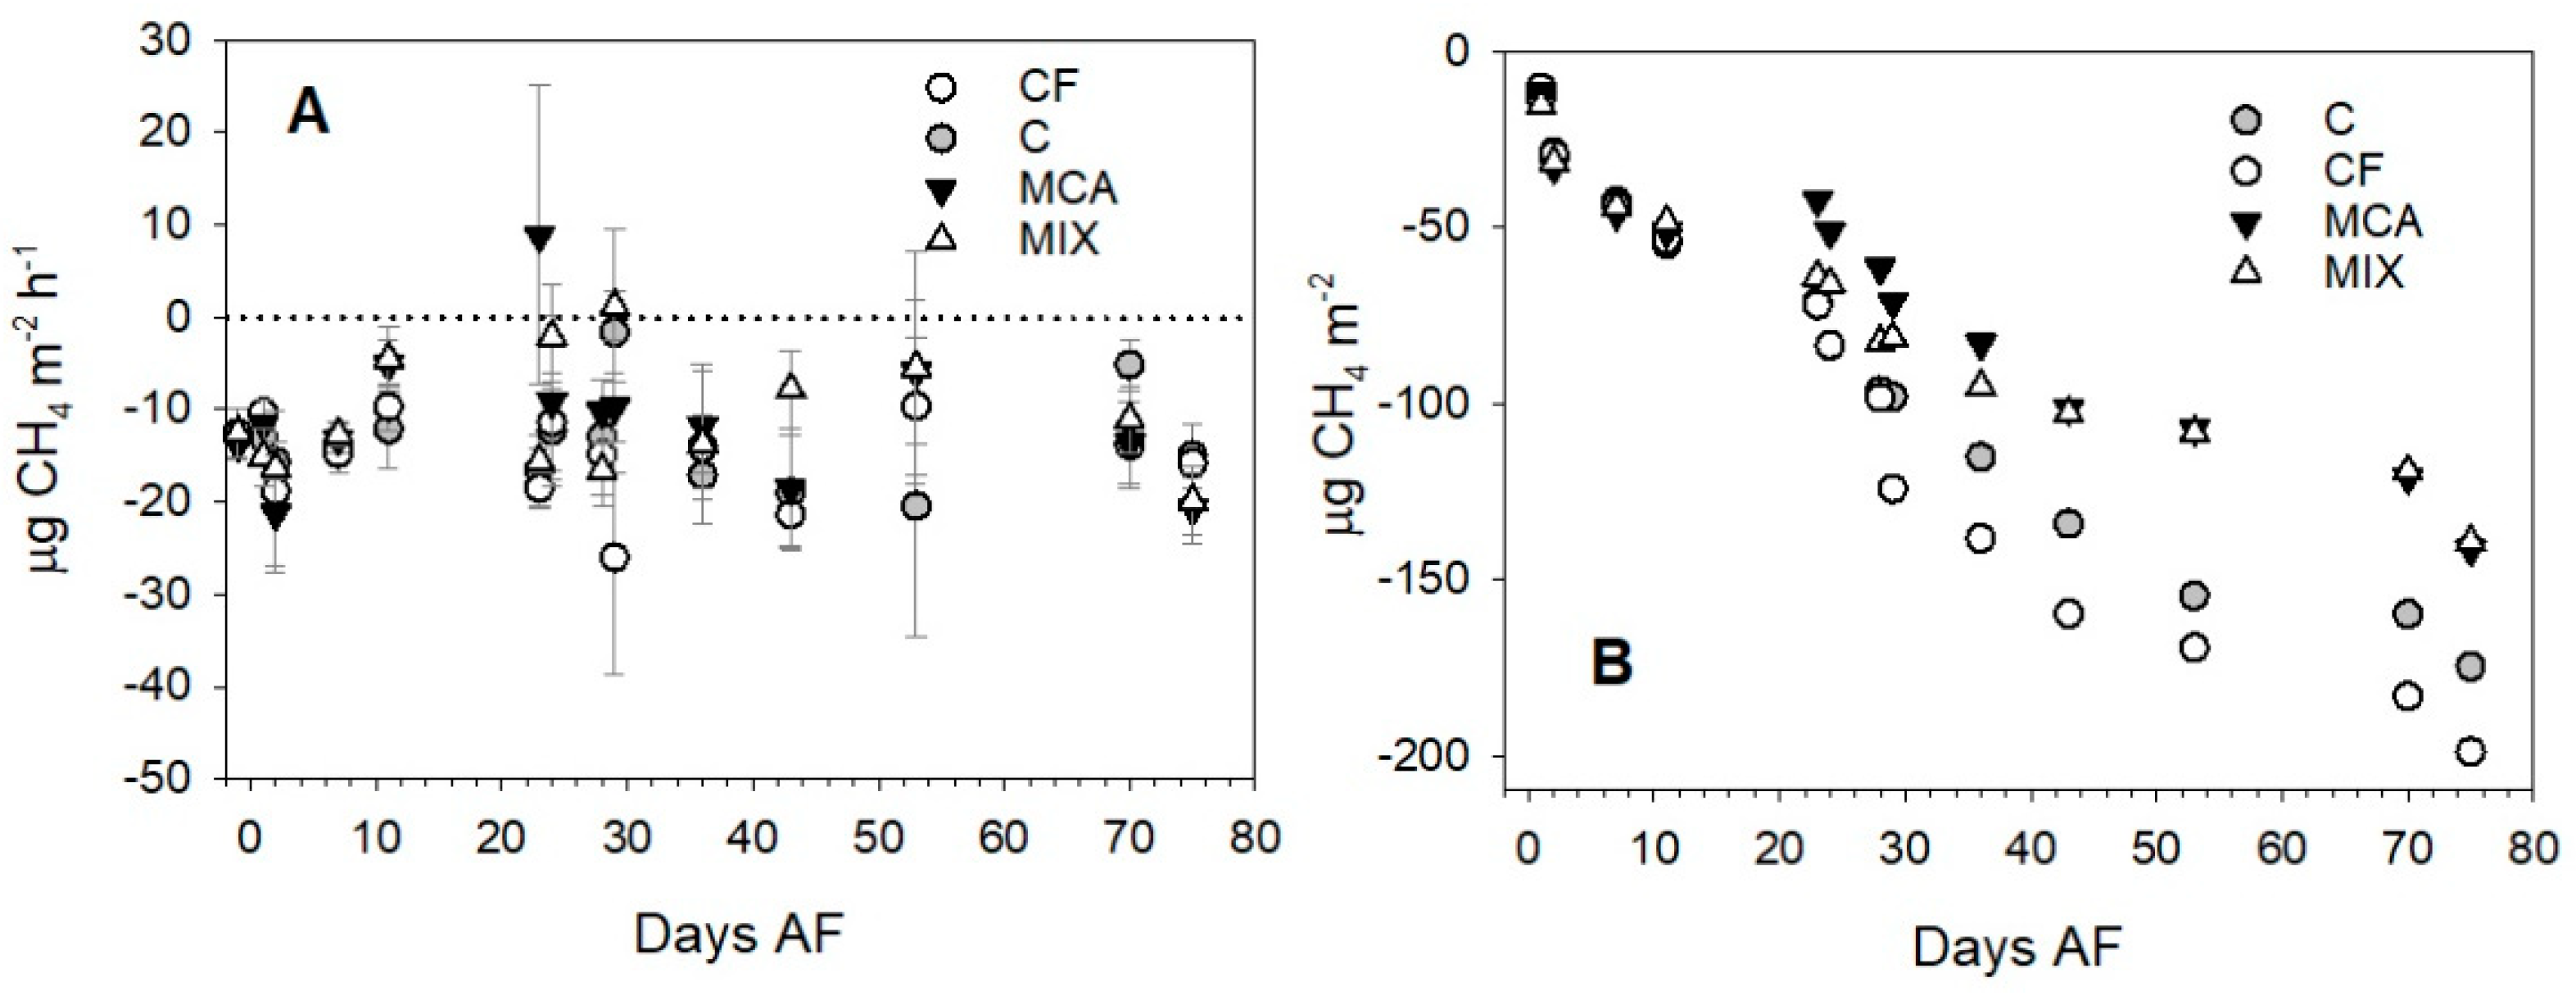
3.2. Effect of Fertilization on GHG Soil-Atmosphere Exchange

No significant effect of fertilizer addition was observed on CO2 fluxes (Figure 2A,B), even where MCA has been added alone or in combination with mineral fertilizer (MIX). Overall, CO2 emissions varied between 108 and 285 mg CO2 m−2 h−1 (Figure 2A, Table S1), no increasing trend of CO2 emission rates were observed throughout the experiment, although soil temperature, measured concomitantly with gas sampling, increased over the experimental period from 18 °C to 23 °C. No correlation was found between soil respiration and soil temperature or soil water-filled pore space%. The latter varied between 18% and 35% without a clear temporal trend. No significant difference in cumulative CO2 emissions was observed among treatments (Figure 2B).
Average N2O fluxes were quite low, varying between 1.4 and 34.4 μg N2O m−2 h−1 (Table S2), except for “day one” of fertilization in the MIX treatment, where N2O emissions reached an average hourly flux of 75 μg N2O m−2 h−1 and a max value of 332 μg N2O m−2 h−1 (Figure 3A). The frequency distribution of N2O fluxes in the four treatments showed that, in all the treatments, the majority of fluxes were in the interval 1–40 μg N2O m−2 h−1 with a peak in the flux class 10–20 μg N2O m−2 h−1 (Figure 4). A noteworthy increase of flux frequency in the flux classes higher than 40 μg N2O m−2 h−1 was observed only in the MIX treatment. In all the sampling dates, there was no statistical difference among treatments, while the cumulative N2O flux (Figure 3B) at the end of the experiment was 30% higher in the MIX compared with the control and 15% higher in CF and MCA treatments compared with control (no statistical difference, p > 0.05).
N2O fertilizer-induced emissions (FIE) were 34.5, 29.1, and 36.0 g N-N2O ha−1 for the CF, MCA, and MIX treatments, respectively. Expressing these N2O-N emissions per unit of available N, the emission factors (EFs) obtain were 0.09% for MCA, 0.07% for the MIX treatment, and 0.05% for the CF treatment. The emission intensity EI, i.e., the amount of N2O emitted per unit of crop yield, was 0.011, 0.09, and 0.011 g N2O kg−1 crop dry weight, respectively, for CF, MCA, and MIX treatments.
Net soil-atmosphere CH4 exchange was generally negative, i.e., soil acted as a net weak sink in all the treatments (Figure 5A), never exceeding −26 μg CH4 m−2 h−1. Only on a few dates a small net CH4 emission was measured in MCA and MIX treatments (Table S3) and, although no statistical difference was observed among the four treatments, this slightly affected the total CH4 sink, as shown by the cumulative CH4 fluxes (Figure 5B). Fitting all the data together, the net CH4 flux was related to the water-filled pore space (WFPS%) by an exponential relationship (y = y0 × ae(b×x), y0 = −15.01, a = 0.002, b = 0.5, p < 0.04, R2 = 0.194).

4. Discussion

4.1. Effect of Treatments on Crop Yield and Mineral N

The present study aimed to evaluate the effect of a mixed composted amendment (MCA), conventional chemical fertilization (CF), and a combination of both (MIX 1:1) on crop yield and greenhouse gas emissions in a field trial on the Swiss chart. In terms of the effects on crop yield, the tested MCA was equally effective at stimulating Swiss chard growth as CF and MIX fertilization, particularly during the first cropping cycle. We observed no difference in crop yield among fertilizer treatments, but the yield in all the treated plots was significantly higher than in the control plots. During the same period, the amount of soil available mineral N in MCA treatments was significantly lower compared with the CF and MIX treatments. Mineral N, in particular in the form of NO3, is highly soluble in water and hence more susceptible to leaching and loss during rain events, making the use of MCA interesting in terms of the slow release of N in the soil, which might better fit the plant daily N request, compared with CF, reducing N losses in different forms. Extractable mineral N leveled off in all the treatments, suggesting that in all cases the majority of mineral N was made available within the first 60 days after fertilizer application. Considering the full crop cycle with both harvests, the above-ground biomass (AGB) yield ranged from 3.8 tons/ha in the control to 5.2 tons/ha in the MIX treatment, which is over the average chard crop yield reported for Italian agriculture (3.2 tons/ha) [27]. Although the variable composition of MCA makes a direct comparison with other studies difficult, our results are in agreement with the findings of Hargreaves et al. 2008 [28], who showed that municipal solid waste (MSW) compost in several cases had a better or comparable effect to that of mineral fertilizers on crop yields. This is not always the case, and depending on the matrix additional inputs of mineral fertilizer in MSW treatments might be necessary [28,29].

4.2. Effect of Treatments on Soil GHG Fluxes

The lack of significant differences in CO2 emissions between MCA or MIX treatment and control indicates that the MCA was quite a stabilized substrate, i.e., deployed of the most labile organic molecules, which can significantly contribute to C and N losses and GHG emissions [30]. Despite the low C mineralization rates, MCA mineralization still provided a significant quantity of mineral N to the soil to support plant growth. Although mineral N was available in the soil during most of the observation period, N2O emissions, were very low, making the slightly higher EF of MCA negligible when the three fertilizer options were compared for climate impact. In fact, for all the treatments, the estimated EFs were much lower than the average 1% EF reported by the International Panel on Climate Change Guidelines (Tier 1 approach) for N2O emissions from mineral soils [16] and are lower than EFs reported by Castaldi et al. (2015) [17] in other spring/summer crops in Italy. Low N2O emissions observed in this study could be attributed to the low soil WFPS%. During the study, irradiance and air temperatures were quite high (average and max daily air temperature in June was 22.5 °C and 33 °C, and 26 °C and 36 °C in July, respectively). Drip irrigation was calibrated to provide just sufficient water to the rhizosphere area to contrast plant water stress and avoid excess water consumption and loss. Hence, irrigation contributed very little to increasing soil water content beyond a few centimeters from the crop line. At the observed conditions of WFPS (<35%), soil aeration status is considered unfavorable for the evolution of anaerobic hotspots where denitrification can take place [31,32], and the main gaseous product of the aerobic nitrification process is NO rather than N2O [33,34]. The frequency distribution of N2O fluxes evidenced that the simultaneous addition of compost and mineral N (MIX treatments) slightly stimulated N2O production compared with compost alone (MCA) or mineral fertilizer alone (CF). This would be coherent with the knowledge that the co-occurrence of fresh organic substrates and mineral N stimulates the formation of anaerobic hotspots suitable for denitrification activity within aerobic soils [33,34,35,36]. However, considering the ratio between N2O emissions and crop yield, the MCA was characterized by the lowest emission intensity among the three fertilization treatments, which is a relevant aspect of food sustainability, where impacts are generally expressed per unit of weight of food.
The slight stimulation of compost on the formation of soil anaerobic hotspots might also explain the less negative net CH4 fluxes in the MCA and MIX plots compared with control and CF plots, as the net soil CH4 flux is a net balance between gross CH4 consumption by methanotrophic bacteria and gross CH4 production by methanogenic bacteria [37,38]. In aerobic soils, methanotrophic activity predominates, and methanogenic activity is a discontinuous process that might occur only in association with fresh degradable organic matter, which can provide hotspots of respiration activity, where O2 concentration can momentarily be lowered to optimal conditions for anaerobic micro-organisms [38].

4.3. Suggestions for Further Studies on MCA

As the experimental conditions, typical of the Mediterranean spring/summer, might be limiting for the significant formation of both N2O and CH4, the observed low GHG fluxes might be considered representative of summer crops and caution should be used before generalizing the estimated emission factor to wetter conditions, like those that might occur in winter in the Mediterranean areas or agricultural areas at higher latitudes. Further investigation of the use of MCA with winter crops would be an important next step for a full evaluation of the MCA impact on GHG. Another relevant aspect is related to the potential release of toxic compounds, such as heavy metals and aromatic molecules, from compost mixes derived from municipal solid waste materials and sewage sludge [28,29]. For this specific study, heavy metals in the compost matrix were analyzed and found to be below the risk limit allowed by the Italian law (D.lgs 75/2010 and later amendments) and EU regulation for compost use in agriculture. However, the composition of compost and metal concentrations might change over time depending on input matrices, and this requires careful and continuous monitoring of input matrices and compost quality released on the market [30].

5. Conclusions

Our study showed that, in the tested Mediterranean conditions, MCA could be a suitable substitute for mineral N fertilizers for crop fertilization. The study also showed that despite being an organic substrate, potentially more suitable for microbial respiratory activity (aerobic and anaerobic), MCA did not provide significantly higher GHG fluxes compared with CF, and was characterized by a lower EI compared to CF. Further analysis of the MCA effect on winter crops might be needed to evaluate the environmental performance of MCA in climatic conditions more favourable to anaerobic GHG production, thus providing a full overview of a year-round cropping management scheme based on MCA. The effect of repeated addition of MCA on the heavy metal potential accumulation in soil should also be considered.

Supplementary Materials

The following supporting information can be downloaded at: https://www.mdpi.com/article/10.3390/atmos14020246/s1, Table S1: Average hourly flux of CO2; Table S2: Average hourly flux of N2O; Table S3: Average hourly flux of CH4.

Author Contributions

Conceptualization, S.C., A.V. and G.C.; investigation, all authors; data curation, S.C., S.M., T.B., writing—original draft preparation, S.C., G.C.; writing—review and editing, all authors. funding acquisition, S.C and A.V. All authors have read and agreed to the published version of the manuscript.

Funding

This research was funded by Ministero per l’Università e La Ricerca, PRIN program 2010–2011, grant number CARBOTREES prot. 201049EXTW_004MIUR.

Institutional Review Board Statement

Not applicable.

Informed Consent Statement

Not applicable.

Data Availability Statement

Data is contained within the article or Supplementary materials.

Conflicts of Interest

The authors declare no conflict of interest.

References

  1. Ciais, P.; Sabine, C.; Bala, G.; Bopp, L.; Brovkin, V.; Canadell, A.; Chhabra, R.; DeFries, R.; Galloway, J.; Heimann, C.; et al. Carbon and Other Biogeochemical Cycles BT. In Climate Change the Physical Science Basis. Contribution of Working Group I to the Fifth Assessment Report of the Intergovernmental Panel on Climate Change; Cambridge University Press: Cambridge, UK, 2009; pp. 465–570. [Google Scholar]
  2. Crippa, M.; Solazzo, E.; Guizzardi, D.; Monforti-Ferrario, F.; Tubiello, F.N.; Leip, A. Food systems are responsible for a third of global anthropogenic GHG emissions. Nat. Food 2021, 2, 198–209. [Google Scholar] [CrossRef]
  3. Nordahl, S.L.; Devkota, J.P.; Amirebrahimi, J.; Smith, S.; Breunig, H.M.; Preble, C.V.; Satchwell, A.J.; Jin, L.; Brown, N.J.; Kirchstetter, T.W.; et al. Life-Cycle Greenhouse Gas Emissions and Human Health Trade-Offs of Organic Waste Management Strategies. Environ. Sci. Technol. 2020, 54, 9200–9209. [Google Scholar] [CrossRef] [PubMed]
  4. Statista. Annual Greenhouse Gas Emissions in the European Union (EU-27) from 1990 to 2020, by Sector. Available online: https://www.statista.com/statistics/1171183/ghg-emissions-sector-european-union-eu/ (accessed on 12 November 2022).
  5. Aguilera, E.; Reyes-Palomo, C.; Díaz-Gaona, C.; Sanz-Cobena, A.; Smith, P.; García-Laureano, R.; Rodríguez-Estévez, V. Greenhouse gas emissions from Mediterranean agriculture: Evidence of unbalanced research efforts and knowledge gaps. Glob. Environ. Chang. 2021, 69, 102319. [Google Scholar] [CrossRef]
  6. Martínez-Blanco, J.; Lazcano, C.; Christensen, T.H.; Muñoz, P.; Rieradevall, J.; Møller, J.; Boldrin, A. Compost benefits for agriculture evaluated by life cycle assessment. A review. Agron. Sustain. Dev. 2013, 33, 721–732. [Google Scholar] [CrossRef] [Green Version]
  7. EEA. Bio-Waste in Europe Turning Challenges into Opportunities; Issue 04; Publications Office of the European Union: Luxembourg, 2020; ISBN 9789294802231. [Google Scholar]
  8. Anderson, N.; Snaith, R.; Madzharova, G.; Bonfait, J.; Doyle, L.; Godley, A.; Ming, L.; Fribourg-Blanc, B.; Sewage Sludge and the Circular Economy. EIONET Forum. 2021. Available online: https://forum.eionet.europa.eu/nrc-eionet-freshwater/library/urban-waste-water-treatment/sewage-sludge-and-circular-economy (accessed on 12 November 2022).
  9. Ferrentino, R.; Langone, M.; Mattioli, D.; Fiori, L.; Andreottola, G. Investigating the Enhancement in Biogas Production by Hydrothermal Carbonization of Organic Solid Waste and Digestate in an Inter-Stage Treatment Configuration. Processes 2022, 10, 777. [Google Scholar] [CrossRef]
  10. Raheem, A.; Sikarwar, V.S.; He, J.; Dastyar, W.; Dionysiou, D.D.; Wang, W.; Zhao, M. Opportunities and challenges in sustainable treatment and resource reuse of sewage sludge: A review. Chem. Eng. J. 2018, 337, 616–641. [Google Scholar] [CrossRef]
  11. Pasqualone, A.; Delvecchio, L.N.; Lacolla, G.; Piarulli, L.; Simeone, R.; Cucci, G. Effect of composted sewage sludge on durum wheat: Productivity, phenolic compounds, antioxidant activity, and technological quality. J. Food Agric. Environ. 2014, 12, 276–280. [Google Scholar]
  12. Pasqualone, A.; Summo, C.; Centomani, I.; Lacolla, G.; Caranfa, G.; Cucci, G. Effect of composted sewage sludge on morpho-physiological growth parameters, grain yield and selected functional compounds of barley. J. Sci. Food Agric. 2017, 97, 1502–1508. [Google Scholar] [CrossRef]
  13. Curci, M.; Lavecchia, A.; Cucci, G.; Lacolla, G.; De Corato, U.; Crecchio, C. Short-Term Effects of Sewage Sludge Compost Amendment on Semiarid Soil. Soil Syst. 2020, 4, 48. [Google Scholar] [CrossRef]
  14. Ding, A.; Zhang, R.; Ngo, H.; He, X.; Ma, J.; Nan, J.; Li, G. Life cycle assessment of sewage sludge treatment and disposal based on nutrient and energy recovery: A review. Sci. Total Environ. 2021, 769, 144451. [Google Scholar] [CrossRef]
  15. Fowler, D.; Coyle, M.; Skiba, U.; Sutton, M.A.; Cape, J.N.; Reis, S.; Sheppard, L.J.; Jenkins, A.; Grizzetti, B.; Galloway, N.; et al. The Global Nitrogen Cycle in the Twenty- First Century. Philos. Trans. R. Soc. B 2013, 368, 20130164. [Google Scholar] [CrossRef] [PubMed]
  16. IPCC. Application. In 2019 Refinement to the 2006 IPCC Guidelines for National Greenhouse Gas Inventories; IPCC: Geneva, Switzerland, 2019; pp. 1–48. ISBN 4887880324. [Google Scholar]
  17. Castaldi, S.; Alberti, G.; Bertolini, T.; Forte, A.; Miglietta, F.; Valentini, R.; Fierro, A. N2O Emission Factors for Italian Crops. In The Greenhouse Gas Balance of Italy, Environmental Science and Engineering; Valentini, R., Miglietta, F., Eds.; Springer: Berlin/Heidelberg, Germany, 2015; pp. 135–144. [Google Scholar]
  18. Lugato, E.; Zuliani, M.; Alberti, G.; Delle Vedove, G.; Gioli, B.; Miglietta, F.; Peressotti, A. Application of DNDC biogeochemistry model to estimate greenhouse gas emissions from Italian agricultural areas at high spatial resolution. Agr. Ecosyst. Environ. 2010, 139, 546–556. [Google Scholar] [CrossRef]
  19. Snyder, C.; Bruulsema, T.; Jensen, T.; Fixen, P. Review of greenhouse gas emissions from crop production systems and fertilizer management effects. Agric. Ecosyst. Environ. 2009, 133, 247–266. [Google Scholar] [CrossRef]
  20. Soil Survey Staff. Keys to Soil Taxonomy, 12th ed.; USDA-Natural Resources Conservation Service: Washington, DC, USA, 2014.
  21. IUSS Working Group WRB. World Reference Base for Soil Resources. In International Soil Classification System for Naming Soils and Creating Legends for Soil Maps; WRB: London, UK, 2014; Volume 106, p. 182. [Google Scholar]
  22. ISTAT. Istituto Nazionale Di Statistica, Italy. Agricoltura. 2022. Available online: https://www.istat.it/it/agricoltura?dati (accessed on 12 November 2022).
  23. Marinari, S.; Lagomarsino, A.; Moscatelli, M.C.; Di Tizio, A.; Campiglia, E. Soil carbon and nitrogen mineralization kinetics in organic and conventional three-year cropping systems. Soil Till. Res. 2010, 109, 161–168. [Google Scholar] [CrossRef]
  24. Stanford, G.; Smith, S.J. Nitrogen mineralization potentials of soils. Soil Sci. Soc. Am. Proc. 1972, 36, 465–472. [Google Scholar] [CrossRef]
  25. Castaldi, S.; Riondino, M.; Baronti, S.; Esposito, F.R.; Marzaioli, R.; Rutigliano, F.A.; Vaccari, F.P.; Miglietta, F. Impact of biochar application to a Mediterranean wheat crop on soil microbial activity and greenhouse gas fluxes. Chemosphere 2011, 85, 1464–1471. [Google Scholar] [CrossRef]
  26. Castaldi, S.; Bertolini, T.; Valente, A.; Chiti, T.; Valentini, R. Nitrous oxide emissions from soil of an African rain forest in Ghana. Biogeosciences 2013, 10, 4179–4187. [Google Scholar] [CrossRef] [Green Version]
  27. ISTAT. Istituto Nazionale di Statistica. 2021. Available online: http://dati.istat.it/Index.aspx?QueryId=33703 (accessed on 27 December 2021).
  28. Hargreaves, J.C.; Adl, M.S.; Warman, P.R. A review of the use of composted municipal solid waste in agriculture. Agric. Ecosyst. Environ. 2008, 123, 1–14. [Google Scholar] [CrossRef]
  29. Warman, P.R.; Rodd, A.V.; Hicklenton, P. The effect of MSW compost and fertilizer on ex-tractable soil elements and the growth of winter squash in Nova Scotia. Agr. Ecosyst. Environ. 2009, 133, 98–102. [Google Scholar] [CrossRef]
  30. Thangarajan, R.; Bolan, N.; Tian, G.; Naidu, R.; Kunhikrishnan, A. Role of organic amendment application on greenhouse gas emission from soil. Sci. Total Environ. 2013, 465, 72–96. [Google Scholar] [CrossRef]
  31. Firestone, M.K.; Davidson, E.A. Microbiological Basis of NO and N2O Production and Consumption in Soil. In Exchange of Trace Gases between Terrestrial Ecosystems and the Atmosphere; Andreae, M.O., Schimel, D.S., Eds.; Wiley: New York, NY, USA, 1989; pp. 7–21. [Google Scholar]
  32. Davidson, E.A. Fluxes of Nitrous Oxide and Nitric Oxide from Terrestrial Ecosystems. In Microbial Production and Consumption of Greenhouse Gases: Methane, Nitrogen Oxides and Halomethanes; Rogers, J.E., Whitman, W.B., Eds.; American Society for Microbiology: Washington, DC, USA, 1991; pp. 219–235. [Google Scholar]
  33. Castaldi, S.; De Grandcourt, A.; Rasile, A.; Skiba, U.; Valentini, R. CO2, CH4 and N2O fluxes from soil of a burned grassland in Central Africa. Biogeosciences 2010, 7, 3459–3471. [Google Scholar] [CrossRef]
  34. Groffman, P.M.; Butterbach-Bahl, K.; Fulweiler, R.W.; Gold, A.J.; Morse, J.L.; Stander, E.K.; Tague, C.; Tonitto, C.; Vidon, P. Incorporating Spatially and Temporally Explicit Phenomena (Hotspots and Hot Moments) in Denitrification Models. Biogeochemistry 2009, 93, 49–77. [Google Scholar] [CrossRef]
  35. Smith, K.A. Anaerobic Zones and Denitrification in Soil: Modelling and Measurements. In Denitrification in Soil and Sediment; Revsboech, N.P., Sørensen, J., Eds.; Plenum Press: New York, NY, USA, 1990; pp. 228–240. [Google Scholar]
  36. Verchot, L.V.; Davidson, E.A.; Cattânio, J.H.; Ackerman, I.L.; Erickson, H.E.; Keller, M. Land use change and biogeochemical controls of nitrogen oxide emissions from soils in eastern Amazonia. Glob. Biogeochem. Cycle 1999, 13, 31–46. [Google Scholar] [CrossRef]
  37. Chan, S.K.; Parkin, T.B. Methane oxidation and production activity in soils from natural and agricultural ecosystems. J. Environ. Qual. 2001, 30, 1896–1903. [Google Scholar] [CrossRef] [PubMed]
  38. Conrad, R. Soil Microbial Processes Involved in Production and Consumption of Atmospheric Trace Gases. In Advances in Microbial Ecology; Gwynfryn, J., Ed.; Plenum Press: New York, NY, USA, 1995; Volume 14, pp. 207–250. [Google Scholar]
Figure 1. Soil N measured in form of available NH4+ (A) and NO3 (B) in the top 10 soil centimeters of control plots and plots treated with conventional fertilizer (CF), MCA compost, and MIX. DAF stands for days after fertilization event (14 May 2013). Error bars represent one standard deviation (n = 4).
Atmosphere 14 00246 g001
Figure 2. Soil CO2 hourly emission (A) and cumulative flux (B) measured in the plots of the four treatments between 13 May and 25 July 2013. DAF stands for days after fertilization event (13 May 2013). Error bars represent one standard deviation (n = 12).
Atmosphere 14 00246 g002
Figure 3. N2O hourly flux (A) and cumulative flux (B) measured in the plots of the four treatments between 13 May and 25 July 2013. DAF stands for days after fertilization event (13 May 2013). Error bars represent one standard deviation (n = 8). Dotted lines represent the fertilization event (1st line) and the first crop harvesting (2nd line).
Atmosphere 14 00246 g003
Figure 4. Frequency distribution of N2O fluxes measured in the four treatments.
Atmosphere 14 00246 g004
Figure 5. CH4 hourly flux (A) and cumulative flux (B) measured in the plots of the four treatments between 14 May and 25 July 2013. DAF stands for days after fertilization event (13 May 2013). Error bars represent one standard deviation (n = 8).
Atmosphere 14 00246 g005
Table 1. Physical and chemical analyses of MCA compost used in this study (±1 standard deviation, SD, n = 3).
DescriptionUnitAverage Value (±1SD) Italian Legislation Limit (D.lsg 75/10)
H 6.7 ± 0.16≤ x ≤8.5
moisture%21.8 ± 0.7≤50
ashes% d.w.48.2 ± 1.2
organic C% d.w.26.5 ± 2.6≥20
organic N% d.w.2.3 ± 0.1
total N% d.w2.6 ± 0.1
total P% d.w1.0 ± 0.1
C/N 11.7≤25
humic and fulvic C% d.w.16.7 ± 1.7≥7
salinitydS/m3.2 ± 0.3
chrome VImg/kg d.w.<0.01≤0.5
cadmium (Cd)mg/kg d.w.<0.001≤1.5
mercury (Hg)mg/kg d.w.<0.01≤1.5
nichel (Ni)mg/kg d.w.7.8 ± 0.8≤100
lead (Pb)mg/kg d.w.26.3 ± 2.1≤140
zinc (Zn)mg/kg d.w.242.7 ± 12.1≤500
copper (Cu)mg/kg d.w.139.1 ± 11.1≤230
Table 2. Aboveground, belowground, and total plant biomass (gram of dry weight per square meter ± one standard deviation, n = 4), sampled at the end of each growth cycle in control and treated plots.
TreatmentControl
g d.w./m2
CF
g d.w./m2
MCA
g d.w./m2
MIX
g d.w./m2
1st Harvest
Aboveground139.7 a ± 8.5188.5 b ± 24.2199.3 b ± 23.4241.7 b ± 34.1
Belowground24.3 a ± 2.132.1 b ± 3.732.4 b ± 3.840.6 b ± 5.3
Total164.0 a ± 10.50220.6 b ± 27.7231.7 b ± 26.8282.3 b ± 38.7
2nd Harvest
Aboveground244.4 a ± 26.5284.4 a ± 20.7280.0 a ± 30.6 282.6 a ± 22.1
Belowground71.6 a ± 8.878.2 a ± 5.1100.8 b ± 11.677.9 a ± 8.4
Total316.0 a ± 33.8362.6 a ± 21.5 380.8 a ± 39.5360.5 a ± 28.3
Note: CF: Conventional fertilization; MCA: mixed composted amendment; MIX: mix fertilization CF:MCA 1:1. Different letters in apex indicate significant differences (p < 0.05) among treatments within the same row. 1st harvest occurred on 2 July 2013, second harvest on 24 July 2013.
Disclaimer/Publisher’s Note: The statements, opinions and data contained in all publications are solely those of the individual author(s) and contributor(s) and not of MDPI and/or the editor(s). MDPI and/or the editor(s) disclaim responsibility for any injury to people or property resulting from any ideas, methods, instructions or products referred to in the content.

