
A Practical Approach for Determining Multi-Dimensional Spatial Rainfall Scaling Relations Using High-Resolution Time–Height Doppler Data from a Single Mobile Vertical Pointing Radar


Abstract
:1. Introduction
2. Background
2.1. Basic Considerations
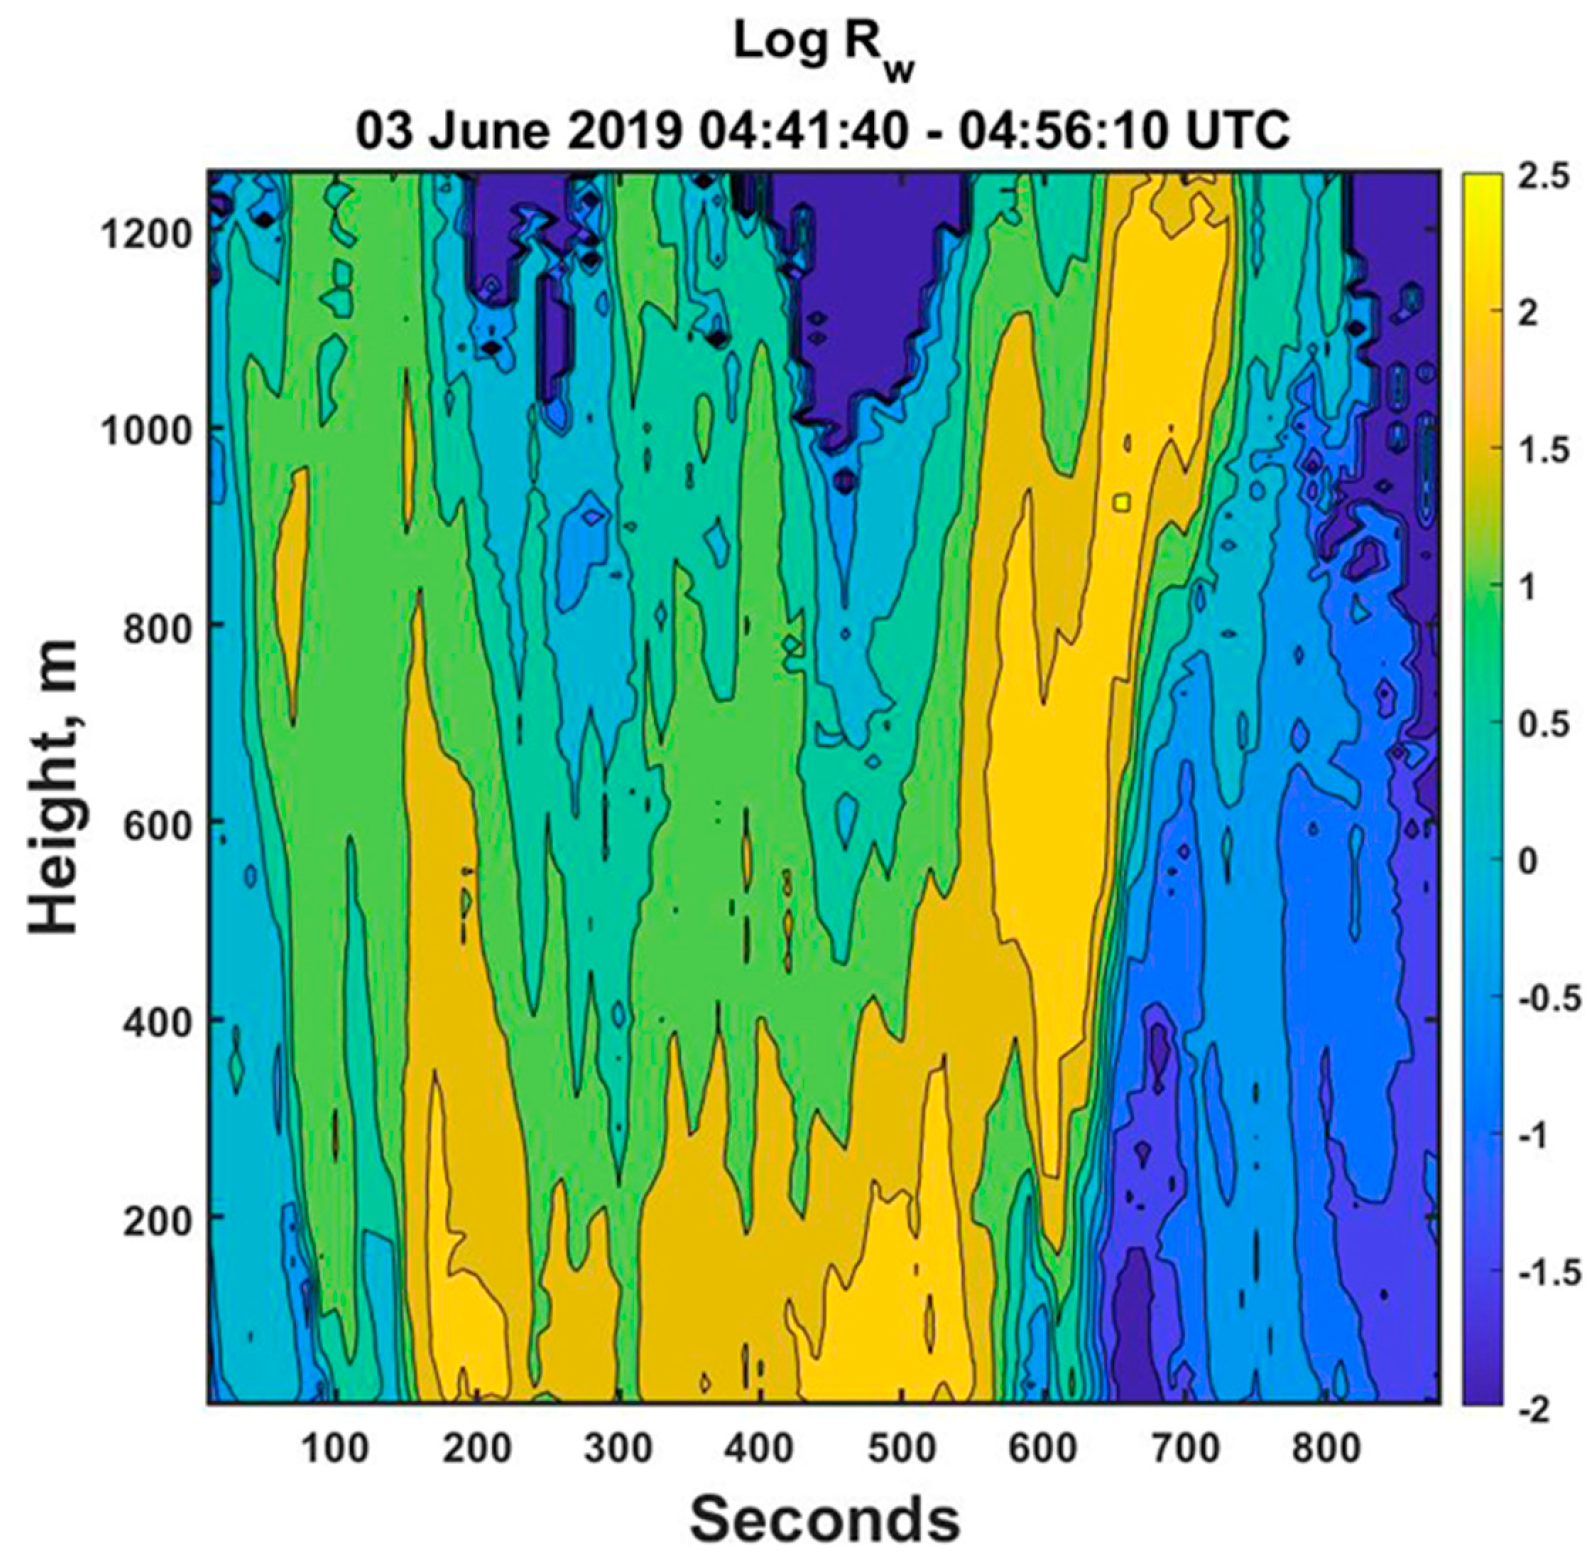
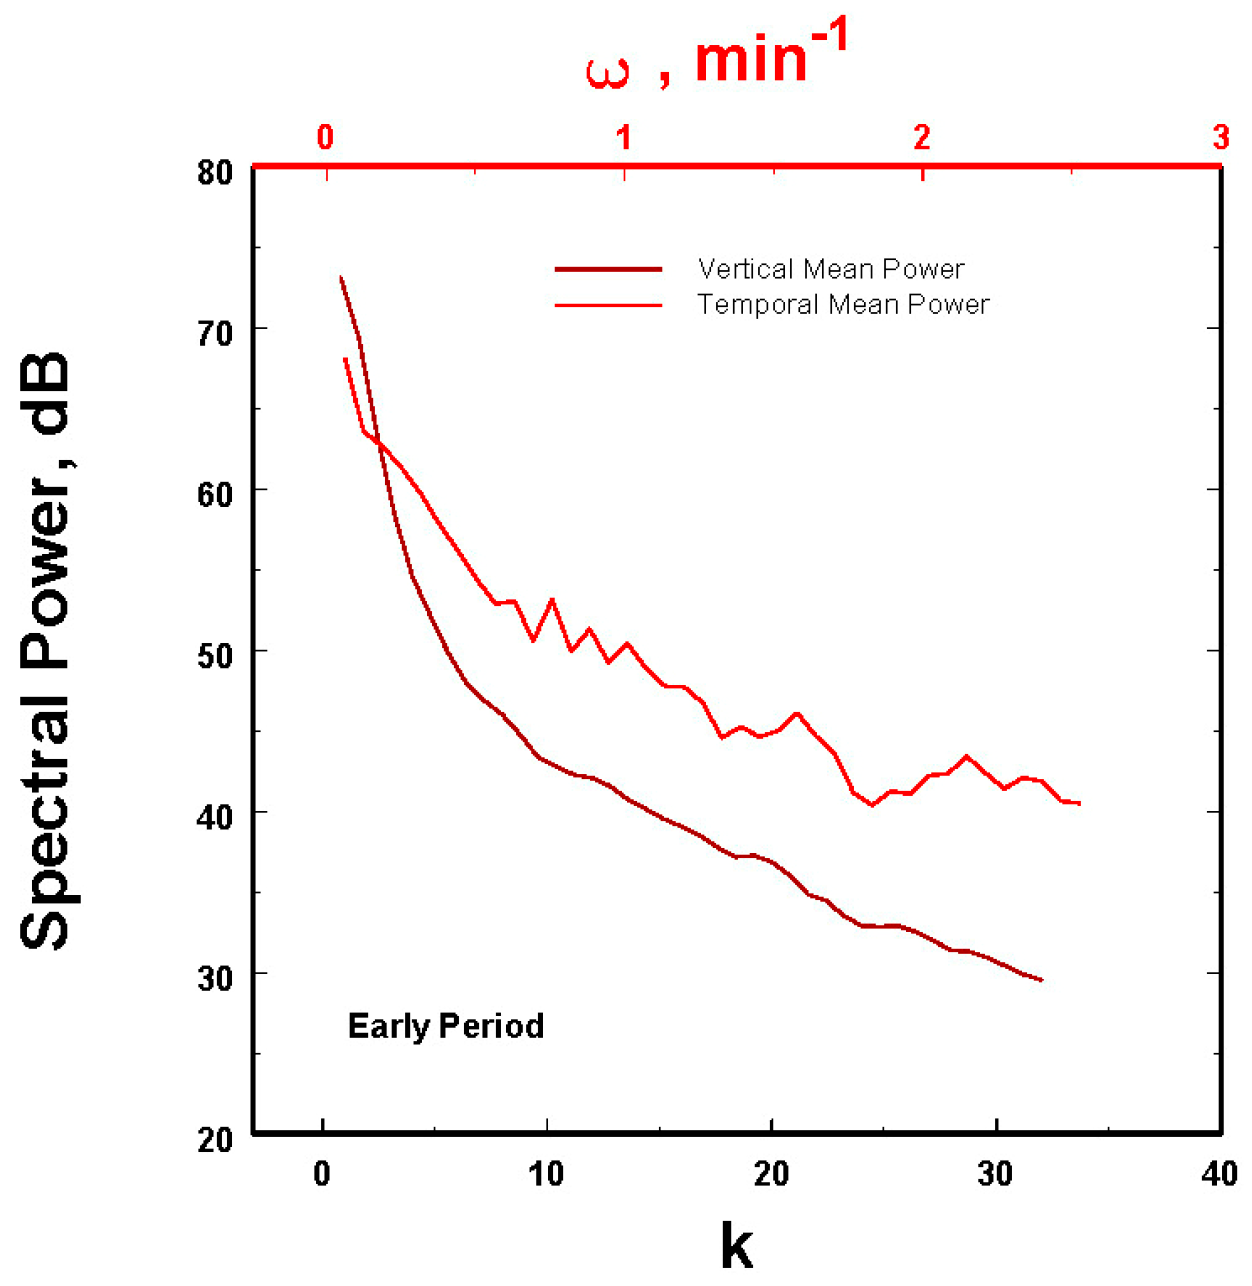
2.2. An Example
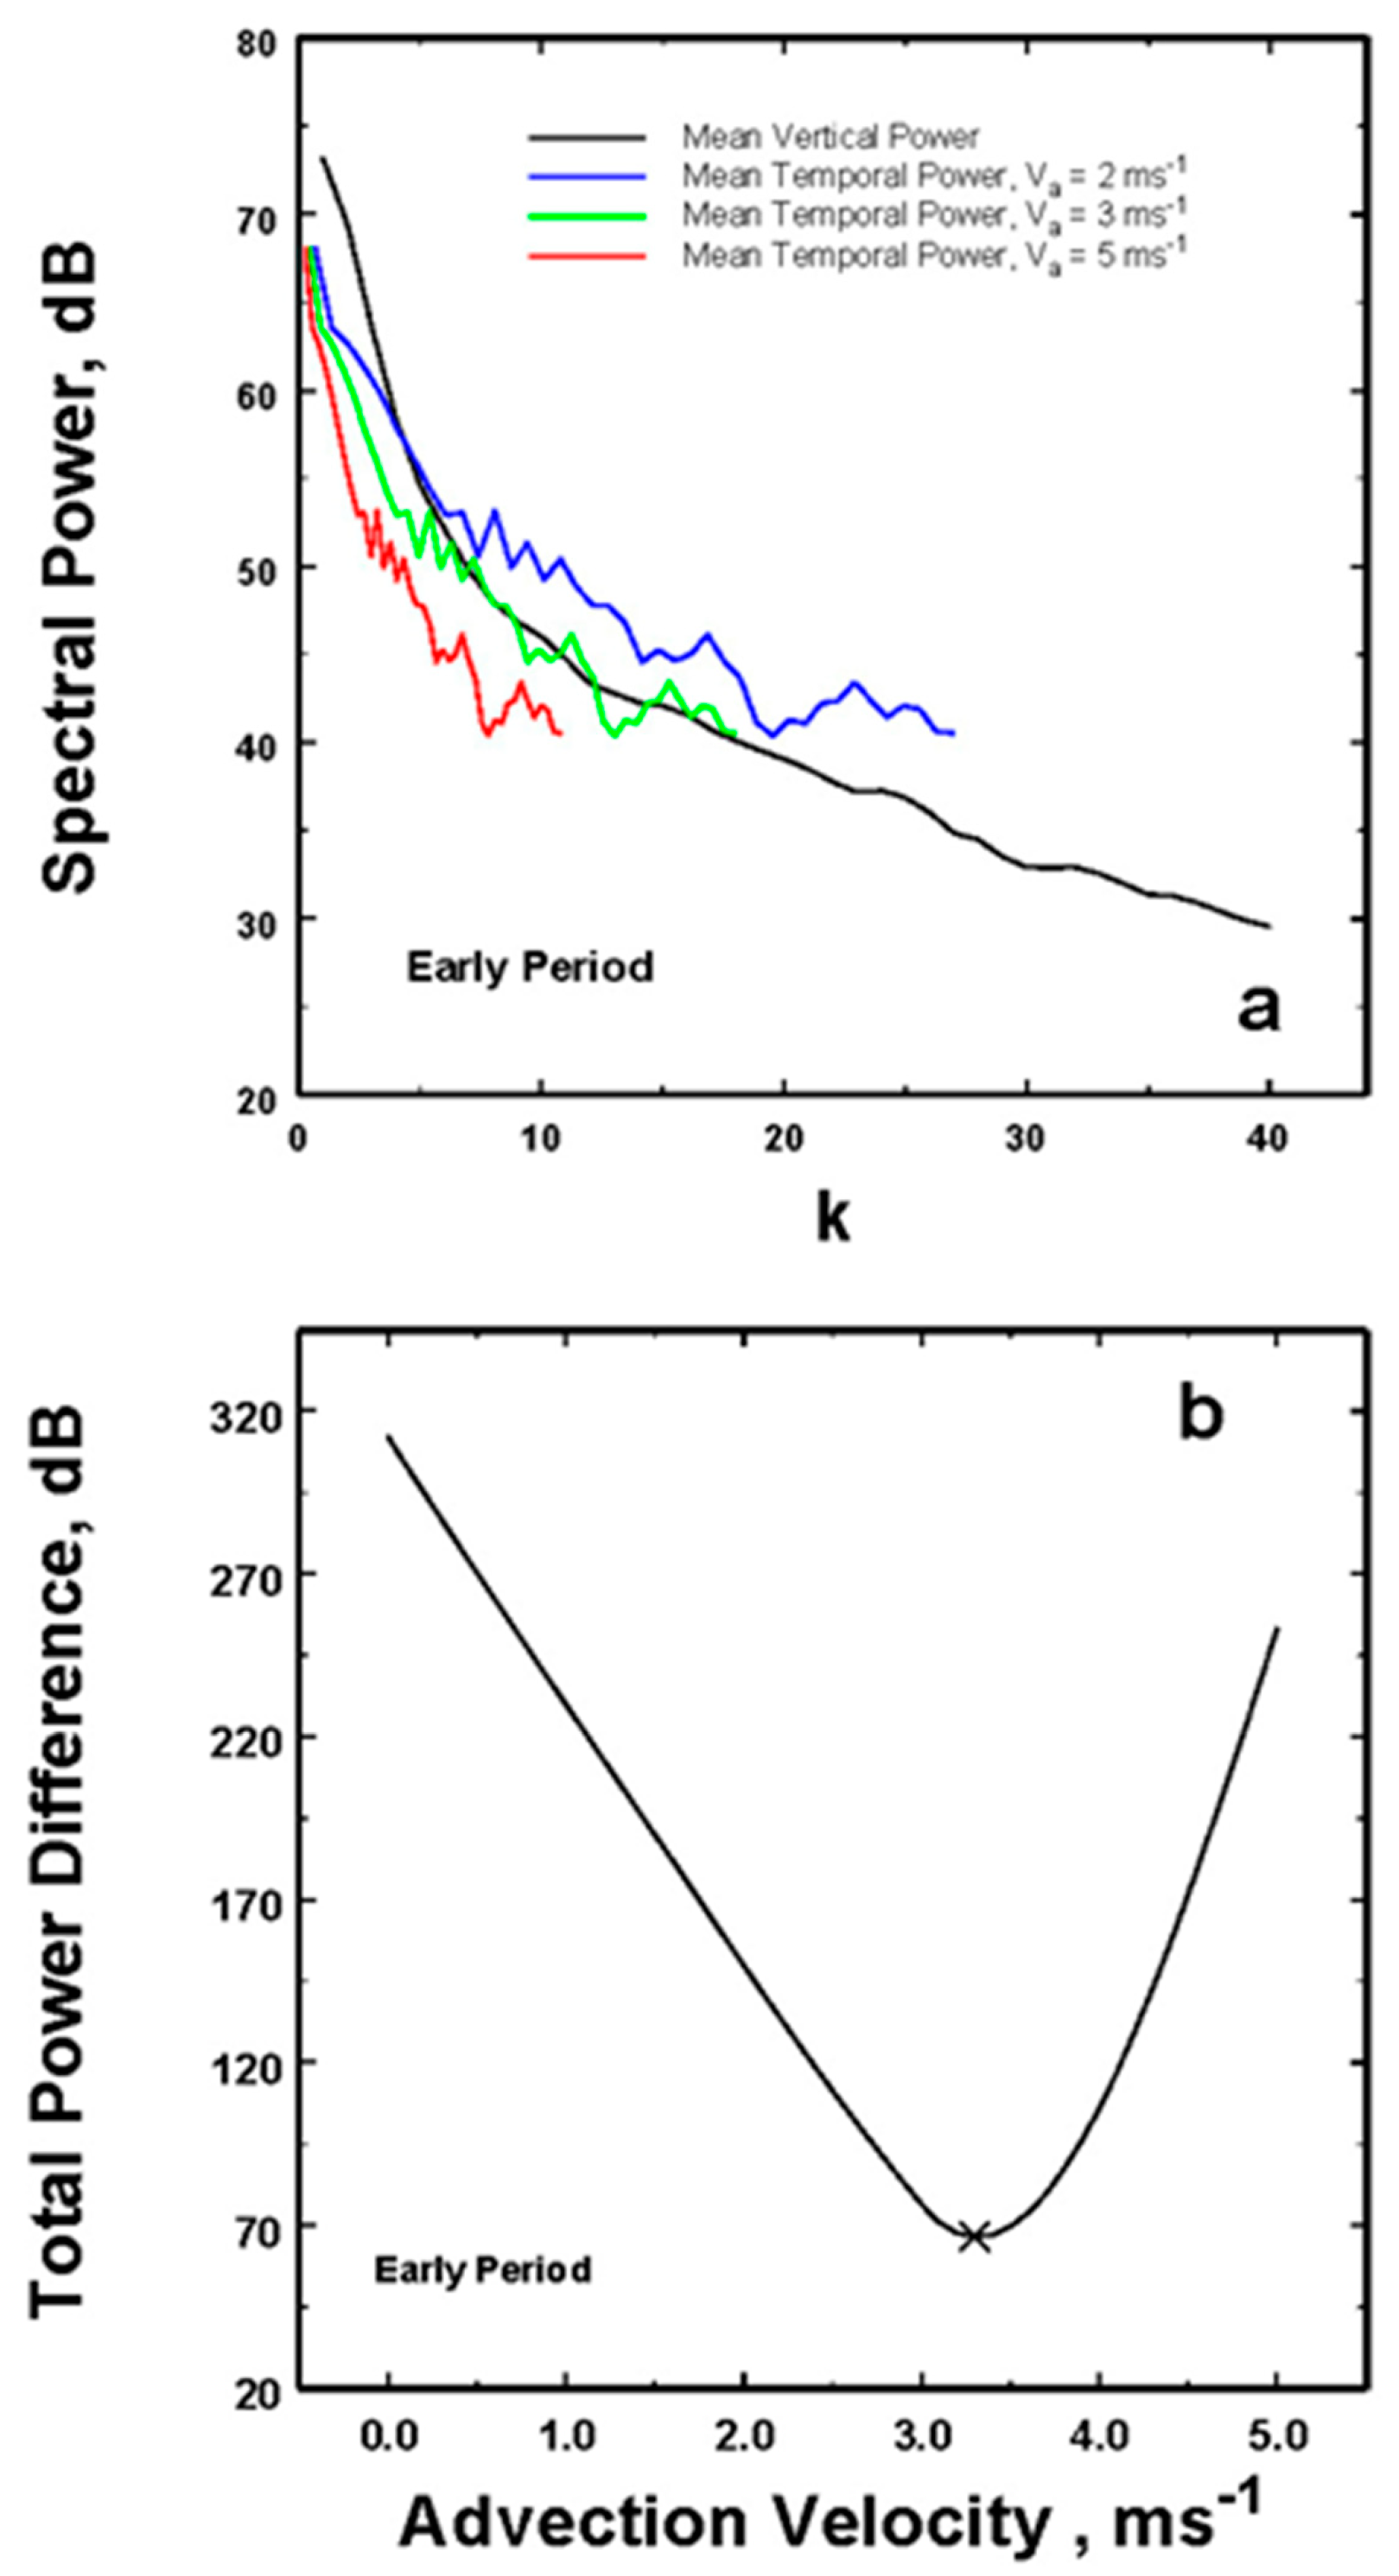
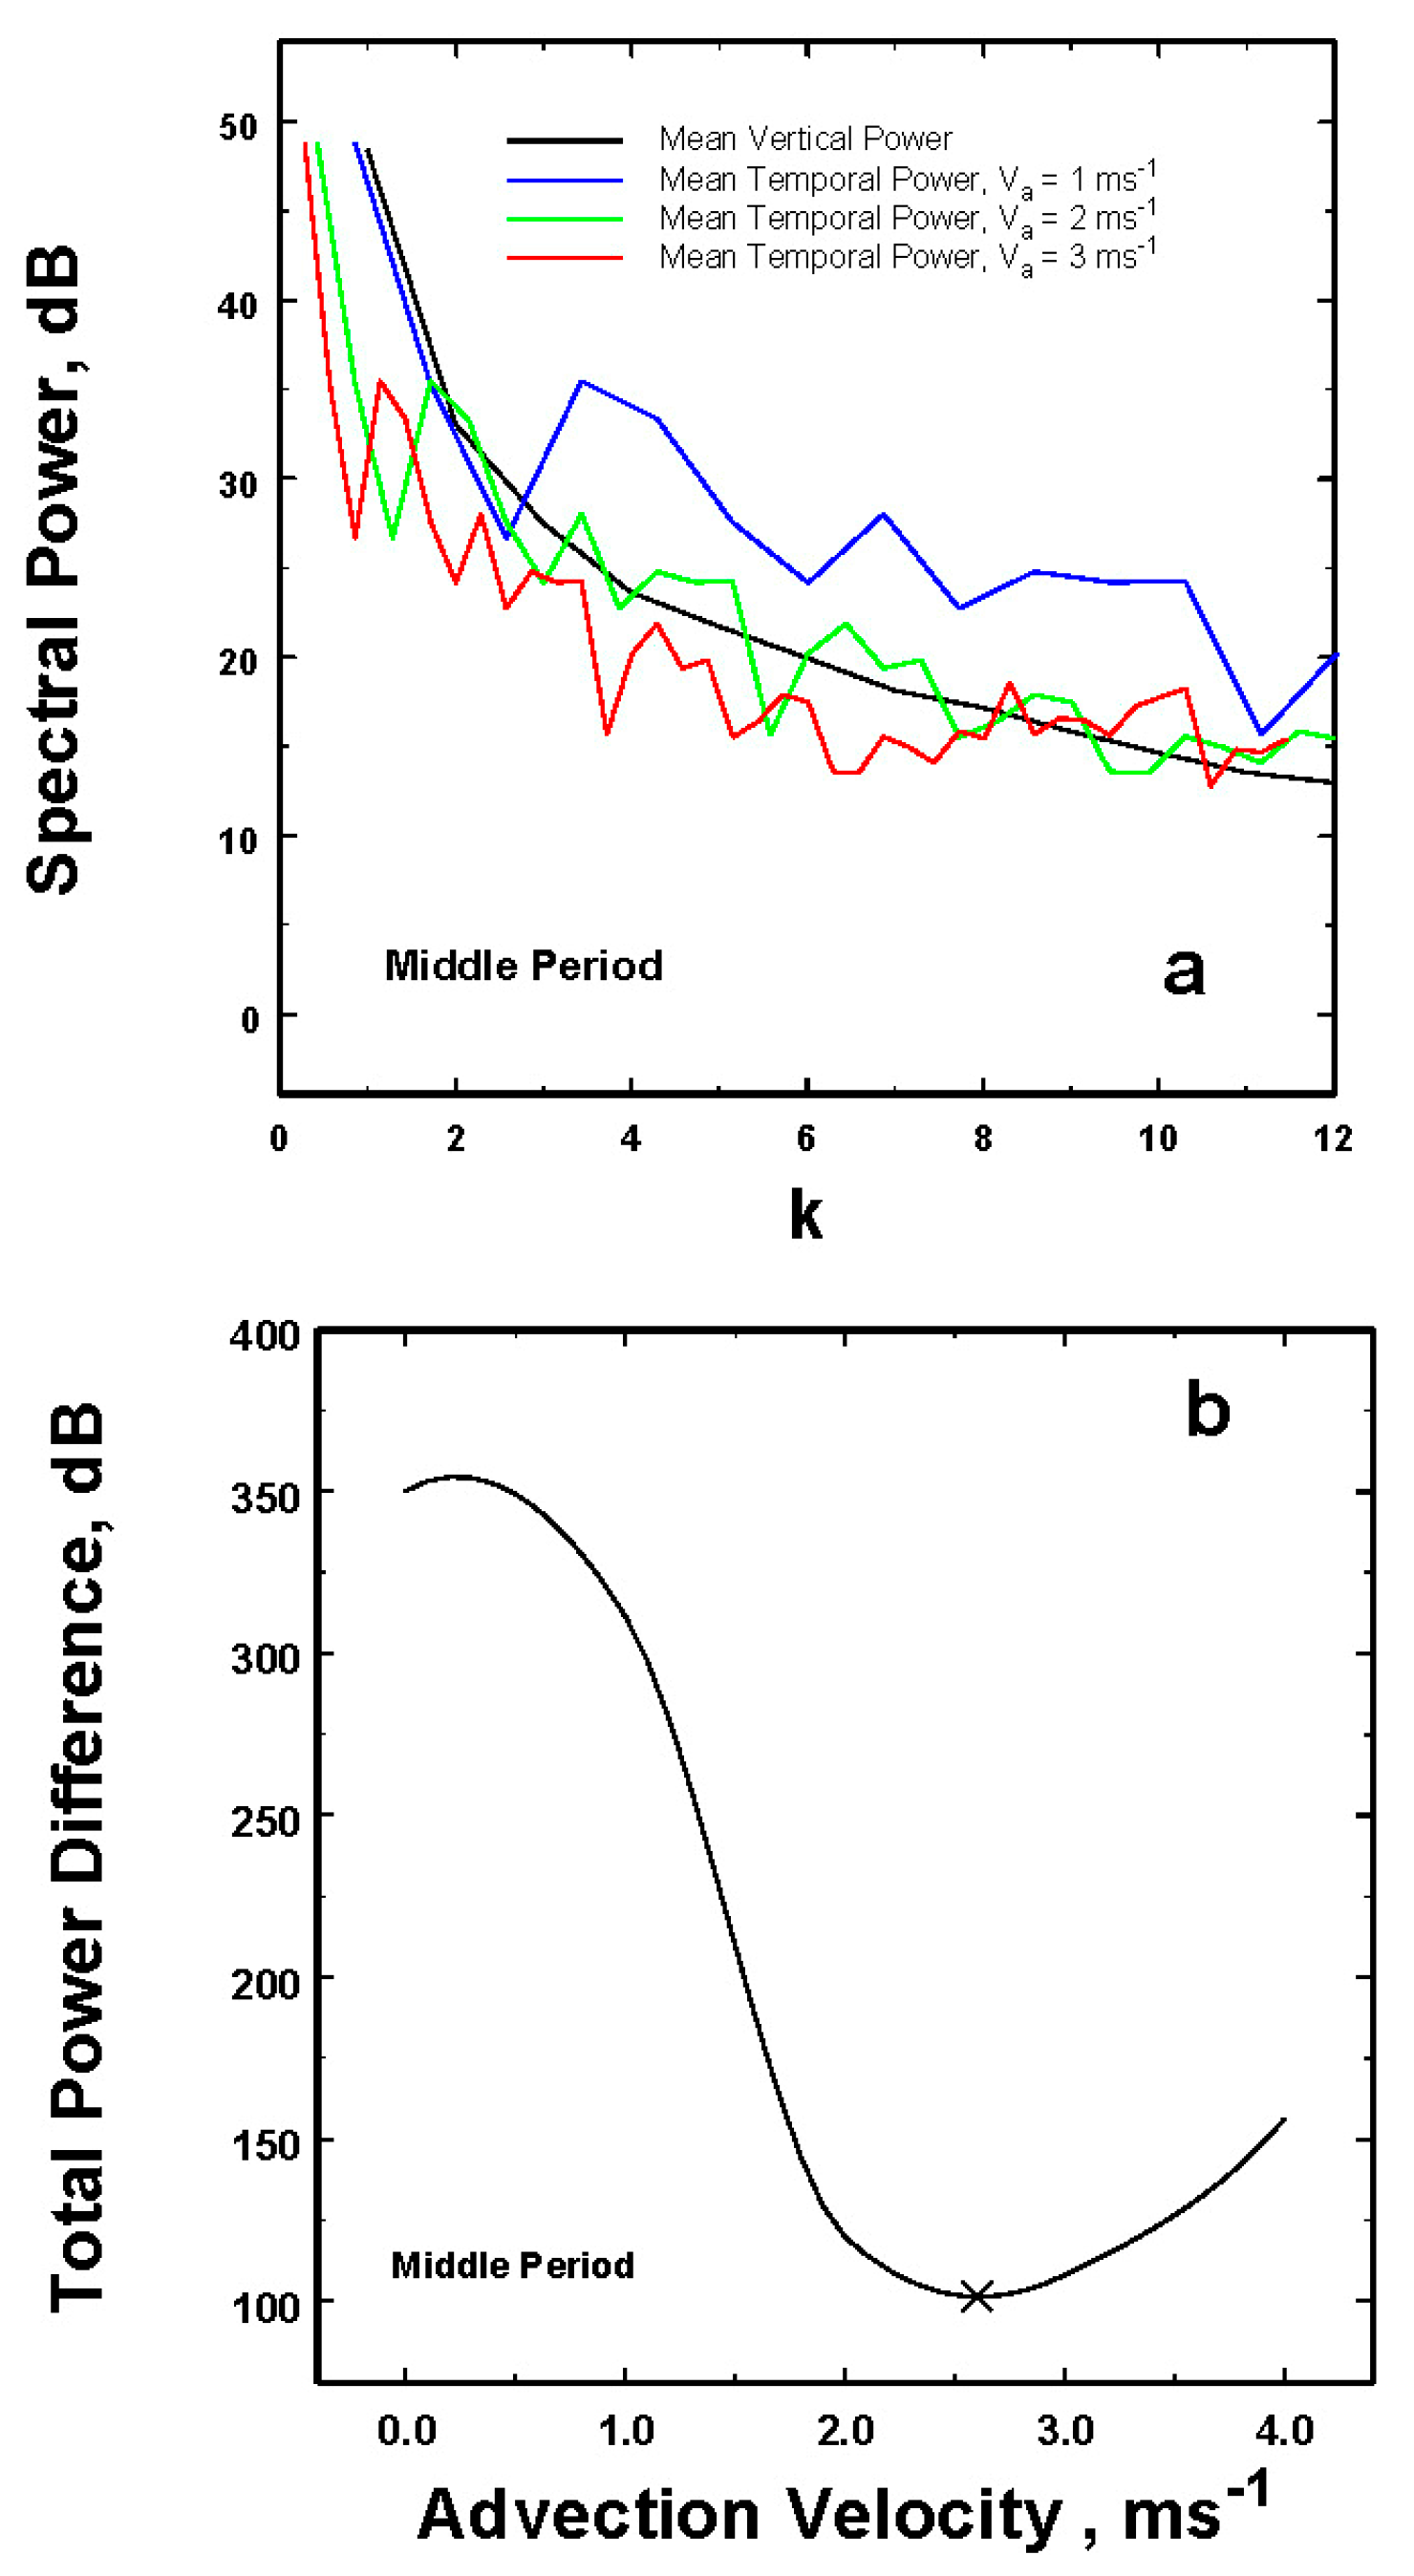
 while the total temporal interval of observations is T, then the equivalent spatial domain size corresponding to T would be = Va × T, where Va is a characteristic advection speed. For a fixed spatial wavelength, λ, then there would be k = L/λ number of wavelengths in the spatial domain, but there would be kω = /λ such wavelengths in the velocity transformed from the temporal to spatial domain. Hence, the kω associated with that λ would be much larger than k, i.e., kω = ( /L) × k. Thus, in order to match the two wavenumbers so that they correspond to the same λ, kω must be multiplied by L/ , as illustrated in Figure 3a for this example.
3. Further Data Analyses
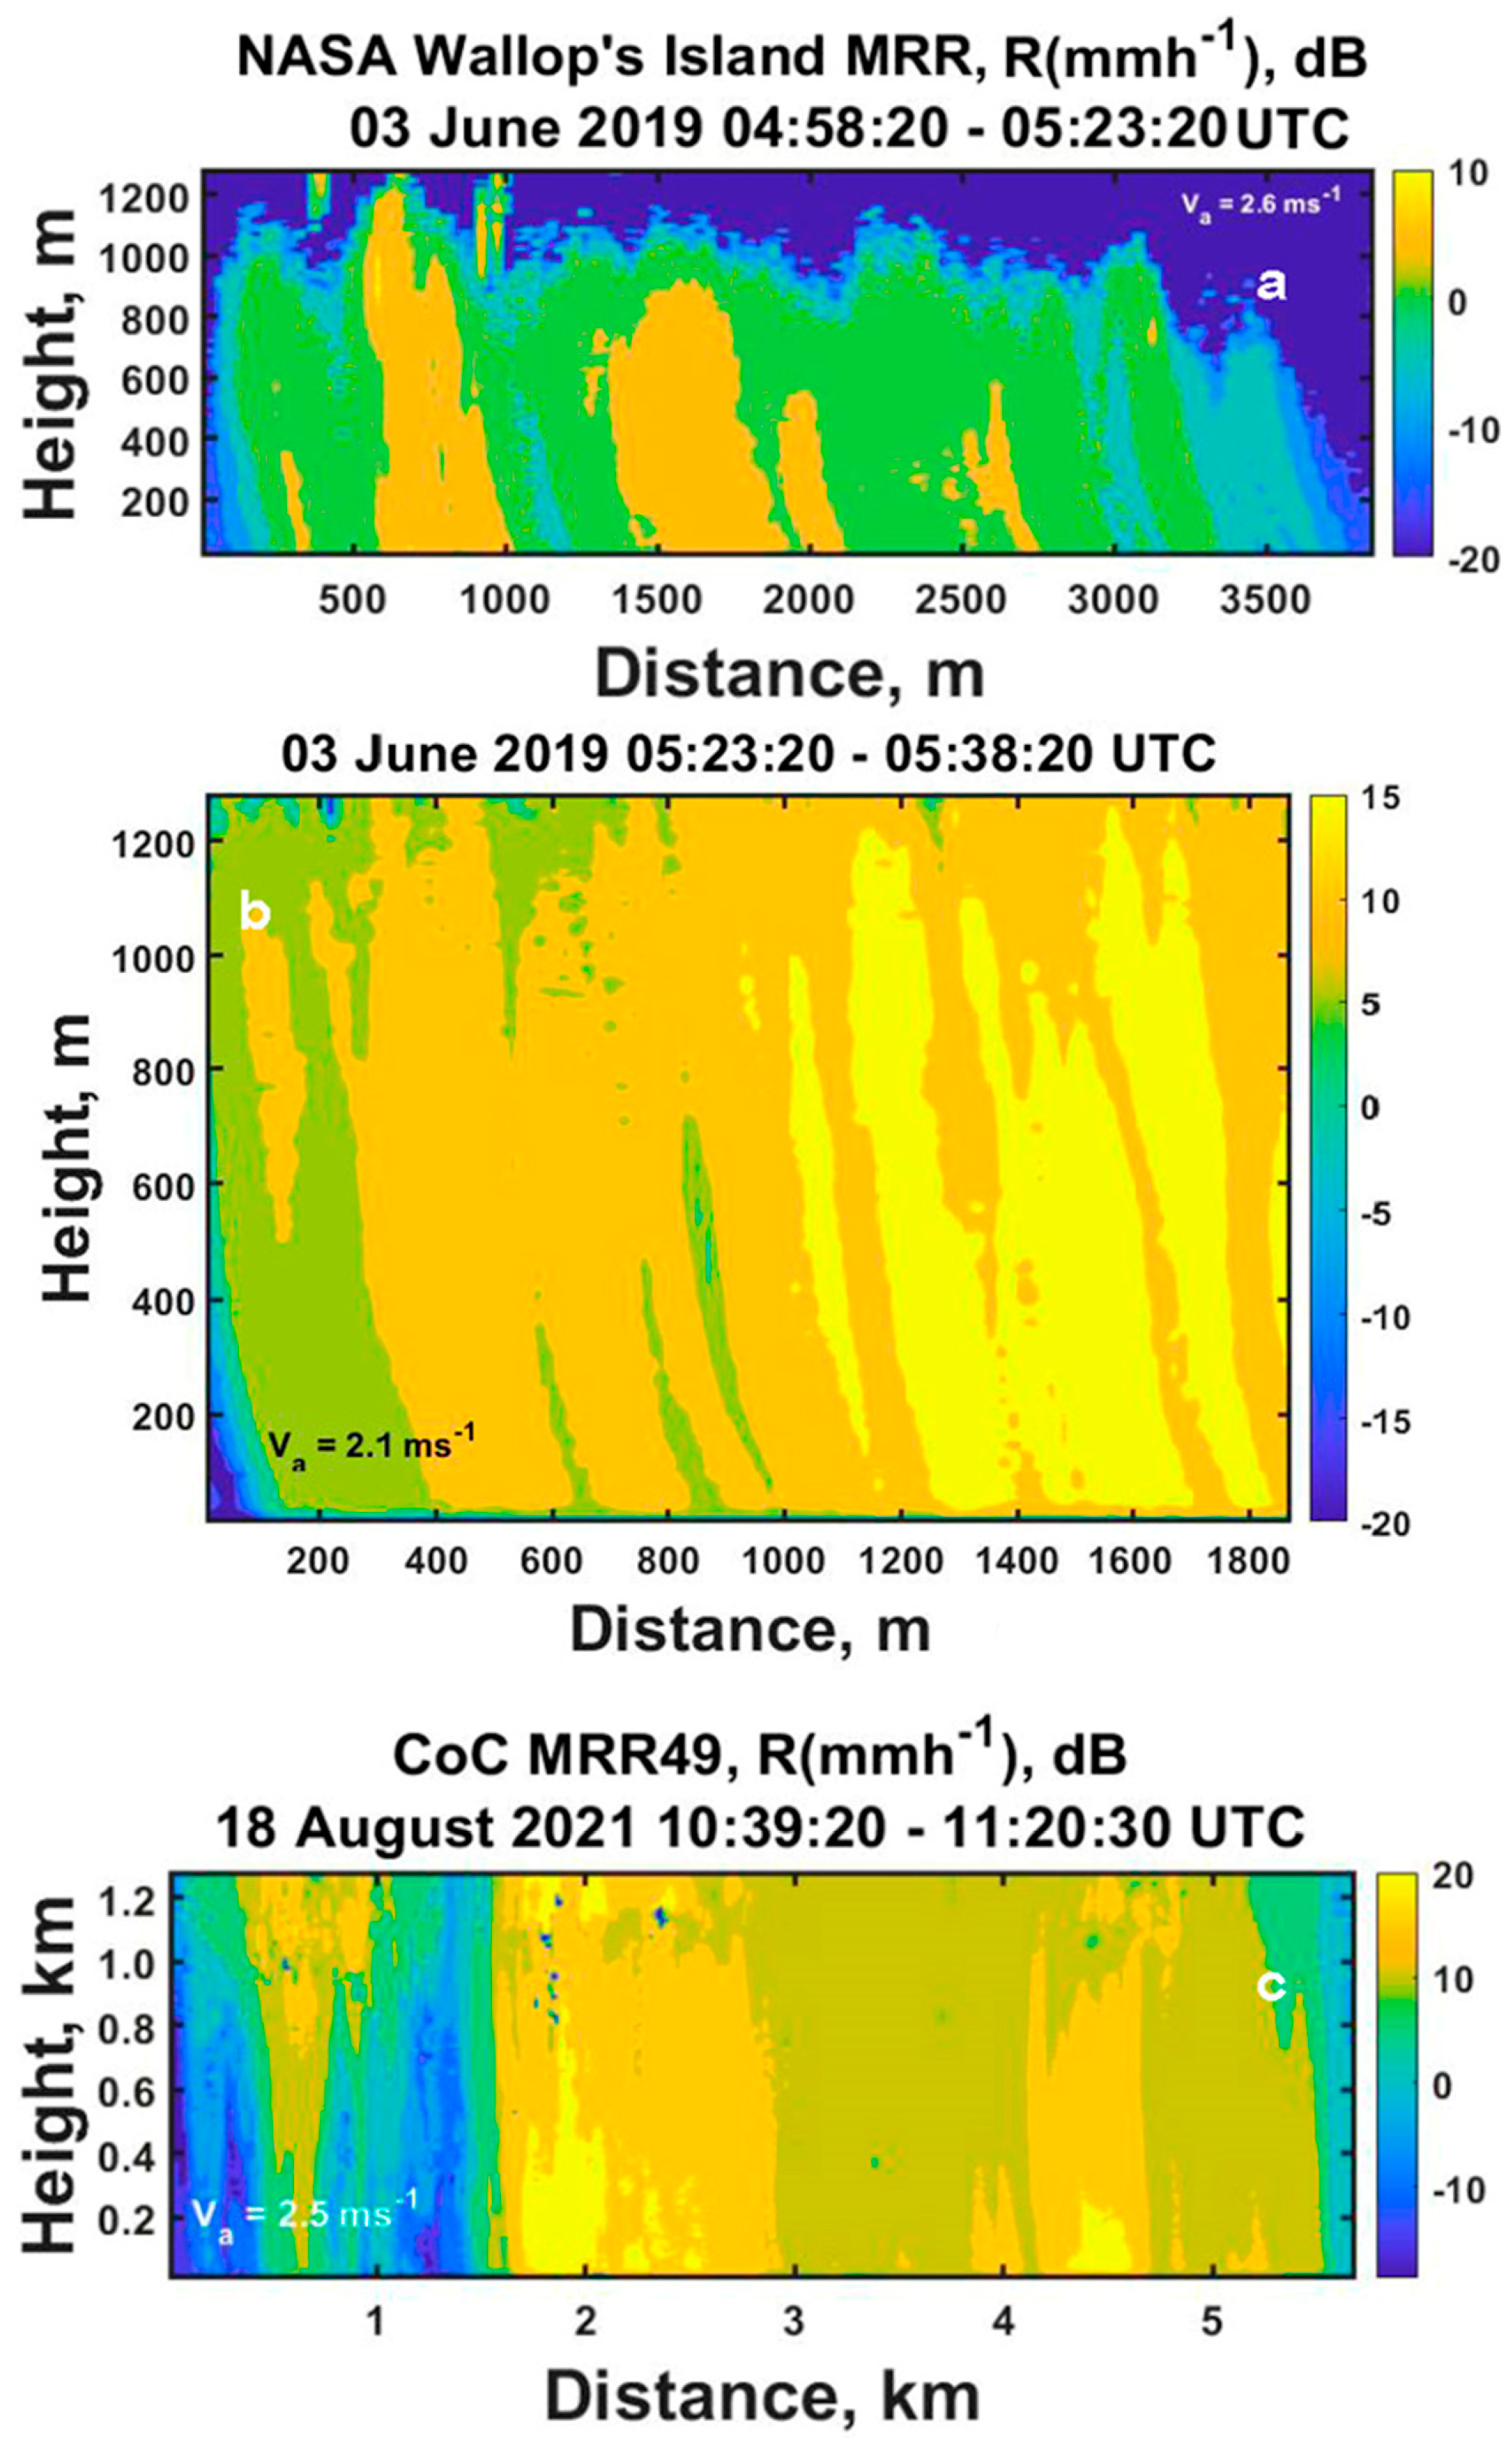
3.1. Three More Cases
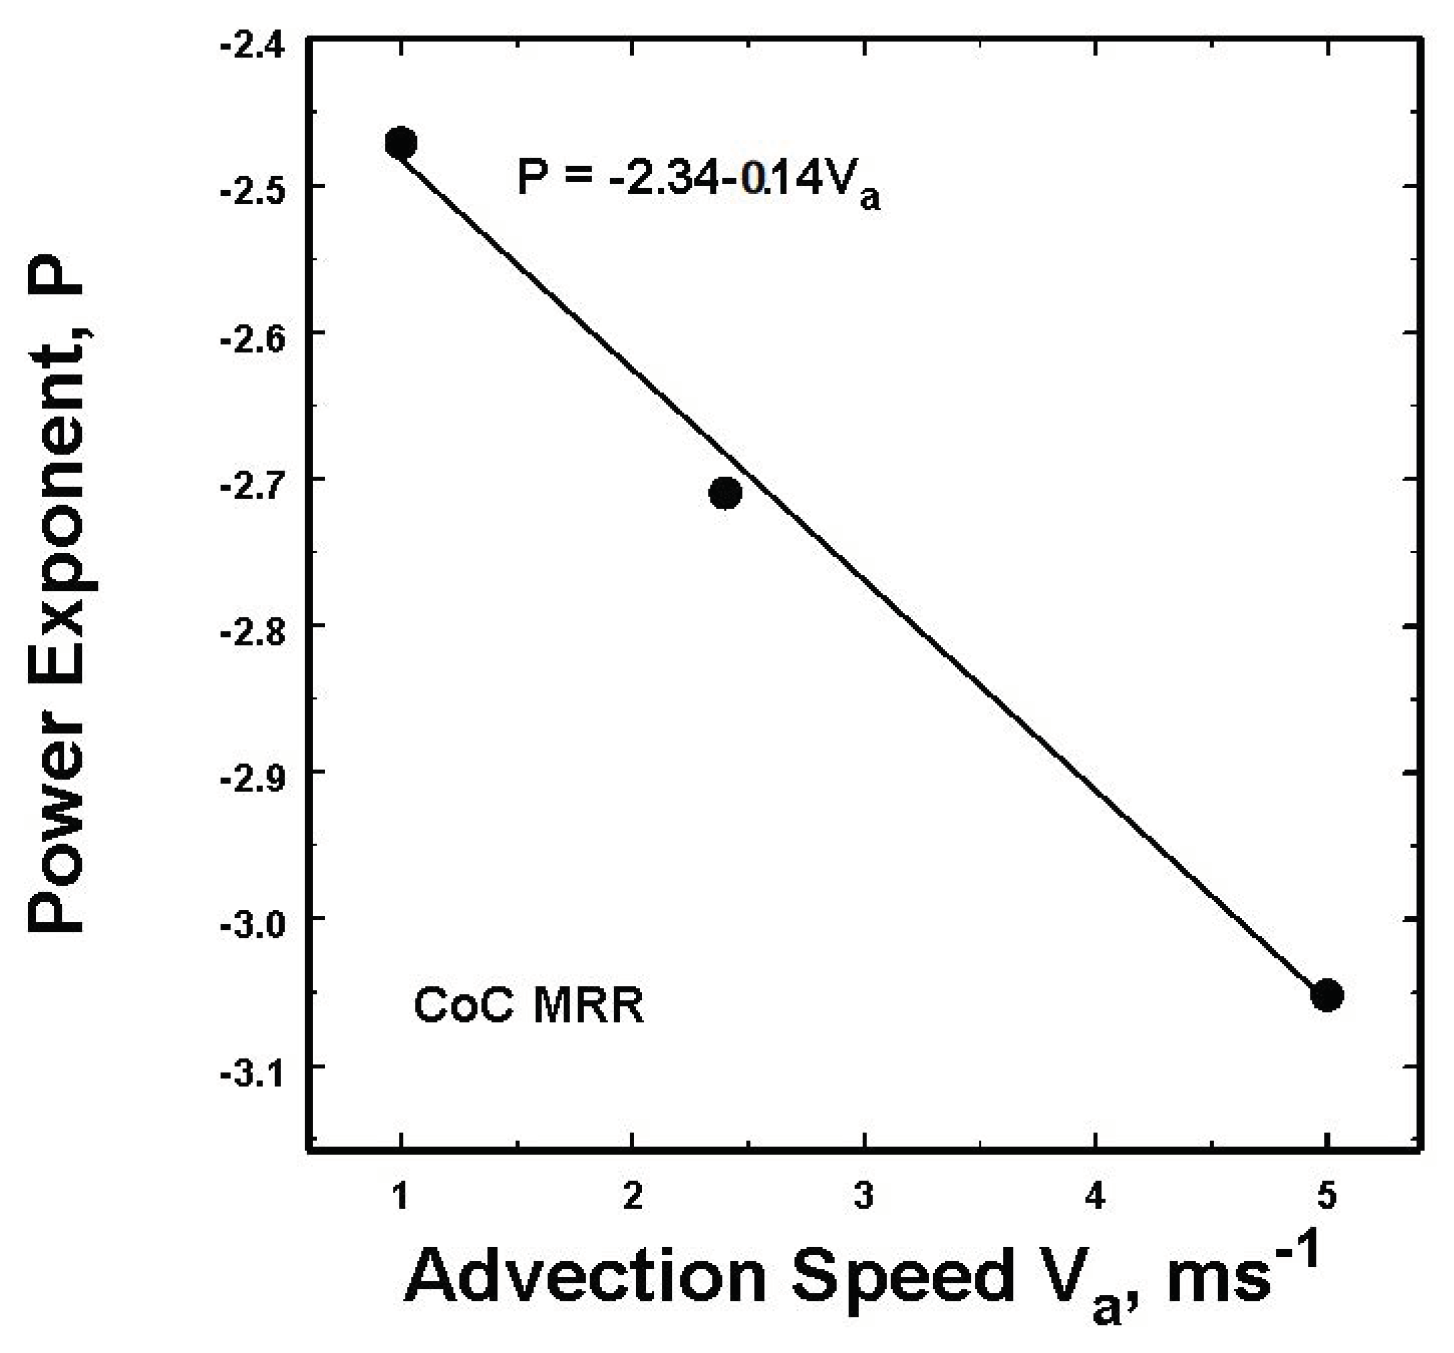
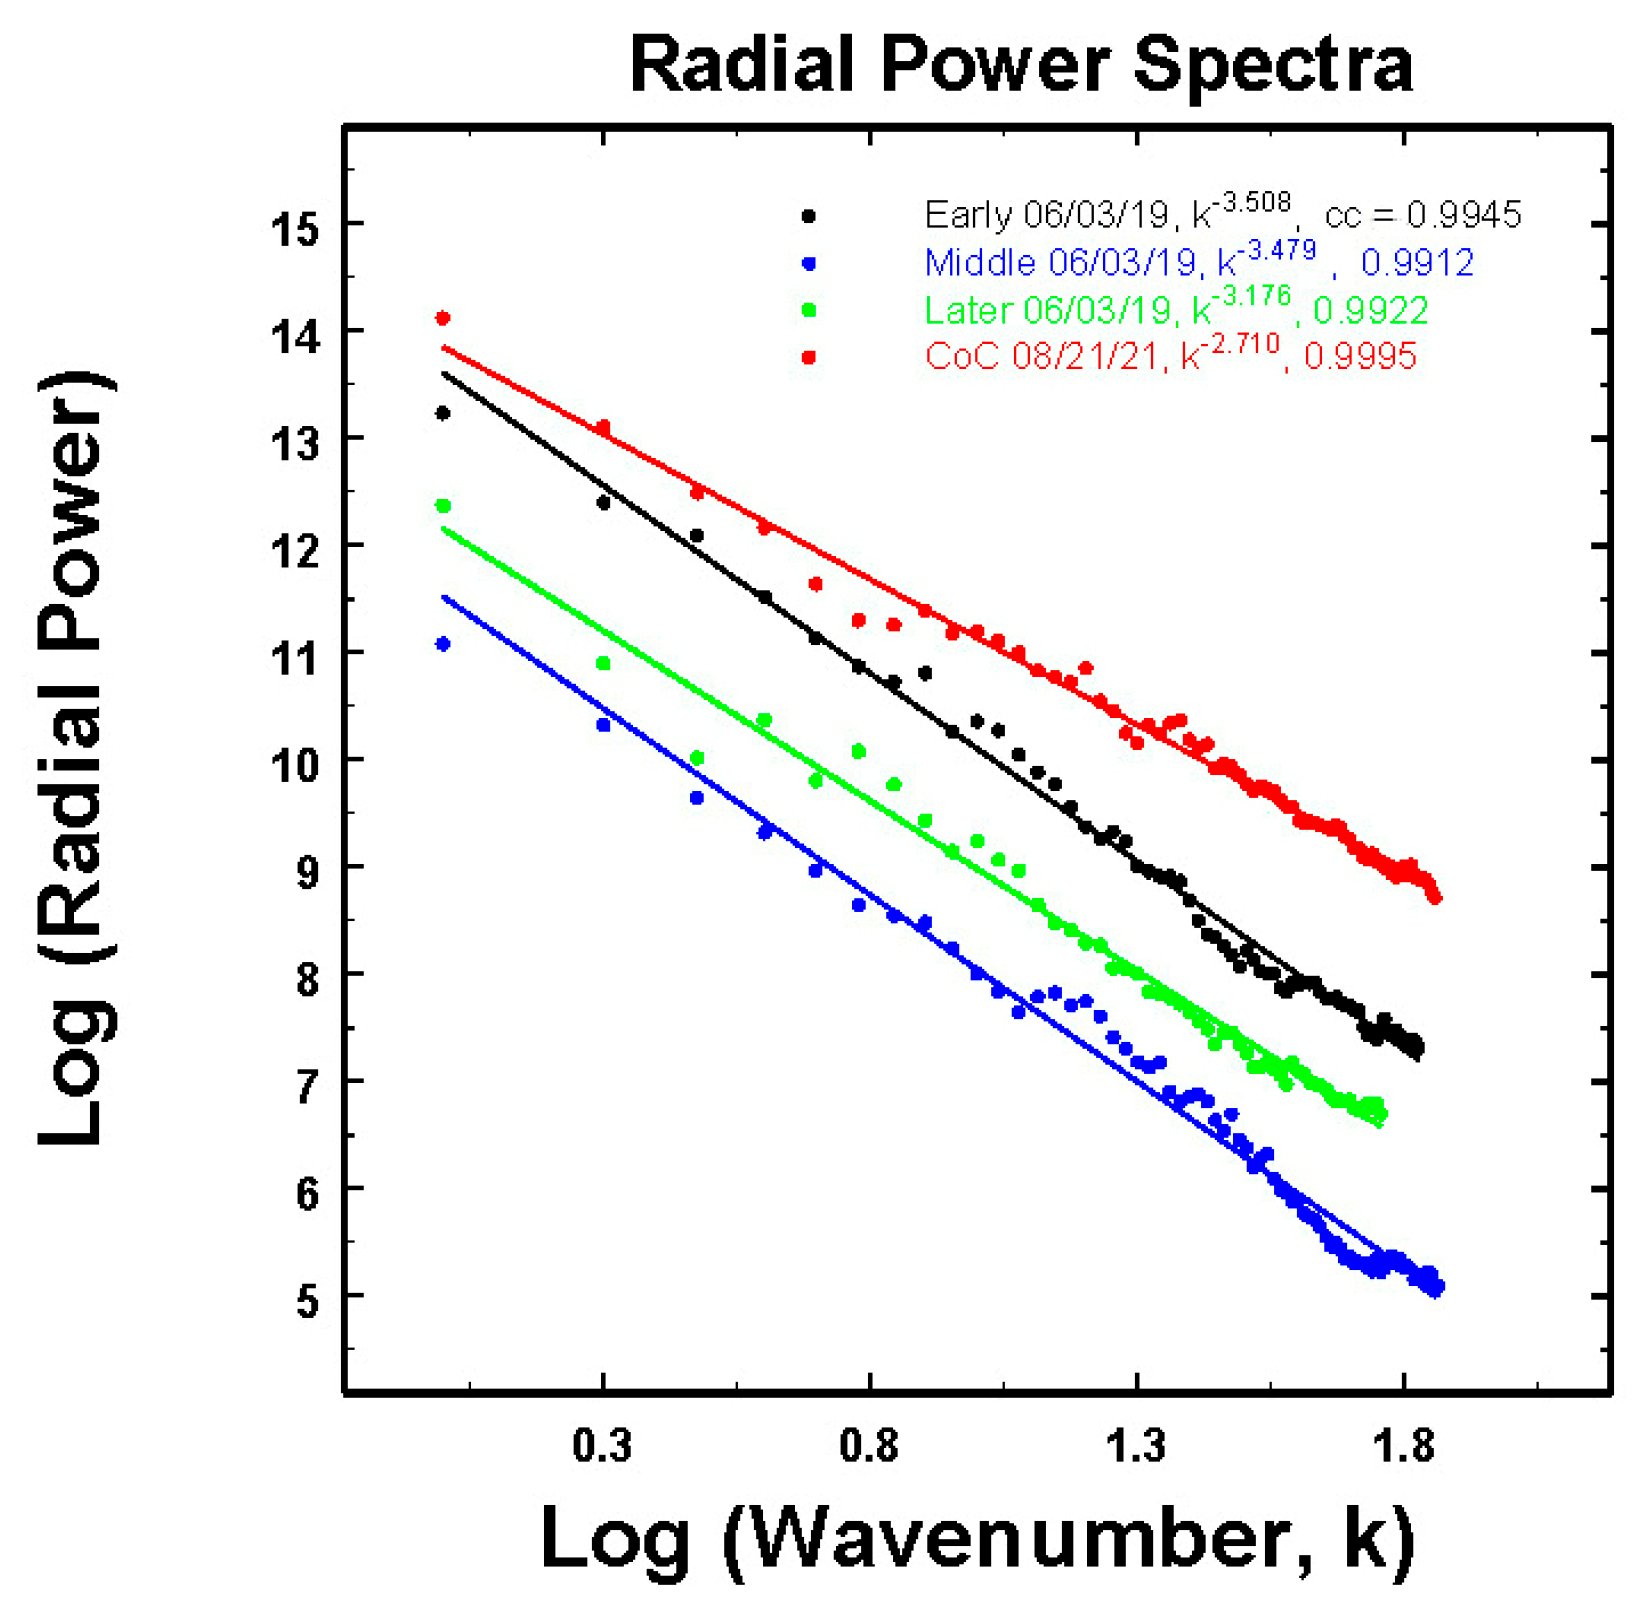
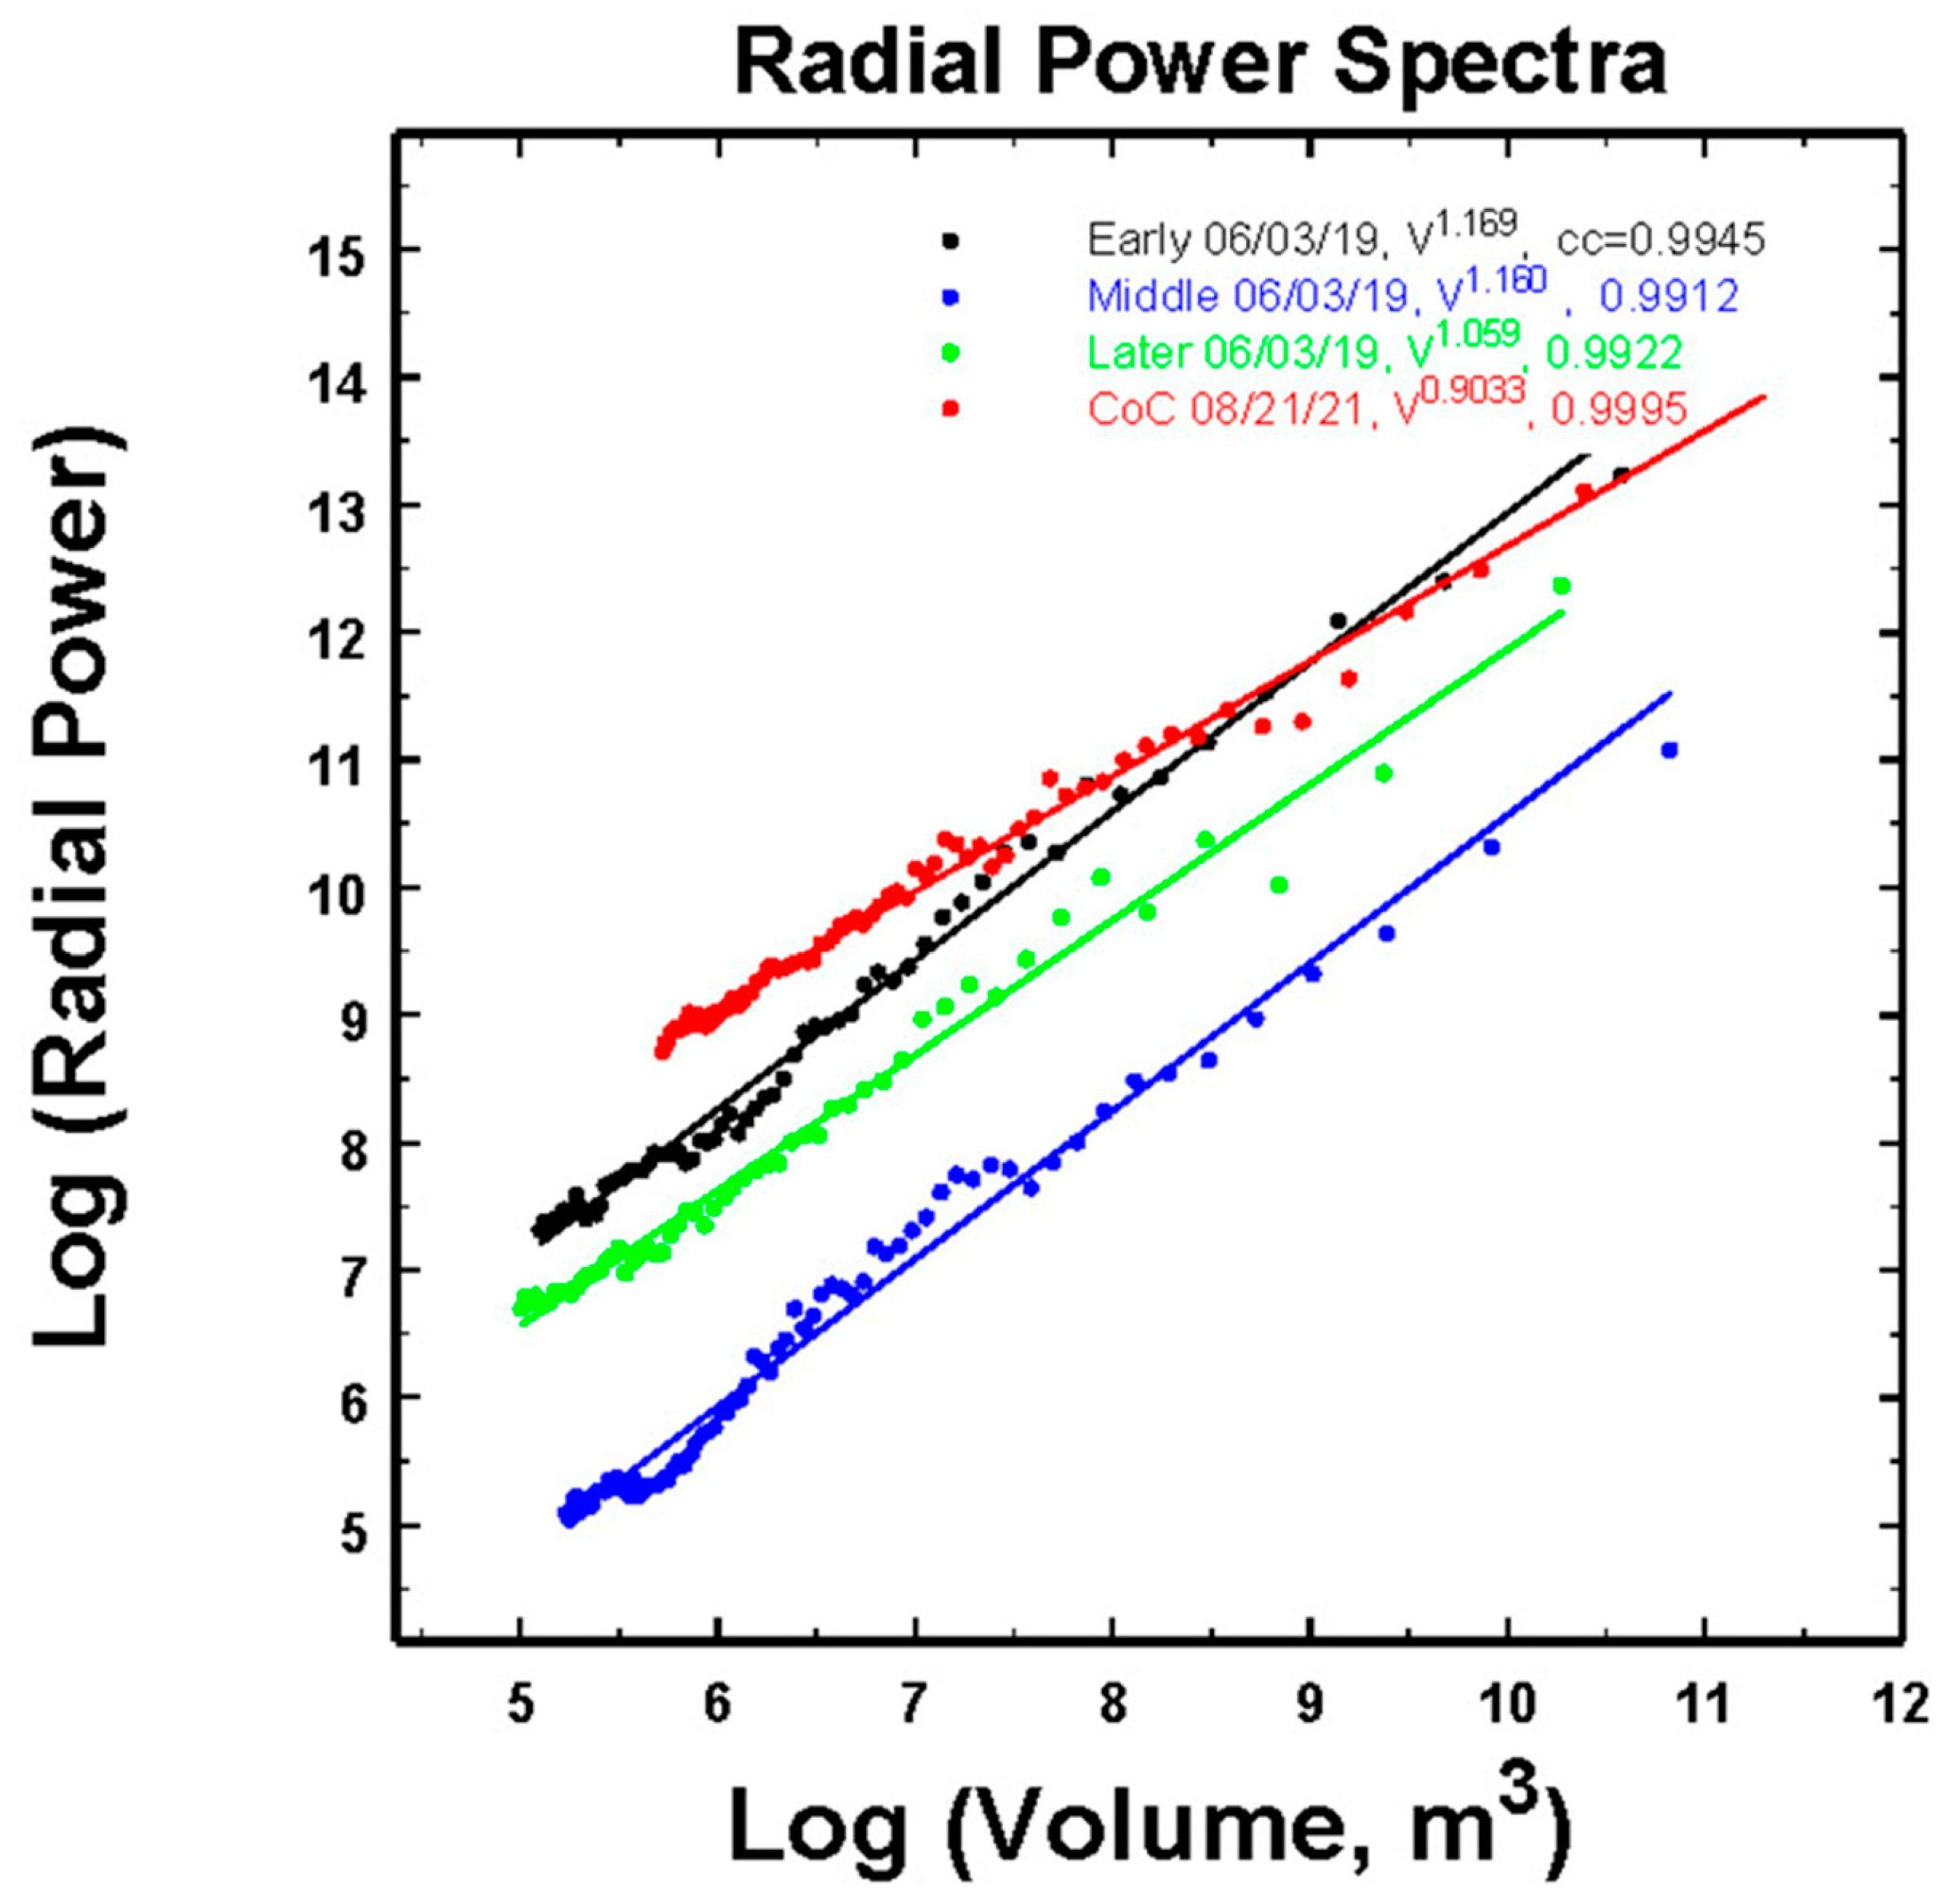
3.2. The Radial Power Spectra for Use in Rescaling
4. Summary of Results
Funding
Data Availability Statement
Conflicts of Interest
Appendix A

References
- Rauscher, E.A.; Hurtak, J.J.; Hurtak, D.E. Universal Scaling Laws in Quantum Theory and Cosmology. In The Physics of Reality: Space, Time, Matter, Cosmos; WORLD SCIENTIFIC: London, UK, 2013; pp. 376–387. [Google Scholar]
- Walter, C. Research of Scaling Law on Stock Market Variations. In Scaling, Fractals and Wavelets; Abry, P., Gonalves, P., Vhel, J.L., Eds.; ISTE: London, UK, 2009; pp. 437–464. ISBN 978-0-470-61156-2. [Google Scholar]
- Ellison, A.M.; Gotelli, N.J. Scaling in Ecology with a Model System; Monographs in Population Biology; Princeton University Press: Princeton, NJ, USA, 2021; ISBN 978-0-691-17270-5. [Google Scholar]
- Gleick, J. Chaos: Making a New Science, 20th Anniversary ed.; Penguin Books: New York, NY, USA, 2008; ISBN 978-0-14-311345-4. [Google Scholar]
- Jameson, A.R.; Larsen, M.L.; Kostinski, A.B. Disdrometer Network Observations of Finescale Spatial–Temporal Clustering in Rain. J. Atmos. Sci. 2014, 72, 1648–1666. [Google Scholar] [CrossRef] [Green Version]
- Jameson, A.R.; Larsen, M.L.; Wolff, D.B. Improved Estimates of the Vertical Structures of Rain Using Single Frequency Doppler Radars. Atmosphere 2021, 12, 699. [Google Scholar] [CrossRef]
- Piacentini, T.; Galli, A.; Marsala, V.; Miccadei, E. Analysis of Soil Erosion Induced by Heavy Rainfall: A Case Study from the NE Abruzzo Hills Area in Central Italy. Water 2018, 10, 1314. [Google Scholar] [CrossRef] [Green Version]
- Cristiano, E.; ten Veldhuis, M.-C.; van de Giesen, N. Spatial and Temporal Variability of Rainfall and Their Effects on Hydrological Response in Urban Areas – a Review. Hydrol. Earth Syst. Sci. 2017, 21, 3859–3878. [Google Scholar] [CrossRef] [Green Version]
- Hatsuzuka, D.; Sato, T.; Higuchi, Y. Sharp Rises in Large-Scale, Long-Duration Precipitation Extremes with Higher Temperatures over Japan. Npj Clim. Atmospheric Sci. 2021, 4, 29. [Google Scholar] [CrossRef]
- Zorzetto, E.; Marani, M. Downscaling of Rainfall Extremes From Satellite Observations. Water Resour. Res. 2019, 55, 156–174. [Google Scholar] [CrossRef] [Green Version]
- Chen, H.; Qin, H.; Dai, Y. FC-ZSM: Spatiotemporal Downscaling of Rain Radar Data Using a Feature Constrained Zooming Slow-Mo Network. Front. Earth Sci. 2022, 10, 887842. [Google Scholar] [CrossRef]
- Jameson, A.R. A Bayesian Method for Upsizing Single Disdrometer Drop Size Counts for Rain Physics Studies and Areal Applications. IEEE Trans. Geosci. Remote Sens. 2015, 53, 335–343. [Google Scholar] [CrossRef]
- Das, S.; Jameson, A.R. Site Diversity Prediction at a Tropical Location From Single-Site Rain Measurements Using a Bayesian Technique. Radio Sci. 2018. [Google Scholar] [CrossRef]
- Lovejoy, S.; Mandelbrot, B.B. Fractal Properties of Rain, and a Fractal Model. Tellus A 1985, 37A, 209–232. [Google Scholar] [CrossRef]
- Lovejoy, S.; Schertzer, D. Multifractals, Universality Classes and Satellite and Radar Measurements of Cloud and Rain Fields. J. Geophys. Res. Atmos. 1990, 95, 2021–2034. [Google Scholar] [CrossRef]
- Venugopal, V.; Foufoula-Georgiou, E.; Sapozhnikov, V. A Space-Time Downscaling Model for Rainfall. J. Geophys. Res. 1999, 104, 19705. [Google Scholar] [CrossRef]
- Seed, A.W.; Srikanthan, R.; Menabde, M. A Space and Time Model for Design Storm Rainfall. J. Geophys. Res. Atmos. 1999, 104, 31623–31630. [Google Scholar] [CrossRef]
- Jameson, A.R.; Heymsfield, A.J. Bayesian Upscaling of Aircraft Ice Measurements to Two-Dimensional Domains for Large-Scale Applications. Meteorol. Atmos. Phys. 2014, 123, 93–103. [Google Scholar] [CrossRef] [Green Version]
- Frei, C.; Schar, C. A Precipitation Climatology of the Alps from High-Resolution Rain-Gauge Observations. Int. J. Climatol. 1998, 18, 873–900. [Google Scholar] [CrossRef]
- Rubel, F.; Hantel, M. BALTEX 1/6-Degree Daily Precipitation Climatology 1996-1998. Meteorol. Atmos. Phys. 2001, 77, 155–166. [Google Scholar] [CrossRef]
- Jameson, A.R. Spatial and Temporal Network Sampling Effects on the Correlation and Variance Structures of Rain Observations. J. Hydrometeorol. 2017, 18, 187–196. [Google Scholar] [CrossRef]
- Ahrens, B.; Beck, A. On Upscaling of Rain-Gauge Data for Evaluating Numerical Weather Forecasts. Meteorol. Atmos. Phys. 2008, 99, 155–167. [Google Scholar] [CrossRef] [Green Version]
- Jameson, A.R. On the Importance of Statistical Homogeneity to the Scaling of Rain. J. Atmos. Ocean. Technol. 2019, 36, 1063–1078. [Google Scholar] [CrossRef]
- Löffler-Mang, M.; Kunz, M.; Schmid, W. On the Performance of a Low-Cost K-Band Doppler Radar for Quantitative Rain Measurements. J. Atmos. Ocean. Technol. 1999, 16, 379–387. [Google Scholar] [CrossRef]
- Gunn, R.; Kinzer, G.D. The Terminal Velocity OffallL for Water Droplets in Stagnant Air. J. Meteorol. 1949, 6, 243–248. [Google Scholar] [CrossRef]
- Jameson, A.R.; Larsen, M.L. Preliminary Statistical Characterizations of the Lowest Kilometer Time–Height Profiles of Rainfall Rate Using a Vertically Pointing Radar. Atmosphere 2022, 13, 635. [Google Scholar] [CrossRef]
- Wiener, N. Generalized Harmonic Analysis. Acta Math. 1930, 55, 117–258. [Google Scholar] [CrossRef]
- Khintchine, A. Korrelationstheorie der stationaren stochastischen Prozesse. Math. Ann. 1934, 109, 604–615. [Google Scholar] [CrossRef]
- Johnson, G.E. Constructions of Particular Random Processes. Proc. IEEE 1994, 82, 270–285. [Google Scholar] [CrossRef]
- Jameson, A.R.; Kostinski, A.B. Fluctuation Properties of Precipitation. Part V: Distribution of Rain Rates—Theory and Observations in Clustered Rain. J. Atmos. Sci. 1999, 56, 3920–3932. [Google Scholar] [CrossRef]
- Nelsen, R.B. An Introduction to Copulas, 2nd ed.; Springer Series in Statistics; Springer: New York, NY, USA, 2006; ISBN 978-0-387-28659-4. [Google Scholar]


Disclaimer/Publisher’s Note: The statements, opinions and data contained in all publications are solely those of the individual author(s) and contributor(s) and not of MDPI and/or the editor(s). MDPI and/or the editor(s) disclaim responsibility for any injury to people or property resulting from any ideas, methods, instructions or products referred to in the content. |
© 2023 by the author. Licensee MDPI, Basel, Switzerland. This article is an open access article distributed under the terms and conditions of the Creative Commons Attribution (CC BY) license (https://creativecommons.org/licenses/by/4.0/).
Share and Cite
Jameson, A.R. A Practical Approach for Determining Multi-Dimensional Spatial Rainfall Scaling Relations Using High-Resolution Time–Height Doppler Data from a Single Mobile Vertical Pointing Radar. Atmosphere 2023, 14, 252. https://doi.org/10.3390/atmos14020252
Jameson AR. A Practical Approach for Determining Multi-Dimensional Spatial Rainfall Scaling Relations Using High-Resolution Time–Height Doppler Data from a Single Mobile Vertical Pointing Radar. Atmosphere. 2023; 14(2):252. https://doi.org/10.3390/atmos14020252
Chicago/Turabian StyleJameson, Arthur R. 2023. "A Practical Approach for Determining Multi-Dimensional Spatial Rainfall Scaling Relations Using High-Resolution Time–Height Doppler Data from a Single Mobile Vertical Pointing Radar" Atmosphere 14, no. 2: 252. https://doi.org/10.3390/atmos14020252