Abstract
The Pacific region of Colombia is known to be one of the most vulnerable to changes in precipitation patterns. A study was conducted using standardized precipitation index (SPI) analyses to understand the potential changes in precipitation in this region during the 21st century. The analyses were conducted using historical precipitation data from 1950 to 2005 and projected precipitation data from 2022 to 2100 under the Coordinated Regional Climate Downscaling Experiment (CORDEX) climate scenarios (RCP 4.5 and RCP 8.5). The results of the study showed that compared to historical data, SPI3 precipitation in this region is predicted to increase by 2040 under both climatic scenarios. However, in the 2041–2070 period, the region is expected to be wetter under RCP 8.5, although the difference between the two scenarios was not statistically significant. Similarly, SPI 6 precipitation is predicted to increase in the 2022–2040 and 2071–2100 periods under both scenarios. SPI 12 precipitation is also predicted to increase in the 2022–2040 period under RCP 4.5. In the 2041–2070 period, dryness is predicted to be more frequent under RCP 4.5, and wetness is predicted under RCP 8.5. The findings of this study can help in determining the most pertinent reference periods and computation time increments for evaluating the effects of future climate change on agricultural production and food security in the Pacific region of Colombia. It suggests that changes in precipitation patterns are likely to occur in the coming decades, which may significantly impact crop growth, water availability, and other aspects of agricultural production.
1. Introduction
The effects of climate change have grown in various ways worldwide, including floods and drought, which have become more frequent and severe. The rising precipitation in wet areas and simultaneous drying in drier areas have complicated city planning and threatened livelihoods. The rate at which extreme occurrences become more frequent and severe varies substantially depending on location [1]. Both observations and estimates of regional climates show substantial variation [2,3]. According to instrumental datasets, the global average surface temperature has continued to rise, despite substantial regional heterogeneity [4]. As the temperature rises, there is an urgent need to anticipate increases in the frequency, severity, and intensity of extreme weather events and their corollaries, such as heat waves, drought, floods, and wildfires, and a decrease in cold spells and snowfall [5,6].
In the 20th century, the global average temperature increased in two distinct stages: first, 0.35 °C from the 1910s to the 1940s, then 0.55 °C from the 1970s to 2020. Similarly, the rate of global warming has increased further in the past 25 years prior to 2020, with the last 12 years including 11 of the 12 hottest years [5].
Local climatic conditions, such as drought, low precipitation, and dry winds, are region-specific [4,7]. Furthermore, droughts are one of the most serious natural hazards, particularly in terms of agriculture, with potentially catastrophic socioeconomic effects [8,9]. Droughts diminish surface and groundwater resources, resulting in lower water availability and quality, crop failure, lower agricultural output, decreased power generation, and various other socioeconomic effects [10,11]. To gain a clear understanding of the potential impacts of drought on society and the economy, important parameters must be studied, including frequency, length, intensity, and spatial extent of drought occurrences [11]. However, the detection of specific drought events and the precise and rigorous measurement of their attributes are challenging, as each drought event is distinct. Determining whether or not there is a drought is subjective and is strongly dependent on the overarching goals and objectives of the climate analyst [12].
The standardized precipitation index (SPI) is recommended by the World Meteorological Organization (WMO) as a global drought indicator because it accounts for varying reaction times of typical hydrological indicators to precipitation. It can also be examined over a range of reference periods [13]. Harishnaika et al. [14] used the SPI in the southeastern region of Karnataka in India for precipitation analysis. It was shown that drought was frequent in particular years and seasons with negative values of the SPI along with dry, wet, and normal events. Similarly, it was shown in the study conducted in [15] on the spatial characteristics of the SPI in Syria for the period of 1961–2012 that severe drought in the 1990s had never been seen before in the country. Hansel et al. [16] used the modified rainfall anomaly index (MRAI) as an alternative to the SPI to assess future precipitation in central Europe, and it was discovered that there is a high correlation between the MRAI and SPI. The links between the SPI and the standardized precipitation evapotranspiration index (SPEI) were explored by different researchers to observe drought impacts on different categories [17,18]. These researchers showed considerable variability in the time scales with the best correlation to drought impacts in dependence on the climate zone, and the correlations between the SPEI and drought impacts were slightly higher than those for the SPI. It was mentioned in the study [19] that the limitations of the SPI were the high sensitivity of the index to the length of different statistical periods and the choice of a suitable probability distribution function to calculate it.
Furthermore, the limitations and benefits of the SPI in characterizing wet and dry events were also discussed in the study [13,20,21]. According to these studies, the SPI needs only precipitation, which is more available with finer spatial and temporal coverage across the land areas of the world, while discounting many important meteorological factors, such as soil moisture, which are considered when drought assessment indices are built. However, the length, intensity, severity, size, and frequency of droughts are predicted by the SPI, which is simple to use. Rainfall data across various periods may be analyzed by it (from 1 to 24 months). Additionally, the comparison of drought across different regions. These factors make the SPI a frequently used tool in climate research [22,23,24,25].
Owing to its location, diverse topography, and social and environmental conditions, Colombia’s Pacific region is one of the most drought-vulnerable in the country [22]. Previous studies have reported the effects of drought on the social economics, agriculture, and energy transition of Colombia. The high child mortality rate in La Guajira Colombia between 2012–2016 was primarily due to water inaccessibility because of a drought caused by El Niño and inadequate adaptation strategies [25]. Similarly, the mega drought in Colombia in 2015–2016 generated an energy transition whose changing aspects were affected by the organization of niches and the capability to forecast succeeding drought [26]. Drought is a major abiotic factor that frequently impacts bean crops in the Andean region, where long-term water scarcity is expected [27]. In this study, we estimated future changes in the precipitation regime and, therefore, the rates of drought and humidity, in six strategic locations within Colombia’s Pacific region between 2022 and 2100 which has not been studied in previous studies in such regions. This can be performed by calculating SPIs at different timescales (3, 6, and 12 months) from historical precipitation data (1951–2005) and the representative concentration pathway (RCP) 4.5 and RCP 8.5 future climate scenarios. This work provides public entities with the information required to make decisions and implement solutions to mitigate the impacts of climate change in the region.
2. Materials and Methods
2.1. Study Area
The Pacific region of western Colombia (0.4° N–8° N, 75.9° W–78.9° W: Figure 1), encompasses a total area of 130,000 km2 and has a population of eight million. The region is subdivided into the departments of Choco (5° 42′ N and 76° 40′ W), Valle del Cauca (3°25′ N and 76°31′ W), Cauca (2°27′ N and 76°37′ W), and Nariño (1°10′ N and 77°16′ W). The Colombian massif rises from sea level to 4748 m in the Central Cordillera; this and the Western Cordillera form the two mountain ranges that make up the region. The Colombian massif stores 70% of Colombia’s water supply [27].
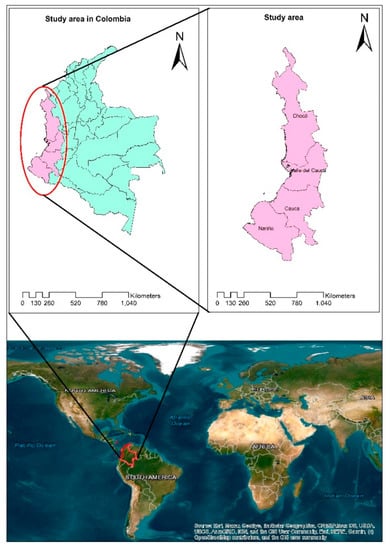
Figure 1.
The study area: Colombia’s Pacific region (0.4° N–8° N, 75.9° W–78.9° W).
The local climate ranges from extremely humid (an annual rainfall of 3000–7000 mm) in the lowlands to pluvial (an annual rainfall of more than 7000 mm) in the heart of the region. The region around the Atrato River (Choco) has one of the highest rainfall values in the world, reaching 10,000 mm/yr. This contrasts with the south of the Pacific region (the departments of Cauca and Nariño) where the Andes Cordillera determines different climatic conditions. Humid plains with rainfall of 2001–3000 mm/yr occur on the slopes of the Western Cordillera. Where the landscape is more mountainous and Andean in character, rainfall is up to 2000 mm/yr and the climate is drier [27]. In summary, the overall climate of the country is dominated by summer and winter. December, January, and February can experience intense drought, while May, June, and July are more humid [10]; these time intervals are important for SPI calculations.
2.2. Data and Methods
2.2.1. Acquisition of Precipitation Data
The ICHEC-EC-EARTH driving model and the the regional climate model (RCM) RCA4 were applied to acquire total daily precipitation data with a gridded resolution of 0.44° (50 km) from the CORDEX domain CAM-44 (Central America). CORDEX is an internationally coordinated framework developed by the World Climate Research Program (WRCP), producing better, higher-resolution regional climate change estimates for all world regions. It provides access to various historical data and potential future greenhouse gas emission-depended scenarios of radiative forcing [28,29,30]. These scenarios are referred to as RCPs. The RCP names are determined by the year 2100 radiative forcing goal to which each RCP corresponds [31]. The precipitation data in this study area were extracted from the above-mentioned model in netCDF form, and ArcGIS was used to obtain the exact location data. The extracted data were further preprocessed using power transformation of the precipitation method of climate model data for the hydrological modeling (CMhyd) tool for bias correction. For this process, data observed at the nearest meteorological station of the study area were taken from the department of hydrology and meteorology of Colombia.
2.2.2. SPI Analysis
The SPI analysis was conducted based on historical precipitation data for the 1951–2006 period, and on two RCPs for the 2022–2100 period: (i) RCP 4.5, a medium stabilization scenario that postulates stabilization to 4.5 W/m2 (650 ppm CO2 eq) without overrunning by 2100, and stability thereafter [32], and (ii) RCP 8.5, a very high-baseline emission scenario that postulates a growing radiative forcing leading to 8.5 W/m2 (1370 ppm CO2 eq) by the year 2100 [32,33].
The SPI was calculated using the ClimPACT2 program. This program is based on the RClimDEX program, which was created by the WMO’s Expert Team on Climate Change Detection and Indices (ETCCDI) [34,35].
The SPI is a probability index derived solely from the precipitation statistics for a certain location and time (months or years). This index converts cumulative probability to the standard normal random variable [10,31]. The median precipitation value and the SPI quantify the likelihood of observing a given amount of precipitation within a certain timeframe [36,37,38]. Negative and positive SPI values indicate drought and wet conditions, respectively; these values become more negative or positive, respectively, as dryness or humidity increases [39]. In this study, three-month (SPI 3) (January–March), six-month (SPI 6) (January–June), and twelve-month (SPI 12) (January–December) SPIs were used to depict, respectively, seasonal precipitation changes, changes corresponding to agricultural drought, yearly changes, and longer-term trends corresponding to hydrological drought [6,40,41].
The dataset evolved, and a new SPI value is added each month, derived from the values calculated of the preceding months. The probability of any observed precipitation data point was calculated from the historical records. This probability was used in conjunction with an estimate of the inverse normal to calculate the deviation of precipitation from a normally distributed probability density with zero mean and a standard deviation of unity. This number was the SPI for the precipitation data point [34,42].
Given a normal distribution function with zero mean and one variance, the SPI was calculated as follows [10]:
For 0 < H (x) ≤ 0.5,
for 0.5 < H (x) ≤ 1,
where [41,42,43].
The SPI results were categorized as Extremely Dry to Extremely Wet, as proposed by McKee et al. [35], developed by Edwards [44], and used by Zhina et al. [45] in the Andean High Mountain Basin, Ecuador, as shown in Table 1.

Table 1.
Standardized precipitation index levels.
3. Results
3.1. SPI Historical Evaluation
Using the historical dataset, we calculated SPI 3 values in Colombia’s Pacific region for 658 consecutive months from 1951 to 2005 (Figure 2). The probability of an extreme event ranged from 1.5 to 3.2%, depending on whether the event was Extremely Dry or Extremely Wet. During 1951–2005, the occurrence of Extremely Dry events was reduced by 3.2% in Tumaco, with the highest ratio among the six study areas, followed by Extremely Wet events in Buenaventura and Valle. Near-normal precipitation had the highest incidence (around 70%) across the Pacific Region. Moderate Dryness had an incidence of 10 and 11% in Cauca and Valle, respectively, while Severe and Extreme Dryness accounted for an average of 9% each. Choco and Buenaventura had the highest and lowest incidence of Wetness (9.9%) and (7.3%).
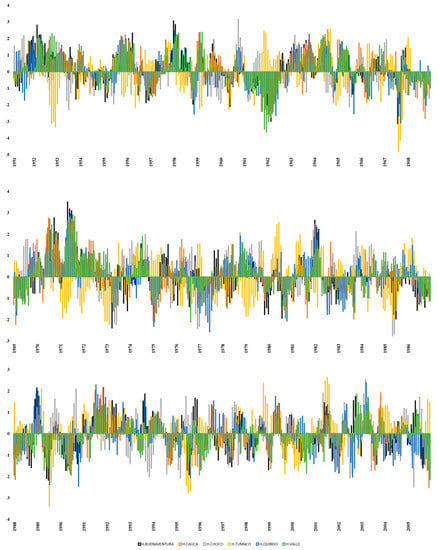
Figure 2.
Three−month standardized precipitation index in Colombia’s Pacific region, 1951–2005.
It was found that 14 years were Extremely Dry years, and the longest continuous Extremely Dry intervals were from 1961 to 1962, 1967 to 1968, and 1977 to 1978. Similarly, 15 years were Extremely Wet; the longest interval was from 1970 to 1971. In summary, the incidence of Severely Dry events ranged between 3 and 3.9%, while that of Very Wet events ranged between 3.3 and 5.6%.
We calculated SPI 6 values for a total of 655 months from 1951 to 2005 (Figure 3). The incidence of Extremely Dry events ranged from 0.6% in Buenaventura to 3.2% in Tumaco. Extremely Wet events had a regional average incidence of 2.3%. Near-normal precipitation consistently had an average incidence of 69% across SPI 6 in the Pacific Region. Severe Dryness had an incidence of 3.7%, whereas Very Wet events occurred 4.3% of the time. There was no statistically significant difference in the occurrence of Moderately Dry and Wet events across the Pacific region, indicating that, from 1951 to 2005, dry and wet conditions were balanced in the range of 7 to 11.8%. Extremely Dry events lasted for 15 years, and Extremely Wet years lasted for 13 years; 1961–1962, 1967–1968, and 1977 were the longest Extremely Dry years, and 1970–1971 and 2001–2002 were the regular Extremely Wet intervals in the study area.
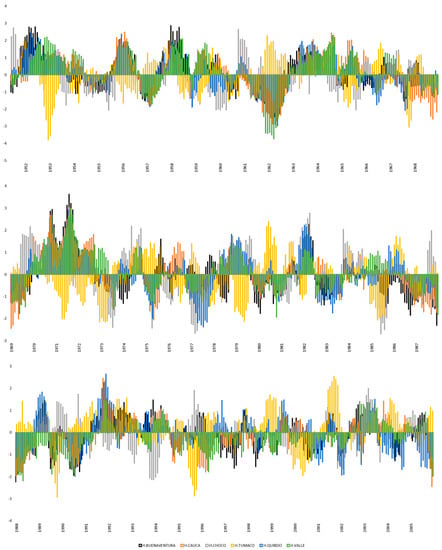
Figure 3.
Six−month standardized precipitation index in Colombia’s Pacific region, 1951–2005.
A 12-month SPI (SPI 12) compares the precipitation that fell over a period of 12 months to the precipitation that fell over the same length of time in the preceding years (for which data are available). Unless there is a strong wet or dry trend, SPI 12 tends to lean toward zero because intervals with above- and below-normal precipitation tend to be balanced over a 12-month period.
We calculated SPI 12 values for a total of 649 months in the 1951–2005 period (Figure 4). Extreme Dryness had the highest incidence of 3.7% in Cauca and the lowest incidence of 1.2% in Buenaventura. However, extreme wetness had a higher incidence of 5.4% in Buenaventura and the lowest incidence in Tumaco (0.5%). The incidence of Severe Dry events was 5.6% and 1.7% in Tumaco and Quibdo, respectively. The incidence of Very Wet conditions was 7.2% in Quibdo and 2.3% in Buenaventura. Moderate Dryness and Wetness were observed in Tumaco (10.8% and 13.3%, respectively). SPI 12 revealed Extreme Dry events for eight years and Extreme Wet events for nine years. The longest regular Extremely Dry years were 1962, 1968–1969, and 1977, whereas the longest Wet years were 1951, 1957–1958, 1971, and 1982.
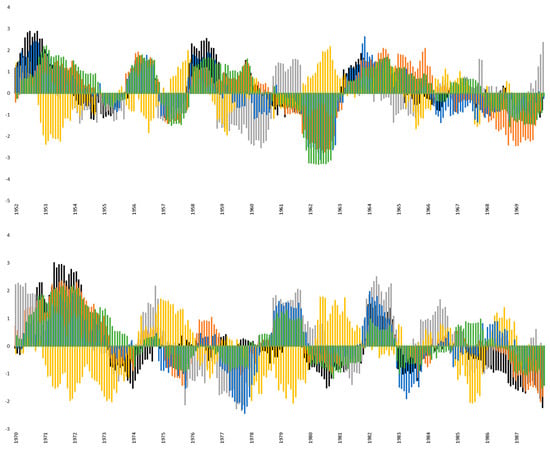
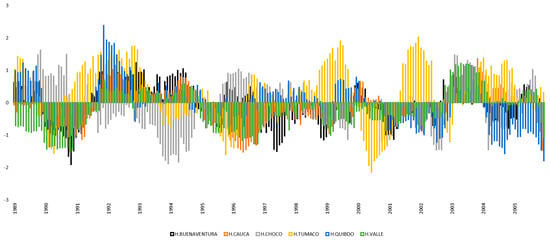
Figure 4.
Twelve−month standardized precipitation index in Colombia’s Pacific region, 1951–2005.
3.2. Future Projections
To predict the precipitation in Colombia’s Pacific region for the rest of the 21st century, we calculated SPI 3, SPI 6, and SPI 12 values for 1138 months, from 2006 to 2100, under two radiative forcing scenarios: RCP 4.5 and RCP 8.5. Here, we present the projections from 2022 onwards. To better resolve changes in precipitation, we divided that period into three subperiods, namely 2022–2040 (228 months), 2041–2070, and 2071–2100 (360 months each). Figure 5 and Figure 6 show the projected incidence of Extremely and Severely Dry, and Extremely and Very Wet events, respectively, at the six evaluated locations under the RCP 4.5 and RCP 8.5 forcing scenarios at different timescales.
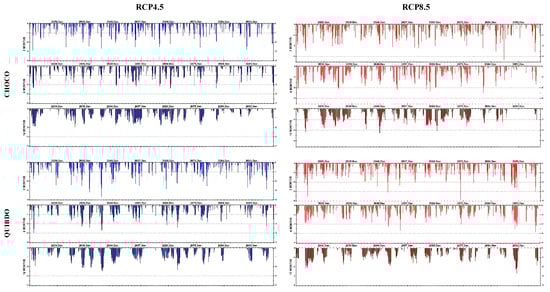
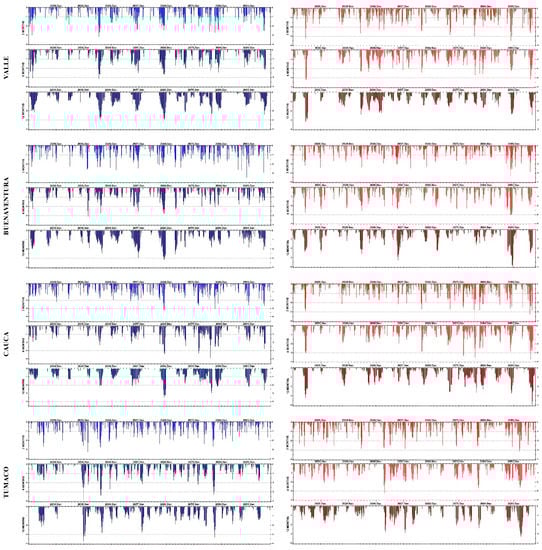
Figure 5.
Projected dryness in Colombia’s Pacific region (six locations), 2022–2100. SPIs at different timescales.
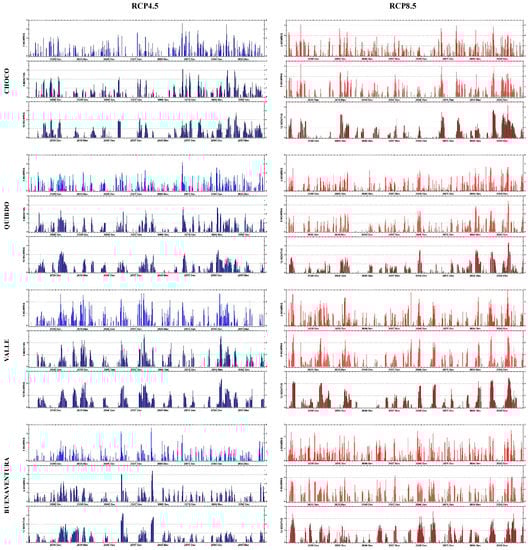
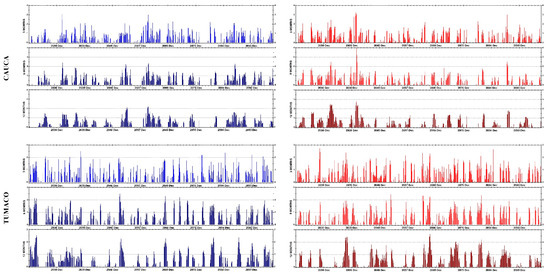
Figure 6.
Projected wetness in Colombia’s Pacific region (six locations), 2022–2100. SPIs at different timescales.
3.2.1. Evaluation of Dryness
At the SPI 3 scale, under RCP 4.5, the incidence of Extreme Dryness in the 2022–2040 period ranged from 0.5 to 4.4%, with Cauca and Valle having the lowest SPI 3 values and Tumaco having the highest ones (a recurring occurrence). Under RCP 4.5, Severely Dry events had a regional average incidence of 2.8%. In Buenaventura, the incidence of such events increased by 4% to 4.4 under RCP 8.5. Under RCP 4.5, Buenaventura also had the highest incidence of Extremely Dry events in the 2041–2070 period (38%). Under RCP 8.5, Extreme Dryness had a regional average incidence of 3%; in Buenaventura, the incidence of such events decreased by 2%. Across the Pacific region, the average incidence of Severe Dryness in the 2041–2070 period was 5% under RCP 4.5 and 4.3% under RCP 8.5. In Cauca, under RCP 8.5, the occurrence of Severe Dryness in the 2041–2070 period decreased from 5.8 to 3%. In the 2071–2100 period, under RCP 4.5, Extremely Dry events had a regional average incidence of 3.2% (from 6% in Cauca to 1.7% in Choco). Under RCP 8.5, the regional average incidence of Extreme Dryness was 3.9%; in Cauca, this condition was 1% more frequent than under RCP 4.5 forcing. The average incidence of Severe Dryness under RCP 4.5 was 4% consistently across the region. Under RCP 8.5, the incidence of Severe Dryness remained unchanged, except for Cauca, where it increased to 6%.
In SPI 6 projections for 2022–2040, under RCP 4.5, Extremely Dry events had an average regional incidence of 1.7%, with no occurrence in Cauca and just one month (0.4%) of such events in Buenaventura. Under RCP 8.5, however, Extremely Dry events occurred in both Cauca and Buenaventura, with an incidence of 2.2 and 5%, respectively. In contrast, in Tumaco and Quibdo, the incidence of such events declined from 4 and 2.6% under RCP 4.5 to 0.9 and 0% under RCP 8.5, respectively. In the 2041–2070 period, under RCP 4.5, Extreme Dryness had a maximum incidence of 6.1% in Buenaventura. Under RCP 8.5, Extreme Dryness had a regional average incidence of 2.3% and its occurrence in Buenaventura was reduced by half. Under RCP 4.5, Severe Dryness had a regional average incidence of 5.2%, with the most frequent occurrence in Buenaventura (6%). Under RCP 8.5, the regional average incidence of severe dry events was 4.6%, while at Quibdo, the incidence of such events was 2%, 4% lower than that under RCP 4.5. In 2071–2100, under RCP 4.5, the incidence of Extremely Dry events was 5.6% in Cauca and Quibdo (0.6%). Under RCP 8.5, the incidence of such events increased by 4% in Buenaventura, 3% in Quibdo, and 2% in Cauca compared with RCP 4.5. Under RCP 4.5, Severely Dry events occurred at a regional average incidence of 4.9% (with a maximum of 6.7% in Cauca). Under RCP 8.5, the regional average incidence of such events was 5.5%.
According to SPI 12 projections for 2022–2040, under RCP 4.5, the incidence of Extreme Dryness ranges from zero in Cauca to 5.3% in Tumaco. Under RCP 8.5, the incidence of such events presumably increased to 5% in Buenaventura, Cauca, and Valle, whereas it decreased to zero in Tumaco. Under RCP 4.5, Severely Dry events had a higher incidence of 7.9% in Choco and no occurrence in Cauca. Under RCP 8.5, the incidence of such events increased by 50% in Quibdo and decreased by approximately 4% in Valle. In the 2041–2070 period, under RCP 4.5, Severe Dryness had a higher incidence (7%) in Buenaventura and no occurrence in Choco. Under RCP 8.5, the incidence of Severe Dryness decreased by 5% to 3% in Valle, Cauca, and Quibdo. Under RCP 4.5, Severe Dryness had a regional average incidence of 5.6%. Under RCP 8.5, the incidence of Severely Dry events decreased by 5% in Buenaventura, increased by 3% in Quibdo, and increased by 2% in Cauca. In 2071–2100, under RCP 4.5, Extremely Dry events had a high incidence of 4.7% in Cauca and no occurrence in Quibdo. Under RCP 8.5, the occurrence of such events increased by 6% in Buenaventura, 4% in Cauca, and 3% in Tumaco and Quibdo. Severe Dryness had a regional average incidence of 4% under RCP 4.5 and 4.5% under RCP 8.5.
3.2.2. Evaluation of Wetness
In SPI 3 projections for 2022–2040, under RCP 4.5 forcing, the incidence of Extreme Wetness was 2% in Cauca, Choco, and Tumaco, 1.3% in Buenaventura and Quibdo, and 2.6% in Valle. Under RCP 8.5 forcing, the incidence of Extreme Wetness doubled in Valle, while it remained the same in the other locations. Under RCP 4.5, the incidence of Very Wet events was 6.5% in Tumaco and Quibdo, and 2% in Valle and Cauca; under RCP 8.5, the incidence of such episodes fell by 2% in Tumaco and Quibdo and increased by 4% in Valle and Cauca. From 2041 to 2070, Extremely Wet events showed a regional average incidence of 2% under RCP 4.5 and 1.3% under RCP 8.5, indicating a regional decline in extreme wetness during this period. Very Wet events had a regional average incidence of 4% under RCP 4.5 and 3.8% under RCP 8.5. In the latter scenario, the incidence of such events in Valle decreased by 3% (from 5.6% under RCP 4.5). From 2071 to 2100, under RCP 4.5, Extreme Wetness demonstrated a regional average incidence of 2% (from 5.3% in Choco to 0.8% in Cauca). Under RCP 8.5 Extreme Wetness had a regional average incidence of 3.3%. Under RCP 4.5, Very Wet events occurred at an average incidence of 4.7% consistently across the region. Under RCP 8.5, the incidence of Very Wet events in Buenaventura declined by half to 3%.
In SPI 6 projection for 2022–2040, the regional average incidence of Extremely Wet events Under RCP 4.5 was 1.6% (from 0.4% in Cauca to 1.7% in Quibdo and Valle). Under RCP 4.5, Very Wet events had a regional average incidence of 6.3% (Tumaco: 7%; Choco, Buenaventura, and Valle: 6.6%). Under RCP 8.5, such events had a regional average incidence of 5.6%. Under the latter scenario, the incidence of such events in Tumaco and Valle was 3% lower than that under the RCP 4.5 scenario. In the other four locations, however, the incidence of Very Wet events followed the same trend as that under RCP 4.5. In 2041–2070, Extreme Wetness registered a regional average incidence of 2% under RCP 4.5 and 1.3% under RCP 8.5. In Buenaventura, the incidence of such events decreased from 3.6% under RCP 4.5 to 0.3% under RCP 8.5. Very Wet events showed a regional average incidence of 3.3% under RCP 4.5 and 3.5% under RCP 8.5. Under the latter scenario, the occurrence of such events in Quibdo increased to 4.1% (from 1.9% under RCP 4.5). In the 2071–2100 period, under RCP 4.5, Extremely Wet events had an incidence of 6.1% in Choco, 3.3% in Quibdo, 1.4% in Valle, 0.8% in Buenaventura, and 0.6% in Cauca and Tumaco. In comparison with RCP 4.5, under RCP 8.5, these values increased by 3% in Valle and 2% in Buenaventura and decreased by 2% in Choco. Very Wet events had a regional average incidence of 4% under RCP 4.5 and 4.6% under RCP 8.5.
According to SPI 12 projections for 2022–2040, under RCP 4.5, Extremely Wet events had an incidence of 5.7% in Quibdo, 3, 2, and 1.3% in Tumaco, Choco, and Valle, respectively, 0.9% in Buenaventura, and no occurrence in Cauca. Under RCP 8.5, however, the incidence of such events fell to 6% in Valle and zero at Quibdo but rose to 4.4% in Cauca (Figure 6). Under RCP 4.5, Very Wet events registered a regional average incidence of 5.8% (from 9.6% in Buenaventura to 1.7% in Cauca). Under RCP 8.5, the incidence of such events decreased by 4.4% in Buenaventura. In 2041–2070, under RCP 4.5, Extremely Wet events were recorded at an incidence of 6% in Buenaventura, 2.2% in Tumaco, 1.4% in Cauca, 0.6% in Choco and Quibdo, and 0.3% in Valle. Under RCP 8.5, the incidence of such events decreased by 5% in Buenaventura and remained unchanged at all the other sites. The regional average incidence of Very Wet events was 3.5% under RCP 4.5 and 2% under RCP 8.5. At Choco, the incidence of such events decreased from 4.7% under RCP 4.5 to 0.6% under RCP 8.5. In 2071–2100, under RCP 4.5, Extremely Wet events registered an incidence of 5% in Choco, 3.3% in Quibdo, 1.9 and 1.4% in Valle and Tumaco, respectively, and there was no occurrence in Cauca and Buenaventura. Under RCP 8.5, the incidence of such events increased by 5% and 4% in Quibdo and Valle, respectively, and remained unchanged in all the other areas. Under RCP 4.5, Very Wet events had an incidence of 8.9% in Choco, 6.7% in Tumaco, 6.1% in Quibdo, 2.7 and 2.5% in Valle and Cauca, respectively, and 0.3% in Buenaventura. Under RCP 8.5 forcing, the incidence of such events increased by 7 and 5% in Buenaventura and Valle, respectively, and decreased by 3% in Quibdo.
3.3. Occurrence of Extreme Events
3.3.1. Extreme Dryness
Figure 7 depicts the number of Extremely Dry events in Colombia’s Pacific region from 2022 to 2100 under RCP 4.5 forcing. According to all SPI assessments, Buenaventura registered the longest stretch of dry conditions between the years 2041 and 2070, while Cauca had the longest stretch of dry conditions between 2071 and 2100. However, Choco registered a noticeable reduction in the number of Extremely Dry events in SPI 12 assessments (Figure 7C), whereas Quibdo showed a reduction in such events in the 2071–2100 period in all SPIs. In Valle, all SPIs registered a progressive increase in dryness. This increase was more pronounced in the 2041–2070 period. In contrast to other localities, where Extremely Dry events were concentrated in a single timeframe. In Tumaco, such events were distributed throughout the course of the study period. Extremely Dry events were markedly concentrated in the 2041–2070 period, with 81, 92, and 44 Extremely Dry months according to SPI 3, SPI 6, and SPI 12 assessments, respectively. The period of the second strongest effect of Extreme Dryness was 2071–2100, with 157 Extremely Dry months across all SPIs. The 2022–2040 period included 67 Extremely Dry months across all SPIs.
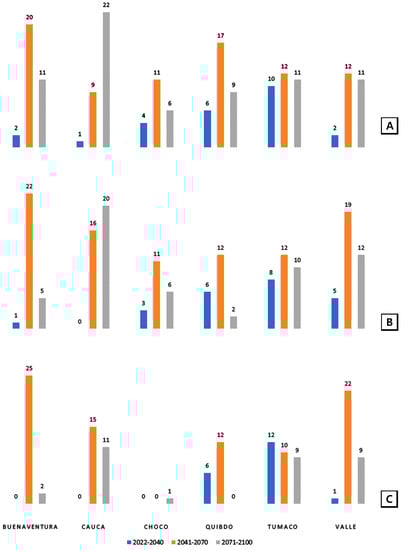
Figure 7.
Number of Extremely Dry events in Colombia’s Pacific region under the RCP 4.5 scenario (2022–2100). (A) SPI 3; (B) SPI 6; and (C) SPI 12.
Figure 8 shows the number of Extremely Dry events predicted under the RCP 8.5 scenario. It is noteworthy that dryness increased in Cauca between 2071 and 2100. SPI 12 registered 30 months of Extreme Dryness. Similarly, an increase in the number of Extremely Dry events was predicted in Buenaventura throughout the study period (unlike the concentration of Extreme Dryness in only one subperiod predicted under RCP 4.5). On the other hand, in Valle, the predicted occurrence of Extremely Dry events decreased in the 2041–2070 period. The incidence of these events was similar to that predicted under RCP 4.5. As under RCP 4.5, the 2041–2070 period was also the one most affected by dryness under RCP 8.5 forcing (Figure 8). Specifically, SPI 3, SPI 6, and SPI 12 registered 84, 92, and 90 affected months, respectively. When all SPIs were combined, the 2041–2070 period included 156 affected months, as compared with 97 affected months in the 2022–2041 period.
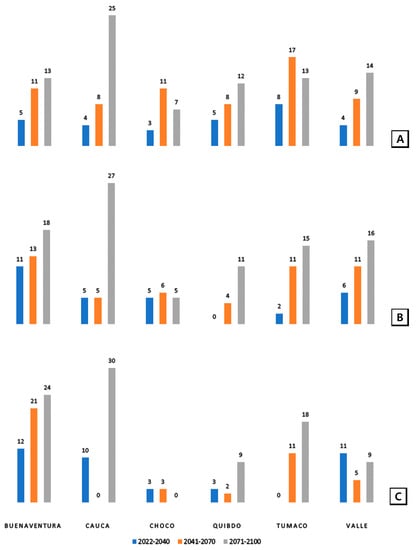
Figure 8.
Number of Extremely Dry events in Colombia’s Pacific region under the RCP 8.5 scenario (2022–2100). (A) SPI 3; (B) SPI 6; and (C) SPI 12.
3.3.2. Extreme Wetness
Figure 9 shows the number of Extremely Wet Events from 2022 to 2100 predicted under the RCP 4.5 scenario. In the 2071–2100 period, Choco had the highest incidence of such events among all the sites. In SPI 12, the number of months affected by Extremely Wetness increased in Buenaventura between 2041 and 2070, and in Choco during the first 18 and last 29 years of the century. SPI 3 registered 118 months affected by Extreme Wetness (21 of them in 2022–2040), SPI 6 recorded 44 affected months in the 2041–2070 period, and SPI 12 registered 112 affected months in the 2071–2100 period.
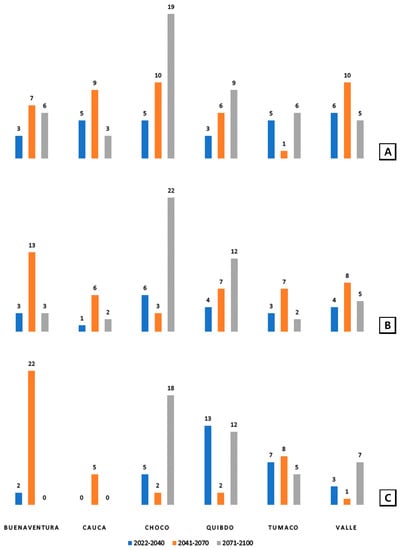
Figure 9.
Number of Extremely Wet events in Colombia’s Pacific region under RCP 4.5 (2022–2200). (A) SPI 3; (B) SPI 6; and (C) SPI 12.
Under RCP 8.5 forcing, there was a significant increase in the projected incidence of Extremely Wet events in Quibdo and Valle from 2071 to 2100 (Figure 10). Compared to the projections under RCP 4.5, Buenaventura showed a significant decrease in the incidence of Extremely Wet events. In the 2070–2100 period, SPI 3, SPI 6, and SPI 12 assessments recorded, respectively, 57, 123, and 157 months affected by Extreme Wetness. Our analysis thus demonstrated that, under the RCP 8.5 scenario, 2071–2100 is projected to be the period most severely impacted by extreme weather in the 21st century.
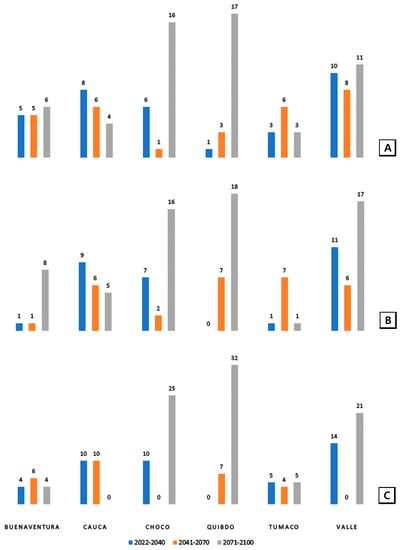
Figure 10.
Number of Extremely Wet events in Colombia’s Pacific region under RCP 4.5 (2022–2100). (A) SPI 3; (B) SPI 6; and (C) SPI 12.
4. Discussion
The SPI is a suitable indicator of meteorological drought for different periods, such as quarterly (SPI 3), biannually (SPI 6), and annually (SPI 12), where SPI 3 provides a seasonal estimation of precipitation and SPI 6 and SPI 12 provide medium- and long-term precipitation trends, respectively. The results obtained in this study are presented in three parts: historical SPI, future SPI, and extreme event occurrence. The results of the SPI history show that Extremely Wet events ranged between 0.5–5.4%, Very Wet events ranged between 2.3–7.2%, and Moderate Wet events ranged from 2–13.3% in all three indexes. Similarly, Extremely Dry was 0.6–3.7%, Severely Dry was 1.7–5.6%, and Moderately Dry ranged between 7.2–11% for all three indices. Normal precipitation accounted for more than two-thirds of all three indices in the study area. The Extremely Dry events for SPI 3, SPI 6, and SPI 12 were 14, 15, and 8 years, respectively. In addition, Tirivarombo et al. [46] showed that the most common hydrological drought experienced in the Kafue Basin in Zambia was in 12 years from 1960 to 2015, while the highest number of droughts were under SPI 6 and SPI 12 in the Nanzhila sub-basin. Hoyos et al. [47] observed that the most extreme events were in some municipalities of the Pacific and Caribbean states in Colombia, where 37 municipalities had anomalous normalized values of > 1.0. Analysis of meteorological drought episodes in Paraguay shows that the 1960s and 1970s were particularly dry, and 1967–1971 were the driest years, accounting for SPI 12 observed in 1961, and 1980 was the driest year [48]. In contrast, precipitation assessment of the Weihe River basin in China indicates that 1960–2970 and 1980–1990 were two wet decades, where precipitation was 5.51% higher than the long-term average precipitation [49]. Similarly, a study from 1967–2019 in Iran explained that the SPI for the observed stations decreased [50].
SPI 3 projections in the Pacific region of Colombia between 2022 and 2040 reported increased wetness under both RCP 4.5 and RCP 8.5. While the 2041–2070 period was dry under RCP 4.5, RCP 8.5 registered more wetness. SPI 6 projections registered wetness in 2022–2040 and 2071–2100 but dryness in 2041–2070 under both RCP scenarios. However, in the 2022–2040 period, SPI 12 projected wetness under RCP 4.5 but dryness under RCP 8.5. From 2041–2070, SPI 12 predicted more pronounced dryness under RCP 4.5 but wetness under RCP 8.5. These results are comparable to a previously published article from a neighboring country, Ecuador. It showed a decrease in severe and moderate drought for RCP 4.5 and RCP 8.5, as well as a small, statistically non-significant decrease in extreme drought in the coast and highland regions from 2042–2070 [51]. Similarly, a study of meteorological, hydrological, and agricultural drought in Lake Titicaca, the Desaguadero River, and the Lake Poopo basin within the Altiplano region from 2034 to 2064 under RCP 8.5 predicted that mean temperature would increase by up to 3 °C and meteorological, hydrological, and agricultural droughts would become more intense, frequent, and prolonged. Furthermore, there would be a considerable rise in the occurrence of short-term agricultural and hydrological droughts, as well as a decline in annual rainfall and evapotranspiration in the region [40]. The projected future climate (2020–2099) of Silva et al. [11] in Brazil using the HadGEM2-ES, MIROC5, BESM, and CanESM2 models, indicates that extreme droughts will continue for several consecutive dry years, which might collapse the local hydrology. The Extremely Dry and Wet months were calculated in the study area under RCP 4.5 and RCP 8.5, which showed that Extremely Dry and Wet months were higher under RCP 8.5 when combining all SPI scenarios.
5. Conclusions
The potential effects of severe climate change in Colombia’s Pacific region will probably range from dryness to wetness of different intensities, depending on location. Our SPI-based analysis of projected precipitation in Colombia’s Pacific region from 2022 to 2100 predicted that the highest number of months affected by Extreme Dryness was in the 2041–2070 period under the RCP 4.5 scenario, and in the 2071–2100 period under the RCP 8.5 scenario. Under the RCP 4.5 scenario, there was no discernible change in the frequency of Extremely Wet events between the 2041–2070 and 2071–2100 periods, with the average number of affected months being 44 in both periods. Under RCP 8.5, on the other hand, the number of months affected by Extremely Wet events increased significantly in the 2071–2100 period. This was also the period with the highest number of affected months, according to SPI 12 assessments. These observations notwithstanding, the frequency of dry or wet extremes in the region did not follow a discernible pattern.
The evaluation of the effects of drought on vegetation is possible through the use of reference periods that correspond to the period of crop development and are assessed in annual time increments. For agricultural drought monitoring, the utilization of monthly time steps, determined by a constant reference period, may be appropriate. This study contributes to the determination of the reference periods and computation time increments most pertinent for evaluating the effects of future climate change on Colombia’s agricultural production and food security.
When studying drought, precipitation measurements and the length of the dataset play an essential role. The more stations used and the longer the historical dataset, the more reliable the predictions and the higher the confidence level at which the risk of drought can be assessed. The risk of drought should be evaluated over various periods to assess dry spells across different seasons or over an entire year. In these assessments, the SPI can be utilized as a user-friendly and reliable drought detection tool. To plan the selection and production of crops in a region, therefore, it is strongly recommended that the SPI be applied for the assessment of drought risk.
Author Contributions
Conceptualization, D.C and O.F.M.A.; investigation, D.C and O.F.M.A.; data curation, D.C, O.F.M.A. and J.-S.H.; writing—original draft preparation, D.C and O.F.M.A.; review and editing, D.C., D.S., J.M.T., and J.-S.H.; software, editing N.N.S., A.O.Y., and B.E.K.N.; supervision, J.-S.H. All authors have read and agreed to the published version of the manuscript.
Funding
This work was supported by the Korean Institute of Energy Technology Evaluation and Planning (KETEP) and the Ministry of Trade, Industry, and Energy (MOTIE) of the Republic of Korea, No. 20224000000150, and by the National Research Foundation of Korea (NRF) grant funded by the Korean Government (Ministry of Science and ICT (MSIT)) (No. NRF-2021R1A5A8033165).
Informed Consent Statement
Informed consent was obtained from all subjects involved in the study.
Data Availability Statement
Not applicable.
Conflicts of Interest
The authors declare no conflict of interest.
Nomenclature
The following nomenclature was used in this manuscript:
| CAM | Central America |
| CO2 | Carbon Dioxide |
| CORDEX | Coordinated Regional Climate Downscaling EXperiment |
| CMhyd | Climate Model Data for Hydrological Modeling (CMhyd) |
| ETCCDI | Expert Team on Climate Change Detection and Indices |
| ICHEC | Irish Centre for High Grid Computing |
| MRAI | Modified Rainfall Anomaly Index |
| RCA | Rossby Centre regional Atmospheric Climate Model |
| RCM | Regional Climate Model |
| RCP | Representative Concentration Pathway |
| SPEI | Standardized Precipitation Evapotranspiration Index |
| SPI | Standardized Precipitation Index |
| WCRP | World Climate Research Program |
| WMO | World Meteorological Organization |
References
- Sippel, S.; Reichstein, M.; Ma, X.; Mahecha, M.D.; Lange, H.; Flach, M.; Frank, D. Drought, Heat, and the Carbon Cycle: A Review. Curr. Clim. Chang. Rep. 2018, 4, 266–286. [Google Scholar] [CrossRef]
- Boo, K.-O.; Kwon, W.-T.; Baek, H.-J. Change of extreme events of temperature and precipitation over Korea using regional projection of future climate change. Geophys. Res. Lett. 2006, 33, L01701. [Google Scholar] [CrossRef]
- Tao, Y.; Wang, W.; Song, S.; Ma, J. Spatial and Temporal Variations of Precipitation Extremes and Seasonality over China from 1961–2013. Water 2018, 10, 719. [Google Scholar] [CrossRef]
- Khan, N.; Shahid, S.; Ismail, T.; Behlil, F. Prediction of heat waves over Pakistan using support vector machine algorithm in the context of climate change. Stoch. Environ. Res. Risk Assess. 2021, 35, 1335–1353. [Google Scholar] [CrossRef]
- Masson-Delmotte, V.; Zhai, P.; Pirani, A.; Connors, S.; Péan, C.; Berger, S.; Caud, N.; Chen, Y.; Goldfarb, L.; Gomis, M.; et al. (Eds.) Working Group I Contribution to the Sixth Assessment Report of the Intergovernmental Panel on Climate Change; Cambridge University Press: Cambridge, UK, 2021. [Google Scholar] [CrossRef]
- Pereira, S.C.; Carvalho, D.; Rocha, A. Temperature and Precipitation Extremes over the Iberian Peninsula under Climate Change Scenarios: A Review. Climate 2021, 9, 139. [Google Scholar] [CrossRef]
- Qaisrani, Z.N.; Nuthammachot, N.; Techato, K. Asadullah Drought monitoring based on Standardized Precipitation Index and Standardized Precipitation Evapotranspiration Index in the arid zone of Balochistan province, Pakistan. Arab. J. Geosci. 2021, 14, 1–13. [Google Scholar] [CrossRef]
- Tigkas, D.; Vangelis, H.; Tsakiris, G. Drought characterisation based on an agriculture-oriented standardised precipitation index. Theor. Appl. Clim. 2018, 135, 1435–1447. [Google Scholar] [CrossRef]
- Tsesmelis, D.E.; Vasilakou, C.G.; Kalogeropoulos, K.; Stathopoulos, N.; Alexandris, S.G.; Zervas, E.; Oikonomou, P.D.; Karavitis, C.A. Drought assessment using the standardized precipitation index (SPI) in GIS environment in Greece. Comput. Earth Environ. Sci. 2021, 619–633. [Google Scholar] [CrossRef]
- Fung, K.F.; Huang, Y.F.; Koo, C.H.; Soh, Y.W. Drought forecasting: A review of modelling approaches 2007–2017. J. Water Clim. Chang. 2019, 11, 771–799. [Google Scholar] [CrossRef]
- Mishra, A.K.; Singh, V.P. A review of drought concepts. J. Hydrol. 2010, 391, 202–216. [Google Scholar] [CrossRef]
- Dokken, D. Managing the Risks of Extreme Events and Disasters to Advance Climate Change Adaptation; Cambridge University Press: Cambridge, UK, 2022. [Google Scholar]
- Reyes, L.J.C.; Rangel, H.; Herazo, L.C.S. Adjustment of the Standardized Precipitation Index (SPI) for the Evaluation of Drought in the Arroyo Pechelín Basin, Colombia, under Zero Monthly Precipitation Conditions. Atmosphere 2022, 13, 236. [Google Scholar] [CrossRef]
- Harishnaika, N.; Ahmed, S.A.; Kumar, S.; Arpitha, M. Computation of the spatio-temporal extent of rainfall and long-term meteorological drought assessment using standardized precipitation index over Kolar and Chikkaballapura districts, Karnataka during 1951–2019. Remote. Sens. Appl. Soc. Environ. 2022, 27, 100768. [Google Scholar] [CrossRef]
- Mathbout, S.; Lopez-Bustins, J.A.; Martin-Vide, J.; Bech, J.; Rodrigo, F.S. Spatial and temporal analysis of drought variability at several time scales in Syria during 1961–2012. Atmos. Res. 2018, 200, 153–168. [Google Scholar] [CrossRef]
- Hänsel, S.; Schucknecht, A.; Matschullat, J. The Modified Rainfall Anomaly Index (mRAI)—Is this an alternative to the Standardised Precipitation Index (SPI) in evaluating future extreme precipitation characteristics? Theor. Appl. Clim. 2015, 123, 827–844. [Google Scholar] [CrossRef]
- Vicente-Serrano, S.M.; Beguería, S.; López-Moreno, J.I. A Multiscalar Drought Index Sensitive to Global Warming: The Standardized Precipitation Evapotranspiration Index. J. Clim. 2010, 23, 1696–1718. [Google Scholar] [CrossRef]
- Wang, Q.; Wu, J.; Lei, T.; He, B.; Wu, Z.; Liu, M.; Mo, X.; Geng, G.; Li, X.; Zhou, H.; et al. Temporal-spatial characteristics of severe drought events and their impact on agriculture on a global scale. Quat. Int. 2014, 349, 10–21. [Google Scholar] [CrossRef]
- Mahmoudi, P.; Ghaemi, A.; Rigi, A.; Jahanshahi, S.M.A. RETRACTED ARTICLE: Recommendations for modifying the Standardized Precipitation Index (SPI) for Drought Monitoring in Arid and Semi-arid Regions. Water Resour. Manag. 2021, 35, 3253–3275. [Google Scholar] [CrossRef]
- Hayes, M.J.; Svoboda, M.D.; Wiihite, D.A.; Vanyarkho, O.V. Monitoring the 1996 Drought Using the Standardized Precipitation Index. Bull. Am. Meteorol. Soc. 1999, 80, 429–438. [Google Scholar] [CrossRef]
- Raziei, T. Revisiting the Rainfall Anomaly Index to serve as a Simplified Standardized Precipitation Index. J. Hydrol. 2021, 602, 126761. [Google Scholar] [CrossRef]
- Bhunia, P.; Das, P.; Maiti, R. Meteorological Drought Study Through SPI in Three Drought Prone Districts of West Bengal, India. Earth Syst. Environ. 2019, 4, 43–55. [Google Scholar] [CrossRef]
- Zarei, A.R. Analysis of changes trend in spatial and temporal pattern of drought over south of Iran using standardized precipitation index (SPI). SN Appl. Sci. 2019, 1, 465. [Google Scholar] [CrossRef]
- Stagge, J.H.; Tallaksen, L.M.; Gudmundsson, L.; Van Loon, A.F.; Stahl, K. Candidate Distributions for Climatological Drought Indices (SPI and SPEI). Int. J. Clim. 2015, 35, 4027–4040. [Google Scholar] [CrossRef]
- Sobral, B.S.; de Oliveira-Júnior, J.F.; Gois, G.; Pereira-Júnior, E.R.; Terassi, P.M.D.B.; Muniz-Júnior, J.G.R.; Lyra, G.B.; Zeri, M. Drought characterization for the state of Rio de Janeiro based on the annual SPI index: Trends, statistical tests and its relation with ENSO. Atmos. Res. 2019, 220, 141–154. [Google Scholar] [CrossRef]
- Weng, W.; Becker, S.L.; Lüdeke, M.K.; Lakes, T. Landscape matters: Insights from the impact of mega-droughts on Colombia’s energy transition. Environ. Innov. Soc. Transit. 2020, 36, 1–16. [Google Scholar] [CrossRef]
- Romero, J. Geografía Económica del Pacífico Colombiano. 2009. Available online: www.banrep.gov.co (accessed on 10 October 2009).
- Carvalho, D.; Pereira, S.C.; Rocha, A. Future surface temperature changes for the Iberian Peninsula according to EURO-CORDEX climate projections. Clim. Dyn. 2020, 56, 123–138. [Google Scholar] [CrossRef]
- Tramblay, Y.; Somot, S. Future evolution of extreme precipitation in the Mediterranean. Clim. Chang. 2018, 151, 289–302. [Google Scholar] [CrossRef]
- Dosio, A.; Jury, M.W.; Almazroui, M.; Ashfaq, M.; Diallo, I.; Engelbrecht, F.A.; Klutse, N.A.B.; Lennard, C.; Pinto, I.; Sylla, M.B.; et al. Projected future daily characteristics of African precipitation based on global (CMIP5, CMIP6) and regional (CORDEX, CORDEX-CORE) climate models. Clim. Dyn. 2021, 57, 3135–3158. [Google Scholar] [CrossRef]
- Van Vuuren, D.P.; Edmonds, J.; Kainuma, M.; Riahi, K.; Thomson, A.; Hibbard, K.; Hurtt, G.C.; Kram, T.; Krey, V.; Lamarque, J.-F.; et al. The representative concentration pathways: An overview. Clim. Chang. 2011, 109, 5–31. [Google Scholar] [CrossRef]
- Clarke, L.; Edmonds, J.; Jacoby, H.; Pitcher, H.; Reilly, J. Scenarios of Greenhouse Gas Emissions and Atmospheric Scenarios of Greenhouse Gas Emissions and Atmospheric Concentrations Concentrations Part of the Bioresource and Agricultural Engineering Commons. 2007. Available online: https://digitalcommons.unl.edu/usdoepubhttps://digitalcommons.unl.edu/usdoepub/6 (accessed on 2 June 2009).
- Riahi, K.; Grübler, A.; Nakicenovic, N. Scenarios of long-term socio-economic and environmental development under climate stabilization. Technol. Forecast. Soc. Chang. 2007, 74, 887–935. [Google Scholar] [CrossRef]
- Shiferaw, A.; Tadesse, T.; Rowe, C.; Oglesby, R. Precipitation Extremes in Dynamically Downscaled Climate Scenarios over the Greater Horn of Africa. Atmosphere 2018, 9, 112. [Google Scholar] [CrossRef]
- Gamal, G. Future Analysis of Extreme Temperature Indices for Sinai Peninsula-Egypt. Imp. J. Interdiscip. Res. (IJIR) 2017, 3, 1960–1966. [Google Scholar]
- Saini, D.; Singh, O.; Bhardwaj, P. Standardized precipitation index based dry and wet conditions over a dryland ecosystem of northwestern India. Geol. Ecol. Landsc. 2020, 6, 1–13. [Google Scholar] [CrossRef]
- Saada, N.; Abu-Romman, A. Multi-site Modeling and Simulation of the Standardized Precipitation Index (SPI) in Jordan. J. Hydrol. Reg. Stud. 2017, 14, 83–91. [Google Scholar] [CrossRef]
- Kumar, S.; Gautam, S. Assessment of Drought by Using Standardized Precipitation Index (SPI). 2021. Available online: http://www.thepharmajournal.com (accessed on 9 September 2021).
- Butu, H.M.; Seo, Y.; Huh, J.S. Determining Extremes for Future Precipitation in Republic of Korea Based on RCP Scenarios Using Non-Parametric SPI. Sustainability 2020, 12, 963. [Google Scholar] [CrossRef]
- Jenkins, K.; Warren, R. Quantifying the impact of climate change on drought regimes using the Standardised Precipitation Index. Theor. Appl. Clim. 2014, 120, 41–54. [Google Scholar] [CrossRef]
- Zeybekoğlu, U.; Aktürk, G. A comparison of the China-Z Index (CZI) and the Standardized Precipitation Index (SPI) for drought assessment in the Hirfanli Dam basin in central Turkey. Arab. J. Geosci. 2021, 14, 2731. [Google Scholar] [CrossRef]
- Javanmard, S.; Emamhadi, M.; BodaghJamali, J.; Didehvarasl, A. Spatial—Temporal Analysis of Drought in Iran Using SPI During a Long—Term Period. Earth Sci. 2017, 6, 15. [Google Scholar] [CrossRef]
- Chávez, L.D.; Patricia, A.; Romero, E.; Vega, J.R. Drought Assessment in the Northern Region of Colombia Using the Standardized Precipitation Index (SPI): A Case Study in the Department of La Guajira. 2021. Available online: https://assets.researchsquare.com/files/rs-1029721/v1_covered.pdf?c=1635778188 (accessed on 1 November 2021).
- Edwards, D.C. Characteristics of 20th Century Drought in the United States at Multd7le Time Scales; Defence Technical Information Center: Fort Belvoir, VA, USA, 1997.
- Zhiña, D.; Montenegro, M.; Montalván, L.; Mendoza, D.; Contreras, J.; Campozano, L.; Avilés, A. Climate Change Influences of Temporal and Spatial Drought Variation in the Andean High Mountain Basin. Atmosphere 2019, 10, 558. [Google Scholar] [CrossRef]
- Tirivarombo, S.; Osupile, D.; Eliasson, P. Drought monitoring and analysis: Standardised Precipitation Evapotranspiration Index (SPEI) and Standardised Precipitation Index (SPI). Phys. Chem. Earth Parts A/B/C 2018, 106, 1–10. [Google Scholar] [CrossRef]
- Hoyos, N.; Escobar, J.; Restrepo, J.; Arango, A.; Ortiz, J. Impact of the 2010–2011 La Niña phenomenon in Colombia, South America: The human toll of an extreme weather event. Appl. Geogr. 2013, 39, 16–25. [Google Scholar] [CrossRef]
- Benitez, J.B.; Domecq, R.M. Analysis of meteorological drought episodes in Paraguay. Clim. Chang. 2014, 127, 15–25. [Google Scholar] [CrossRef]
- Chang, J.; Li, Y.; Ren, Y.; Wang, Y. Assessment of precipitation and drought variability in the Weihe River Basin, China. Arab. J. Geosci. 2016, 9, 1–16. [Google Scholar] [CrossRef]
- Ghasemi, M.M.; Mokarram, M.; Zarei, A.R. Assessing the performance of SN-SPI and SPI and the trend assessment of drought using the XI correlation technique over Iran. J. Water Clim. Chang. 2022, 13, 3152–3169. [Google Scholar] [CrossRef]
- Campozano, L.; Ballari, D.; Montenegro, M.; Aviles, A. Future Meteorological Droughts in Ecuador: Decreasing Trends and Associated Spatio-Temporal Features Derived From CMIP5 Models. Front. Earth Sci. 2020, 8, 17. [Google Scholar] [CrossRef]


Disclaimer/Publisher’s Note: The statements, opinions and data contained in all publications are solely those of the individual author(s) and contributor(s) and not of MDPI and/or the editor(s). MDPI and/or the editor(s) disclaim responsibility for any injury to people or property resulting from any ideas, methods, instructions or products referred to in the content. |
© 2023 by the authors. Licensee MDPI, Basel, Switzerland. This article is an open access article distributed under the terms and conditions of the Creative Commons Attribution (CC BY) license (https://creativecommons.org/licenses/by/4.0/).