Article

Sources of Carbon Dioxide in the Atmosphere: Hydrocarbon Emission from Gas Hydrates in Focus

by
Vladimir Kutcherov
1,2,*,
Daniil Kudryavtsev
3 and
Aleksandr Serovaiskii
1
1
Department of Physics, National University of Oil and Gas «Gubkin University», Leninsky Prospect 65, 119991 Moscow, Russia
2
KTH Royal Institute of Technology, Brinellvägen 68, 11428 Stockholm, Sweden
3
Zavaritskii Institute of Geology and Geochemistry, Ural Division, Russian Academy of Sciences, Pochtovyi per. 7, 620151 Yekaterinburg, Russia
*
Author to whom correspondence should be addressed.
Atmosphere 2023, 14(2), 321; https://doi.org/10.3390/atmos14020321
Submission received: 6 January 2023 / Revised: 31 January 2023 / Accepted: 3 February 2023 / Published: 6 February 2023

Abstract

:
The concentration of carbon dioxide and methane in the atmosphere has significantly increased over the last 60 years. One of the factors in the growth of methane and its homologue emissions is the intense thawing of gas hydrates, mainly from the Arctic shelf, which remains one of the less studied sources of atmospheric hydrocarbon emissions. Oxidation of methane and light-saturated hydrocarbons by ozone in the upper part of the atmosphere leads to the formation of CO2. The analysis of several datasets presented in this paper allows us to find the correlation between CH4 and CO2 concentrations in the atmosphere. This finding suggests that methane and its homologues released from gas hydrates mainly in the Arctic shelf zone become a significant source of carbon dioxide in the atmosphere. Because the amount of hydrocarbons located in gas hydrate deposits on the Arctic shelf is huge, further evolution of this process can become a serious challenge.

1. Introduction

The increasing carbon dioxide (CO2) concentration in the atmosphere reflects the balance between anthropogenic and natural CO2 emissions and the dynamics of a number of terrestrial and oceanic processes that remove or emit CO2 [1,2]. During the last 60 years, the concentration of CO2 in the atmosphere has grown from 320 ppm in 1960 to 416 ppm in 2021 [3]. It is strongly considered that the main reason for this growth is human activity, particularly global fossil fuel emissions [4,5]. Global fossil CO2 emissions include the oxidation of fossil fuels through both combustion and chemical oxidation activities, as well as the cement carbonation process. The estimated global fossil CO2 emission in 2021 is approximately 35 GtCO2 [3]. More than 40% of fossil CO2 emissions were from coal, about 35% were from oil, 15–20% were from natural gas, and the rest were from cement and other smaller sources. Another source of carbon dioxide in the atmosphere is land-use changes CO2 emission [6]. The net CO2 flux from land-use changes includes CO2 fluxes from deforestation [7], logging, and forest degradation [8], shifting cultivation and regrowth of forest emissions from peat burning and drainage. CO2 emissions from land-use changes have slightly changed over the last 60 years, reaching approximately 5 GtCO2 in 2021 [3].
Global natural CO2 emissions include outgassing from the ocean, decomposing vegetation and other biomass, venting volcanoes, naturally occurring wildfires, emissions from animals, and other sources. Global natural CO2 emissions and their partitioning among the atmosphere, ocean, and land are in balance in the real world.
Anthropogenic CO2 emissions are taken up by ocean and terrestrial sinks. The ocean CO2 sink increased from 4 GtCO2 in the 1960s to approximately 10 GtCO2 in 2021. The terrestrial CO2 sink increased from 4 GtCO2 in the 1960s to 11 GtCO2 in 2021 [5].
Figure 1 shows the global CO2 budget, and as can be seen, 19 Gt of CO2 enters the atmosphere annually, in addition to the already existing amount. The details of this balance are considered in [5].
Most estimates of CO2 emissions consider direct anthropogenic and natural emissions of carbon dioxide. The roles of methane and other hydrocarbons, which are eventually transformed into CO2 in the atmosphere as a result of chemical reactions [9], are practically not considered in the overall CO2 balance. There are two main sources of methane emissions—natural and anthropogenic. The global methane budget is detailed in Section 2.3. If the current intensity of anthropogenic methane sources agrees well in various models, then there are significant discrepancies in the assessment of natural emissions [10]. In our opinion, the contribution of methane and its homologues released into the atmosphere during the thawing of gas hydrates is significantly underestimated. Gases released from gas hydrates located on the Arctic shelf zone seafloor and transported to the atmosphere can make a significant contribution to total natural methane emissions and have the potential to amplify global warming [11]. The lack of understanding of this process creates some of the largest uncertainties in climate research [11,12,13,14]. In this paper, we consider the possible effect of hydrocarbons released during the thawing of gas hydrates on an increase in the concentration of CO2 in the atmosphere.

2. Materials and Methods

2.1. Data Sources and Selection

To cover the published research on assessing the connection between increasing concentrations of carbon dioxide carbon and hydrocarbon emissions from gas hydrates, more than 200 peer-reviewed articles indexed by the Web of Science were retrieved for the period from 1990 to 2021. Keywords such as carbon dioxide, methane, hydrocarbons, and greenhouse gas emissions, global CO2 and CH4 budget, Arctic gas hydrates, gas hydrate reserves, permafrost area, East Siberian Shelf, the Chukchi Sea, the Kara Sea, the Laptev Sea, the Barents Sea, and the Beaufort Sea were used in the literature retrieval. We used five main data sets for our analysis, the results of which are presented in this paper.

2.2. Global Carbon Dioxide Budget Data

These data were taken from a review written by several well-known researchers and managers and published in 2022 [5].
The components of the global CO2 budget include CO2 emissions from:
  • fossil fuel combustion and oxidation from all energy and industrial processes, including cement production and carbonation (35 GtCO2·y−1).
  • the emissions from land use, land-use change, and forestry (5 GtCO2·y−1).
  • land uptake (11 GtCO2·y−1).
  • ocean uptake (10 GtCO2·y−1).
The growth rate of atmospheric CO2 concentration = 35 + 5 − 11− 10 = 19 GtCO2·y−1.

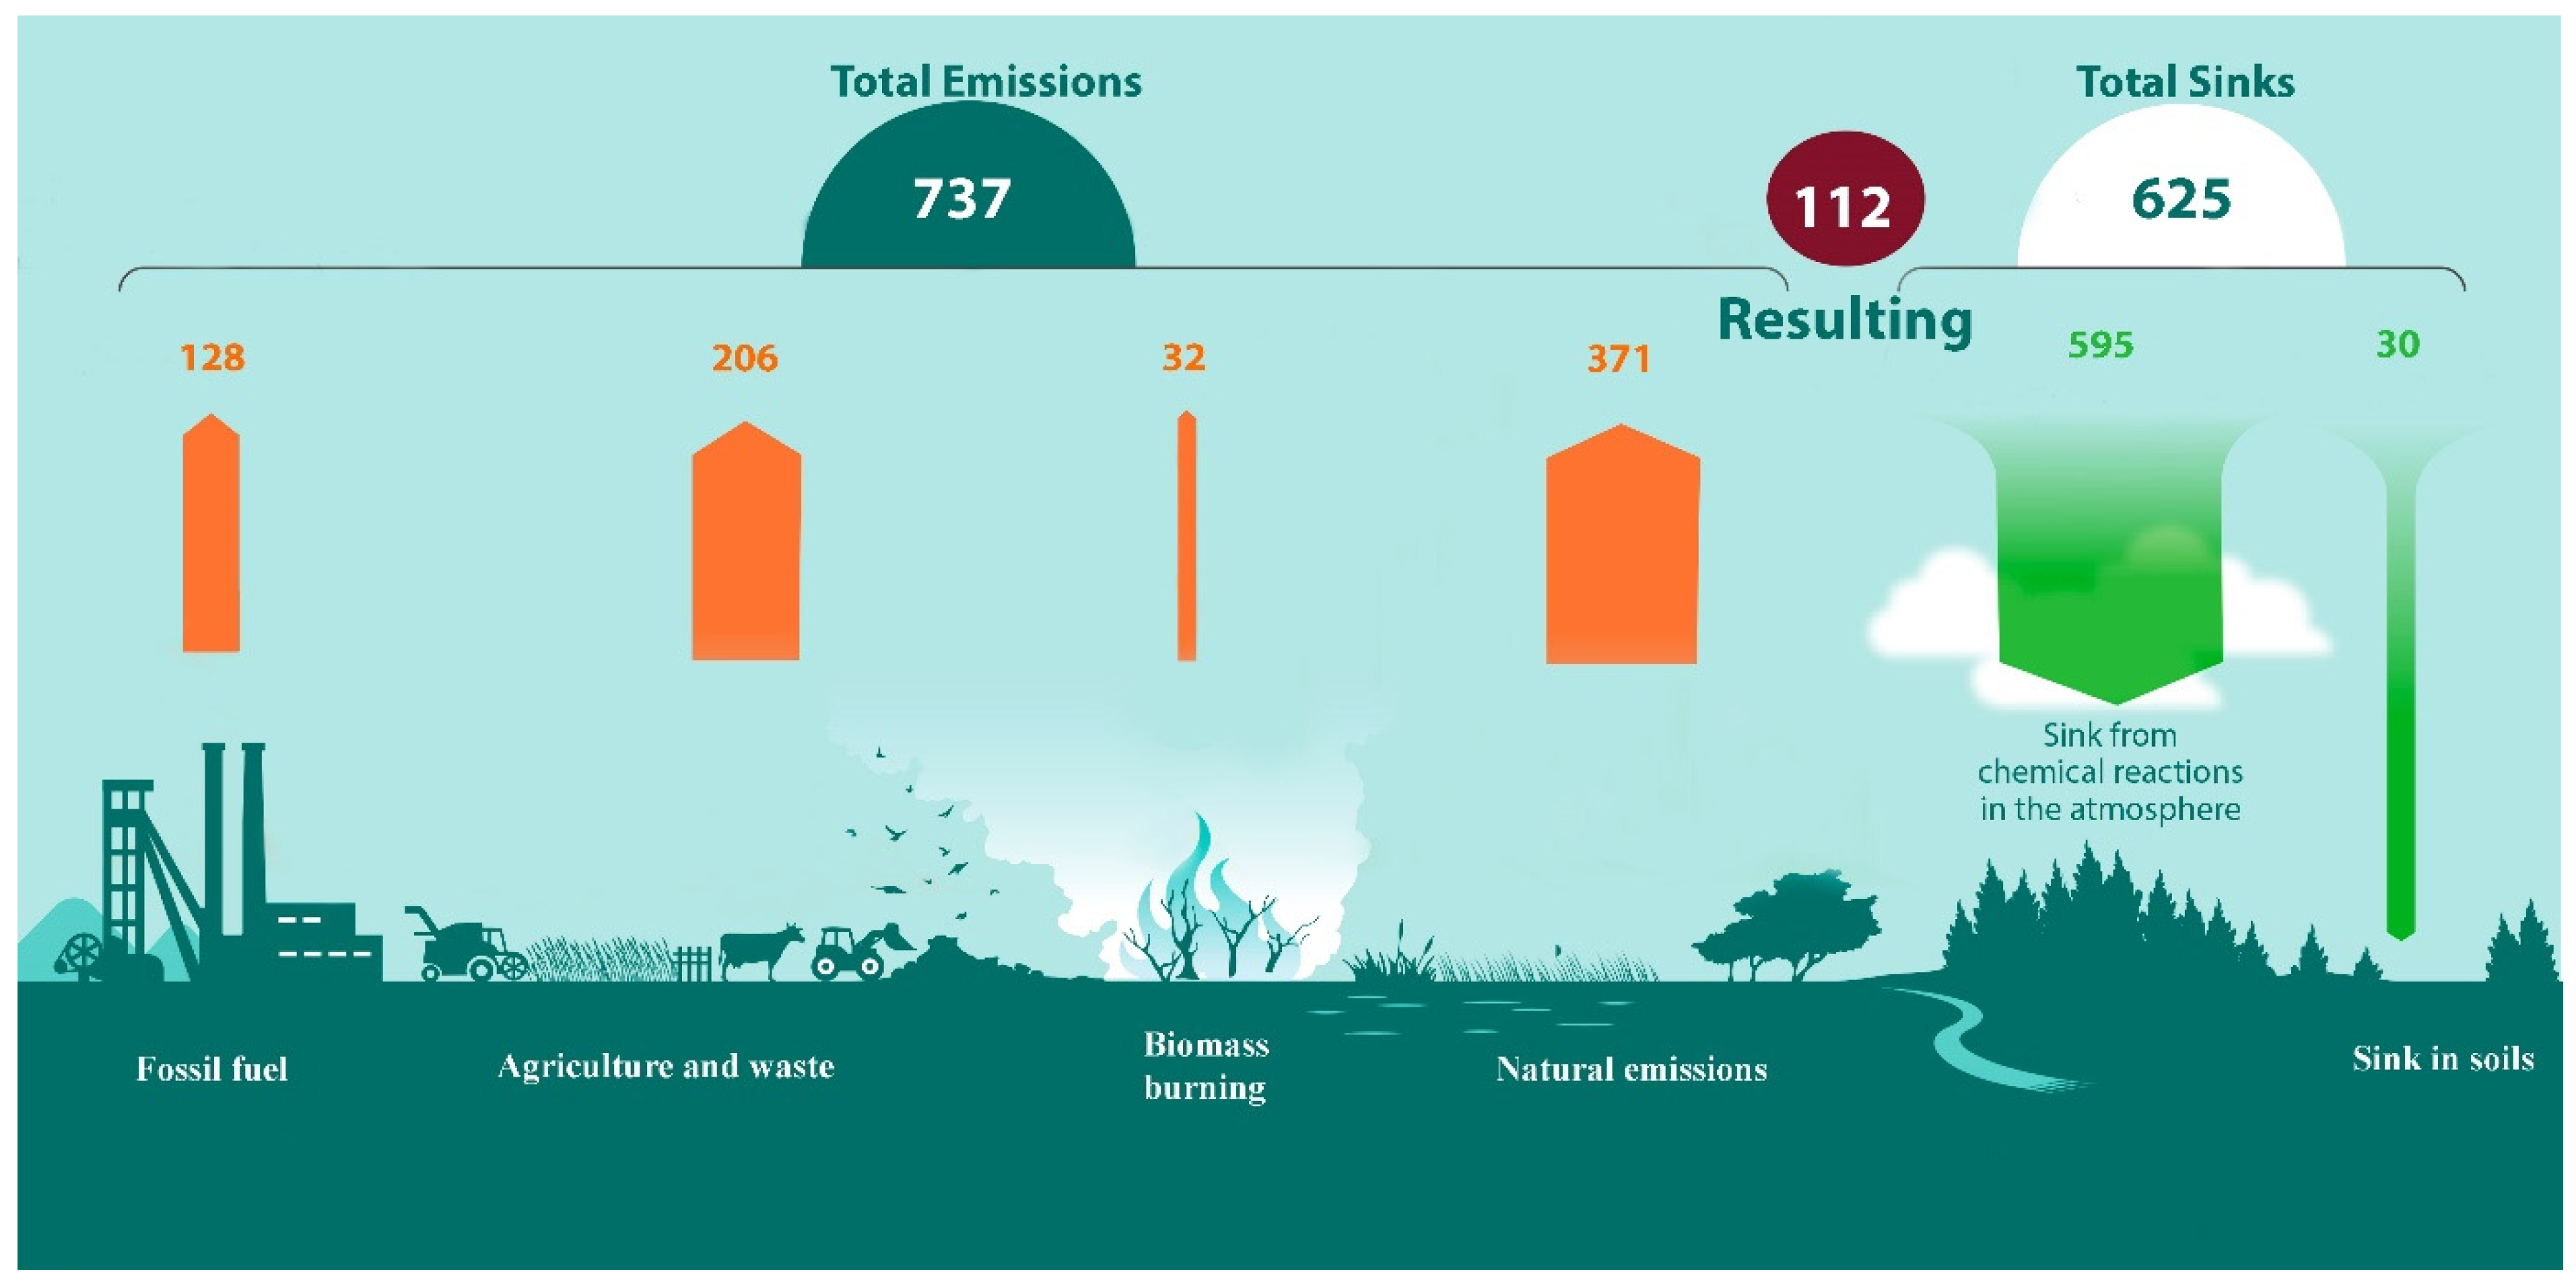
2.3. Global Methane Budget Data

These data were published in 2020 in a review written by several well-known researchers and managers [10].
The main natural and anthropogenic sources of CH4 emission and sinks are presented in Table 1.

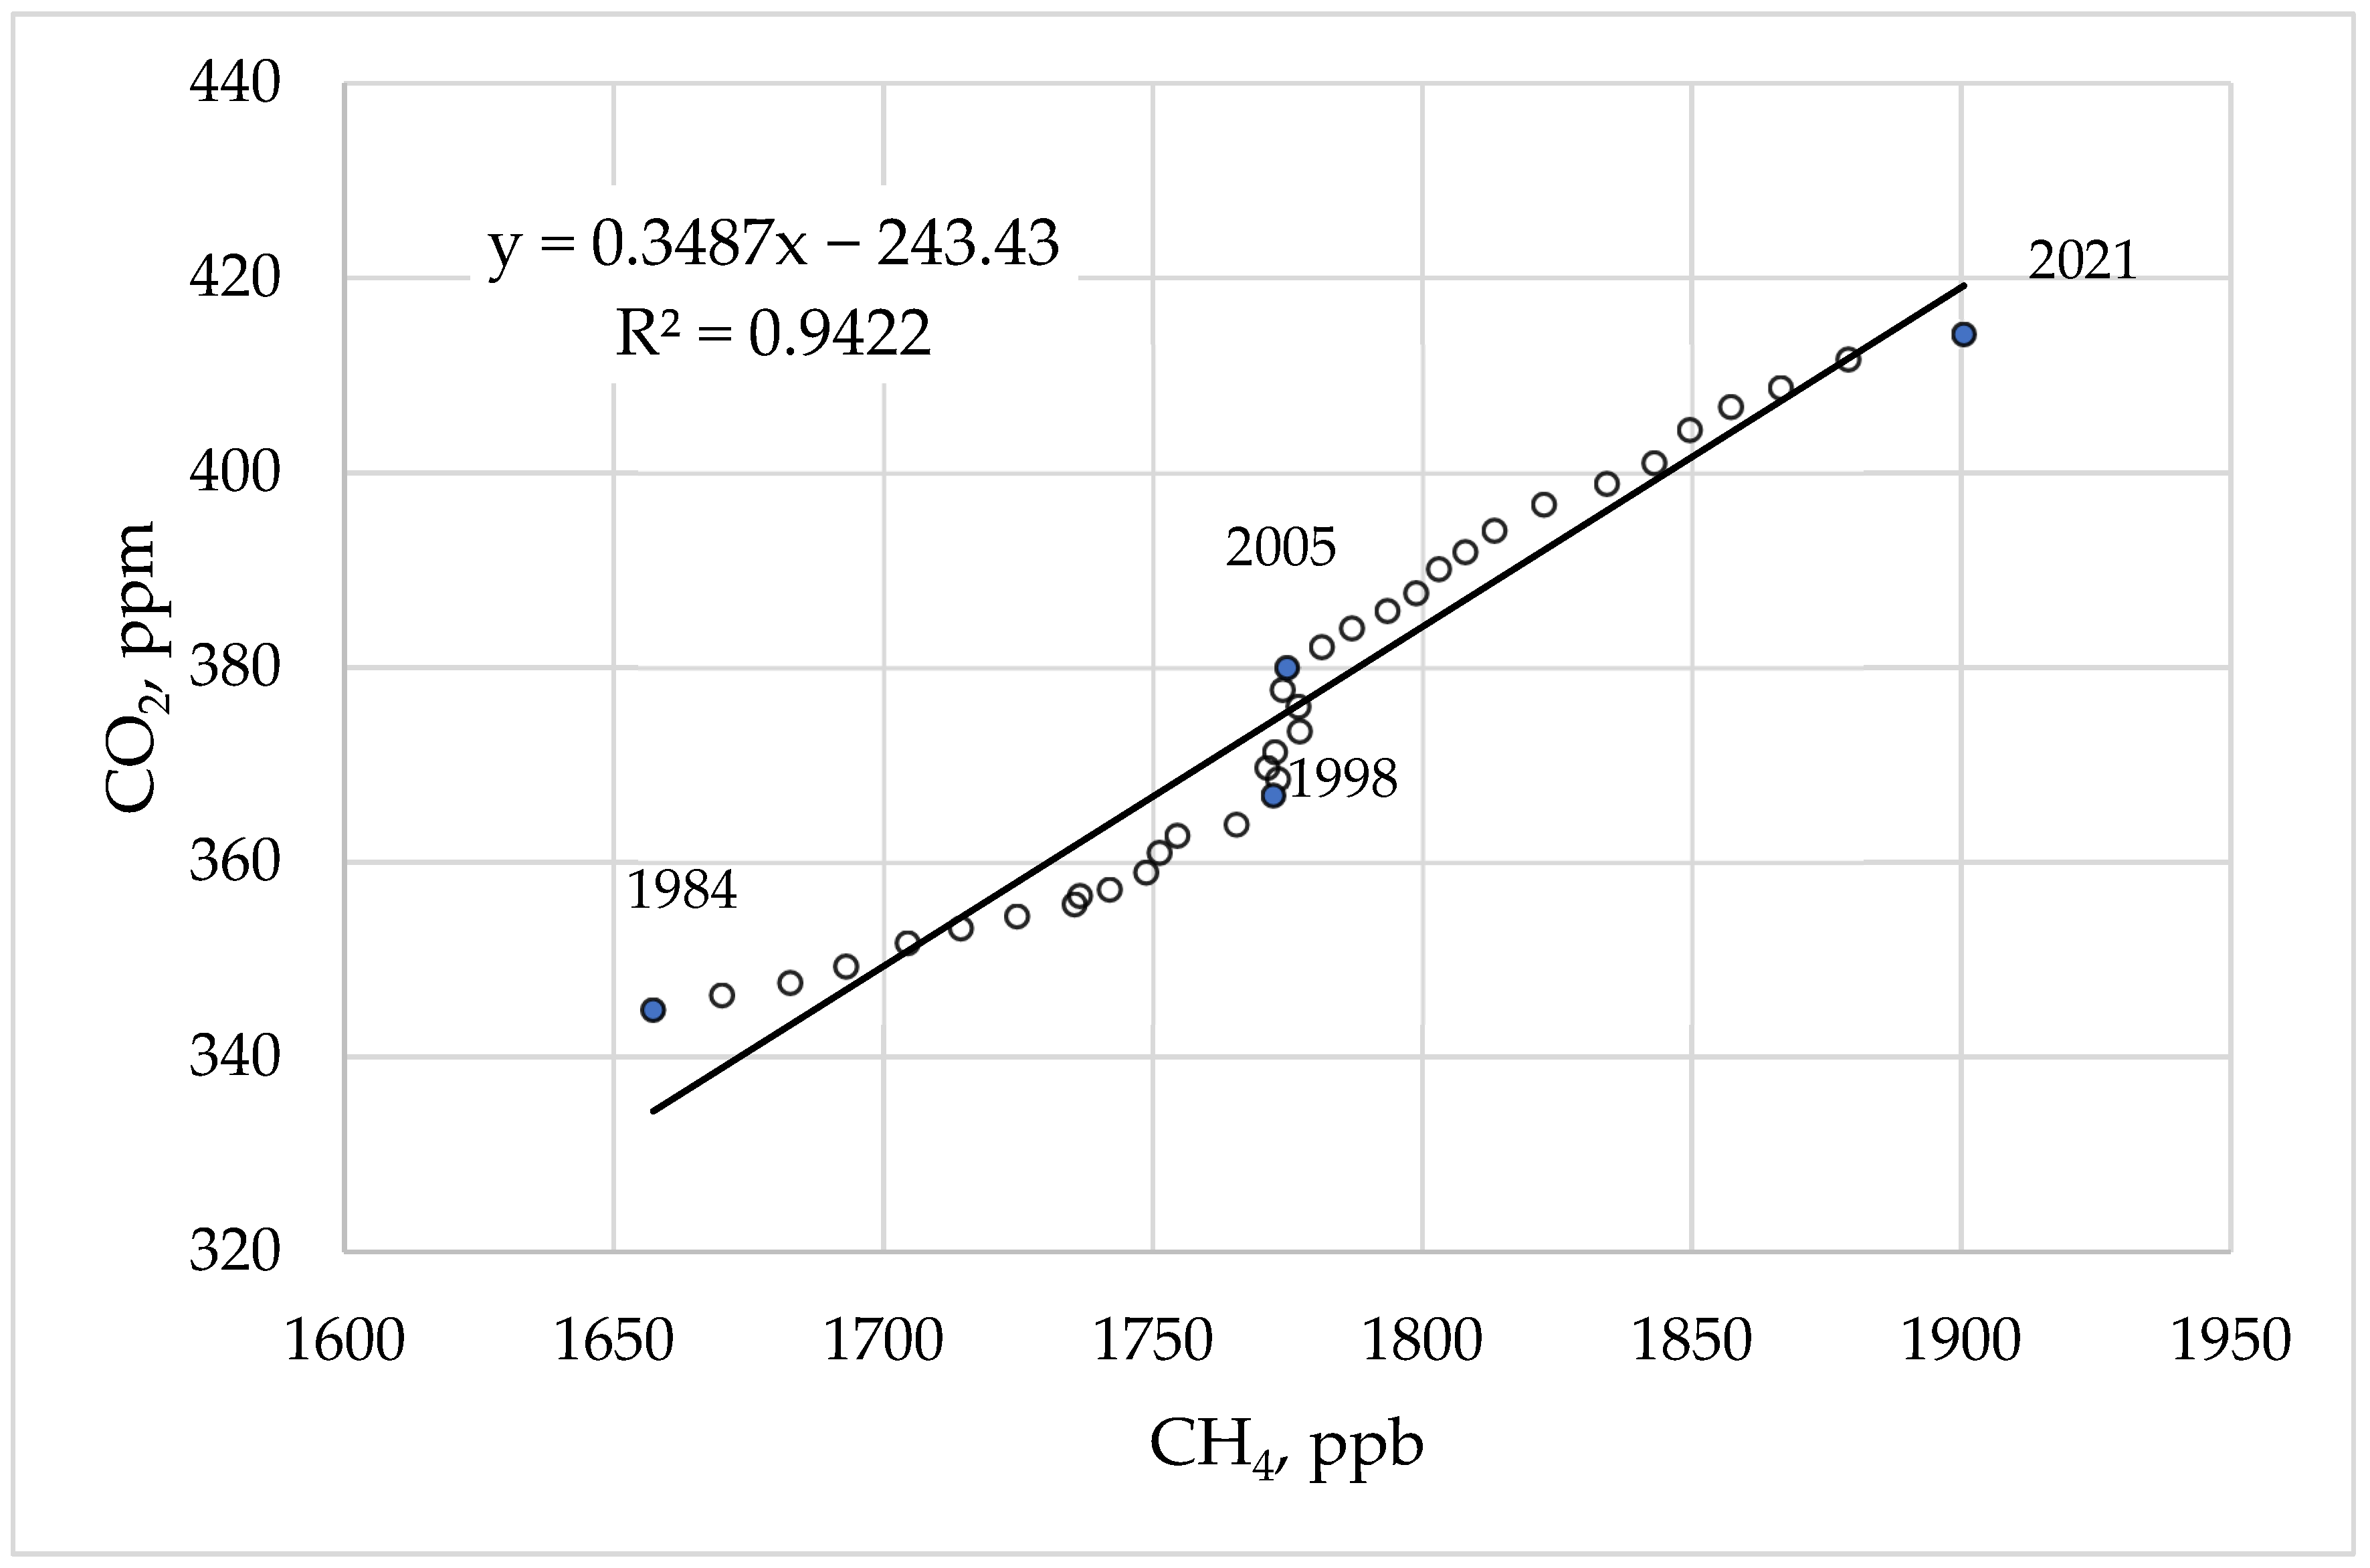
2.4. CH4 and CO2 Concentrations in the Atmosphere from 1984 to 2021

Reliable statistical data were taken from the Global Monitoring Laboratory (U.S. Department of Commerce) [3].

2.5. Estimations for Possible CH4 Amount Released from the Shallow Arctic Shelf

The most reliable data, in the authors’ opinion, were obtained as a result of a detailed study of the Arctic shelf during the 2009–2010 expeditions [15].

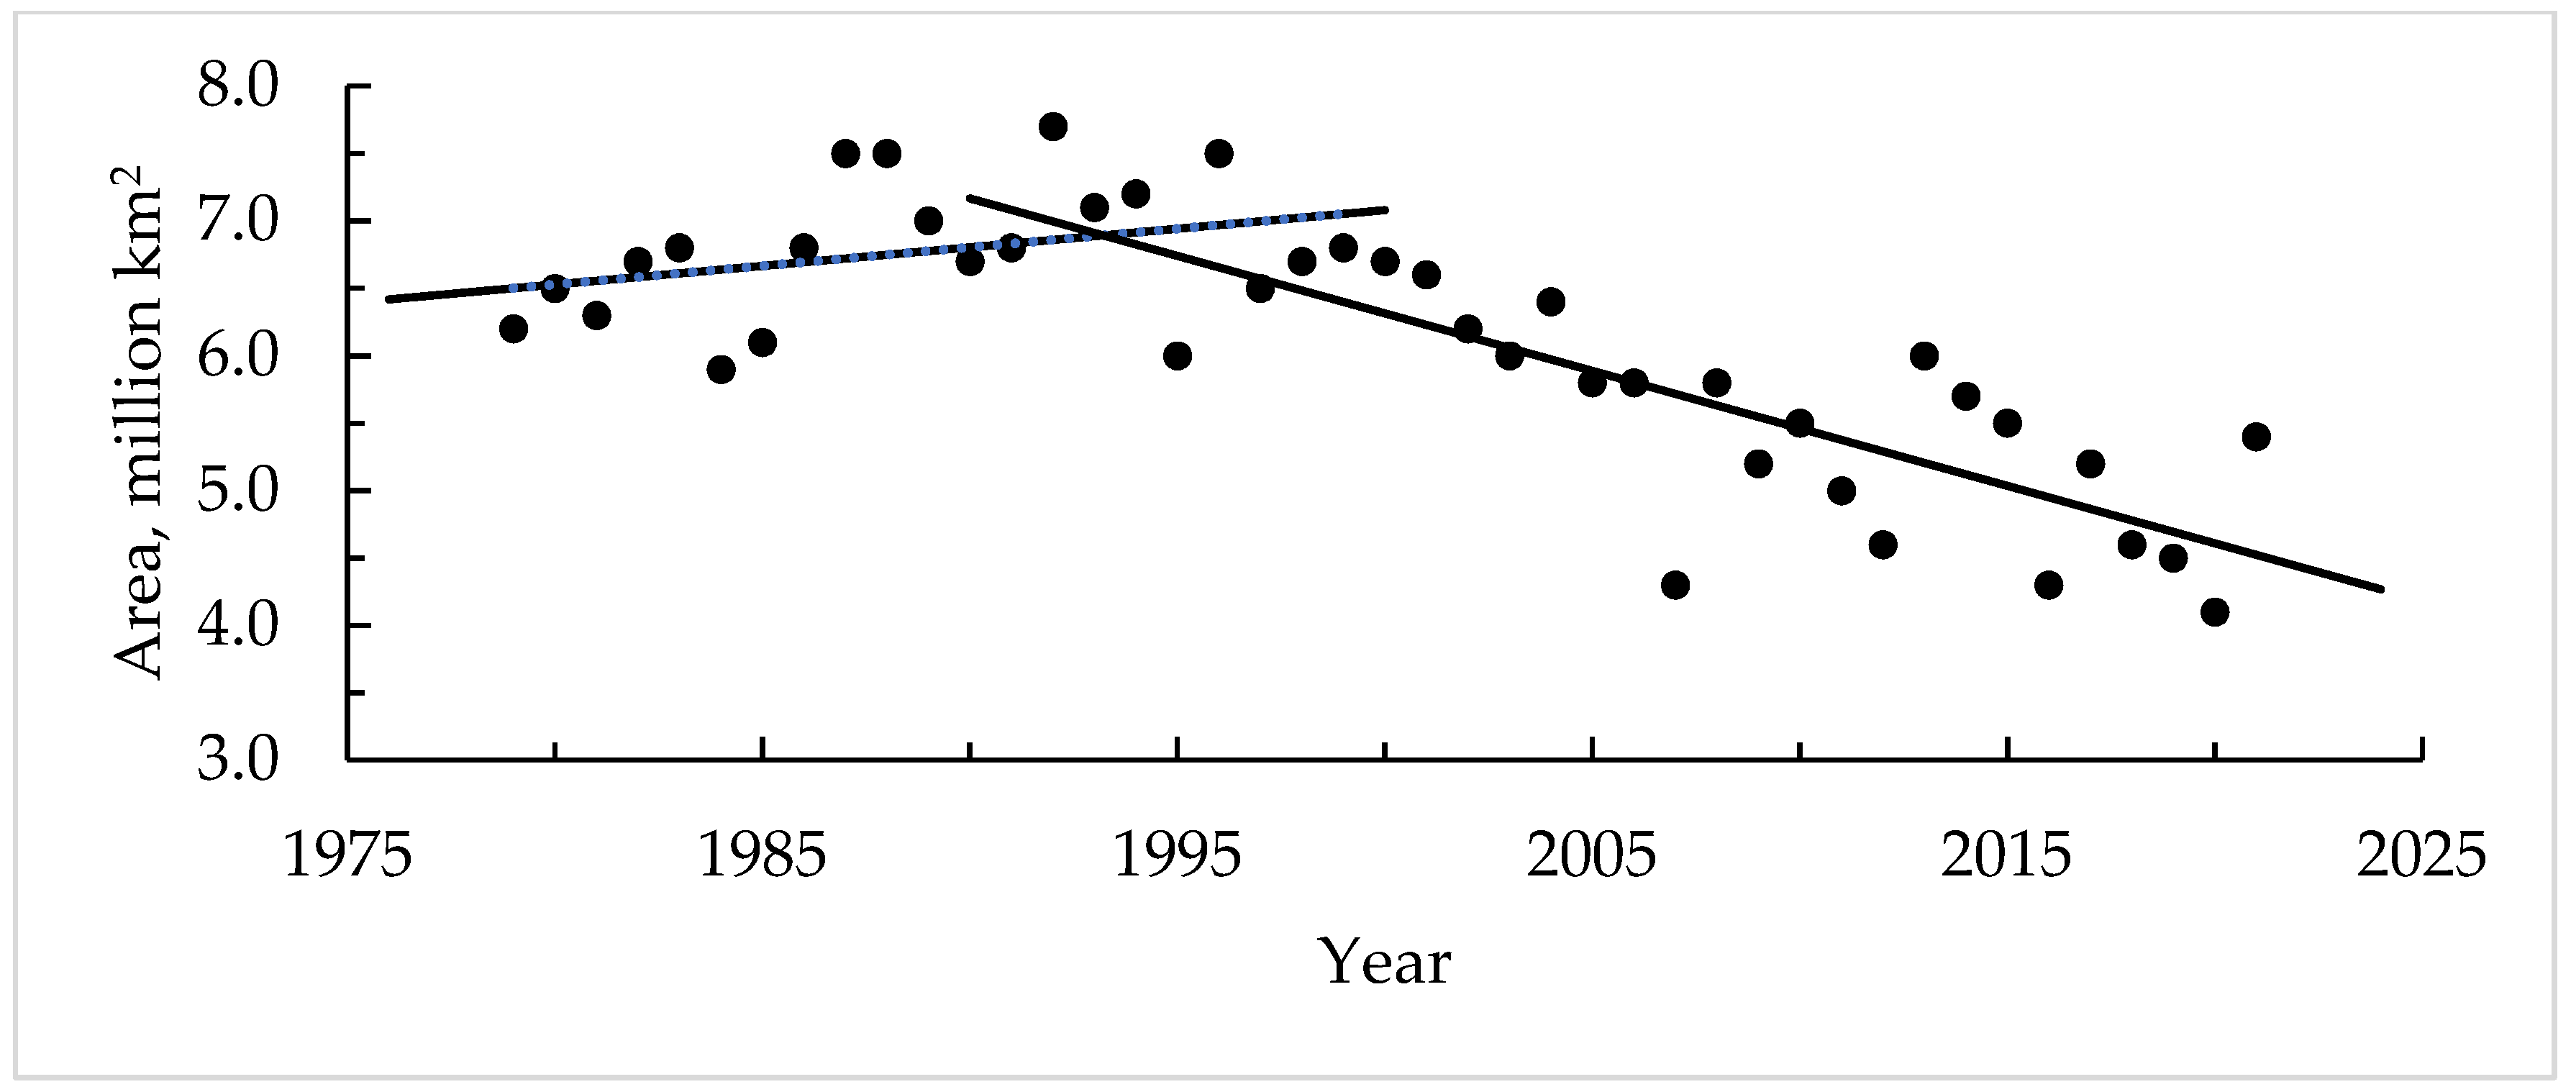
2.6. Change in the Square Area of Ice Cover in the Arctic for the Period 1979–2021

This information was taken from the National Snow and Ice Data Center (University of Colorado, Boulder, CO, USA) [16].

3. Results and Discussion

3.1. The Amount of CO2 and CH4 in the Atmosphere

The molar mass of CO2 = 44.0095 g·mol−1, the molar mass of CH4 = 16.042 g·mol−1, and the molar mass of air = 28.97 g·mol−1. According to the Global Monitoring Laboratory [3], the CO2 content in the atmosphere is estimated at 416 ppm and the CH4 content at 1.9 ppm. Thus, the mass fraction of CO2 is 416 × 10–6 × (44.0095 g·mol−1/28.97 g·mol−1) = 6.32 × 10⁻⁴, and the mass fraction of methane is 1.9 × 10–6 × (16.042 g/mol/28.97 g/mol) = 1.05 × 10⁻⁴. Considering the mass of the atmosphere = 5.15 × 10¹⁵ t [17], we found that the CO2 content in the atmosphere is 5.15 × 1015 × 6.32 10–4 = 3255 Gt and the methane content is 5.4 Gt.
The global CH4 budget is shown in Figure 2, and according to the “bottom-up view” the annual emissions of CH4 are around 737 Tg [10]. Data for CH4 sources and sinks are based on an ensemble of bottom-up approaches from multiple sources, including process-based models, inventories, and data-driven methods. The main atmospheric sink of methane (595 Tg) is oxidation by the hydroxyl radical (OH.), mostly in the troposphere, with the resulting CO2 formation [18]. An additional 30 Tg of CH4 is utilized by unsaturated oxic soils due to the presence of methanotrophic bacteria that consume methane as a source of energy.
The main source of OH. in the Earth’s atmosphere is the reaction of oxygen radicals with water. Oxygen radicals are a product of the photo-dissociation of ozone. The reaction of ozone with hydrocarbons can be described as follows (2), where R is an alkyl group and hv is a photon [9]:
O3 + hv = O2 + O
O. + H2O = OH. + OH
RCH2-H (hydrocarbon) + OH. = RCH2 + H2O
RCH2. + O2 = RCH2O2. (peroxy radicals)
RCH2O2. => aldehydes, ketones, esters… etc… = > CO2 + H2O
Thus, the amount of CH4 in the atmosphere annually increases by about 112 Tg (0.112 Gt), and 595 Tg (0.595 Gt) is transformed into CO2.
CH4 is the main, but not the only, hydrocarbon polluting the atmosphere. Based on several studies [19,20,21], it has become evident that significant concentrations of light alkanes or non-CH4 volatile hydrocarbons (mainly ethane, propane, and butanes) are present in the global troposphere. Although the role of CH4 as the main greenhouse component has been studied for over two decades [22,23,24,25], interest in other alkanes is relatively new. These hydrocarbons are expected to play a specific role in the chemistry of the atmosphere and to contribute to the CO2 concentration growth.
Light alkanes are relatively inert in the lower part of the atmosphere, but they can migrate to their upper parts due to convectional flows, regardless of their molecular weight. The abundance of hydrocarbons (as well as other organic compounds) decreases with higher altitude, where they can be broken down by ultraviolet radiation. Although the physical properties of light-saturated hydrocarbons vary, their oxidation by ozone leads to the formation of CO2. The total amount of light hydrocarbons converted to CO2 is estimated to be up to 20% [20] of sunk CH4. On average, the oxidation reaction creates 2.75 kg of CO2 from 1 kg of CH4 and 3 kg of CO2 from 1 kg of C2–C4 saturated hydrocarbons:
CnH2n+2 + (1.5n + 0.5) O2 = nCO2 + (n + 1) H2O
e.g., if n = 3 (propane) C3H8 + 5O2 = 3CO2 + 4H2O
Thus, the total annual amount of CO2 obtained from the atmospheric oxidation of CH4 and its homologues in the atmosphere, is 0.595 × 2.75 + 0.2 × 0.595 × 3 = 1.99 Gt. Considering that 19 Gt of CO2 enter the atmosphere annually, CH4 and light hydrocarbons are the source of 10% of CO2 in the atmosphere.
The concentration of CH4 in the troposphere up to a height of 10 km is practically unchanged [26] and depends on the intensity ratio of the emission and sink processes. CH4 concentrations in the northern and southern hemispheres are different [10], and one possible explanation is that most of the main natural and anthropogenic sources of CH4 are found in the northern hemisphere.
Figure 2 shows that methane emissions from natural sources constitute more than 50% of the total emissions. At the same time, the rate of CH4 and its homologues released during the decomposition of gas hydrates has not been determined, although the amount of hydrocarbons concentrated in gas hydrates is enormous.

3.2. CH4 and Other Hydrocarbons in Gas Hydrates

The precise estimation of natural gas hydrate reserves on Earth is a challenging problem, which is reflected in Table 2 below:
Gas hydrates are clathrate compounds, where the molecules of gas-guest are trapped in the crystalline cell of water and are retained by the energy of hydrogen bonding. Gas hydrates can be formed from different types of gases, not only from CH4 [28], depending on the thermobaric conditions of their formation and the composition of the guest molecule. In the case of CH4 and light-saturated hydrocarbons, gas hydrates are formed when water and gas occur together at relatively low temperatures (down to 288 K) and high pressures (2–12 MPa). Natural gas hydrates can be formed under the permafrost at a depth down to 1.2 km, and in marine environments under the seafloor level at different depths [29]. Although the term “natural gas hydrate” is synonymous with the term “methane hydrate”, the real composition of gas hydrate molecules is “flexible”, including other guest compounds such as light saturated hydrocarbons—mainly ethane, propane and butane, CO2, nitrogen, and hydrogen sulfide. The number of guests in the water cage depends on the pressure and temperature during the formation of the hydrate. Moreover, the processes of migration of gas–water mixtures can affect the final composition. Usually, the composition of natural gas hydrates is described as CH4 constituted. However, there is much evidence of various gas hydrate compositions with dramatic increases in the heavy hydrocarbon content (Table 3).
It is assumed that CH4 under the zone of stability of gas hydrates exists in the form of a free gas. According to [30], free-gas reservoirs exist below most hydrate provinces in basin settings. The free-gas reservoir may contain from one-sixth to two-thirds of the total methane trapped in hydrate [30,31].

3.3. Correlation between CO2 and CH4 Concentrations in the Atmosphere

Figure 3 shows the correlation between CH4 and CO2 concentrations in the atmosphere, which can be divided into three different periods. In the first period (1984–1999), a correlation was observed between the increase in CO2 concentration and the increase in CH4 concentration in the atmosphere. In the second period from 1999 to 2006, there was a noticeable increase in the CO2 concentration but the CH4 concentration did not change. One possible explanation is the following assumption. From 1999–2005, a drop in northern tropical wetland emissions associated with years of dry conditions [32,33] decreased wetland emissions together with moderately increasing OH as a result of increased NOx emissions. However, the global mean OH concentration was suggested to have changed only slightly over the past 150 years [34], and chemistry climate models derive a null to positive trend in OH over the years 2000–2017 [35]. The considerable uncertainty in inter-annual OH variability and trends needs to be further investigated. Starting in 2006, the correlation between an increase in the concentration of CO2 and an increase in the concentration of CH4 in the atmosphere appeared again. However, during this period, the nature of this correlation changed significantly. If in the first period an increase in the concentration of methane by 1 bpm correlated with an increase in the concentration of carbon dioxide by 0.16 ppm, then in the third period this ratio increased to 0.3 ppm. A possible explanation for this fact is the assumption of an increase in emissions of hydrocarbons as a result of the intensification of the development of oil and gas deposits, including shale gas [36]. However, this assumption is not confirmed by the data on the isotopic composition of CH4 presented in [37]. The content of the heavy isotope C13, which is associated with the use of oil and natural gas, has been falling since the beginning of 2006. According to the authors of [37], climate-sensitive natural emissions are one of the most probable causes of the current CH4 increase. It can be assumed that the main factor in the growth of hydrocarbon emissions is the intense thawing of gas hydrates [38]. This process consequently leads to the growth of CO2 in the atmosphere.

3.4. The Origin of CH4 and Its Homologues in Gas Hydrates

The thorough investigation of hydrocarbon transformations in the deep Earth’s interior and the formation of hydrocarbons from single molecules, such as CH4, ethane, propane, or butane, could solve the puzzle of hydrate formation, geological emissions of hydrocarbons, and their fate in the Earth’s different spheres [39,40,41]. According to the concept of the abiogenic deep origin of hydrocarbons, all gas hydrates were formed as the result of upward vertical migration of the mantle fluids (mixture of supercritical water and hydrocarbons) through faults and fractures [30]. Most gas hydrates were formed in the Quaternary period during the formation of a permafrost zone. However, natural gas hydrate formation continues at the present time. Subaqueous gas hydrates are formed in areas of the continental slope and continental rise, and in deep water. As CH4 and its homologues are released from gas hydrates, free gas from the underlying layers begins to enter the atmosphere [29]. At the same time, the pressure in these layers decreases, which makes it possible for mantle water–hydrocarbon fluids to migrate from the depths, feeding free gas deposits.

3.5. The Thawing of Gas Hydrates—The Current State

The Arctic shelf may contain huge amounts of gas hydrates. The main sedimentary basins in this area where gas hydrate deposits could be found are the East Siberian Shelf (ESAS), the Chukchi Sea, the Kara Sea, the Laptev Sea, the Barents Sea, and the Beaufort Sea. The estimated area of permafrost in these regions is shown in Table 4 [41].
The potential estimated amount of gas hydrates on these shallow tectonically and seismically active regions [42,43] varies significantly from 500–900 Gt [44] to 10,000 Gt [45]. It has been believed that impermeable subsea permafrost prevents the release of methane and its homologies to the overlying ocean and, afterward, to the atmosphere [46].
During the winter ice-covered period, sea ice serves as a natural physical barrier that protects methane and its homolog emissions from gas hydrates into the atmosphere. In this period, some hydrocarbons could be oxidated within the water column. Temperature in the Arctic is increasing [47], periods of open water become longer, and the amount of hydrocarbons released is increasing. In this case, the thickness of the water layer above the gas hydrate deposits plays a significant role. At a thickness of 2–3 km, almost the entire volume of hydrocarbons released from gas hydrate deposits can be dissolved in the water layer. But at a depth of several tens/hundreds of meters, most of the released hydrocarbons enter the atmosphere. It should be noted that, for example, in ESAS, shallow water shelf hydrates are found in bottom sediments at depths of 20–70 m from the bottom surface [48,49].
An increase in the average annual temperature in the Arctic region activates ice cover reduction and the enhancement of the ice-free period and leads to an increase in the depth temperature. These two factors determine the intensifying of methane emissions from the Arctic continental shelf. Figure 4 shows data on changes in the area of ice cover in the Arctic in October for the period from 1979 to 2021 [16]. As can be seen from the figure, starting in the mid-1990s, the ice cover area began to decrease significantly from 7 million km2 to 4.5–4.8 million km2.
Figure 5 shows the results of modeling the average annual temperature of the bottom layer of the Kara Sea in 1999–2020 [50]. The average annual temperature of the bottom layer of the Kara Sea rises significantly. This, in turn, leads to an increase in seabed temperatures. Changing the temperature regime violates the stability of gas hydrates and leads to their thawing.
Thus, since the early 2000s, there has been a significant reduction in ice cover and an increase in the temperature of the bottom layer of the Arctic seas, which has led to the growth of the amount of hydrocarbons released into the atmosphere as a result of the thawing of gas hydrates. The results of the simulation published in [51] also show the dynamic response of shallow oceanic gas hydrate accumulations to temperature changes on the seafloor.
The amount of methane and its homologues, which could be released from the shallow Arctic shelf and then reach the atmosphere, is still uncertain [52]. For example, the results of the simulations evaluating methane’s emissions in the ESAS zone vary differently from 0.45 Tg to 4.5 Tg [14,15,53,54,55,56,57,58].
The most reliable data, in the authors’ opinion, is given in [15]. This data was obtained as a result of a detailed study of the Arctic shelf during the 2009–2010 expeditions. Measurements show that total ESAS CH4 emissions to atmosphere is 17 Tg yr−1. The total Arctic subsea permafrost area is 2.34 × 10⁶ km2 [59]. The ESAS area is 0.81 × 10⁶ km2, i.e., 35% of the Arctic shelf. If we assume that the process of thawing of gas hydrates in other parts of the Arctic shelf is similar to the process of thawing in ESAS, then the total CH4 emissions to the atmosphere in this area can reach 48.6 Tg·yr−1. This is about 6.6% of the total annual methane emissions. If we consider that, in addition to methane, light saturated hydrocarbons are also released from gas hydrates, then the total influence of hydrocarbons from gas hydrates in the growth of the CO2 concentration can be quite significant.

4. Conclusions

At the end of the last century, as a result of the ice surface contraction and an increase in seafloor temperature in the Arctic shelf zone, which was a consequence of an increase in the average annual temperature in the Arctic, intensive thawing of shelf gas hydrates began with the release of methane and its homologues, which, ultimately, were a new additional source of carbon dioxide in the atmosphere. Considering the fact that the amount of hydrocarbons located in gas hydrate deposits in the Arctic shelf is huge, the further evolution of this process can be a serious challenge. If carbon dioxide and methane emissions of anthropogenic origin can be controlled, then what to do with a possible intensive increase in emissions of gas hydrate hydrocarbons is not yet clear.

Author Contributions

Conceptualization, V.K.; methodology, V.K., D.K. and A.S.; investigation, V.K., D.K. and A.S.; writing—original draft preparation, V.K., D.K. and A.S.; writing—review and editing, V.K. and A.S.; All authors have read and agreed to the published version of the manuscript.

Funding

This research received no external funding.

Institutional Review Board Statement

Not relevant to this study.

Informed Consent Statement

Not applicable.

Data Availability Statement

The data presented in this study are available online in the public domain.

Conflicts of Interest

The authors declare no conflict of interest.

References

  1. Field, C.B.; Raupach, M.R. The Global Carbon Cycle: Integrating Humans, Climate, and the Natural World; Island Press: Washington, DC, USA, 2004; Volume 62. [Google Scholar]
  2. Canadell, J.G.; Pataki, D.E.; Pitelka, L.F. Terrestrial Ecosystems in a Changing World; Springer Science & Business Media: Berlin/Heidelberg, Germany, 2007. [Google Scholar]
  3. Tans, P.; Keeling, D. Trends in Atmospheric Carbon Dioxide; U.S. Department of Commerce, Global Monitoring Laboratory: Gaithersburg, MD, USA, 2022.
  4. Peters, G.P.; Andrew, R.M.; Canadell, J.G.; Friedlingstein, P.; Jackson, R.B.; Korsbakken, J.I.; Le Quéré, C.; Peregon, A. Carbon dioxide emissions continue to grow amidst slowly emerging climate policies. Nat. Clim. Change 2020, 10, 3–6. [Google Scholar] [CrossRef]
  5. Friedlingstein, P.; O’Sullivan, M.; Jones, M.W.; Andrew, R.M.; Gregor, L.; Hauck, J.; Le Quéré, C.; Luijkx, I.T.; Olsen, A.; Peters, G.P.; et al. Global Carbon Budget 2022. Earth Syst. Sci. Data 2022, 14, 4811–4900. [Google Scholar] [CrossRef]
  6. Guimberteau, M.; Ciais, P.; Ducharne, A.; Boisier, J.P.; Dutra Aguiar, A.P.; Biemans, H.; De Deurwaerder, H.; Galbraith, D.; Kruijt, B.; Langerwisch, F.; et al. Impacts of future deforestation and climate change on the hydrology of the Amazon Basin: A multi-model analysis with a new set of land-cover change scenarios. Hydrol. Earth Syst. Sci. 2017, 21, 1455–1475. [Google Scholar] [CrossRef]
  7. Gasser, T.; Crepin, L.; Quilcaille, Y.; Houghton, R.A.; Ciais, P.; Obersteiner, M. Historical CO2 emissions from land use and land cover change and their uncertainty. Biogeosciences 2020, 17, 4075–4101. [Google Scholar] [CrossRef]
  8. Qin, Y.; Xiao, X.; Wigneron, J.-P.; Ciais, P.; Brandt, M.; Fan, L.; Li, X.; Crowell, S.; Wu, X.; Doughty, R. Carbon loss from forest degradation exceeds that from deforestation in the Brazilian Amazon. Nat. Clim. Change 2021, 11, 442–448. [Google Scholar] [CrossRef]
  9. Cicerone, R.J.; Oremland, R.S. Biogeochemical aspects of atmospheric methane. Glob. Biogeochem. Cycles 1988, 2, 299–327. [Google Scholar] [CrossRef]
  10. Saunois, M.; Stavert, A.R.; Poulter, B.; Bousquet, P.; Canadell, J.G.; Jackson, R.B.; Raymond, P.A.; Dlugokencky, E.J.; Houweling, S.; Patra, P.K.; et al. The Global Methane Budget 2000–2017. Earth Syst. Sci. Data 2020, 12, 1561–1623. [Google Scholar] [CrossRef]
  11. Pohlman, J.W.; Greinert, J.; Ruppel, C.; Silyakova, A.; Vielstädte, L.; Casso, M.; Mienert, J.; Bünz, S. Enhanced CO2 uptake at a shallow Arctic Ocean seep field overwhelms the positive warming potential of emitted methane. Proc. Natl. Acad. Sci. USA 2017, 114, 5355–5360. [Google Scholar] [CrossRef]
  12. Kvenvolden, K.A. Methane hydrates and global climate. Glob. Biogeochem. Cycles 1988, 2, 221–229. [Google Scholar] [CrossRef]
  13. Ruppel, C.D.; Kessler, J.D. The interaction of climate change and methane hydrates. Rev. Geophys. 2017, 55, 126–168. [Google Scholar] [CrossRef]
  14. Thornton, B.F.; Geibel, M.C.; Crill, P.M.; Humborg, C.; Mörth, C.M. Methane fluxes from the sea to the atmosphere across the Siberian shelf seas. Geophys. Res. Lett. 2016, 43, 5869–5877. [Google Scholar] [CrossRef]
  15. Shakhova, N.; Semiletov, I.; Leifer, I.; Sergienko, V.; Salyuk, A.; Kosmach, D.; Chernykh, D.; Stubbs, C.; Nicolsky, D.; Tumskoy, V. Ebullition and storm-induced methane release from the East Siberian Arctic Shelf. Nat. Geosci. 2014, 7, 64–70. [Google Scholar] [CrossRef]
  16. Fetterer, F.; Knowles, K.; Meier, W.N.; Savoie, M.; Windnagel, A.K. Sea Ice Index, Version 3 [Data Set]. Boulder, Colorado USA. National Snow and Ice Data Center. 2017. Available online: https://nsidc.org/data/g02135/versions/3 (accessed on 20 December 2022).
  17. Trenberth, K.E.; Smith, L. The mass of the atmosphere: A constraint on global analyses. J. Clim. 2005, 18, 864–875. [Google Scholar] [CrossRef]
  18. Katzenstein, A.S.; Doezema, L.A.; Simpson, I.J.; Blake, D.R.; Rowland, F.S. Extensive regional atmospheric hydrocarbon pollution in the southwestern United States. Proc. Natl. Acad. Sci. USA 2003, 100, 11975–11979. [Google Scholar] [CrossRef]
  19. Simpson, I.J.; Sulbaek Andersen, M.P.; Meinardi, S.; Bruhwiler, L.; Blake, N.J.; Helmig, D.; Rowland, F.S.; Blake, D.R. Long-term decline of global atmospheric ethane concentrations and implications for methane. Nature 2012, 488, 490–494. [Google Scholar] [CrossRef]
  20. Etiope, G.; Ciccioli, P. Earth’s degassing: A missing ethane and propane source. Science 2009, 323, 478. [Google Scholar] [CrossRef] [PubMed]
  21. Guo, S.; Yang, F.; Tan, J.; Duan, J. Nonmethane hydrocarbons in ambient air of hazy and normal days in Foshan, South China. Environ. Eng. Sci. 2012, 29, 262–269. [Google Scholar] [CrossRef] [PubMed]
  22. Dlugokencky, E.J.; Nisbet, E.G.; Fisher, R.; Lowry, D. Global atmospheric methane: Budget, changes and dangers. Philos. Trans. R. Soc. A 2011, 369, 2058–2072. [Google Scholar] [CrossRef]
  23. Nisbet, E.G.; Dlugokencky, E.J.; Bousquet, P. Methane on the rise—Again. Science 2014, 343, 493–495. [Google Scholar] [CrossRef]
  24. Prather, M.J.; Holmes, C.D. Overexplaining or underexplaining methane’s role in climate change. Proc. Natl. Acad. Sci. USA 2017, 114, 5324–5326. [Google Scholar] [CrossRef] [Green Version]
  25. Feldman, D.R.; Collins, W.D.; Biraud, S.; Risser, M.; Turner, D.; Gero, P.J.; Tadić, J.; Helmig, D.; Xie, S.; Mlawer, E.J. Observationally derived rise in methane surface forcing mediated by water vapour trends. Nat. Geosci. 2018, 11, 238–243. [Google Scholar] [CrossRef]
  26. The Global Monitoring Laboratory of the National Oceanic and Atmospheric Administration. Available online: https://gml.noaa.gov/aftp/data/ (accessed on 20 December 2022).
  27. Milkov, A.V. Global estimates of hydrate-bound gas in marine sediments: How much is really out there? Earth-Sci. Rev. 2004, 66, 183–197. [Google Scholar] [CrossRef]
  28. Speight, J.G. Handbook of Industrial Hydrocarbon Processes; Gulf Professional Publishing: Oxford, UK, 2019. [Google Scholar]
  29. Kvenvolden, K.A.; Lorenson, T.D. The global occurrence of natural gas hydrate. Geophys. Monogr. Ser. 2001, 124, 3–18. [Google Scholar] [CrossRef]
  30. Hornbach, M.J.; Saffer, D.M.; Steven Holbrook, W. Critically pressured free-gas reservoirs below gas-hydrate provinces. Nature 2004, 427, 142–144. [Google Scholar] [CrossRef] [PubMed]
  31. Kutcherov, V.G.; Krayushkin, V.A. Deep-Seated Abiogenic Origin of Petroleum: From Geological Assessment to Physical Theory. Rev. Geophys. 2010, 48, 1–30. [Google Scholar] [CrossRef]
  32. Bousquet, P.; Ciais, P.; Miller, J.; Dlugokencky, E.J.; Hauglustaine, D.; Prigent, C.; Van der Werf, G.; Peylin, P.; Brunke, E.-G.; Carouge, C. Contribution of anthropogenic and natural sources to atmospheric methane variability. Nature 2006, 443, 439–443. [Google Scholar] [CrossRef]
  33. Bousquet, P.; Pierangelo, C.; Bacour, C.; Marshall, J.; Peylin, P.; Ayar, P.V.; Ehret, G.; Bréon, F.M.; Chevallier, F.; Crevoisier, C. Error budget of the MEthane Remote LIdar missioN and its impact on the uncertainties of the global methane budget. J. Geophys. Res. Atmos. 2018, 123, 11766–11785. [Google Scholar] [CrossRef]
  34. Kirschke, S.; Bousquet, P.; Ciais, P.; Saunois, M.; Canadell, J.G.; Dlugokencky, E.J.; Bergamaschi, P.; Bergmann, D.; Blake, D.R.; Bruhwiler, L. Three decades of global methane sources and sinks. Nat. Geosci. 2013, 6, 813–823. [Google Scholar] [CrossRef]
  35. Zhao, Y.; Saunois, M.; Bousquet, P.; Lin, X.; Berchet, A.; Hegglin, M.I.; Canadell, J.G.; Jackson, R.B.; Dlugokencky, E.J.; Langenfelds, R.L. Influences of hydroxyl radicals (OH) on top-down estimates of the global and regional methane budgets. Atmos. Chem. Phys. 2020, 20, 9525–9546. [Google Scholar] [CrossRef]
  36. Global Anthropogenic Non-CO2 Greenhouse Emissions: 1990–2030. U.S. Environmental Protection Agency. Available online: https://www.epa.gov/global-mitigation-non-co2-greenhouse-gases/global-non-co2-ghg-emissions-1990-2030 (accessed on 20 December 2022).
  37. Schaefer, H.; Fletcher, S.E.M.; Veidt, C.; Lassey, K.R.; Brailsford, G.W.; Bromley, T.M.; Dlugokencky, E.J.; Michel, S.E.; Miller, J.B.; Levin, I. A 21st-century shift from fossil-fuel to biogenic methane emissions indicated by 13CH4. Science 2016, 352, 80–84. [Google Scholar] [CrossRef] [PubMed]
  38. Rigby, M.; Prinn, R.G.; Fraser, P.J.; Simmonds, P.G.; Langenfelds, R.; Huang, J.; Cunnold, D.M.; Steele, L.P.; Krummel, P.B.; Weiss, R.F. Renewed growth of atmospheric methane. Geophys. Res. Lett. 2008, 35, 1–6. [Google Scholar] [CrossRef]
  39. Kolesnikov, A.; Kutcherov, V.G.; Goncharov, A.F. Methane-derived hydrocarbons produced under upper-mantle conditions. Nat. Geosci. 2009, 2, 566–570. [Google Scholar] [CrossRef]
  40. Kudryavtsev, D.; Serovaiskii, A.; Mukhina, E.; Kolesnikov, A.; Gasharova, B.; Kutcherov, V.; Dubrovinsky, L. Raman and IR Spectroscopy Studies on Propane at Pressures of Up to 40 GPa. J. Phys. Chem. A 2017, 121, 6004–6011. [Google Scholar] [CrossRef] [PubMed]
  41. Serovaiskii, A.; Kutcherov, V. Formation of complex hydrocarbon systems from methane at the upper mantle thermobaric conditions. Sci. Rep. 2020, 10, 4559. [Google Scholar] [CrossRef]
  42. Drachev, S.; Kaul, N.; Beliaev, V. Eurasia spreading basin to Laptev Shelf transition: Structural pattern and heat flow. Geophys. J. Int. 2003, 152, 688–698. [Google Scholar] [CrossRef]
  43. Cramer, B.; Franke, D. Indications for an active petroleum system in the Laptev Sea, NE Siberia. J. Pet. Geol. 2005, 28, 369–384. [Google Scholar] [CrossRef]
  44. Biastoch, A.; Treude, T.; Rüpke, L.H.; Riebesell, U.; Roth, C.; Burwicz, E.B.; Park, W.; Latif, M.; Böning, C.W.; Madec, G. Rising Arctic Ocean temperatures cause gas hydrate destabilization and ocean acidification. Geophys. Res. Lett. 2011, 38, 1–5. [Google Scholar] [CrossRef]
  45. Klauda, J.B.; Sandler, S.I. Global distribution of methane hydrate in ocean sediment. Energy Fuels 2005, 19, 459–470. [Google Scholar] [CrossRef]
  46. Shakhova, N.; Semiletov, I.; Chuvilin, E. Understanding the permafrost–hydrate system and associated methane releases in the East Siberian Arctic shelf. Geosciences 2019, 9, 251. [Google Scholar] [CrossRef]
  47. Notz, D. The future of ice sheets and sea ice: Between reversible retreat and unstoppable loss. Proc. Natl. Acad. Sci. USA 2009, 106, 20590–20595. [Google Scholar] [CrossRef] [PubMed] [Green Version]
  48. Hyndman, R.; Dallimore, S. Natural gas hydrate studies in Canada. Recorder 2001, 26, 11–20. [Google Scholar]
  49. Kvenvolden, K.A. Methane hydrate in the global organic carbon cycle. Terra Nova 2002, 14, 302–306. [Google Scholar] [CrossRef]
  50. Malakhova, V.; Golubeva, E. Model Study of the Effects of Climate Change on the Methane Emissions on the Arctic Shelves. Atmos 2022, 13, 274. [Google Scholar] [CrossRef]
  51. Reagan, M.T.; Moridis, G.J. Oceanic gas hydrate instability and dissociation under climate change scenarios. Geophys. Res. Lett. 2007, 34, 1–5. [Google Scholar] [CrossRef]
  52. Anderson, B.; Bartlett, K.; Frolking, S.; Hayhoe, K.; Jenkins, J.; Salas, W. Methane and Nitrous Oxide Emissions from Natural Sources; EPA 430-R-10-001; Office of Atmospheric Programs, US EPA: Washington, DC, USA, 2010.
  53. Shakhova, N.; Semiletov, I.; Salyuk, A.; Yusupov, V.; Kosmach, D.; Gustafsson, Ö. Extensive methane venting to the atmosphere from sediments of the East Siberian Arctic Shelf. Science 2010, 327, 1246–1250. [Google Scholar] [CrossRef]
  54. Berchet, A.; Bousquet, P.; Pison, I.; Locatelli, R.; Chevallier, F.; Paris, J.-D.; Dlugokencky, E.J.; Laurila, T.; Hatakka, J.; Viisanen, Y. Atmospheric constraints on the methane emissions from the East Siberian Shelf. Atmos. Chem. Phys. 2016, 16, 4147–4157. [Google Scholar] [CrossRef]
  55. Thornton, B.F.; Prytherch, J.; Andersson, K.; Brooks, I.M.; Salisbury, D.; Tjernström, M.; Crill, P.M. Shipborne eddy covariance observations of methane fluxes constrain Arctic sea emissions. Sci. Adv. 2020, 6, eaay7934. [Google Scholar] [CrossRef]
  56. Bussmann, I.; Hackbusch, S.; Schaal, P.; Wichels, A. Methane distribution and oxidation around the Lena Delta in summer 2013. Biogeosciences 2017, 14, 4985–5002. [Google Scholar] [CrossRef]
  57. Fenwick, L.; Capelle, D.; Damm, E.; Zimmermann, S.; Williams, W.J.; Vagle, S.; Tortell, P.D. Methane and nitrous oxide distributions across the North American Arctic Ocean during summer, 2015. J. Geophys. Res. Oceans 2017, 122, 390–412. [Google Scholar] [CrossRef]
  58. Tohjima, Y.; Zeng, J.; Shirai, T.; Niwa, Y.; Ishidoya, S.; Taketani, F.; Sasano, D.; Kosugi, N.; Kameyama, S.; Takashima, H. Estimation of CH4 emissions from the East Siberian Arctic Shelf based on atmospheric observations aboard the R/V Mirai during fall cruises from 2012 to 2017. Polar Sci. 2021, 27, 100571. [Google Scholar] [CrossRef]
  59. Angelopoulos, M.; Overduin, P.P.; Miesner, F.; Grigoriev, M.N.; Vasiliev, A.A. Recent advances in the study of Arctic submarine permafrost. Permafr. Periglac. Process. 2020, 31, 442–453. [Google Scholar] [CrossRef]
Figure 1. Global CO2 budget in 2021 modified from Friedlingstein et al. [5].
Atmosphere 14 00321 g001
Figure 2. Global CH4 budget modified from Saunois et al. [10].
Atmosphere 14 00321 g002
Figure 3. Correlation between CH4 and CO2 concentrations in the atmosphere from 1984 to 2021. The dataset was taken from [3].
Atmosphere 14 00321 g003
Figure 4. Change in the square area of ice cover in the Arctic (based on data from [16]).
Atmosphere 14 00321 g004
Figure 5. The average annual temperature of the bottom layer of the Kara Sea in the period 1999–2020 (blue line) and the trend line (black) (based on data from [50]).
Atmosphere 14 00321 g005
Table 1. Global methane emissions and sinks.
The SourceTg·y−1
Natural sources
Westlands149
Other natural sources222
Total natural sources371
Anthropogenic sources
Agriculture and waste including
  • enteric fermentation and manure
  • landfills and waste
  • rice cultivation
206
111
65
30
Fossil fuels including
  • coal mining
  • oil and gas
  • industry and transport
128
42
80
6
Biomass and biofuel burning32
Total anthropogenic sources366
Total sources737
Sinks
Total chemical loss595
Soil uptake30
Total sinks625
Imbalance112
Table 2. The estimations of gas hydrate reserves (Modification of the Table 2 [27], p. 185).
Gas Hydrates Reserves (×1015 m3)Authors
40Kvenvolden and Claypool, 1988
20Kvenvolden, 1988
20MacDonal, 1990
26–140Gornitz and Fung, 1994
23–91Harvey and Huang, 1995
1Ginsburg and Soloviev, 1995
7Holbrook et al., 1996
15Makogon, 1997
2–20Dickens et al., 1997
3–5Milkov et al., 2003
Table 3. Composition of gases in natural gas hydrates [28].
Gas Hydrate DepositGas Content, mol %
CH4C2H6C3H8i-C4H10n-C4H10C5+CO2N2
Haakon Mosby mud volcano, Norway99.50.10.10.10.10.1
Bush Hill Yellow, USA73.511.511.6210.30.1
Green Canyon White, USA66.58.915.87.21.40.2
Bush Hill, USA29.715.336.69.744.7
Mallik, Canada99.70.030.27 0.50.77
Nankai Trough-1, Japan94.32.60.570.090.8 0.241.4
Blake Ridge, USA99.90.02 0.08
Table 4. Permafrost areas in some regions of the Arctic shelf.
Arctic RegionPermafrost Area, Thousand km2
East Siberian Shelf810.6
Chukchi Sea472.8
Kara Sea434.7
Laptev Sea402.7
Barents Sea122.2
Beaufort Sea97
Total:2340
Disclaimer/Publisher’s Note: The statements, opinions and data contained in all publications are solely those of the individual author(s) and contributor(s) and not of MDPI and/or the editor(s). MDPI and/or the editor(s) disclaim responsibility for any injury to people or property resulting from any ideas, methods, instructions or products referred to in the content.

