Article

Numerical Investigation on Impact Erosion of Aeolian Sand Saltation in Gobi

1
Key Laboratory of Mechanics on Disaster and Environment in Western China, Lanzhou University, Lanzhou 730000, China
2
College of Civil Engineering and Mechanics, Lanzhou University, Lanzhou 730000, China
*
Authors to whom correspondence should be addressed.
Atmosphere 2023, 14(2), 349; https://doi.org/10.3390/atmos14020349
Submission received: 17 January 2023 / Revised: 2 February 2023 / Accepted: 3 February 2023 / Published: 9 February 2023

Abstract

:
Sand drift erosion is common on aeolian landforms, particularly in the Gobi desert where sand drift is often quite strong. Sand drift erosion can lead to many types of hazards, including severe crop loss, structural damage to buildings or infrastructure, and abrasion of soil or clay components that contribute to the production of fine particulate matter. This article combines the Gobi sand flow model with the solid particles erosion model to simulate the sand drift erosion process in a variety of Gobi environments. The results show that the impact erosion of saltation particles is highly dependent on both the friction velocity and the gravel coverage. Saltation erosion amount increases with the increment of friction velocity and the gravel coverage. The vertical profile of saltating erosion rate displays a clear stratification pattern composed of a linear increasing layer, a damage layer, and a monotonic decreasing layer. The maximum value of the saltation erosion rate increases as the friction velocity increases and their curve shows a power-law relationship. The damage height caused by saltation erosion is primarily concentrated in the height range of 0.03 m to 0.15 m, and it increases approximately linearly with friction velocity.

1. Introduction

Aeolian landforms are extensively distributed on Earth, Mars, and other Earth-like planets [1,2,3]. Wind-blown sand movement is a near-surface transport phenomenon occurring frequently in aeolian landforms such as a sand desert and the Gobi [4,5,6]. It is the primary cause of numerous geophysical phenomena, such as dust emissions, soil wind erosion, and desertization [7,8,9,10]. As a mode of wind erosion, impact erosion refers to the process of erosion damage to the surfaces of building structures caused by the collision and impact of airborne sand particles. Impact erosion by sand drift has long been a significant contributor to serious wear and tear on roads, houses, bridges and other mixed-concrete structures in sandy lands, which lowers the strength and safety of the mixed-concrete buildings, thus creating a potential safety threat [11,12,13]. Especially in the Gobi region, with strong winds and long wind periods, the concrete and steel construction around them suffer more serious impacts and damage [14,15].
Wind-blown sand movement is a complex physical process in which sand particles, airflow fields and granular beds are coupled with each other to form a two-phase flow of gas and solid [16,17]. For tens of years, considerable efforts have been devoted to the research of aeolian sediment transport [18,19,20,21,22]. Researchers have gradually developed and improved the mathematical model of wind-blown sand movement [23,24,25,26,27], and multiple wind tunnel tests and field observations have confirmed its accuracy [28,29,30]. Recent experimental research, in particular, parameterized the sand-bed collision mechanisms on the Gobi and granular bed utilizing natural sand bed samples and sand grains [31,32]. Those studies have laid a foundation for the establishment of the Gobi sand flow model.
Airborne particles will wear down and harm the building walls when they come in contact with them [33]. Many academics devoted themselves to studying the erosion of various target materials by sand-carrying jet impingement experiment [34,35,36,37]. Erosion rate is defined as the ratio of the lost mass of target material to the total mass of impact sand particles, and numerous empirical models are present to describe the erosion rate as a function of impact velocity and impact angle [37,38,39,40]. Particle erosion models and computational fluid dynamics (CFD) technique are frequently combined to estimate solid particle erosion in several significant areas of the oil and gas industry [41,42]. In contrast, this related technique has not been applied very often in studies on saltating sand erosion, and research on it is mainly focused on field observations and wind tunnel experiments [43,44,45,46].
Field observation on a boulder alluvial plain subjected to sand drift shows a maximum erosion at 10 12 cm above the ground [47]. Liu et al. [48] gave the vertical profile of the saltation erosion rate by wind tunnel measurements of adobe abrasion. Shi and Shi [49] first combined the steady-state saltation model with the particle erosion rate model to simulate the sand drift erosion and confirmed the early conclusion that the kinetic energy is crucial to erosion. These studies, however, have been limited to qualitative analyses or simple quantitative descriptions of sand drift erosion, without providing a quantitative parametric characterization of the change in saltating erosion rate under various environmental conditions, so they are unable to provide helpful recommendations for the erosion protection of building structures in aeolian environments.
The numerical model for this investigation was built by combining the solid particle erosion model with the Gobi sand flow model. We simulate and investigate the spatial distribution of impact erosion by aeolian saltation in different Gobi environments, including varying gravel covering and friction velocity, and provide a parametric model for the variation of saltation erosion rate with friction velocity and gravel coverage.

2. Methodology

2.1. Particle Motion Governing Equations

Sand particles are assumed to be small spheres, and every particle in the air is tracked. Airborne particle motion is computed by explicitly solving the particle motion equation using an explicit temporal integration approach [50,51]. The governing equations of particle motion can be written as follows [52]:
m d v d t = f d + f l m g
v = d x p d t
where x p and v stand for the position coordinates and particle velocity, respectively; m is the particle mass; g is the acceleration of gravity; f d and f l represent, respectively, aerodynamical drag and aerodynamical lift, and can be expressed as [22,53]:
f d = π 8 ρ d 2 C d u r v u
and
f l = π 8 ρ d 3 C l ( | u | 2 )
where u r = | v u | stands for the velocity of particles relative to fluid; u is the fluid velocity; ρ = 1.23 kg / m 3 is the fluid density; d is the particle diameter; C d = 24 / R e p ( 1 + 0.15 R e p 0.687 ) and C l = 0.85 C d represent, respectively, the drag coefficient and lift coefficient, in which R e p = u r d / ν is the particle Reynolds number and ν = 1.5 × 10 5 m 2 / s is the kinematic viscosity coefficient of the fluid.
Airborne particles are accelerated by the airflow and their motion is governed by Equations (1) and (2). There are numerous schemes available for the solution of the motion equations, including Euler schemes, Verlet schemes, and others. We use here the Runge–Kutta scheme due to its high accuracy while ensuring the efficiency of the calculation [54].
In one iteration step, after solving the particle’s motion, we will scan all particles in the air and find out the particle pairs that contact each other. Because there are so many particles in midair, collisions frequently happen as they move. In this study, a collision happens when a pair of particles’ centroids are closer together than the sum of their radii. Then, the post-collision velocity of two colliding particles determine directly with the collision theory, and the post-collision velocity v 1 on one of the particles after colliding is [55]:
v 1 = v 1 + ϵ ( n · v 12 ) n + υ [ v 12 ( n · v 12 ) n ]
with
ϵ = 1 + ε 1 + η
υ = ( 2 / 7 ) ( 1 μ ) 1 + η
where the subscript 1 or 2 of the variable refers to the label of each particle in the collision pair and v 12 = v 2 v 1 is the relative velocity before the collision; n = ( x p , 2 x p , 1 ) / | x p , 2 x p , 1 | is a unit vector from one particle centre pointing to the centre of the other one; η = m 1 / m 2 is the mess ratio of two colliding particles; ε and μ are restitution coefficients for the normal and tangential components, respectively. For quartz particles, generally set ε = 0.9 , and μ can be calculated with the following formula [56]:
μ = m a x 0 , 1 C f ( 1 + ε ) 2 / 7 u pn u pt
where C f = 0.4 is the friction coefficient [57]; u pn and u pt are the normal and tangential relative velocities between the two particles in the colliding pair, respectively. v 2 can be calculated using the same method, thus there is no need to repeat that process here.

2.2. Aerodynamic Governing Equations

The movement of airflow can be described using the equation below:
ρ u t + ρ u · u = T + F p 1 ϕ p
where T stands for the stress tensor of the fluid; ϕ p is the particle volume fraction; F p = n = 1 N p f d , n / V c is the reaction force of N p particles in unit volume V c to the flow field.
For the steady and homogeneous flow field studied in this article, the inertia and horizontal stress gradients of the fluid are neglected. If only the horizontal flow components is considered, Equation (9) can be simplified to [16,53]:
τ f z + F p 1 ϕ p = 0
where u and F p are, respectively, the horizontal component of u and F p ; τ f represents the stress, which contains both viscous stress and Reynolds stress. A Prandtl’s mixing length model with the kinematic turbulent viscosity ν t = l m 2 | u / z | is used to close Equation (10). The expression of τ f can be given as [58]:
τ f = ρ ( ν + ν t ) u z = ρ ν + l m 2 u z u z
with the mixing length scale l m ( z ) = κ z and κ = 0.4 being von Karman constant. According to the boundary conditions τ f | z = ρ u * 2 and ignoring the effect of viscous stress, the governing equation of airflow can be obtained as:
d u d z = 1 κ z u * 2 1 ρ z z max F p 1 ϕ p d z 1 2
where u * is the friction velocity.

2.3. Surface Process

When saltation sand particles hit the bed surface, complex interactions between particles and the bed happen [59,60]. In general, it is extremely challenging to accurately describe this process in sand drift [27]. The currently common method for numerical simulation is to replace it with the splash function [61,62,63].
The impactor, with impact velocity v i , impact angle θ i , and azimuthal angle φ i , will return at a specified speed and angle after impacting the gravel or sand bed. We indicate the impactor’s rebound speed and angle by v r and θ r . The velocity of rebound is given by the equation v r = e r v i , where e r is the restitution coefficient. Experiments show that e r and θ r accord with normal distribution. When a particle impacts the sand bed, it will not only bounce back but also eject new particles from the bed. The number of sand particles ejected n ej , as well as their initial velocity V ej and initial angle θ ej all obey lognormal distribution. As for the azimuth angle φ ej , Xing and He [64] pointed out that, due to symmetry, the distribution of azimuth angle φ ej satisfies normal distribution with a mean value of μ = 0 , The parameter of splash model are all shown in Table 1.
Static particles on the granular bed are not only motivated by impactors but also are directly entrained by the airflow, which is called aerodynamic entrainment. When the friction velocity u * is greater than the threshold friction velocity u * t , the particles are motivated from the bed. The threshold friction velocity is used to determin by u * t = A ρ p / ρ 1 g d with A = 0.1 [4].
The sand particles entrained by aerodynamic force will have a certain initial velocity, which is known as the initial take-off velocity. Kang et al. [65] proposes that the horizontal velocity of sand particles obeys normal distribution, while the vertical component obeys exponential distribution:
S ( v x 0 ) = 1 2 π A exp ( v x 0 B ) 2 2 A 2
S ( v z 0 ) = 1 C exp ( v z 0 C )
where, the values of the parameters are A = 0.5030 , B = 0.7135 and C = 0.3952 , respectively.
Aerodynamic entrainment plays an important role in the initiation stage in a sand drift. With the gradual strengthening of the saltation, the airborne shear stress on the bed surface decreases and eventually becomes smaller than the aerodynamic entrainment threshold. In this work, we study the subjects in the case of steady-state sand flow, which means that aerodynamic entrainment can be neglected during the simulation. Only Equations (13) and (14) are utilized to give the initial velocity of the particle at the first step of the sand drift.

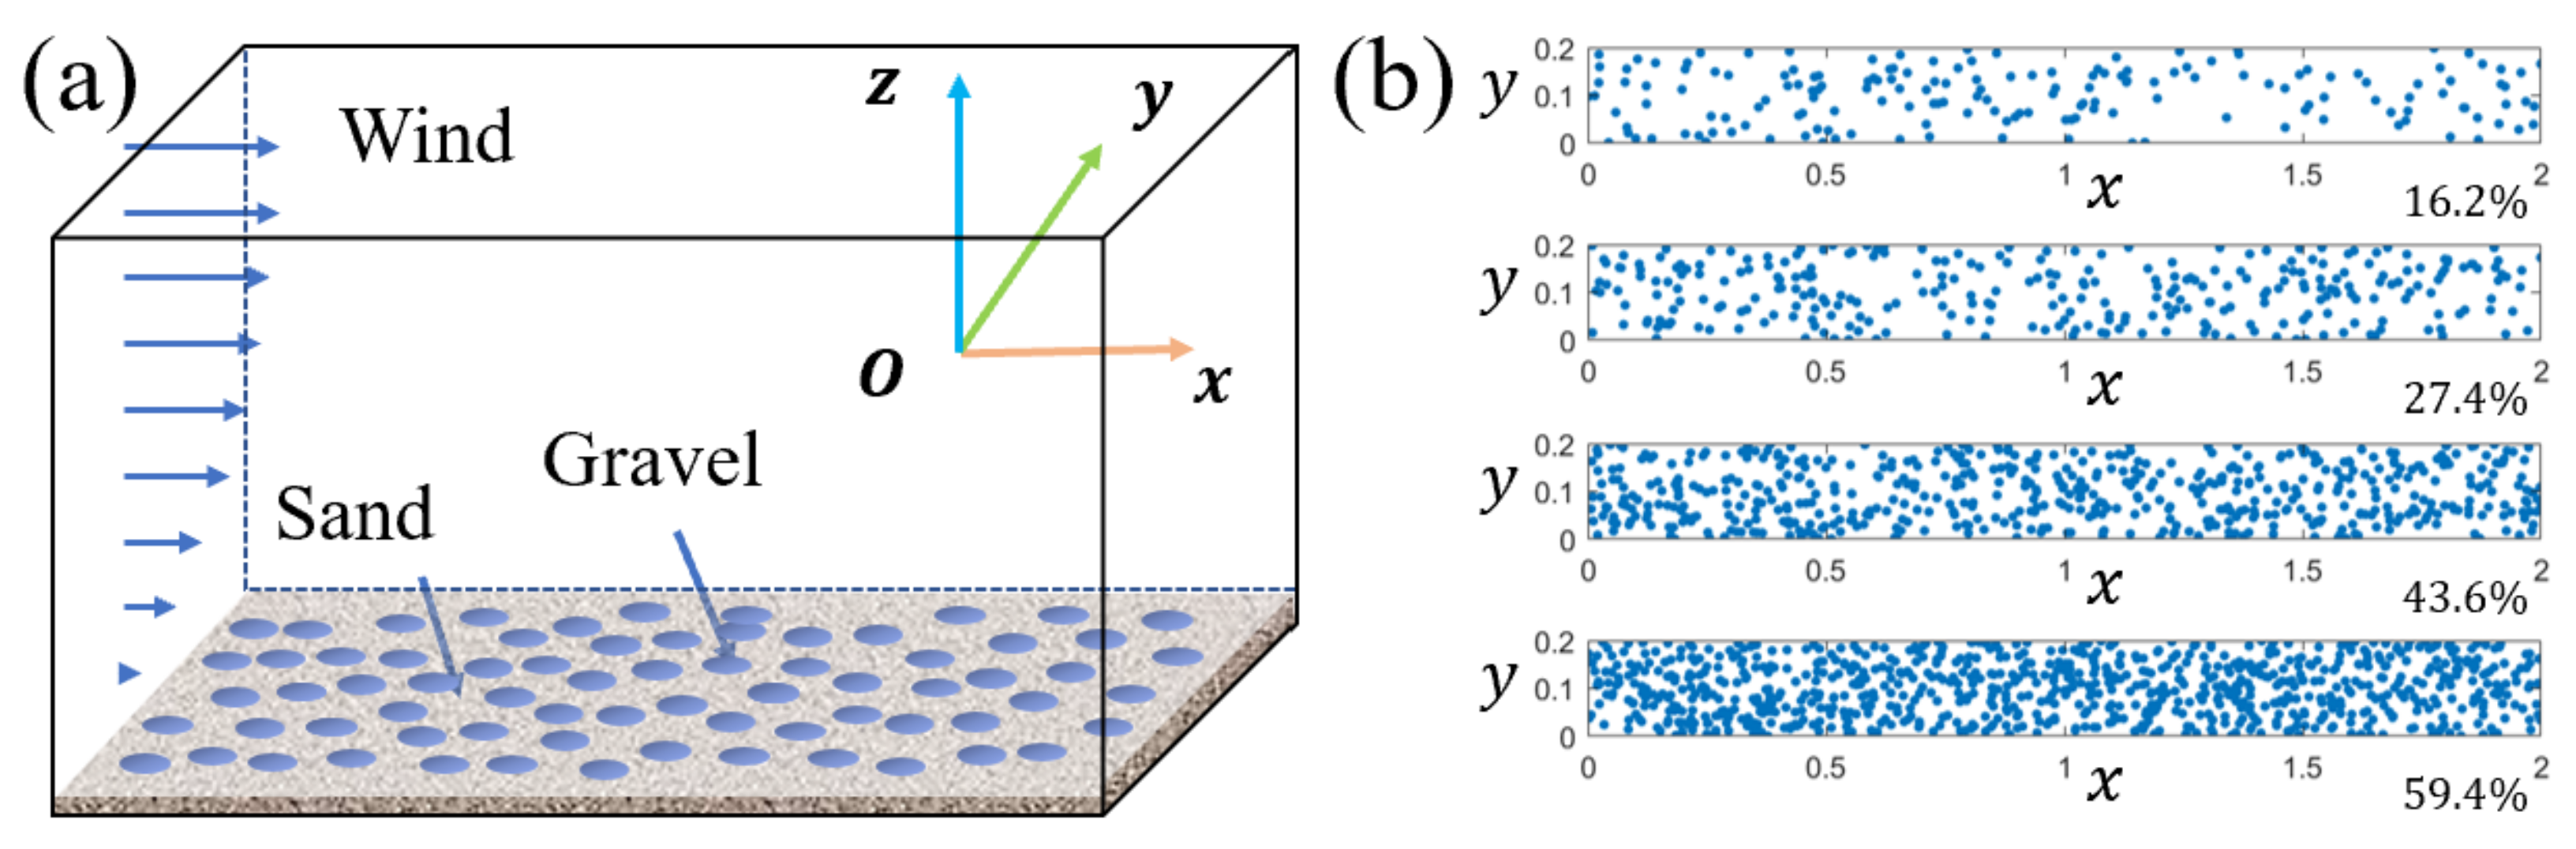
2.4. Realization Method of Gobi Bed

In this study, the numerical simulation of wind-blown sand flow involves two types of beds, one is a sand bed and the other is a gobi bed. The sand bed is composed of sand particles, while the gobi bed is composed of sand particles covered with a certain amount of gravel.
In the numerical model, we randomly generated a certain number of circular areas on the sand bed as simulated gravel cover (Figure 1a). Referring to the previous researchers’ wind tunnel simulation experiments, the diameter of each small circular area is set to 2.0 cm [66,67,68]. For numerical simulation, we set up the Gobi with five levels of gravel cover: 0 % , 16.2 % , 24.7 % , 43.6 % and 59.4 % , as shown in Figure 1b. The four subplots in Figure 1b represent both the four gravel-covered Gobi beds used in the simulation, where the blue circles represent gravels and the white areas represent granular beds.
In addition, gravel covering not only affects the particle-bed collision but also affects the aerodynamic roughness of the bed surface. Previous studies have shown that due to the influence of gravel cover, the aerodynamic roughness of the Gobi bed is the order of 10 4 10 3 m [69,70], which is larger than commonly set z 0 s = d / 30 of the sand bed.

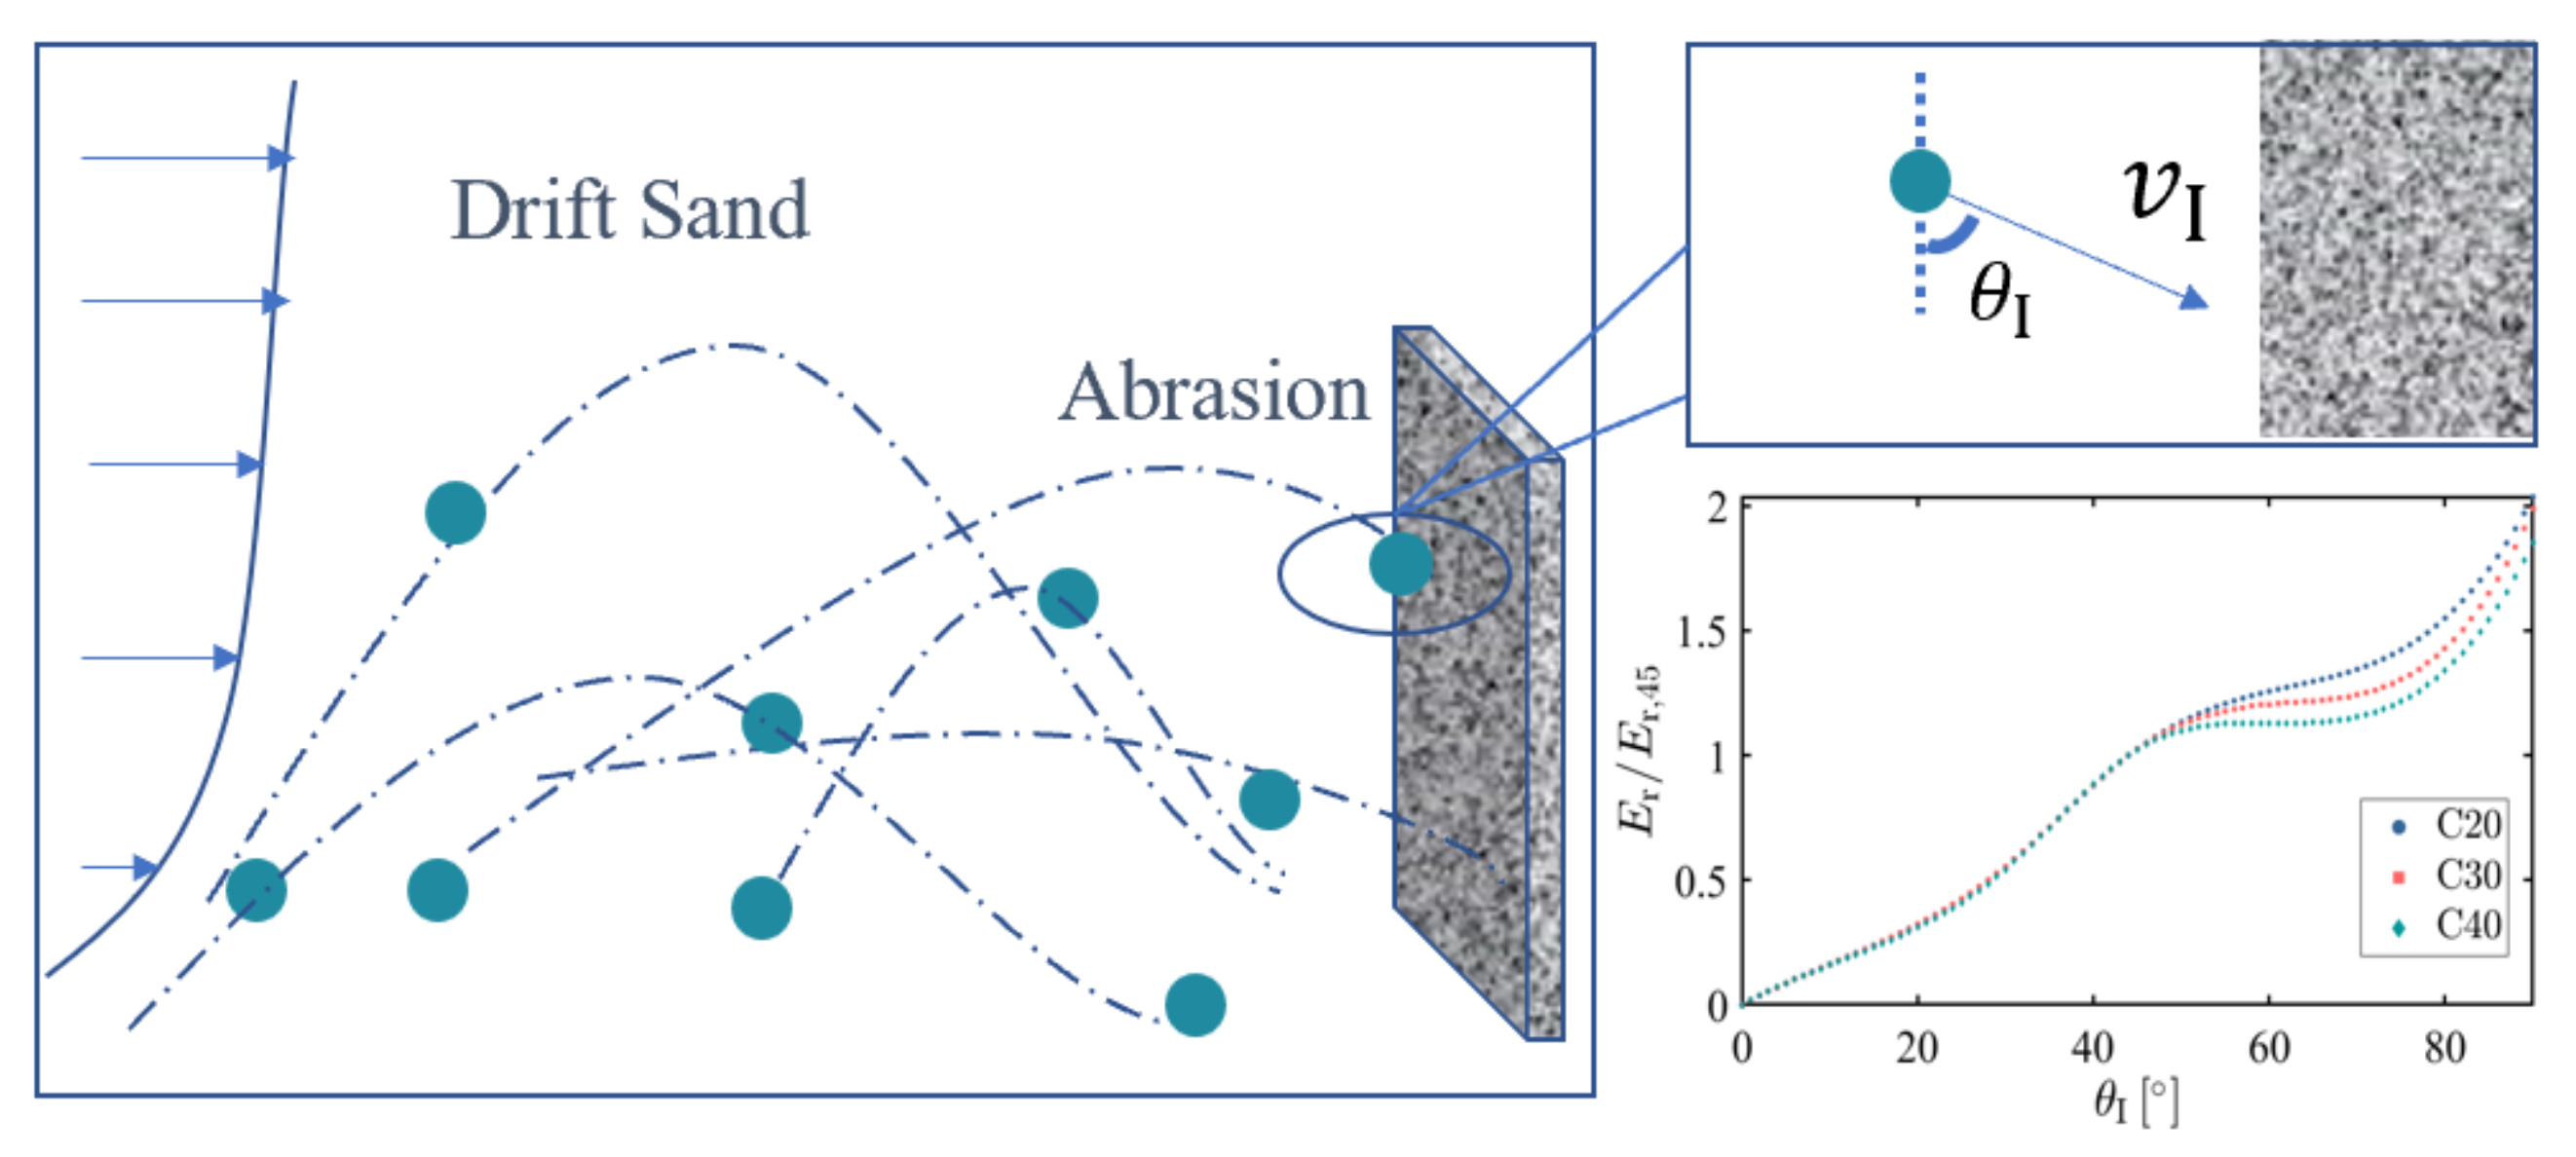
2.5. Calculation Method of Impact Erosion by Sand Drift

Saltation sand erosion is a physical process in which the sand carrying fluid continuously strikes the solid surface, causing the solid surface materials to gradually wear away. For solid particles striking various targets, it is believed that the impact particle velocity, angle, particle size, particle type, and target strength all have an impact on the erosion rate. The parameters that have been investigated the most extensively are impact velocity and angle. Some academic researchers have also considered the impact of particle size; however, they have primarily focused on metallic targets [37,71]. For sand-impacted concrete materials, there are relatively few studies on particle size dependence. The erosion rate E r in the model used in this study depends only on the impact velocity V I and impact angle θ I , and parameters such as particle size and density are considered to be constant and consistent with those in the experiment.
To study the spatial distribution characteristics of sand drift erosion, we set up a virtual wall that is 0.2 m broad and 1.0 m height in the wind-blown sand flow, as shown in Figure 2. The wall is divided into 10 × 100 cells, each cell size is 0.02 m × 0.01 m. The spatial distribution of E a is obtained by calculating the accumulation of erosion in each cell during sand drift by the position coordinate y p , z p , impact speed V I and impact angle θ I of the saltating sand particles when it impacts the wall:
E a ( y , z ) | y = y p , z = z p = m p E r ( V I , θ I ) Δ y Δ z
where m p is the mass of the saltating sand particles. Oka et al. [71] suggests that the variables V I and θ I of E r could be separated, and it can be expressed as:
E r ( V I , θ I ) = g ( θ I ) E r , 45 ( V I )
in which E r , 45 stand for the erosion rate at θ I = 45 .
Hao et al. [38] investigated the erosion rate of three different types of concrete materials, namely C20, C30, and C40, and propose a power empirical formula to parameterize the variation of erosion rate with impact velocity:
E r , 45 = K e V I n e
where K e and n e are empirical parameters relating to concrete materials, and their values are listed in Table 2.
As was already mentioned, the velocity and angle of impactors both affect the erosion rate. Although Hao et al. [38] experimentally investigated the quantitative relationship of erosion rate with impact angle θ I , it did not give an empirical model about g ( θ I ) similar to Equation (17). Using the method of spline interpolation, we calculate the values of g ( θ I ) corresponding to various angles θ I based on the experimental results, as shown in Figure 2. As a result, the erosion rate at any impact angle can be determined.

2.6. Calculation Procedure

For a total of 10 s, two stages of numerical simulations of the sand drift were carried out. The first stage was calculated for 5 s, which is used to allow the sand flow to develop to a steady state [29,53]. The second stage begins with the saltation erosion computation, which takes also 5 s to complete. The calculation procedure is as follows:
  • Given the friction velocity u * , the initial wind field can be calculated using Equation (10). Next, introduce 100 particles from the bed, their x , y coordinates are uniform random numbers, and initial velocity are determined by Equations (13) and (14).
  • Calculate f d and f l of each particles, and solve the motion Equations (1) and (2) and update each particle’s position.
  • Search all particles and find out every collision pair. Renew the velocity of collision particles using Equation (5).
  • Find out particles below the surface and the coordinates of their impact location. The properties of bound particles and ejected particles can be inferred from the splash function in Table 1. If the rebound velocity of a particle after hitting the bed is not sufficient to move it to a height above one particle diameter, the particle is considered to have transformed into a static particle on the bed and is removed from the saltation system.
  • Identify the particles that come into contact with the wall and the corresponding collision locations. Calculate the impact erosion based on Equation (15).
  • Calculate F p and update the wind field with Equation (10).
  • Return to step (2) and start the calculation of the next step.

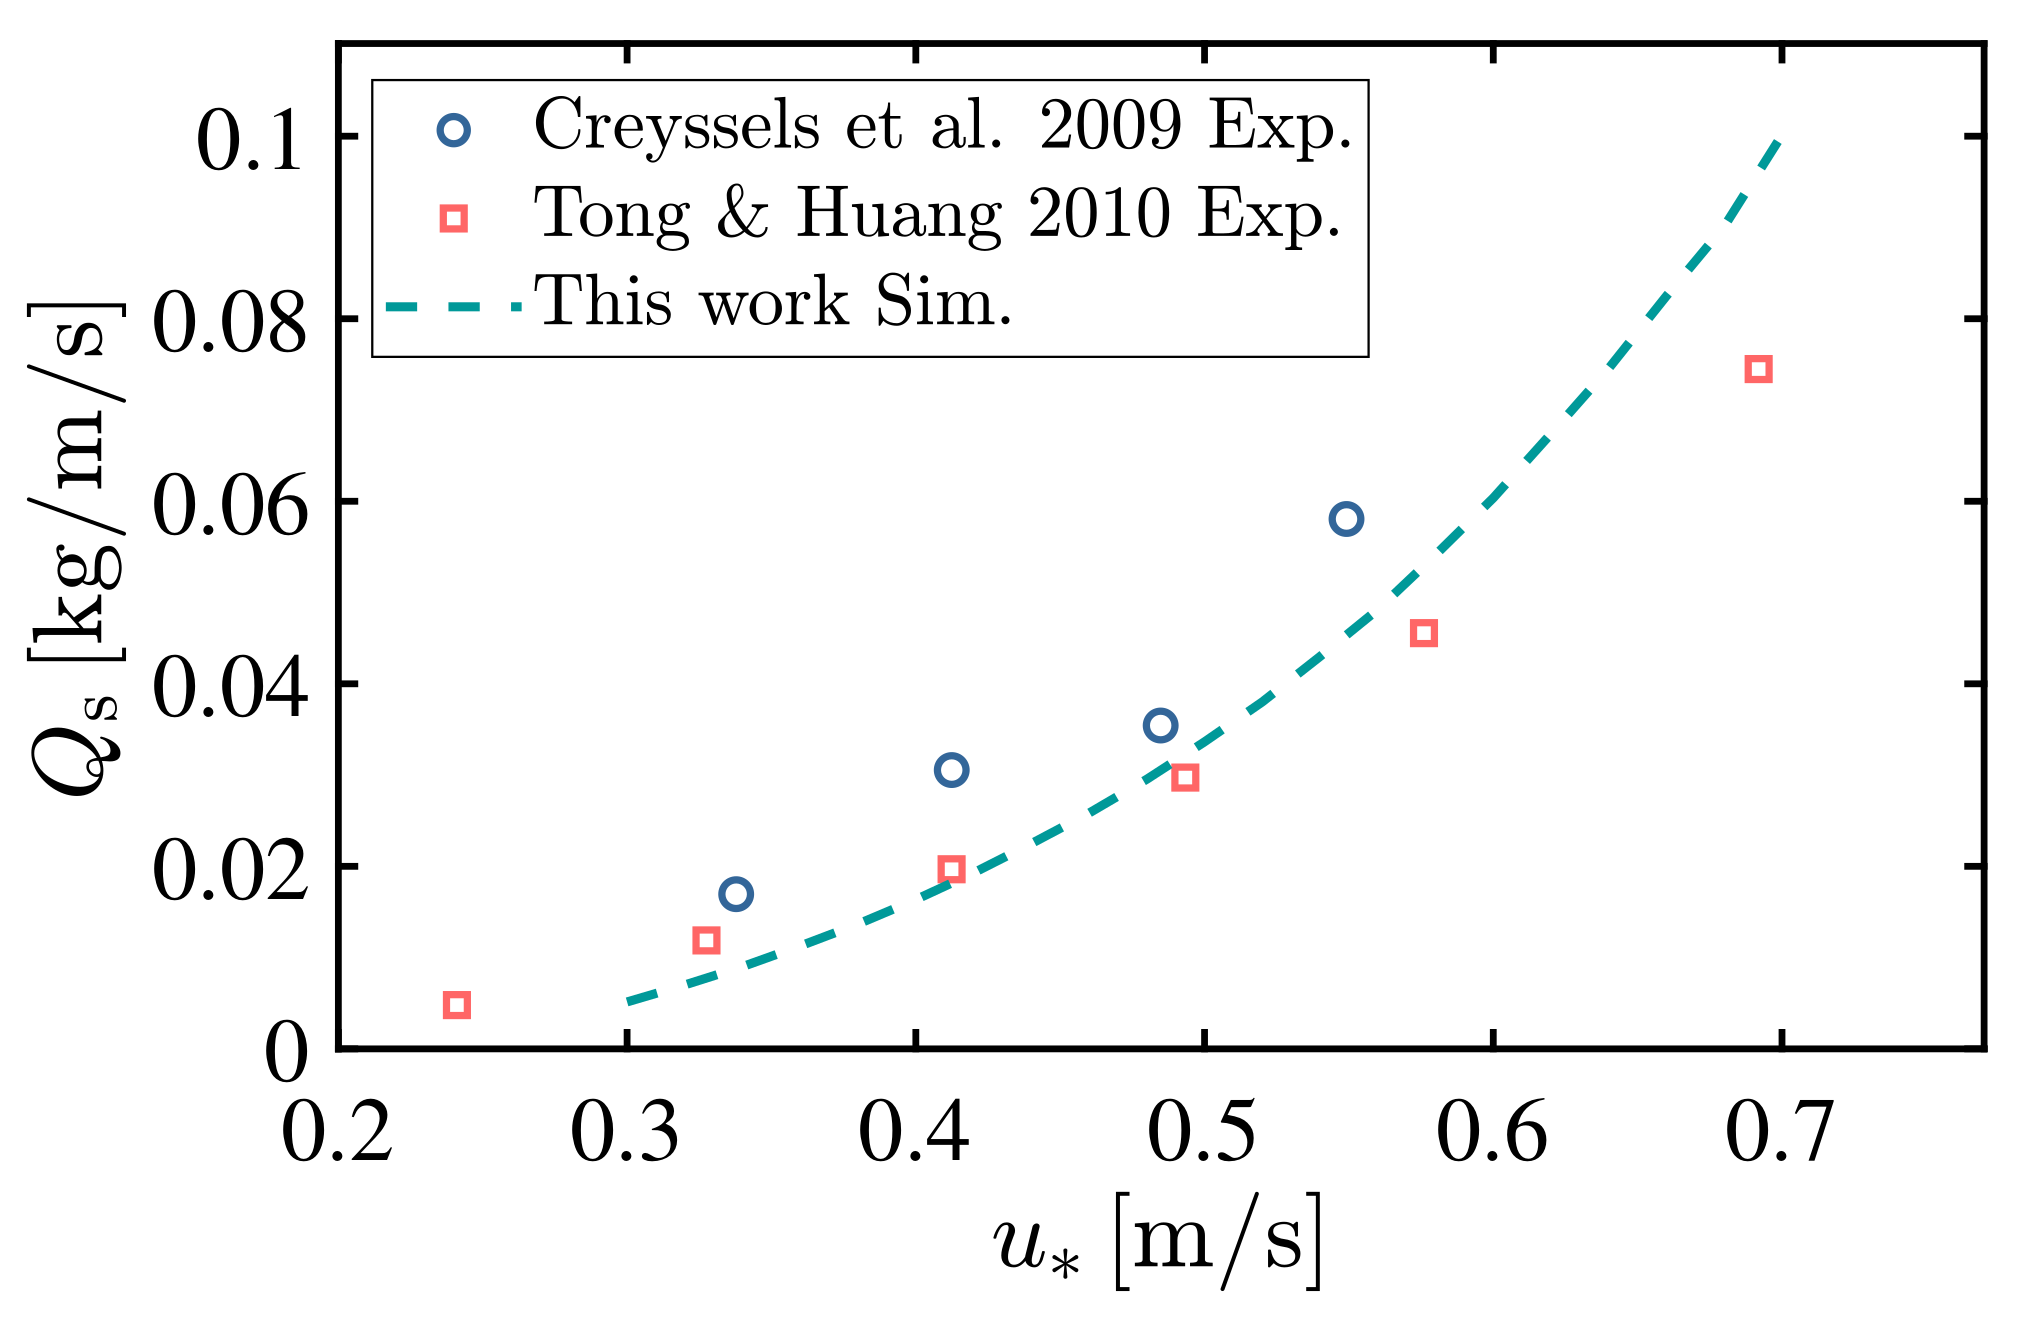
2.7. Model Verification

In this section, we compare the numerical simulation results of sediment transport with the experimental results to verify the reliability of the numerical model. There, the diameter and density of the sand particles were set to d = 0.25 mm and ρ p = 2650 kg / m 3 , respectively.
Figure 3 shows the change of sediment transport rate Q s with the friction velocity u * from simulation and experiment on the sand bed (the gravel coverage is 0 % ), in which the experimental results are presented by Creyssels et al. [72] and Tong and Huang [29]. It can be seen that the numerical simulation results of Q s versus u * are consistent with the experimental results.
In addition, we contrasted the numerical results of mass flux profiles on the sand bed and on the Gobi (the gravel coverage is 60 % ) with the results of the experiments performed by Zhang et al. [73] and Tong and Huang [29] (Figure 4). The figure shows that, whether on the sand bed or the Gobi bed, the simulated data are found to be in good agreement with the experimental results.
The stratification pattern of mass flux profile, proposed by Zheng et al. [28], refers to the phenomenon that the mass flux can be divided into three layers, containing a growth layer, a saturation layer and a decay layer. which is very common in sand drift in Gobi. As shown in Figure 4b, the stratification pattern of the mass flux profile in sand drift is accurately reproduced by the simulation results on the Gobi. These numerical examples demonstrate that the numerical model used in the study can accurately simulate wind-blown sand movement on sand surfaces and the Gobi.

3. Results and Discussion

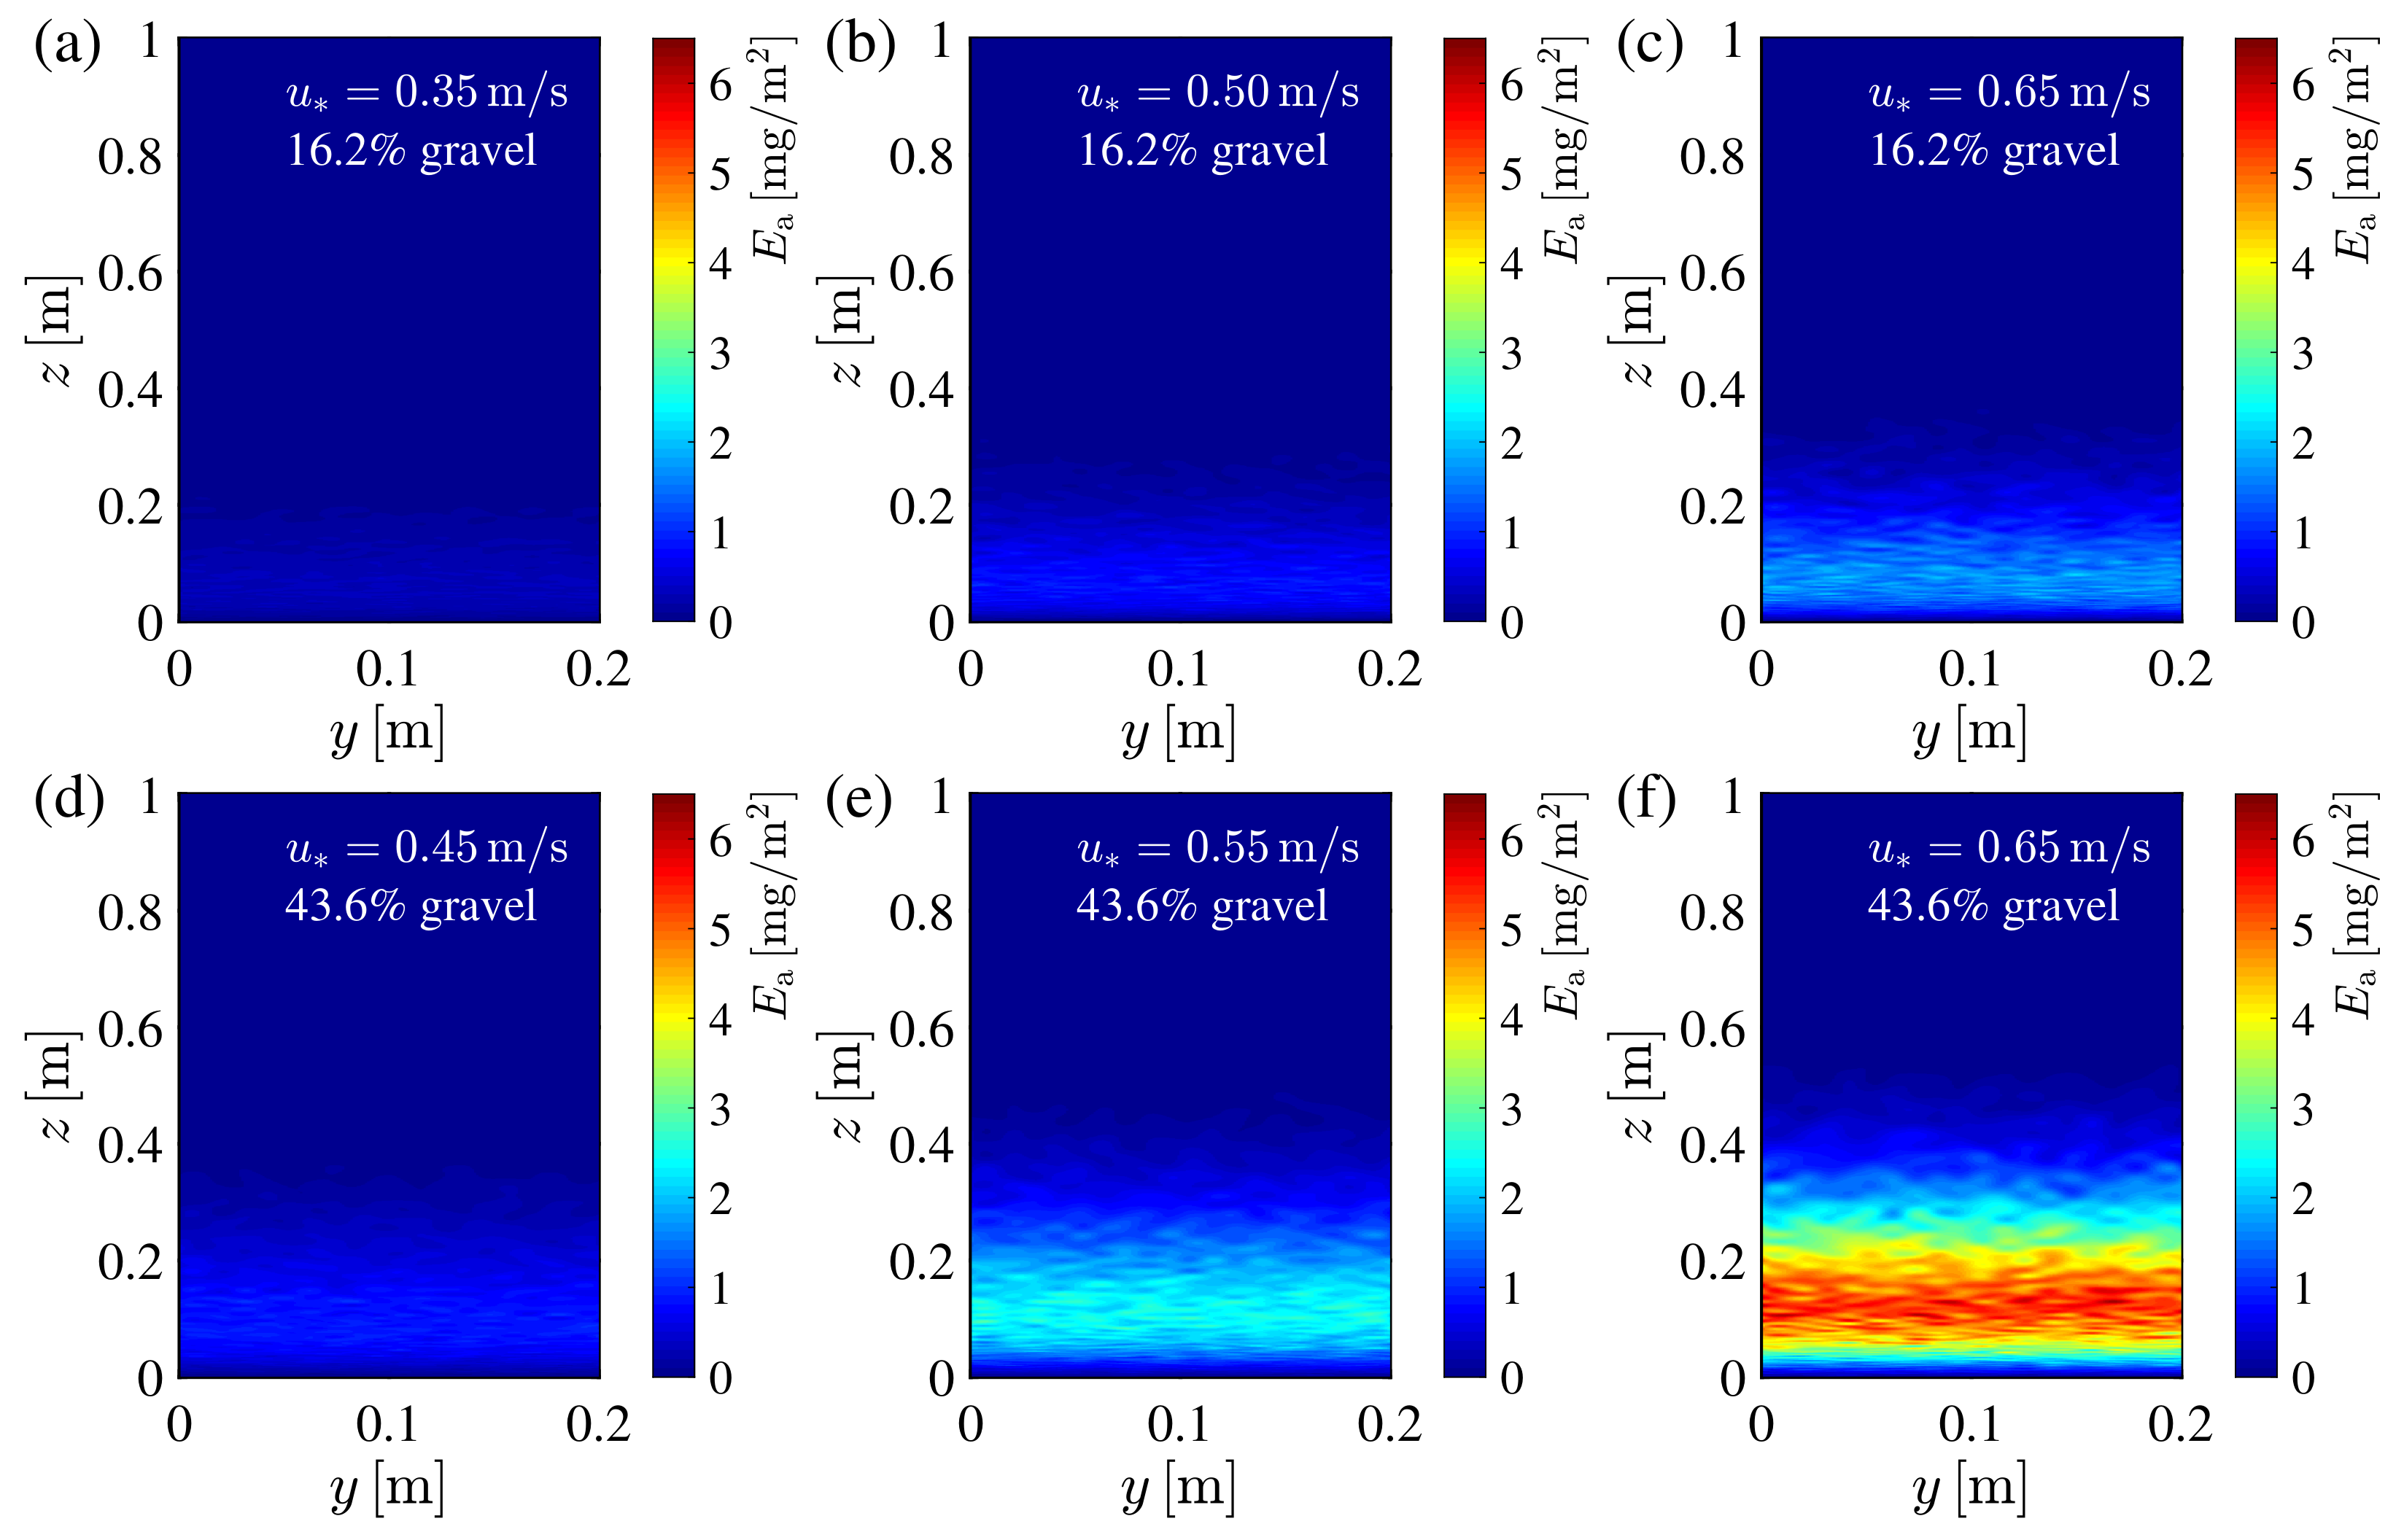
3.1. Spatial Distribution Image of Sand Drift Erosion

The erosion effect of the wind-blown sand flow causes destructive impacts on buildings next to the aeolian landform [49]. In order to reveal how gravel coverage and friction velocity affect the impact erosion of sand drift in the Gobi, and analyze the spatial distribution characteristics of saltation erosion. We calculated the sand drift erosion amount E a [ mg / m 3 ] with C 20 concrete as target material under different gravel coverage and friction velocity, as shown in Figure 5 and Figure 6.
Sand drift creates impact erosion, which accumulates over time, causing the erosion amount E a to rise with time, as seen in Figure 5. We can also deduce at least two other intriguing findings from Figure 5. First, the distribution of sand drift erosion along the vertical direction is not monotonic, with maximum values of impact erosion occurring at heights of about 0.05 0.15 m . Second, sand drift erosion is influenced by the gravel cover; On the Gobi with a 60 % gravel covering, the erosion amount on the concrete wall is more than twice as great as it is on the Gobi with a 27.4 % gravel coverage. This is due to the fact that an increment in gravel coverage from 16.2 % to 43.6 % causes a sediment flux to increase [74,75], more sand particles to impact the wall, and ultimately causes an increase of erosion amount.
In general, when the friction velocity increases, the saltating sand particle will gain more kinetic energy from the airflow. The erosion amount will be influenced by the increased wind speed since it will strengthen the wind-blown sand flow. Friction velocity u * is used to characterize the wind speed in the investigation of aeolian sediment transport. Figure 6 shows that, with the same gravel coverage, impact erosion amount increases dramatically as friction velocity increases, with E a being more than five times higher at u * = 0.65 m / s compared to u * = 0.45 m / s . When compared to the same friction velocity, the Gobi covered with 60 % gravel experience greater erosion amount than the Gobi covered with 16.2 % gravel.

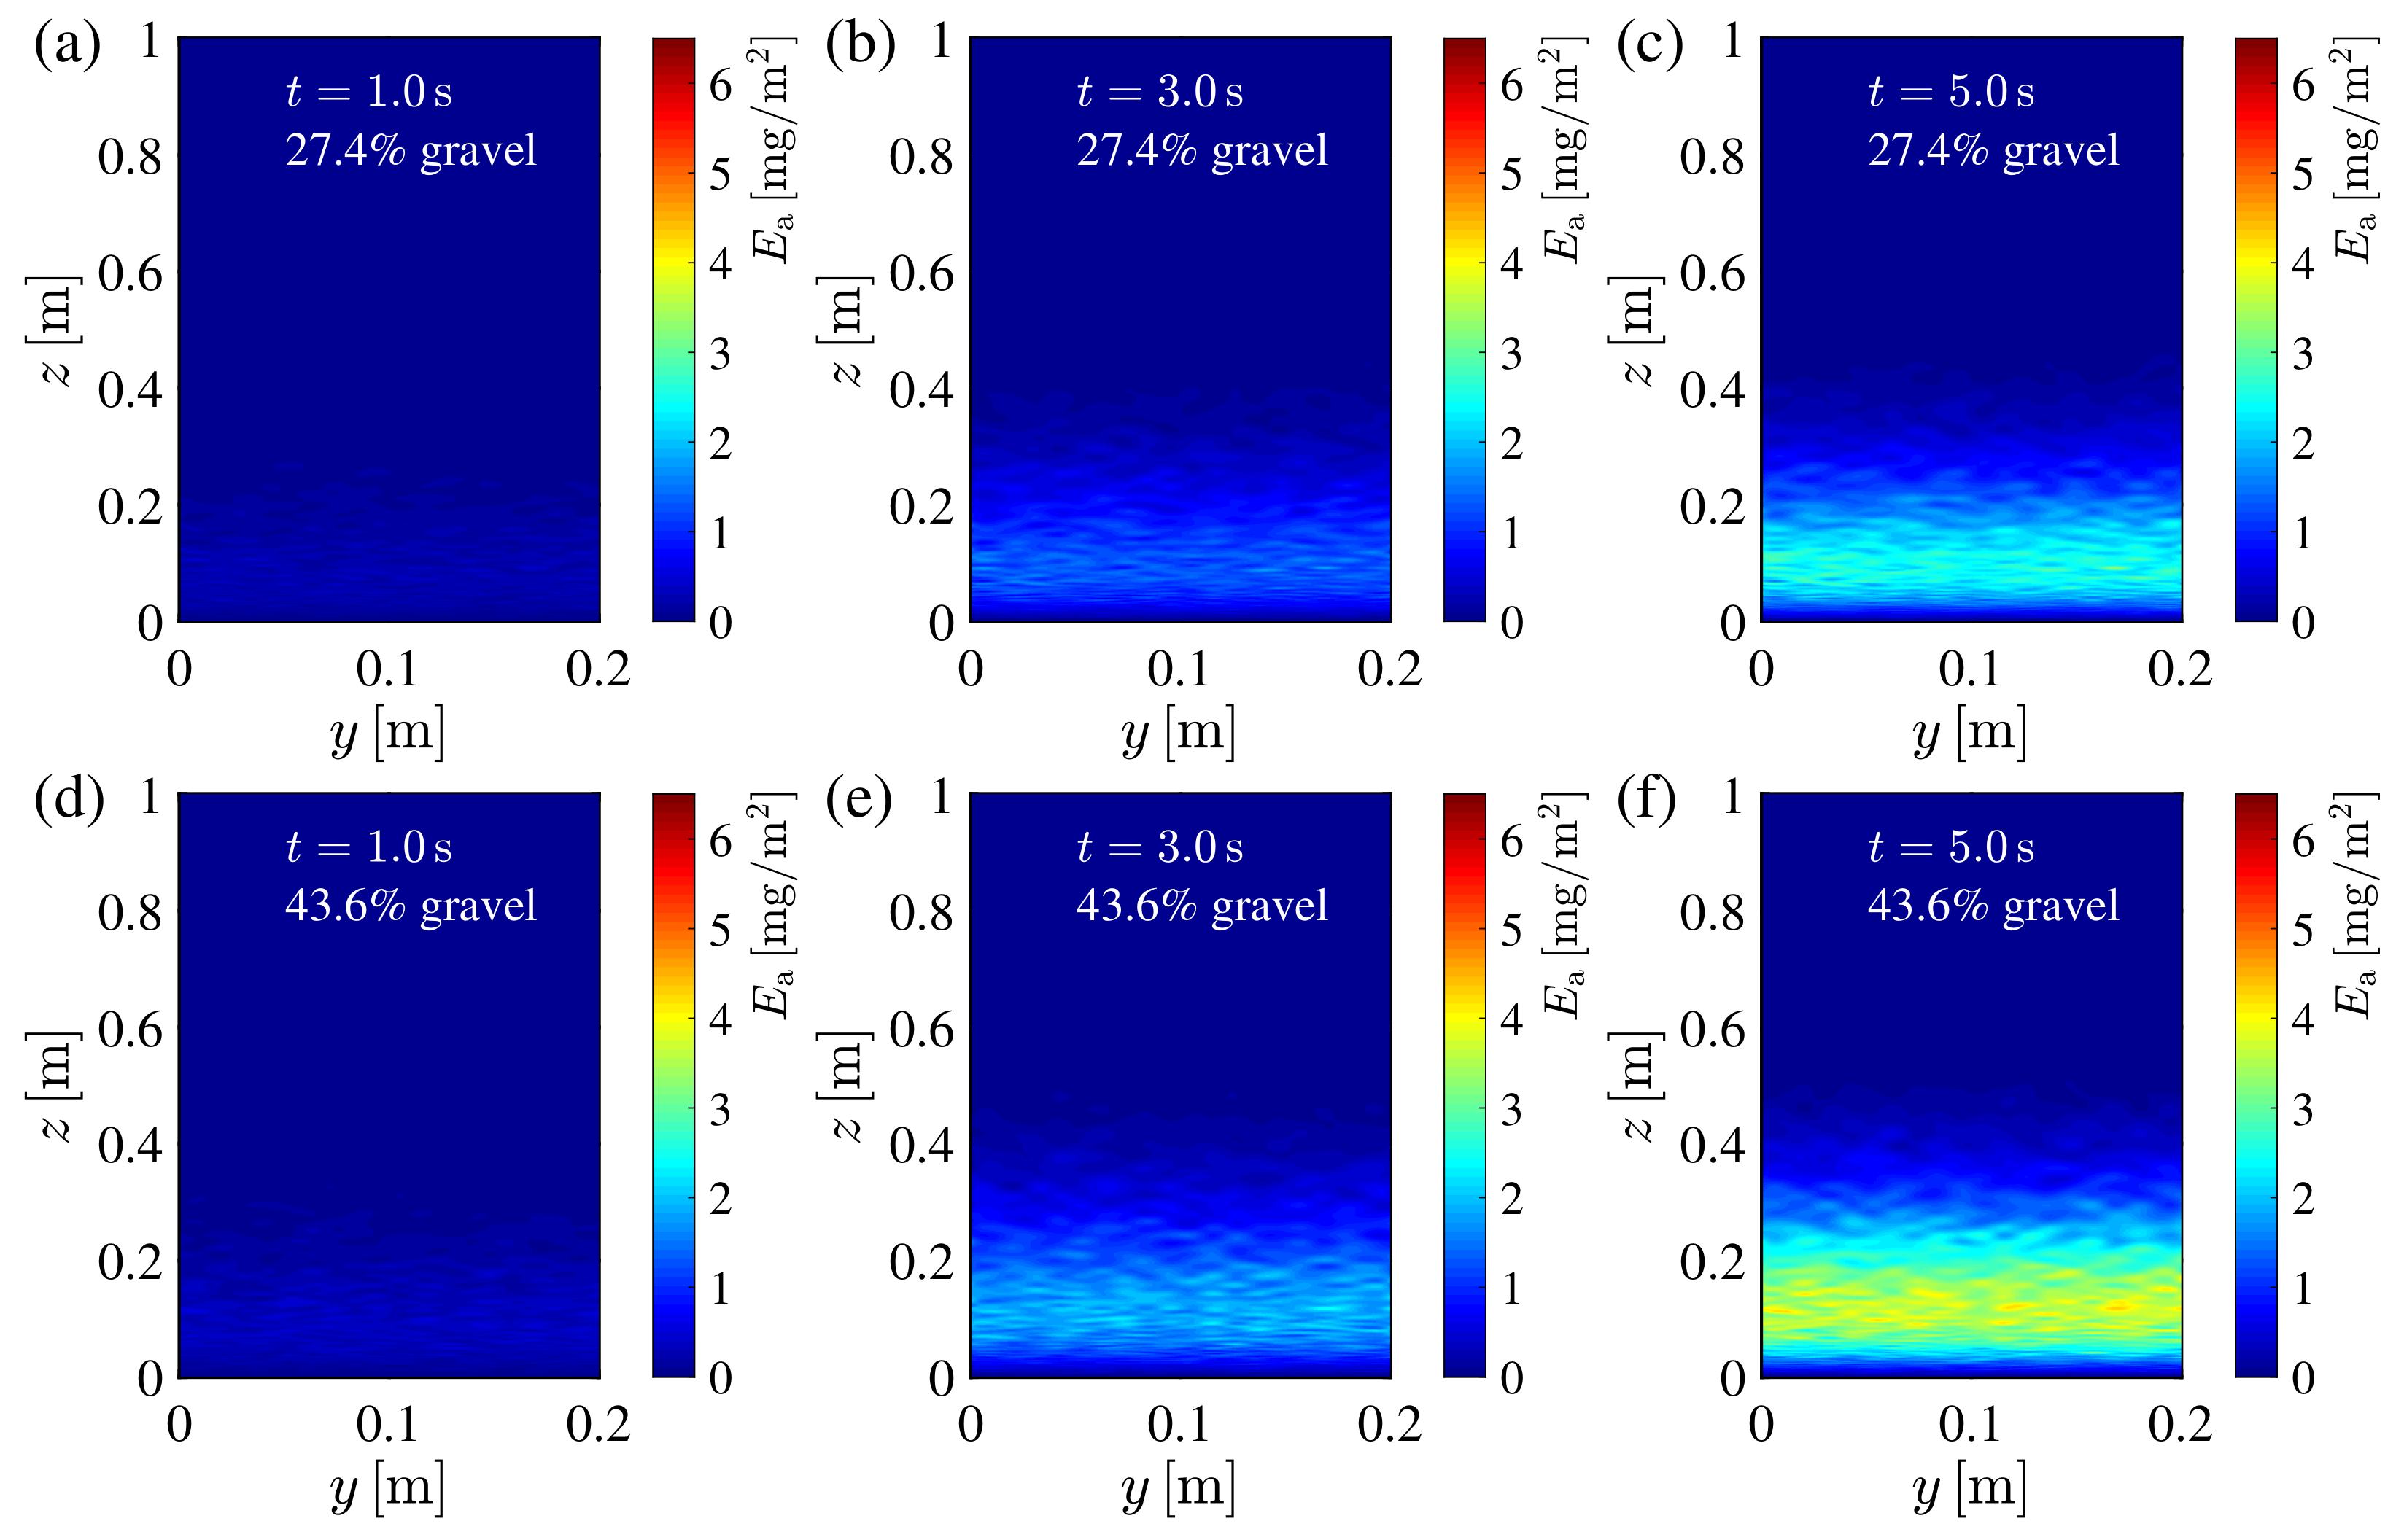
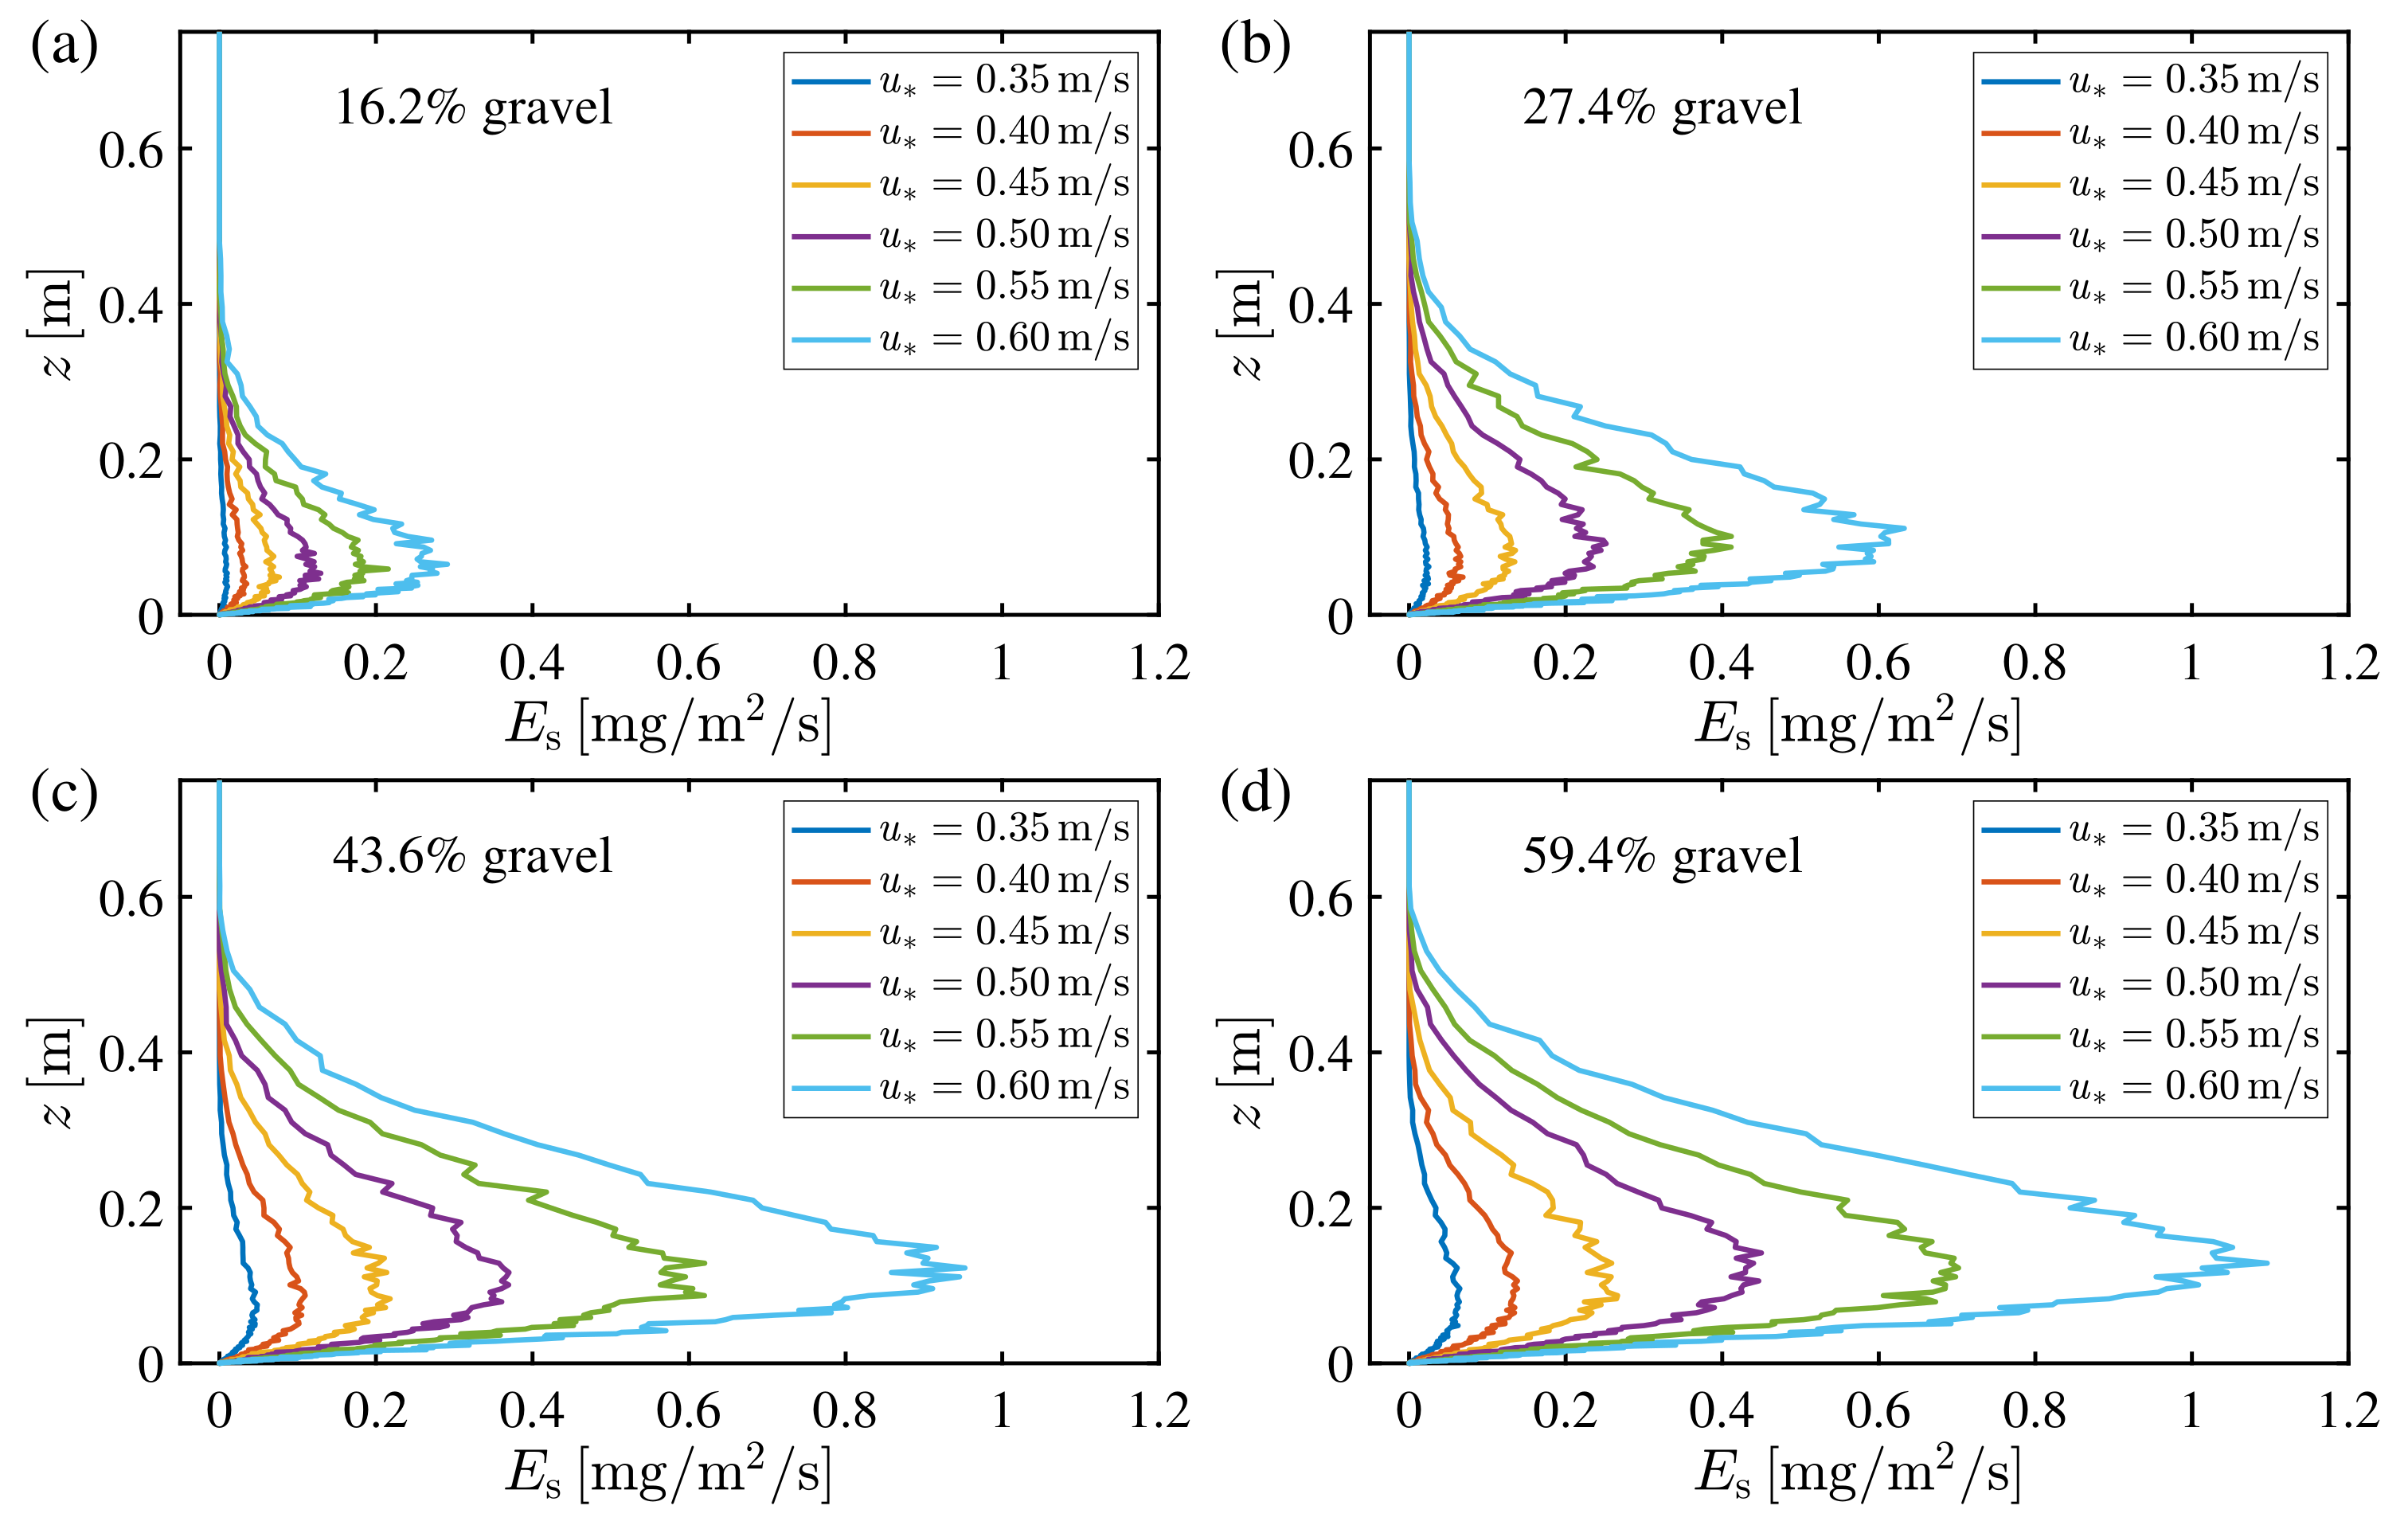
3.2. Vertical Structure of Saltation Erosion Rate

It is essential to study the vertical structure of saltation erosion for the design of preventative measures against infrastructure abrasion in the Gobi region. In this paper, we define the saltation erosion rate E s [ mg / m 2 / s ] to describe the erosion intensity of the sand drift, which characterizes the amount of sand drift erosion per unit time per unit area of the solid wall:
E s = d E a d t
and E s can be calculated by averaging E a for 5 s.
Aeolian sediment movement differs from the pure sand-carrying jet impingement. The vertical structure of sediment movement is often complicated. Particularly in the Gobi, the presence of surface gravel further complicates the sand flow structure [67,76]. The vertical distribution profile of saltation erosion rate with C 20 concrete as target material is shown in Figure 7. There is an obvious stratification pattern of saltation erosion rate profiles, and the profiles can be stratified into three layers along the vertical direction. The mass flux increases with height in the first layer, which is close to the surface. This is called a increasing layer. Then, as the height increases, the saltation erosion rate then reaches its maximum value. The high erosion rate will cause this interval to be the most severely eroded area of the vertical wall and the first to suffer wear damage. It makes sense to call this layer the damage layer as a result, and the height corresponding to the maximum saltation erosion rate is called as damage height z d . The saltation erosion rate will rapidly drop as the height rises further, and this portion of the profile is referred to as the decreasing layer.
The saltation erosion rate is significantly influenced by the friction velocity. In the Gobi sand flow with same gravel coverage, the increment of friction velocity not only causes a saltation erosion rate increase, but also leads to the rise of damage height. Figure 7 clearly shows that, as friction velocity increases from 0.35 m / s to 0.60 m / s , the saltation erosion rate increases by more than 10 times, and the damage height increases by about 0.05 m . It can also be seen from Figure 7 that the value of the saltation erosion rate increases as the gravel coverage increases from 16.2 % to 59.4 % .
The vertical wall’s material strength has a significant impact on the profile of saltation erosion rate as well. Figure 8 depicts the results of saltation erosion that we performed on three types of concrete, C 20 , C 30 and C 40 , in the 43.6 % gravel cover Gobi conditions. As can be seen from the figure, at the same friction velocity, when concrete strength increases, the saltation erosion rate will decrease. It reveals that concrete materials with higher strengths also have greater impact on erosion resistance.
As shown in Figure 8b, the extreme erosion rate for concrete C20 is around 3.8 mg / m 2 / s , while the higher strength concrete C40 has an extreme value of only nearly 2.3 mg / m 2 / s . The extreme value of the saltation erosion rate decreases obviously with the increase of the material strength. The impact of material strength on damage height, however, is not very noticeable. At a friction velocity of u * = 0.5 m / s , the damage heights of the saltation erosion rate profiles of the three types of concrete all range from 0.5 m to 0.7 m .

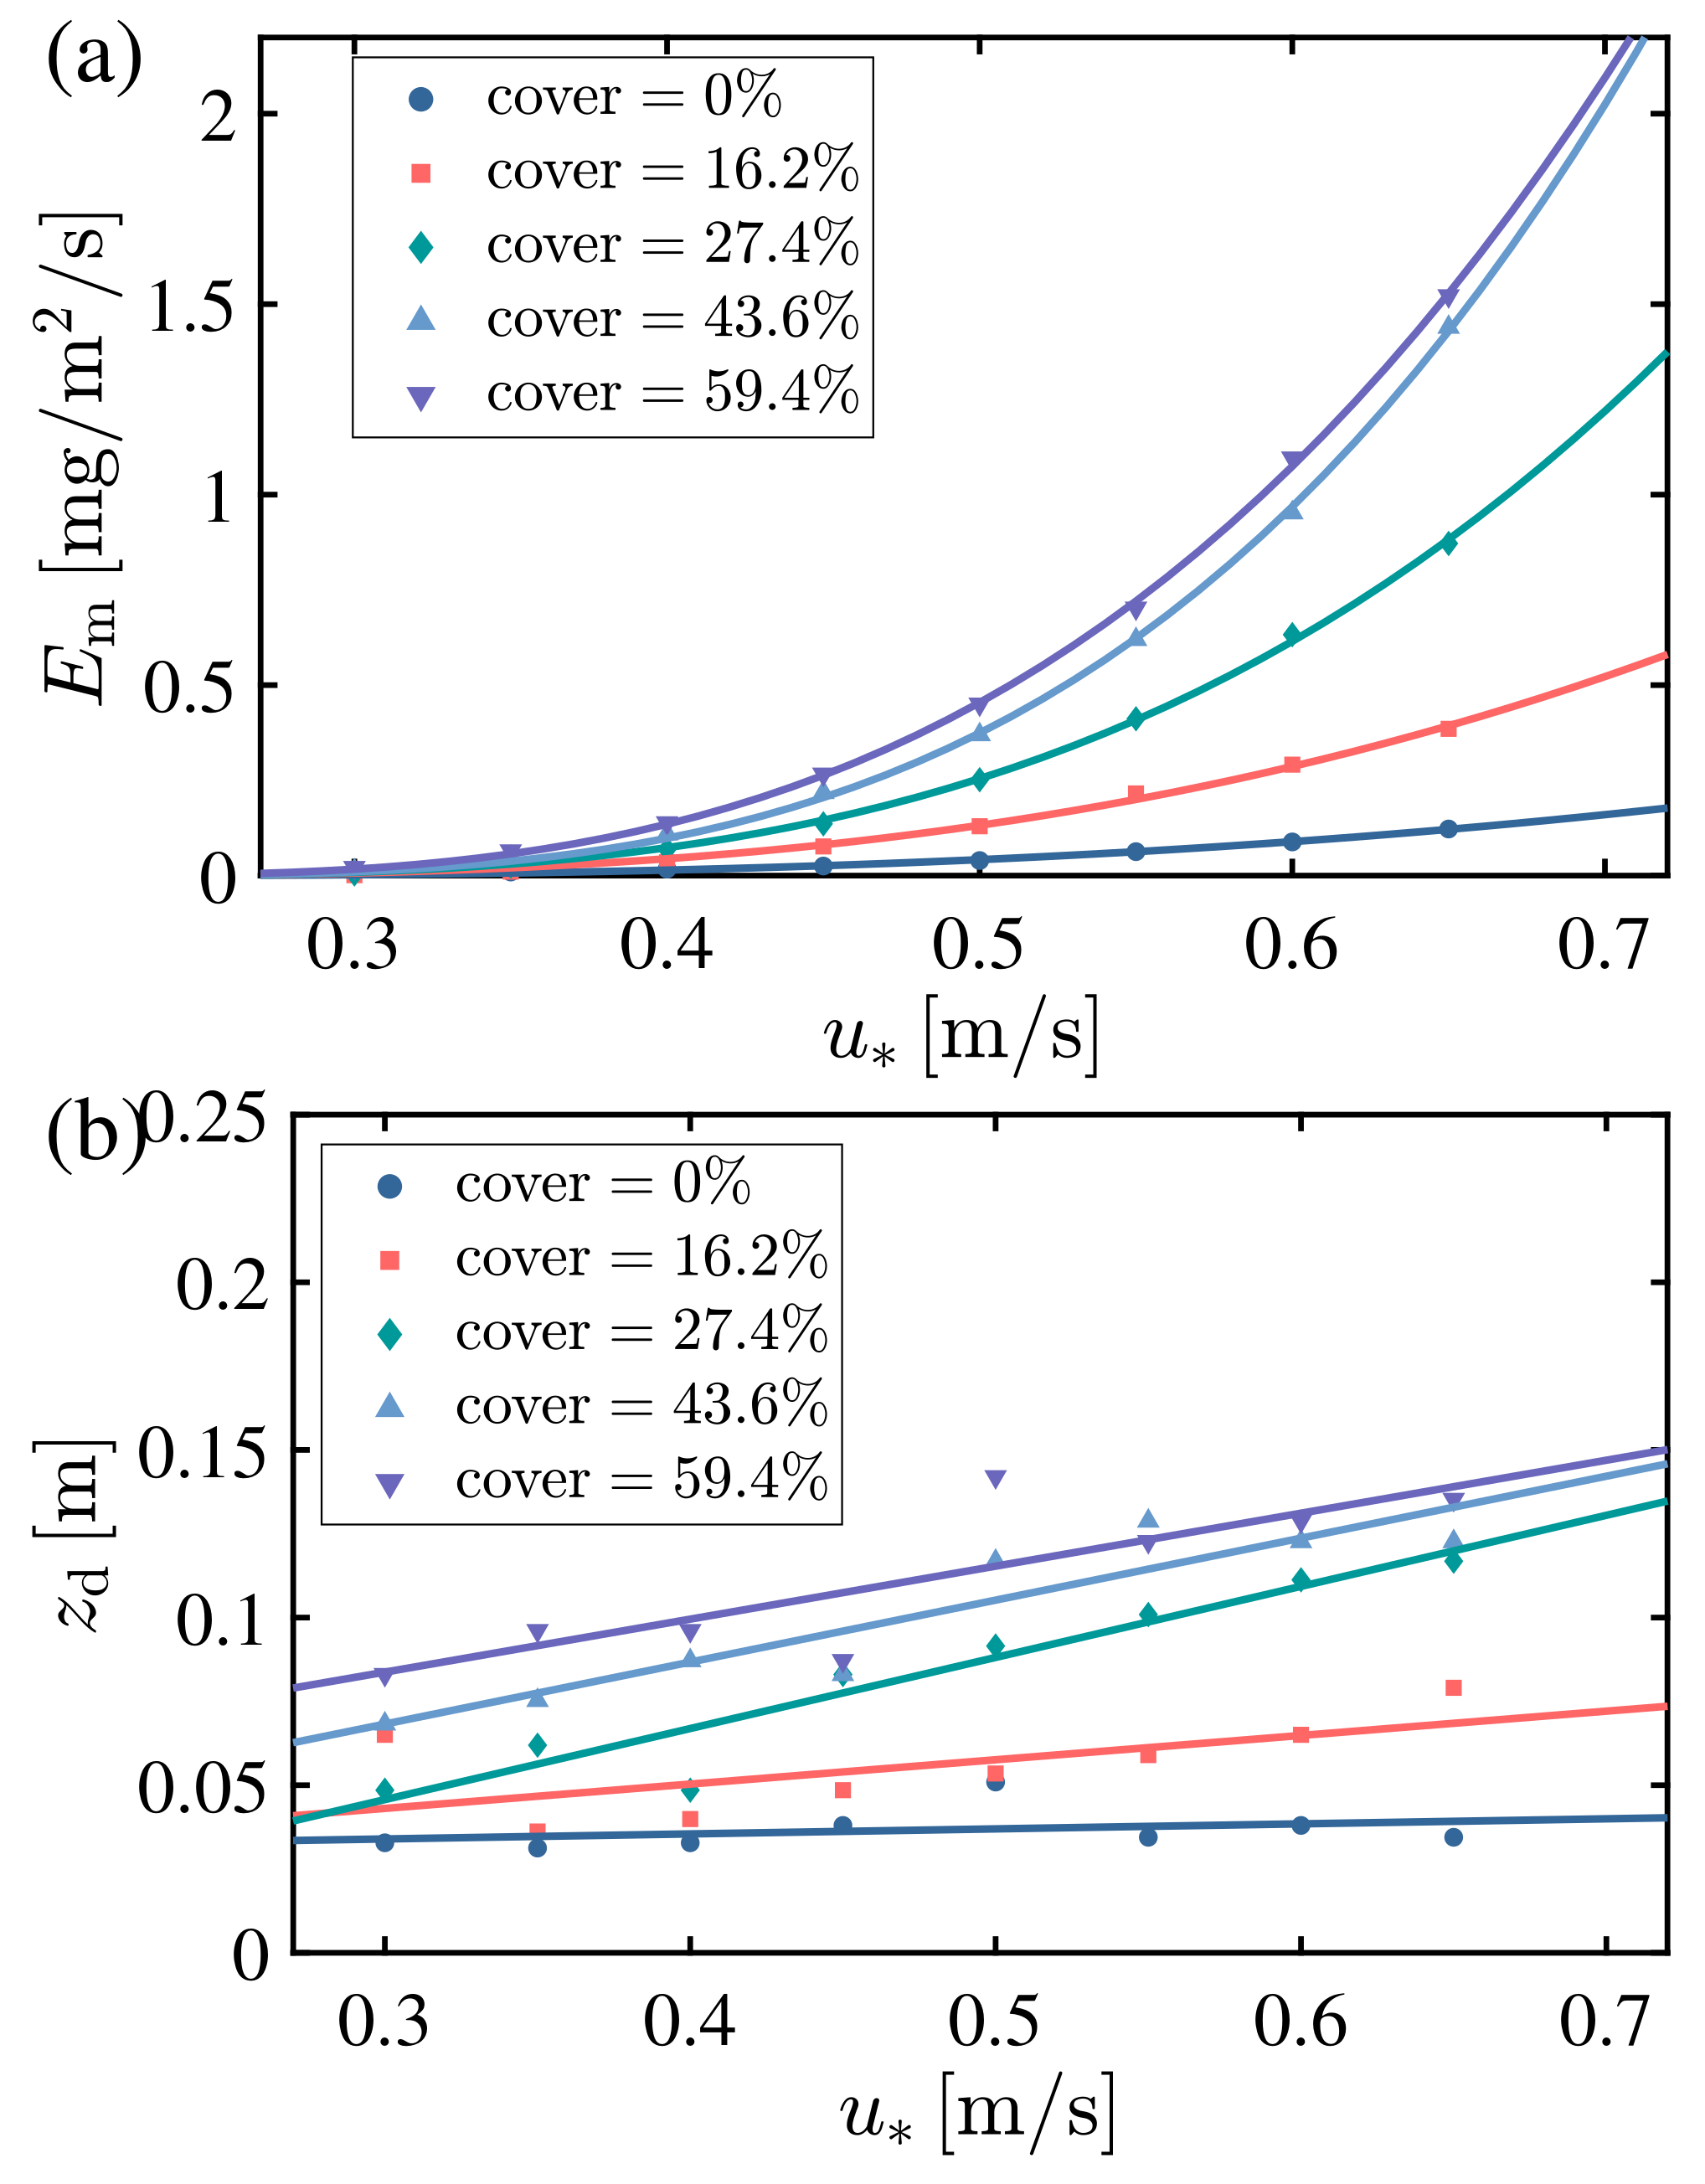
3.3. Scaling Rate of Saltation Erosion

Effective prediction of protection height and protection intensity based on the environmental conditions facilitates the design of protective measures in the erosion protection of building structures. This necessitates a parameterization scheme that describes the extreme value of saltation erosion rate and damage height variations with environmental variables, such as wind speed and gravel coverage. Since C 20 concrete has the weakest saltation erosion resistance, the parametric study was carried out under this most unfavourable condition.
The maximum value of saltation erosion rate E m is correlated with both the friction velocity and gravel coverage. Figure 9 reveals the power relationship between E m and u * with different gravel coverage:
E m = λ ( u * u * t ) γ
and the scalar rate γ and scalar coefficient λ are provided in Table 1.
As seen in Figure 9b, the damage height z d caused by saltation erosion is primarily concentrated between 0.03 0.15 m , and it increases with increasing friction velocity. There is an approximate linear scalar relationship between damage height and friction velocity:
z d = α u * + β
although the linear scale factor is small, as illustrated in Table 3. The value of parameter β also vary for various gravel coverage.
Sharp [47] recorded the maximum erosion height via field observation on a boulder alluvial plain in Kotchera Valley, California, USA. It ranged from 0.10 0.15 m , which qualitatively reflected the vertical curve shape of impact erosion. Our research directly gives the stratification pattern of the saltation erosion rate profiles in Gobi, and the damage height obtained by numerical simulation is consistent with the peak wear height reported by Sharp [47]. The eroded flute of the Gobi region’s ventifact also reflects this phenomenon. The maximum erosion on ventifacts in Gobi areas occurs at some finite height above the ground. Tan et al. [15] found a ventifact with an eroded flute in a field observation station in Gobi, and its maximum erosion occurred at about 0.10 m above the ground.
Equations (19) and (20) give the relationship between the extreme erosion rate and damage height with friction velocity for different gravel cover. It presents a theoretical tool for the erosion protection of building structures in aeolian landforms. Especially in the Gobi region, where sand drift is frequent and strong, the building structures nearby need to be protected from erosion at a height of 0.05 m to 0.15 m with some effective measures, such as adding anti-erosion coatings or additional high-strength materials. Meanwhile, in order to improve the protection efficiency, specific protection measures should be designed according to the local surface characteristics and dominant wind speed combined with the parameterized model provided in this study.

4. Conclusions

In this paper, we coupled the sediment transport model with the solid particle erosion model and conducted numerous numerical simulation investigations on the impact erosion process of aeolian saltation on the vertical wall of the Gobi surface. The results indicate that friction velocity and gravel coverage both affect saltation erosion. The erosion amount increases with friction velocity, and it also increases with increasing gravel coverage. A distinct stratification pattern can be seen in the vertical profile of saltation erosion rate, which includes increasing, damage and decreasing layers.
The damage height caused by saltation erosion is primarily concentrated in the height range of 0.03 m to 0.15 m , and it increases approximately linearly as friction velocity increases. The Gobi surface’s gravel layer also significantly affects the damage height. Therefore, in order to obtain greater protection for these construction facilities against impact erosion, proper design should be performed in accordance with the local desert or Gobi gravel coverage characteristics and the primary distribution range of local wind speed.

Author Contributions

Conceptualization, Y.W. and N.H.; methodology, Y.W. and J.Z.; software, Y.W.; validation, Y.W. and H.D.; formal analysis, Y.W. and H.D.; investigation, Y.W.; resources, H.D.; data curation, Y.W.; writing—original draft preparation, Y.W.; writing—review and editing, J.Z., H.D. and N.H.; visualization, Y.W.; supervision, N.H.; project administration, J.Z.; funding acquisition, N.H. All authors have read and agreed to the published version of the manuscript.

Funding

This research was funded by the Young Scientists Fund of National Natural Science Foundation of China (42106218), Key Programme of National Natural Science Foundation of China (41931179), the Major Science and Technology Project of Gansu Province (21ZD4FA010), Innovation Star Project of Excellent Postgraduates of Gansu Province (2022CXZX-123).

Institutional Review Board Statement

Not applicable.

Informed Consent Statement

Not applicable.

Data Availability Statement

Not applicable.

Conflicts of Interest

The authors declare no conflict of interest.

References

  1. Carr, M.H. The Geology of the Terrestrial Planets. Rev. Geophys. 1983, 21, 160–172. [Google Scholar] [CrossRef]
  2. Titus, T.N.; Lancaster, N.; Hayward, R.; Fenton, L.; Bourke, M. Priorities for Future Research on Planetary Dunes Planetary Dunes: Workshop: A Record of Climate Change; Alamogordo, New Mexico, 28 April to 2 May 2008. Eos Trans. Am. Geophys. Union 2008, 89, 447–448. [Google Scholar] [CrossRef]
  3. Lancaster, N.; Nickling, W.G.; Gillies, J.A. Sand Transport by Wind on Complex Surfaces: Field Studies in the McMurdo Dry Valleys, Antarctica. J. Geophys. Res. Earth Surf. 2010, 115, F03027. [Google Scholar] [CrossRef]
  4. Bagnold, R.A. The Physics of Blown Sand and Desert Dunes; Springer: Dordrecht, The Netherlands, 1941. [Google Scholar]
  5. Owen, P.R. Saltation of Uniform Grains in Air. J. Fluid Mech. 1964, 20, 225–242. [Google Scholar] [CrossRef]
  6. Williams, G. Some aspects of the eolian saltation load. Sedimentology 1964, 3, 257–287. [Google Scholar] [CrossRef]
  7. Barndorff-Nielsen, O.E.; Willetts, B.B. (Eds.) Aeolian Grain Transport 1; Acta Mechanica Supplementum; Springer: Vienna, Austria, 1991; Volume 1. [Google Scholar] [CrossRef]
  8. Pye, K.; Tsoar, H. Aeolian Sand and Sand Dunes; Springer: Berlin/Heidelberg, Germany, 2009. [Google Scholar] [CrossRef]
  9. Kok, J.F.; Parteli, E.J.R.; Michaels, T.I.; Karam, D.B. The Physics of Wind-Blown Sand and Dust. Rep. Prog. Phys. 2012, 75, 106901. [Google Scholar] [CrossRef]
  10. Valance, A.; Rasmussen, K.R.; Ould El Moctar, A.; Dupont, P. The Physics of Aeolian Sand Transport. Comptes Rendus Phys. 2015, 16, 105–117. [Google Scholar] [CrossRef]
  11. Woodruff, N.P. Wind-Blown Soil Abrasive Injuries to Winter Wheat Plants. Agron. J. 1956, 48, 499–504. [Google Scholar] [CrossRef]
  12. Armbrust, D.V. Recovery and Nutrient Content of Sandblasted Soybean Seedlings1. Agron. J. 1972, 64, 707–708. [Google Scholar] [CrossRef]
  13. Heshmati, G.A.; Squires, V.R. Introduction to Deserts and Desertified Regions in China. In Combating Desertification in Asia, Africa and the Middle East: Proven Practices; Heshmati, G.A., Squires, V.R., Eds.; Springer: Dordrecht, The Netherlands, 2013; pp. 3–20. [Google Scholar] [CrossRef]
  14. Qu, J.; Huang, N.; Dong, G.; Zhang, W. The Role and Significance of the Gobi Desert Pavement in Controlling Sand Movement on the Cliff Top near the Dunhuang Magao Grottoes. J. Arid. Environ. 2001, 48, 357–371. [Google Scholar] [CrossRef]
  15. Tan, L.; Qu, J.; Wang, T.; Zhang, K.; An, Z. Field Observation Evidence for Kink Points in the Vertical Kinetic Energy Flux Profiles of Wind-Blown Sand Over Gobi and Its Significance. Geophys. Res. Lett. 2021, 48, e2020GL091224. [Google Scholar] [CrossRef]
  16. Werner, B.T. A Steady-State Model of Wind-Blown Sand Transport. J. Geol. 1990, 98, 1–17. [Google Scholar] [CrossRef]
  17. Wu, J.J.; Luo, S.H.; He, L.H. The Characteristic of Streamwise Mass Flux of Windblown Sand Movement. Geomorphology 2012, 139–140, 188–194. [Google Scholar] [CrossRef]
  18. Bagnold, R.A.; Taylor, G.I. The Movement of Desert Sand. Proc. R. Soc. London. Ser. A-Math. Phys. Sci. 1936, 157, 594–620. [Google Scholar] [CrossRef]
  19. White, B.R.; Schulz, J.C. Magnus Effect in Saltation. J. Fluid Mech. 1977, 81, 497–512. [Google Scholar] [CrossRef]
  20. Rumpel, D.A. Successive Aeolian Saltation: Studies of Idealized Collisions. Sedimentology 1985, 32, 267–280. [Google Scholar] [CrossRef]
  21. Shao, Y.; Li, A. Numerical Modelling of Saltation in the Atmospheric Surface Layer. Bound.-Layer Meteorol. 1999, 91, 199–225. [Google Scholar] [CrossRef]
  22. Kok, J.F.; Renno, N.O. A Comprehensive Numerical Model of Steady State Saltation (COMSALT). J. Geophys. Res. 2009, 114, D17204. [Google Scholar] [CrossRef]
  23. Ungar, J.E.; Haff, P.K. Steady State Saltation in Air. Sedimentology 1987, 34, 289–299. [Google Scholar] [CrossRef]
  24. Anderson, R.S.; Sørensen, M.; Willetts, B.B. A Review of Recent Progress in Our Understanding of Aeolian Sediment Transport. In Aeolian Grain Transport 1; Barndorff-Nielsen, O.E., Willetts, B.B., Eds.; Springer: Vienna, Austria, 1991; Volume 1, pp. 1–19. [Google Scholar] [CrossRef]
  25. Huang, N.; Ren, S.; Zheng, X. Effects of the Mid-Air Collision on Sand Saltation. Sci. China Ser. Phys. Mech. Astron. 2008, 51, 1416–1426. [Google Scholar] [CrossRef]
  26. Huang, N.; Wang, C.; Pan, X. Simulation of Aeolian Sand Saltation with Rotational Motion. J. Geophys. Res. 2010, 115, D22211. [Google Scholar] [CrossRef]
  27. Durán, O.; Andreotti, B.; Claudin, P. Numerical Simulation of Turbulent Sediment Transport, from Bed Load to Saltation. Phys. Fluids 2012, 24, 103306. [Google Scholar] [CrossRef]
  28. Zheng, X.; He, L.; Wu, J. Vertical Profiles of Mass Flux for Windblown Sand Movement at Steady State. J. Geophys. Res. Solid Earth 2004, 109. [Google Scholar] [CrossRef]
  29. Tong, D.; Huang, N. Numerical Simulation of Saltating Particles in Atmospheric Boundary Layer over Flat Bed and Sand Ripples. J. Geophys. Res. Atmos. 2012, 117. [Google Scholar] [CrossRef]
  30. Dupont, S.; Bergametti, G.; Marticorena, B.; Simoëns, S. Modeling Saltation Intermittency. J. Geophys. Res. Atmos. 2013, 118, 7109–7128. [Google Scholar] [CrossRef]
  31. Chen, Y.; Zhang, J.; Huang, N.; Xu, B. An Experimental Study on Splash Functions of Natural Sand-Bed Collision. J. Geophys. Res. Atmos. 2019, 124, 7226–7235. [Google Scholar] [CrossRef]
  32. Zhang, C.; Huang, N.; Dun, H.C. Experimental Study on Sand/Bed Collision Over the Gobi Surface. J. Geophys. Res. Atmos. 2022, 127, e2021JD035766. [Google Scholar] [CrossRef]
  33. Wang, Z.; Liu, L.; Li, X.; Zhao, L. An Experimental Method for Analyzing Environmental Effects of Blowing Sands on Glass Abrasion. Procedia Environ. Sci. 2010, 2, 207–217. [Google Scholar] [CrossRef]
  34. Molinari, J.F.; Ortiz, M. A Study of Solid-Particle Erosion of Metallic Targets. Int. J. Impact Eng. 2002, 27, 347–358. [Google Scholar] [CrossRef]
  35. López, D.; Congote, J.P.; Cano, J.R.; Toro, A.; Tschiptschin, A.P. Effect of Particle Velocity and Impact Angle on the Corrosion–Erosion of AISI 304 and AISI 420 Stainless Steels. Wear 2005, 259, 118–124. [Google Scholar] [CrossRef]
  36. Bousser, E.; Martinu, L.; Klemberg-Sapieha, J.E. Solid Particle Erosion Mechanisms of Protective Coatings for Aerospace Applications. Surf. Coatings Technol. 2014, 257, 165–181. [Google Scholar] [CrossRef]
  37. Tarodiya, R.; Levy, A. Surface Erosion Due to Particle-Surface Interactions—A Review. Powder Technol. 2021, 387, 527–559. [Google Scholar] [CrossRef]
  38. Hao, Y.; Feng, Y.; Fan, J. Experimental Study into Erosion Damage Mechanism of Concrete Materials in a Wind-Blown Sand Environment. Constr. Build. Mater. 2016, 111, 662–670. [Google Scholar] [CrossRef]
  39. Goretta, K.C.; Burdt, M.L.; Cuber, M.M.; Perry, L.A.; Singh, D.; Wagh, A.S.; Routbort, J.L.; Weber, W.J. Solid-Particle Erosion of Portland Cement and Concrete. Wear 1999, 224, 106–112. [Google Scholar] [CrossRef]
  40. Vieira, R.E.; Mansouri, A.; McLaury, B.S.; Shirazi, S.A. Experimental and Computational Study of Erosion in Elbows Due to Sand Particles in Air Flow. Powder Technol. 2016, 288, 339–353. [Google Scholar] [CrossRef]
  41. Mbabazi, J.G.; Sheer, T.J. Computational Prediction of Erosion of Air Heater Elements by Fly Ash Particles. Wear 2006, 261, 1322–1336. [Google Scholar] [CrossRef]
  42. Zhang, Y.; Reuterfors, E.P.; McLaury, B.S.; Shirazi, S.A.; Rybicki, E.F. Comparison of Computed and Measured Particle Velocities and Erosion in Water and Air Flows. Wear 2007, 263, 330–338. [Google Scholar] [CrossRef]
  43. Greeley, R.; Leach, R.N.; Williams, S.H.; White, B.R.; Pollack, J.B.; Krinsley, D.H.; Marshall, J.R. Rate of Wind Abrasion on Mars. J. Geophys. Res. Solid Earth 1982, 87, 10009–10024. [Google Scholar] [CrossRef]
  44. Lancaster, N. Characteristics and Occurrence of Wind Erosion Features in the Namib Desert. Earth Surf. Process. Landforms 1984, 9, 469–478. [Google Scholar] [CrossRef]
  45. Ta, W. Study of the Energy Abrasion Rates of Five Soil Types Subject to Oblique Impacts. Geoderma 2007, 140, 97–105. [Google Scholar] [CrossRef]
  46. Raffaele, L.; Bruno, L. Windblown Sand Action on Civil Structures: Definition and Probabilistic Modelling. Eng. Struct. 2019, 178, 88–101. [Google Scholar] [CrossRef]
  47. Sharp, R.P. Wind-Driven Sand in Coachella Valley, California. GSA Bull. 1964, 75, 785–804. [Google Scholar] [CrossRef]
  48. Liu, L.Y.; Gao, S.Y.; Shi, P.J.; Li, X.Y.; Dong, Z.B. Wind Tunnel Measurements of Adobe Abrasion by Blown Sand: Profile Characteristics in Relation to Wind Velocity and Sand Flux. J. Arid. Environ. 2003, 53, 351–363. [Google Scholar] [CrossRef]
  49. Shi, X.; Shi, X. Numerical Prediction on Erosion Damage Caused by Wind-Blown Sand Movement. Eur. J. Environ. Civ. Eng. 2014, 18, 550–566. [Google Scholar] [CrossRef]
  50. Huo, X.; Dun, H.; Huang, N.; Zhang, J. 3D Direct Numerical Simulation on the Emergence and Development of Aeolian Sand Ripples. Front. Phys. 2021, 9, 662389. [Google Scholar] [CrossRef]
  51. Huo, X.; Huang, N.; Zhang, J. A Numerical Research on the Relationship between Aeolian Sand Ripples and the Sand Flux. Processes 2022, 10, 354. [Google Scholar] [CrossRef]
  52. Shao, Y. Physics and Modelling of Wind Erosion; Springer: Dordrecht, The Netherlands, 2008. [Google Scholar]
  53. Anderson, R.S.; Haff, P.K. Wind Modification and Bed Response during Saltation of Sand in Air. In Aeolian Grain Transport 1; Barndorff-Nielsen, O.E., Willetts, B.B., Eds.; Springer: Vienna, Austria, 1991; Volume 1, pp. 21–51. [Google Scholar] [CrossRef]
  54. Zheng, L.; Zhang, X. Chapter 8—Numerical Methods. In Modeling and Analysis of Modern Fluid Problems; Mathematics in Science and Engineering; Zheng, L., Zhang, X., Eds.; Academic Press: Cambridge, MA, USA, 2017; pp. 361–455. [Google Scholar] [CrossRef]
  55. Brilliantov, N.V.; Poschel, T. Kinetic Theory of Granular Gases, Illustrated Edition; Oxford University Press: Oxford, UK, 2010. [Google Scholar]
  56. Schwager, T.; Becker, V.; Pöschel, T. Coefficient of Tangential Restitution for Viscoelastic Spheres. Eur. Phys. J. E 2008, 27, 107–114. [Google Scholar] [CrossRef]
  57. Fohanno, S.; Oesterlé, B. Analysis of the Effect of Collisions on the Gravitational Motion of Large Particles in a Vertical Duct. Int. J. Multiph. Flow 2000, 26, 267–292. [Google Scholar] [CrossRef]
  58. Versteeg, H.K.; Malalasekera, W. An Introduction to Computational Fluid Dynamics: The Finite Volume Method, 2nd ed.; Pearson Education Ltd: Harlow, UK; New York, NY, USA, 2007. [Google Scholar]
  59. Mitha, S.; Tran, M.Q.; Werner, B.T.; Haff, P.K. The Grain-Bed Impact Process in Aeolian Saltation. Acta Mech. 1986, 63, 267–278. [Google Scholar] [CrossRef]
  60. McEWAN, I.K.; Willetts, B.B.; Rice, M.A. The Grain/Bed Collision in Sand Transport by Wind. Sedimentology 1992, 39, 971–981. [Google Scholar] [CrossRef]
  61. Oger, L.; Ammi, M.; Valance, A.; Beladjine, D. Study of the Collision of One Rapid Sphere on 3D Packings: Experimental and Numerical Results. Comput. Math. Appl. 2008, 55, 132–148. [Google Scholar] [CrossRef]
  62. Ammi, M.; Oger, L.; Beladjine, D.; Valance, A. Three-Dimensional Analysis of the Collision Process of a Bead on a Granular Packing. Phys. Rev. E 2009, 79, 021305. [Google Scholar] [CrossRef]
  63. Lämmel, M.; Dzikowski, K.; Kroy, K.; Oger, L.; Valance, A. Grain-Scale Modeling and Splash Parametrization for Aeolian Sand Transport. Phys. Rev. E 2017, 95, 022902. [Google Scholar] [CrossRef]
  64. Xing, M.; He, C. 3D Ejection Behavior of Different Sized Particles in the Grain-Bed Collision Process. Geomorphology 2013, 187, 94–100. [Google Scholar] [CrossRef]
  65. Kang, L.; Guo, L.; Liu, D. Reconstructing the Vertical Distribution of the Aeolian Saltation Mass Flux Based on the Probability Distribution of Lift-off Velocity. Geomorphology 2008, 96, 1–15. [Google Scholar] [CrossRef]
  66. Dong, Z.; Wang, H.; Liu, X.; Wang, X. A Wind Tunnel Investigation of the Influences of Fetch Length on the Flux Profile of a Sand Cloud Blowing over a Gravel Surface. Earth Surf. Process. Landforms 2004, 29, 1613–1626. [Google Scholar] [CrossRef]
  67. Zhang, W.; Tan, L.; Zhang, G.; Qiu, F.; Zhan, H. Aeolian Processes over Gravel Beds: Field Wind Tunnel Simulation and Its Application atop the Mogao Grottoes, China. Aeolian Res. 2014, 15, 335–344. [Google Scholar] [CrossRef]
  68. Li, H.; Zou, X.; Zhang, C.; Kang, L.; Cheng, H.; Liu, B.; Liu, W.; Fang, Y.; Yang, D.; Wu, X. Effects of Gravel Cover on the Near-Surface Airflow Field and Soil Wind Erosion. Soil Tillage Res. 2021, 214, 105133. [Google Scholar] [CrossRef]
  69. Dong, Z.; Liu, X.; Wang, X. Aerodynamic Roughness of Gravel Surfaces. Geomorphology 2002, 43, 17–31. [Google Scholar] [CrossRef]
  70. Zhang, K.; Zhang, W.; Tan, L.; An, Z.; Zhang, H. Effects of Gravel Mulch on Aeolian Transport: A Field Wind Tunnel Simulation. J. Arid. Land 2015, 7, 296–303. [Google Scholar] [CrossRef]
  71. Oka, Y.I.; Okamura, K.; Yoshida, T. Practical Estimation of Erosion Damage Caused by Solid Particle Impact: Part 1: Effects of Impact Parameters on a Predictive Equation. Wear 2005, 259, 95–101. [Google Scholar] [CrossRef]
  72. Creyssels, M.; Dupont, P.; El Moctar, A.O.; Valance, A.; Cantat, I.; Jenkins, J.T.; Pasini, J.M.; Rasmussen, K.R. Saltating Particles in a Turbulent Boundary Layer: Experiment and Theory. J. Fluid Mech. 2009, 625, 47–74. [Google Scholar] [CrossRef]
  73. Zhang, K.; Qu, J.; Zu, R.; Ta, W. Characteristics of Wind-Blown Sand on Gobi/Mobile Sand Surface. Environ. Geol. 2008, 54, 411–416. [Google Scholar] [CrossRef]
  74. Zhang, W.; Wang, T.; Wang, W.; Liu, B. Wind Tunnel Experiments on Vertical Distribution of Wind-Blown Sand Flux and Change of the Quantity of Sand Erosion and Deposition above Gravel Beds under Different Sand Supplies. Environ. Earth Sci. 2011, 64, 1031–1038. [Google Scholar] [CrossRef]
  75. Tan, L.; Zhang, W.; Qu, J.; Zhang, K.; An, Z.; Wang, X. Aeolian Sand Transport over Gobi with Different Gravel Coverages under Limited Sand Supply: A Mobile Wind Tunnel Investigation. Aeolian Res. 2013, 11, 67–74. [Google Scholar] [CrossRef]
  76. Liu, J.; Kimura, R.; Wu, J. Vertical Profiles of Wind-Blown Sand Flux over Fine Gravel Surfaces and Their Implications for Field Observation in Arid Regions. Atmosphere 2020, 11, 1029. [Google Scholar] [CrossRef]
Figure 1. (a) Diagram of Gobi terrain setting. (b) Gravel distribution on the Gobi bed with different gravel cover in the numerical model, in which the blue dots is representative of the coverage area.
Atmosphere 14 00349 g001
Figure 2. Impact erosion process of saltation particles to the vertical wall in a sand drift.
Atmosphere 14 00349 g002
Figure 3. Comparison of the relationships between sand transport rate and the friction velocity calculated in this paper with that from experiments by Creyssels et al. [72] and Tong and Huang [29].
Atmosphere 14 00349 g003
Figure 4. Comparison of the numerical results on mass flux profile with the measured data in (a) sand bed by Tong and Huang [29] and (b) Gobi with 60 % gravel coverage by Zhang et al. [73].
Atmosphere 14 00349 g004
Figure 5. Spatial distribution images of impact erosion amount E a [ mg / m 2 ] in sand drift at u * = 0.60 m / s , for (ac) on Gobi with 27.4 gravel coverage and (df) on Gobi with 43.6 % gravel coverage.
Atmosphere 14 00349 g005
Figure 6. Spatial distribution images of impact erosion amount E a [ mg / m 2 ] in sand drift at t = 5.0 s , for (ac) on Gobi with 16.2 % gravel coverage and (df) on Gobi with 43.6 % gravel coverage.
Atmosphere 14 00349 g006
Figure 7. Vertical profiles of saltation erosion rate E s , corresponding to different friction velocity, for (a) on Gobi with 16.2 % gravel coverage, (b) on Gobi with 27.4 % gravel coverage, (c) on Gobi with 43.6 % gravel coverage, and (d) on Gobi with 59.4 % gravel coverage.
Atmosphere 14 00349 g007
Figure 8. Vertical profiles of saltation erosion rate E s , corresponding to three types of concrete walls C 20 , C 30 and C 40 in Gobi with 43.6 % gravel coverage, for (a) at u * = 0.4 m / s and (b) at u * = 0.5 m / s .
Atmosphere 14 00349 g008
Figure 9. (a) The relationship between parameter E m and friction velocity u * on Gobi with different gravel coverage. (b) The relationship between parameter z d and friction velocity u * on Gobi with different gravel coverage. The solid line represents the fitting result.
Atmosphere 14 00349 g009
Table 1. Parameters of the Splash Model.
DistributionMeanStd.References
Rebound on Gravel
e r Normal 0.62 + 0.0084 V i 0.63 sin θ i 0.19 0.0035 V i Chen et al. [31]
θ r Lognormal 2.92 0.034 V i + 0.02 θ i 0.9 0.049 V i Chen et al. [31]
Rebound on Sand Bed
e r Lognormal 0.47 + 0.015 V i 0.02 θ i 0.16 + 0.04 V i 0.001 θ i Zhang et al. [32]
θ r Lognormal 0.26 + 0.04 V i 0.032 θ i 0.16 0.005 V i 0.029 θ i Zhang et al. [32]
Splash
n ej Lognormal 0.36 + 1.35 ln V i 0.01 θ i 0.55 Chen et al. [31]
V ej Lognormal 1.67 + 0.082 V i 0.003 θ i 0.616 Chen et al. [31]
θ ej Lognormal 3.94 0.64 Chen et al. [31]
φ ej Normal015Xing and He [64]
Table 2. Parameters of erosion model.
Material C 20 C 30 C 40
K e 0.0057 0.0037 0.0028
n e 1.4046 1.4952 1.5555
Table 3. Parameters of fit formula.
Gravel Coverage λ γ α β
0 % 0.9841 2.6207 0.0150 0.02945
16.2 % 3.3752 2.6917 0.0725 0.02132
27.4 % 10.214 3.0666 0.2120 0.00790
43.6 % 19.984 3.3035 0.1848 0.01278
59.4 % 16.653 2.9912 0.1580 0.03632
Disclaimer/Publisher’s Note: The statements, opinions and data contained in all publications are solely those of the individual author(s) and contributor(s) and not of MDPI and/or the editor(s). MDPI and/or the editor(s) disclaim responsibility for any injury to people or property resulting from any ideas, methods, instructions or products referred to in the content.

