Abstract
The ecological conservation and high-quality development of the Yellow River Basin (YRB) has been declared as a major national strategy of China. Surface water availability (precipitation minus evapotranspiration, PME) poses challenges to the sustainability of ecosystems of the YRB. Noteworthy is that the Mongolian section of the YRB (IMYRB) is a critical ecological barrier in Northern China. Soil moisture (SM) changes are highly sensitive to PME and important for regional ecological security. However, SM vs. PME interactions and relevant mechanisms within the IMYRB are poorly understood. We found significant decreases in SM and PME over the east IMYRB (r = 0.7, p < 0.05). During the wet (July, August, and September) and dry (April, May, and June) seasons, as well as the whole year, decreased SM drives increased PME through land-atmosphere interactions over more than 90% of the IMYRB. Reduction in SM decreased evapotranspiration over more than 80% of the IMYRB, increased surface temperature across more than 79% of the IMYRB, boosted atmospheric vertical ascent over more than 75% of the IMYRB, and enhanced moisture convergence and PME. This study highlights the land-atmosphere interactions over the IMYRB, implicating basin-scale impacts of climatic changes on water resources.
1. Introduction
Global warming is believed to be accelerating the hydrological cycle, altering spatiotemporal patterns of changes in precipitation and evapotranspiration [1,2,3]. Surface water availability (precipitation minus evapotranspiration, PME hereafter) represents regional water availability, runoff, or freshwater supply [4], linking water flux between atmosphere and land, affecting natural ecosystems and sustainability of agricultural and the socioeconomic development [5,6,7]. Soil moisture (SM) is a critical variable regulating interactions between land and atmosphere [8,9,10], modulating partitioning of water and energy fluxes [11]. SM can be measured by factors, such as surface fluxes of convective humidity, which is associated with atmospheric effects, such as perturbation of the planetary boundary layer (PBL), feedback regulation and prediction of atmospheric anomalies [12,13,14]. Thus, here we unravel interactions between SM and PME, elucidating impacts of climate changes on regional water resources.
We unravel interactions amongst SM, precipitation and evapotranspiration and these interactions are spatially variable under different climate conditions [15]. Some case studies showed that a decrease of SM would cause a decrease of precipitation (SM-precipitation positive feedback) in the Northeastern United States [16], Central Eurasia and Southwest China [17], while more evidence showed that the decrease in SM would trigger an increase in precipitation (SM-precipitation negative feedback) in Southern Africa [18] and the Eastern United States [19], while the degree to which the SM-P feedback process depends on different scales, is controversial [20,21]. SM can affect precipitation through surface latent heat flux and evapotranspiration [22,23] and interactions between SM and precipitation have aroused considerable concerns [24]. However, what are the mechanisms behind the interactions between SM, precipitation and evapotranspiration still remains obscure.
SM reduction could retard the decline of PME over drylands [25], modifying global patterns of dryness and wetness variations. During the dry season, declining SM reduces evapotranspiration and modulates circulation to enhance moisture convergence and increase PME [25]. Zhou et al. [26] also demonstrated that 63% of the seasonality reduction is driven by seasonally varying soil moisture (SM) feedbacks on PME. However, interactions between SM and PME through land-atmosphere coupling feedback under seasonality and at regional scale are still unclear. Under the impacts of global climate changes and human activities, the quality and quantity of water resources in the IMYRB are under profound risks [27], and water shortage has become a pressing issue for the sustainable development of the IMYRB [28].
Interactions between SM, precipitation, and evapotranspiration have aroused considerable concerns [29], while the degree of SM feedback and relevant mechanisms remain obscure [15]. Hence, the scientific issues to be addressed here are: (1) during the wet and dry seasons, as well as the whole year, how SM changes impact future projected PME changes; and (2) what are the SM—atmosphere responses to PME and relevant thermodynamic and dynamic mechanisms.
2. Materials and Method
2.1. Study Area
The Yellow River, the second longest river in China, has been deemed as China’s mother river, as well as the cradle of Chinese civilization, and has been well known for frequent floods, droughts [30,31,32], and water shortages [33]. The Inner Mongolia section of the Yellow River basin (IMYRB) (106°34′ E~112°78′ E, 39°09′~41°84′ N) is located at the northern Yellow River basin with an area of about 102,306 km2, dominated by the temperate continental monsoon climate. The IMYRB, includes seven cities (Figure 1), the eastern part of the IMYRB includes parts of Baotou, parts of Ordos, Ulanqab, and Hohhot, the western part of the IMYRB includes small parts of Baotou, Bayan Nur, parts of Ordos, Alxa League, and Wuhai (Figure 1). Zhou et al. [25] proposed that drylands are identified as regions where the ratio of evapotranspiration to precipitation (E/P) is greater than 0.84. The E/P of the IMYRB is greater than 1 with low SM and PME over the eastern IMYRB (Figure 1). As an important ecological security barrier in Northern China, water shortages pose an impressive challenge to the regional ecological security of the IMYRB [32].
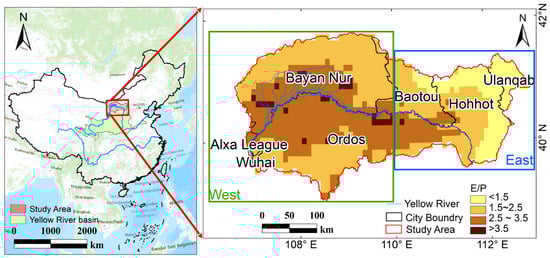
Figure 1.
Location of the study area and multi-year average E/P (degree of dryness) of the IMYRB. (blue for the eastern extent of the IMYRB and green for the western extent of the IMYRB).
2.2. Data Sources
We used meteorological data from the ERA5-Land global reanalysis dataset covering the period 1980–2021 to unravel the SM responses to PME over the IMYRB (Table 1). ERA5-Land contains four soil layers (1st layer: 0~7 cm; 2nd layer: 7~28 cm; 3rd layer: 28~100 cm; 4th layer: 100~289 cm). Here we calculated the data from the first to the third layer of soil moisture, according to the ratio of 7:21:72, to obtain the root-zone SM that we needed, namely the SM data used in this study [25].

Table 1.
The reanalysis data used in this study.
2.3. Research Method
- (1)
- Definition of the wet and dry seasons
In the study of convective precipitation events, the wet season is defined as the period between January and April, and the dry season is defined as the period between June and September, based on the transition between non-rainfall and rainfall in the Amazon region [34]. Generally speaking, the four seasons can be divided into spring (February to May), summer (June to August), autumn (September to November), winter (December to January). The main objective of this study was to evaluate and study the changes in precipitation, evapotranspiration, and surface water availability (PME), so in this study, three consecutive months (July, August, and September) with higher PME from 1980 to 2021 are defined as the wet season, and three consecutive months (April, May, and June) with lower PME as the dry season this study, three consecutive months (July, August, and September) with higher PME from 1980 to 2021 are defined as the wet season, and three consecutive months (April, May, and June) with lower PME, as the dry season [26] (Figure 2).
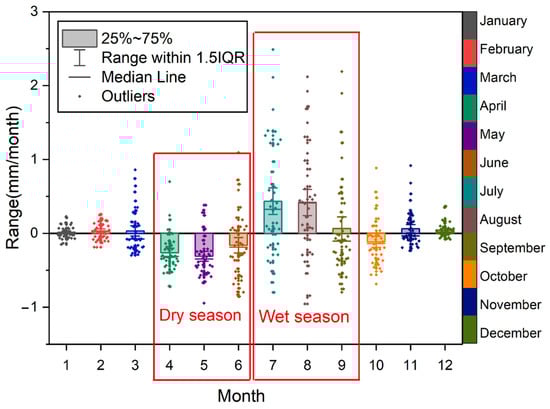
Figure 2.
Box chart of the monthly-scale PME (mm/month) in the IMYRB from 1980 to 2021.
- (2)
- Trend analysis
We conducted a linear regression based on the least squares method to detect the trend for the annual meteorological variables. The regression coefficient was used as the annual meteorological variables change rate:
where i is the sequential year range (1980–2021), αi is the annual meteorological variable in the year yi, and α and y are the mean values. While b > 0 means increasing trend in the meteorological variables, and vice versa. If the regression coefficient passes through the significance test (F test, p < 0.05), it shows a significant ascending or descending trend [35,36].
- (3)
- SM-atmosphere feedbacks
Due to the hysteresis effect of the SM [37], the monthly-scale SM and a specific meteorological variable (α) in the IMYRB are taken as the independent variables in the model, and the value of the next month α as the dependent variable to exclude the influence of autocorrelation of meteorological variables. The monthly-scale multiple linear regression model is [25]:
wherein d represents the trends without seasonal and interannual periods, t represents the monthly step, and the n1 is the sensitivity coefficient of the SM to a specific variable α, n2 is the autocorrelation of specific variables and n1 > 0 means that a decrease of SM will cause a decrease of α (SM-α positive feedback); n1 < 0 means that a decrease of SM will cause an increase of α (SM-α negative feedback).
- (4)
- Decomposition of the atmospheric moisture convergence
Atmospheric moisture convergence (MC) is calculated as the negative divergence of vertically-integrated moisture flux over pressure (p) on the top of atmosphere (p = p0) to the surface (p = p1). In order to further quantify the relative contribution of the dynamic and thermodynamic processes of MC, Equation (5) can be obtained from the water vapor budget balance Equations (4), (6) and (7) can be obtained from the expansion of Equation (5):
where in ρw is the density of water, g is the acceleration due to gravity, ∇ is the divergence operator, v is the horizontal vector wind, and q is the specific humidity. We can roughly divide the moisture convergence changes into a thermodynamic component (TH) induced by specific humidity changes, and a mean circulation dynamic component (MCD) induced by horizontal wind changes [25,38,39].
3. Results
3.1. Spatial Pattern and Trends of the Meteorological Variables
Combined influences of climate change and human activities have driven significant changes in hydrometeorological variables over the past 42 years (Table 2). Figure 3a,e show the spatial pattern and trend of the IMYRB. SM with long-term monthly average of 0.217 cm3/cm3 and high SM (>0.217 cm3/cm3/month) can be observed mainly in Ulanqab, Hohhot, Northern Ordos, and Northeastern Baotou, while low SM (<0.217 cm3/cm3/month) can be found in Bayan Nur, Alxa League, and central Ordos. Approximately 28.64% of land became drier, the largest decreasing magnitude of −0.00194 cm3/cm3 per year of SM can be found in Ulanqab. With respect to precipitation (Figure 3b,f), the long-term mean precipitation is 0.93 mm per month and is decreasing from the east to the west of the IMYRB. Specifically, decreased precipitation can be detected over 96.6% of the total area of IMYRB with a decreasing rate of −0.0032 mm per year. With respect to evapotranspiration (Figure 3c,g), the long-term mean is 0.91 mm per month. The spatial pattern of evapotranspiration and precipitation is similar and decreased evapotranspiration can be found over 94.5% of the total area of IMYRB by −0.0025 mm per year. With the respect to PME (Figure 3d,h), the long-term mean is 0.021 mm per month with highest PME over Hohhot and Ulanqab, being respectively, 0.066 mm and 0.061 mm. Decreased PME can be found over 71.2% of the total area of IMYRB by −0.0007 mm per year. Moreover, we found significant decreases in SM and PME over the east IMYRB (r = 0.7, p < 0.05) with high long-term monthly averages of SM and PME, implying complex interactions between SM and PME.
Table 2.
Long-term monthly mean value and interannual trends in soil moisture (SM), precipitation (P), evapotranspiration (E) and precipitation minus evapotranspiration (PME). Sensitivity coefficient of 1 indicates that increases by 100% of its standard deviation when last month SM increases by one standard deviation. (* p < 0.05, ** p < 0.01, *** p < 0.001).
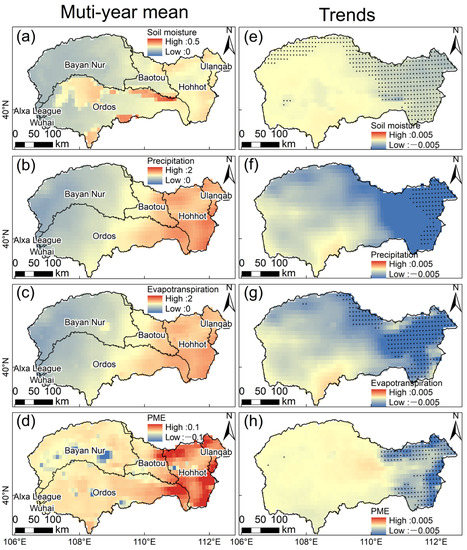
Figure 3.
Spatial patterns and trends of soil moisture ((a) cm3/cm3 and (e) cm3/cm3 per year), precipitation ((b) mm and (f) mm per year), evapotranspiration ((c) mm and (g) mm per year) and PME ((d) mm and (h) mm per year) from 1980 to 2021, stippling denotes regions where correlation coefficients are significant at the 95% confidence level.
3.2. Negative SM-PME Feedback during the Wet and Dry Seasons
The distinct interactions among the individual variables (SM, P, E) lead to a significant complexity in the SM-PME feedback. During the wet and dry seasons, as well as the whole year, decreased SM drives increased PME through land-atmosphere interactions over more than 90% of the IMYRB area (Figure 4g–i). For the whole year, there occurs the SM-E feedback (−0.163 ± 0.083 per month) and SM-P feedback (0.007 ± 0.113 per month) (Figure 4a,d). Low SM will cause a decrease in 98.6% of the regional evapotranspiration and an increase in 94.3% of the regional precipitation. During the wet season, there occurs the SM-E feedback (−0.189 ± 0.363 per month) and SM-P feedback (0.064 ± 0.423 per month) (Figure 4b,e). SM drying will trigger a decrease (an increase) in the regional evapotranspiration (precipitation) over 84.8% (80.7%) of the total area of the IMYRB. During dry season, there occurs the SM-E feedback (−0.326 ± 0.525 per month) and SM-P feedback (0.0259 ± 0.218 per month) (Figure 4c,f). SM dryness will cause a decrease (an increase) in the regional evapotranspiration (precipitation) over 79.6% (67.1%) of the total area of the IMYRB. In particular, a decrease (an increase) in the evapotranspiration (precipitation) due to SM drying during the dry season doubles that during the wet season, indicating that the SM-PME negative feedback in the dry season is greater than in the wet season.
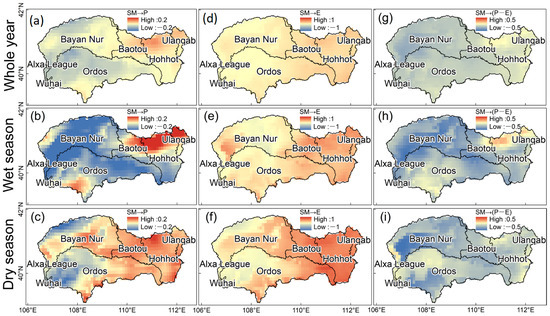
Figure 4.
Impacts of the SM feedbacks on water availability during in the wet and dry seasons, as well as the whole year. (a–i), sensitivity coefficients for SM→precipitation (P) (a–c), SM→evapotranspiration (E) (d–f) and soil moisture (SM)→precipitation minus evapotranspiration (PME) (g–i) identified, based on whole year (a,d,g), wet season (b,e,h) and dry season (c,f,i).
As for the SM-P feedback in each specific city (Table 3) at the annual scale, the SM-P positive feedback occurs in Ulanqab, Baotou, and Hohhot. SM drying triggers a decrease in evapotranspiration at the rate of 5–10 times larger than that of the precipitation decrease. In the wet season, the SM-P positive feedback occurs in Ulanqab and Hohhot, with the decrease in evapotranspiration caused by SM drying in these cities about three to nine times that of the precipitation decrease. In the dry season, the SM-P positive feedback occurs in Ulanqab, Baotou, Bayan Nur, and Hohhot, with the decrease in evapotranspiration caused by the SM decrease in these cities, only about twice the decrease of precipitation. In summary, during the wet and dry seasons, as well as the whole year, the limitation of SM for evapotranspiration is greater than that for precipitation. From the perspective of atmospheric water balance, the difference between the influence of SM on evapotranspiration and precipitation is equal to the influence of SM on the moisture convergence in the horizontal direction. Therefore, it is necessary to further analyze the influence of SM changes in the moisture convergence process, and sort out the physical processes in the SM-PME feedback mechanism.
Table 3.
Soil moisture (SM) feedbacks on precipitation (P), evapotranspiration (E), and water availability (PME) mean statistics in the wet and dry seasons, as well as the whole year, and seven leagues and cities.
During the wet and dry seasons, as well as the whole year, the SM reduction increased the surface temperature across more than 79% of the IMYRB (SM-T negative feedback) (Figure 5a–c). Given SM drying, surface temperature rises to varying degrees, and the water vapor that the air can hold varies with increasing temperature. In order to study the respective effects of the physical processes on the change of total moisture convergence over the region, the anomalies caused by wind speed and specific humidity were separated for specific analyses [40]. Excluding the influence of background wind (prevailing wind), the influence of air flow in the basin on moisture convergence is closely related to specific humidity. According to the thermodynamic formula, the change of specific humidity directly affects PME [41]. By calculating the sensitivity coefficient of SM specific humidity under the wet and dry seasons, as well as the whole year, the SM reduction increased specific humidity across more than 75% of the IMYRB (SM-q negative feedback) (Figure 5g–h), accounting for 82.47%, 76.97%, and 75.75% of the total IMYRB area.
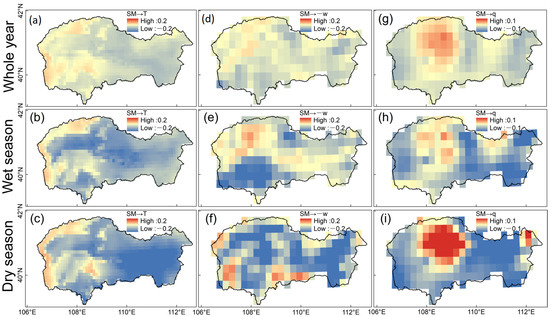
Figure 5.
Soil moisture feedbacks on temperature, pressure velocity, and specific humidity in the wet and dry seasons, as well as the whole year. (a–i), sensitivity coefficients for SM→2 meter temperature (T) (a–c), SM→ negative pressure velocity (−ω) at 700 hPa (middle troposphere) (d–f) and soil moisture (SM)→specific humidity (q) at 700 hPa (g–i) identified based on the whole year (a,d,g), wet season (b,e,h) and dry season (c,f,i).
According to the statistical data, the influence of SM on the PME changes is largely consistent with the influence of the vertical rise of the troposphere. During the wet and dry seasons, as well as the whole year, the SM reduction increased the negative pressure velocity across more than 80% of the IMYRB (SM-(−ω) negative feedback) (Figure 5d–f), and accounted for 89.19%, 86.75%, and 82.47% of the total IMYRB area. The SM drying in the IMYRB increases the vertical wind speed in different degrees under the wet and dry seasons, as well as the whole year.
According to the feedback of SM change in evapotranspiration, it can be known that when SM drying continues, evapotranspiration decreases accordingly. Evapotranspiration is a key flux in the land-air-water cycle and energy cycle. The evapotranspiration reduction drives the decrease of the surface latent heat flux and the increase of sensible heat flux [42], increases surface temperature [43], increases the temperature difference and pressure difference between the surface and the atmosphere, promotes the vertical movement (rise) of the atmosphere, and regulates the control of convective precipitation, maybe promotes the convergence of water vapor, strengthens the moisture convergence to the region to increase PME, and contributes to the SM-PME negative feedback.
3.3. Thermodynamics and Dynamic Effects in the SM-PME
PME changes are jointly driven by thermodynamic and dynamic processes [40,41]. To further analyze the thermodynamic and dynamic mechanisms in the SM-PME feedback process, we step further into the influence of SM on the atmospheric water vapor budget. In the IMYRB, the SM reduction increased moisture convergence (SM-MC negative feedback), indicating that the SM reduction drives the dynamic and thermodynamic components to promote water vapor flux convergence in most regions. In the whole year, the SM drying caused changes in moisture convergence (−0.010 ± 0.068 per month) (Figure 6a), with the moisture convergence increasing in 69.0% of the regions; in the wet season, the change of moisture convergence was caused by SM drying (−0.235 ± 0.500 per month) (Figure 6b) with moisture convergence increasing in 62.9% of the regions; in the dry season, SM drying caused changes in moisture convergence (−0.034 ± 0.185 per month) (Figure 6c) with moisture convergence increasing in 56.2% of the regions. In the whole year, the sensitivity coefficient of the SM decline to moisture convergence dynamics was −0.006; in the wet season and dry season, it was −0.016 and −0.008 (SM-MCD negative feedback). It shows that during the wet and dry seasons, as well as the whole year, the SM reduction decreased evapotranspiration and increased surface temperature and other processes through the dynamic mechanism of moisture convergence, increased precipitation, and alleviated the decline of regional PME, while during the wet and dry seasons, as well as the whole year, the sensitivity coefficients of the SM decline to moisture convergence thermodynamics were all less than <0.005 (SM-TH feedback weakly), indicating that SM had little effect on moisture convergence through thermodynamic processes. The areas of moisture convergence in the wet and dry seasons and the dynamic components of moisture convergence were consistent in spatial extent (Figure 6b,c,e,f), indicating obvious seasonal differences in the IMYRB moisture convergence (divergence). Different regions showed opposite moisture convergence (divergence) in wet and dry seasons, while the thermodynamic component of moisture convergence had little seasonal difference (Figure 6g–i).
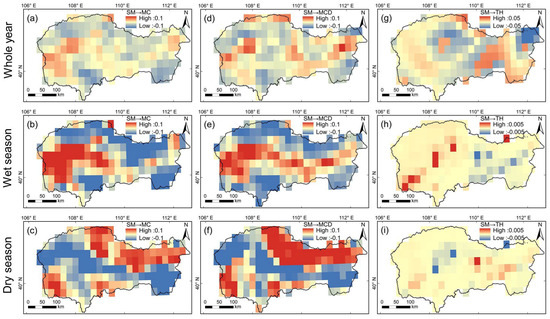
Figure 6.
Soil moisture effects on the mean flow convergence and the two components of the mean flow convergence in the wet (b,e,h), dry seasons (c,f,i), and the whole year (a,d,g). (a–i), sensitivity coefficients for SM → moisture convergence (MC) (a–c), SM → mean circulation dynamic component (MCD) (d–f), SM → thermodynamic component (TH) (g–i).
By analyzing the correlation coefficient of the effect of SM on moisture convergence through thermodynamic and dynamic mechanisms on a pixel-by-pixel basis, in wet (r = 0.86, p < 0.05), dry seasons (r = 0.85, p < 0.05), and the whole year (r = 0.67, p < 0.05), the spatial patterns were highly correlated (Figure 7a–c). We find that the monthly moisture convergence under the wet and dry seasons, as well as the whole year was dominated by the dynamic component, while the other components of the thermodynamic mechanism made little contribution.
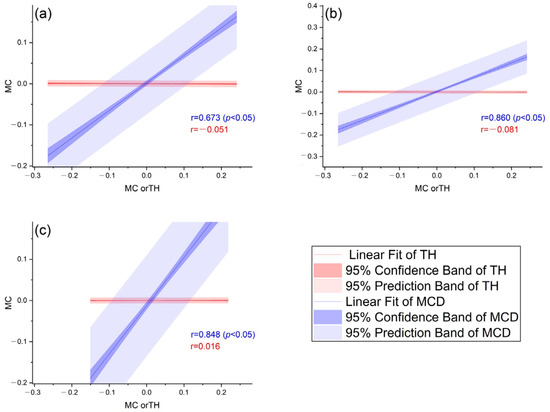
Figure 7.
Relative contribution of soil moisture to each component of moisture convergence in the wet (b), dry seasons (c), and the whole year (a). Red is the contribution of the thermodynamic component (TH) to moisture convergence, and blue is the contribution of the mean circulation dynamic component (MCD) to moisture convergence.
4. Discussion
Under global warming, temperature increases cause SM drying and drought intensification [28]. This study confirmed that the SM changes have increased PME of the IMYRB through such processes, as increased precipitation through land-atmosphere interactions, effectively reducing the water resource status of the IMYRB. In the SM-PME feedback process, in addition to the direct impact of soil water on precipitation and evapotranspiration, different soil depths may also lead to uncertainty in the feedback strength. Meanwhile, there are complex interactions among meteorological variables [44]. There is also a mutual feedback relationship between vegetation and SM [45], and land use change also affects rainfall patterns by directly affecting evapotranspiration [46]. In addition to the influence of natural factors, human activities have increasing impacts on the net runoff change in the YRB [47]. Due to the SM-PME negative feedback, measures, such as the construction of reservoirs, water diversion, irrigation, and other river projects may weaken the negative feedback effect of SM in this natural state, and the water resources of the IMYRB, which was originally arid, are even more scarce.
At the same time, the warming of the Arctic is accelerating, and this effect is gradually expanding to other latitudes, which is called the Arctic amplification effect [48]. This effect may affect the strength of the Hadley cell and the westerly jet through the inter-latitude temperature gradient, and then affect precipitation and other processes in the mid-latitude region [49]. This effect also aggravates climate change in the mid-latitude region. The IMYRB is located in the mid-latitude region, and the impacts are complex, and the powerful large-scale weather system may offset the feedback effect of SM [50]. Precipitation that directly affects PME will reduce the humidity of the troposphere through evapotranspiration at the convective cloud, change the intensity of the hydrological cycle, and have a certain impact on the feedback of SM [23]. The conclusion that the IMYRB SM regulates PME in a small mid-latitude region adds uncertainty to the conclusions under global warming [51].
The global reanalysis dataset currently used in this study combines the advantages of site observation data, satellite remote sensing, and numerical model simulation. It has been widely used and evaluated in many research fields, such as climate monitoring and seasonal forecasting, global and regional water cycle, energy balance, etc. However, the applicability of the data in different regions is different. There may be deviations and sufficient measured data are needed to verify the model and conclusions, and improve the accuracy and effectiveness of the analysis [52,53]. At the same time, the model prediction is conducive to more in-depth analysis of regional hydrological changes and other processes, and a deeper understanding of the law of dry and wet changes in land arid regions under the background of climate change and the management of land surface water resources. It is unclear whether other regions have the same feedback as the IMYRB. A comprehensive consideration of the role of multiple factors in land-atmosphere coupling feedback from multiple perspectives is one of the directions for future research on soil moisture changes.
5. Conclusions
The negative feedback of the SM-PME is crucial for rational planning and management of water resources. In previous studies, SM at the global scale could alleviate the PME reduction by regulating atmospheric processes and water cycle to form a negative feedback, so there will be fewer extreme climate events under global warming than predicted values [25]. However these conclusions and mechanisms have not received much attention and verification in smaller areas. We analyzed the SM vs. PME interactions and relevant mechanisms and we found the following:
- (1)
- The IMYRB is located in an arid region, dry in the east and drier in the west. Monthly SM, evapotranspiration, precipitation, and PME all showed a spatial pattern of low values in the west and high values in the east, while the spatial pattern of the downward trend was significantly consistent (r = 0.7, p < 0.05). There is a strong interaction between SM and PME, the SM-PME negative feedback eased the PME decline in more than 90% of areas;
- (2)
- The SM-PME negative feedback occurs throughout the whole year and the feedback is greater in the wet season (n1-mean = −0.242) than in the dry season (n1-mean = −0.215), which is consistent with the existing dynamic and thermodynamic theories [54,55]. In the wet season, the SM-PME negative feedback appears due to the SM-E positive feedback (n1-mean = 0.179) and SM-P negative feedback (n1-mean = −0.10), and in the dry season, it is a combination of the positive feedback of the SM-E (n1-mean = 0.296) and SM-P (n1-mean = 0.024). The difference in the feedback degree of the SM-P feedback and SM-E feedback in the dry season and wet season caused the difference in feedback of the SM-PME in the dry season and wet season;
- (3)
- By quantifying the contributions of the dynamics and the thermodynamic component in the moisture convergence process under the wet and dry seasons, as well as the whole year, it can be seen that the dynamic mechanism promoted the water vapor convergence process, while the thermodynamic mechanism slowed down the process, and the contribution of the dynamics mechanism is slightly greater in the wet season (r = 0.86, p < 0.05) than the dry season (r = 0.85, p < 0.05).
Author Contributions
K.Z. and Q.Z. conceived and designed the framework, and wrote the paper. Q.Z.: funding support and guidance for writing the original version. G.W. and T.L.: contributed to the data preparation. W.W. and J.S.: edited the original version. V.P.S. revised the grammar and improved the clarity and accuracy of the text. All authors have read and agreed to the published version of the manuscript.
Funding
This work was supported by The Major Science and Technology Projects of Inner Mongolia Autonomous Region (2020ZD0009) and Collaborative Innovation Center for Integrated Management of Water Resources and Water Environment in the Inner Mongolia Reaches of the Yellow River, Hohhot, China.
Institutional Review Board Statement
Not applicable.
Informed Consent Statement
Not applicable.
Data Availability Statement
Publicly available datasets were used in this study. The monthly root-zone SM, precipitation, evapotranspiration data are from The ECMWF Reanalysis v5-Land (ERA5-LAND), https://www.ecmwf.int/en/forecasts/dataset/ecmwf-reanalysis-v5-land (accessed on 1 January 2023). We used root-zone SM by proportioning the three volume soil moisture layers. The monthly specific humidity, vertical velocity, v-component of wind, u-component of wind date, and other data are from ECMWF Reanalysis v5 (ERA5), https://www.ecmwf.int/en/forecasts/dataset/ecmwf-reanalysis-v5 (accessed on 1 January 2023).
Acknowledgments
The author thanks the European Centre for Medium-Range Weather Prediction (ECMWF) for free access to ERA5 and ERA5-land reanalysis data. We thank all of the reviewers for helping us to improve the manuscript.
Conflicts of Interest
The authors declare no conflict of interest.
References
- Zhang, Q.; Li, J.; Singh, V.P.; Xiao, M. Spatio-temporal relations between temperature and precipitation regimes: Implications for temperature-induced changes in the hydrological cycle. Glob. Planet. Chang. 2013, 111, 57–76. [Google Scholar] [CrossRef]
- Wang, G.; Zhang, Q.; Yu, H.; Shen, Z.; Sun, P. Double increase in precipitation extremes across China in a 1.5 °C/2.0 °C warmer climate. Sci. Total Environ. 2020, 746, 140807. [Google Scholar] [CrossRef] [PubMed]
- Wang, R.; Li, L.; Gentine, P.; Zhang, Y.; Chen, J.; Chen, X.; Chen, L.; Ning, L.; Yuan, L.; Lü, G. Recent increase in the observation-derived land evapotranspiration due to global warming. Environ. Res. Lett. 2022, 17, 024020. [Google Scholar] [CrossRef]
- Padrón, R.S.; Gudmundsson, L.; Seneviratne, S.I. Observational constraints reduce likelihood of extreme changes in multidecadal land water availability. Geophys. Res. Lett. 2019, 46, 736–744. [Google Scholar] [CrossRef]
- Swenson, S.; Wahr, J. Estimating large-scale precipitation minus evapotranspiration from GRACE satellite gravity measurements. J. Hydrometeorol. 2006, 7, 252–270. [Google Scholar] [CrossRef]
- Chen, Z.; Wang, W.; Cescatti, A.; Forzieri, G. Climate-driven vegetation greening further reduces water availability in drylands. Glob. Chang. Biol. 2023, 29, 1628–1647. [Google Scholar] [CrossRef]
- Shen, Z.; Zhang, Q.; Singh, V.P.; Pokhrel, Y.; Li, J.; Xu, C.Y.; Wu, W. Drying in the low-latitude Atlantic Ocean contributed to terrestrial water storage depletion across Eurasia. Nat. Commun. 2022, 13, 1849. [Google Scholar] [CrossRef]
- Fischer, E.M.; Seneviratne, S.I.; Vidale, P.L.; Lüthi, D.; Schär, C. Soil moisture–atmosphere interactions during the 2003 European summer heat wave. J. Clim. 2007, 20, 5081–5099. [Google Scholar] [CrossRef]
- Schwingshackl, C.; Hirschi, M.; Seneviratne, S.I. Quantifying spatiotemporal variations of soil moisture control on surface energy balance and near-surface air temperature. J. Clim. 2017, 30, 7105–7124. [Google Scholar] [CrossRef]
- Zhang, Q.; Fan, K.; Singh, V.P.; Sun, P.; Shi, P. Evaluation of remotely sensed and reanalysis soil moisture against in situ observations on the Himalayan-Tibetan Plateau. J. Geophys. Res. Atmos. 2018, 123, 7132–7148. [Google Scholar] [CrossRef]
- Williams, C.A.; Albertson, J.D. Soil moisture controls on canopy-scale water and carbon fluxes in an African savanna. Water Resour. Res. 2004, 40, 3208. [Google Scholar] [CrossRef]
- Entekhabi, D.; Rodriguez-Iturbe, I.; Bras, R.L. Variability in large-scale water balance with land surface-atmosphere interaction. J. Clim. 1992, 5, 798–813. [Google Scholar] [CrossRef]
- Baur, F.; Keil, C.; Craig, G.C. Soil moisture–precipitation coupling over Central Europe: Interactions between surface anomalies at different scales and the dynamical implication. Q. J. R. Meteorol. Soc. 2018, 144, 2863–2875. [Google Scholar] [CrossRef]
- Song, Y.M.; Wang, Z.F.; Qi, L.L.; Huang, A.N. Soil moisture memory and its effect on the surface water and heat fluxes on seasonal and interannual time scales. J. Geophys. Res. Atmos. 2019, 124, 10730–10741. [Google Scholar] [CrossRef]
- Yang, L.; Sun, G.; Zhi, L.; Zhao, J. Negative soil moisture-precipitation feedback in dry and wet regions. Sci. Rep. 2018, 8, 1–9. [Google Scholar] [CrossRef]
- Alessi, M.J.; Herrera, D.A.; Evans, C.P.; DeGaetano, A.T.; Ault, T.R. Soil Moisture Conditions Determine Land-Atmosphere Coupling and Drought Risk in the Northeastern United States. J. Geophys. Res. Atmos. 2022, 127, e2021JD034740. [Google Scholar] [CrossRef]
- Zhang, J.; Wang, W.C.; Wei, J. Assessing land-atmosphere coupling using soil moisture from the Global Land Data Assimilation System and observational precipitation. J. Geophys. Res. Atmos. 2008, 113, 9807. [Google Scholar] [CrossRef]
- Cook, B.I.; Bonan, G.B.; Levis, S. Soil moisture feedbacks to precipitation in southern Africa. J. Clim. 2006, 19, 4198–4206. [Google Scholar] [CrossRef]
- Tuttle, S.; Salvucci, G. Empirical evidence of contrasting soil moisture–precipitation feedbacks across the United States. Science 2016, 352, 825–828. [Google Scholar] [CrossRef] [PubMed]
- Guillod, B.P.; Orlowsky, B.; Miralles, D.G.; Teuling, A.J.; Seneviratne, S.I. Reconciling spatial and temporal soil moisture effects on afternoon rainfall. Nat. Commun. 2015, 6, 6443. [Google Scholar] [CrossRef]
- Hsu, H.; Lo, M.H.; Guillod, B.P.; Miralles, D.G.; Kumar, S. Relation between precipitation location and antecedent/subsequent soil moisture spatial patterns. J. Geophys. Res. Atmos. 2017, 122, 6319–6328. [Google Scholar] [CrossRef]
- Pal, J.S.; Eltahir, E.A. Pathways relating soil moisture conditions to future summer rainfall within a model of the land–atmosphere system. J. Clim. 2001, 14, 1227–1242. [Google Scholar] [CrossRef]
- Worden, J.; Noone, D.; Bowman, K. Importance of rain evapotranspiration and continental convection in the tropical water cycle. Nature 2007, 445, 528–532. [Google Scholar] [CrossRef]
- Eltahir, E.A. A soil moisture–rainfall feedback mechanism: 1. Theory and observations. Water Resour. Res. 1998, 34, 765–776. [Google Scholar] [CrossRef]
- Zhou, S.; Williams, A.P.; Lintner, B.R.; Berg, A.M.; Zhang, Y.; Keenan, T.F.; Cook, B.I.; Hagemann, S.; Seneviratne, S.I.; Gentine, P. Soil moisture–atmosphere feedbacks mitigate declining water availability in drylands. Nat. Clim. Chang. 2021, 11, 38–44. [Google Scholar] [CrossRef]
- Zhou, S.; Williams, A.P.; Lintner, B.R.; Findell, K.L.; Keenan, T.F.; Zhang, Y.; Gentine, P. Diminishing seasonality of subtropical water availability in a warmer world dominated by soil moisture–atmosphere feedbacks. Nat. Commun. 2022, 13, 5756. [Google Scholar] [CrossRef] [PubMed]
- Wang, Y.; Duan, L.; Tong, X.; Liu, T.; Li, D.; Li, W. Non-stationary modeling of wet-season precipitation over the Inner Mongolia section of the Yellow River basin. Theor. Appl. Climatol. 2022, 151, 389–405. [Google Scholar] [CrossRef]
- Omer, A.; Elagib, N.A.; Zhuguo, M.; Saleem, F.; Mohammed, A. Water scarcity in the Yellow River Basin under future climate change and human activities. Sci. Total Environ. 2020, 749, 141446. [Google Scholar] [CrossRef]
- Gaona, J.; Quintana-Seguí, P.; Escorihuela, M.J.; Boone, A.; Llasat, M.C. Interactions between precipitation, evapotranspiration and soil-moisture-based indices to characterize drought with high-resolution remote sensing and land-surface model data. Nat. Hazards Earth Syst. Sci. 2022, 22, 3461–3485. [Google Scholar] [CrossRef]
- Yang, T.; Zhang, Q.; Chen, Y.D.; Tao, X.; Xu, C.-Y.; Chen, X. A spatial assessment of hydrologic alteration caused by dam construction in the middle and lower Yellow River, China. Hydrol. Process. 2008, 22, 3829–3843. [Google Scholar] [CrossRef]
- Zhang, Q.; Wang, G.; Yuan, R.; Singh, V.P.; Wu, W.; Wang, D. Dynamic responses of ecological vulnerability to land cover shifts over the Yellow River Basin, China. Ecol. Indic. 2022, 144, 109554. [Google Scholar] [CrossRef]
- Feng, Y.; Zhu, A.; Liu, P.; Liu, Z. Coupling and coordinated relationship of water utilization, industrial development and ecological welfare in the Yellow River Basin, China. J. Clean. Prod. 2022, 379, 134824. [Google Scholar] [CrossRef]
- Zhang, Q.; Liu, J.; Singh, V.P.; Shi, P.; Sun, P. Hydrological responses to climatic changes in the Yellow River basin, China: Climatic elasticity and streamflow prediction. J. Hydrol. 2017, 554, 635–645. [Google Scholar] [CrossRef]
- Biscaro, T.S.; Machado, L.A.; Giangrande, S.E.; Jensen, M.P. What drives daily precipitation over the central Amazon? Differences observed between wet and dry seasons. Atmos. Chem. Phys. 2021, 21, 6735–6754. [Google Scholar] [CrossRef]
- MathWorks. Statistics and Machine Learning Toolbox™ User’s Guide 2019. Available online: https://kr.mathworks.com/ (accessed on 20 January 2023).
- Yin, L.; Feng, X.; Fu, B.; Chen, Y.; Wang, X.; Tao, F. Irrigation water consumption of irrigated cropland and its dominant factor in China from 1982 to 2015. Adv. Water Resour. 2020, 143, 103661. [Google Scholar] [CrossRef]
- Wei, J.; Dickinson, R.E.; Chen, H. A negative soil moisture–precipitation relationship and its causes. J. Hydrometeorol. 2008, 9, 1364–1376. [Google Scholar] [CrossRef]
- Wang, Z.; Duan, A.; Yang, S.; Ullah, K. Atmospheric moisture budget and its regulation on the variability of summer precipitation over the Tibetan Plateau. J. Geophys. Res. Atmos. 2017, 122, 614–630. [Google Scholar] [CrossRef]
- Seager, R.; Ting, M.; Held, I.; Kushnir, Y.; Lu, J.; Vecchi, G. Model projections of an imminent transition to a more arid climate in southwestern North America. Science 2007, 316, 1181–1184. [Google Scholar] [CrossRef]
- Seager, R.; Naik, N.; Vecchi, G.A. Thermodynamic and dynamic mechanisms for large-scale changes in the hydrological cycle in response to global warming. J. Clim. 2010, 23, 4651–4668. [Google Scholar] [CrossRef]
- Byrne, M.P.; O’Gorman, P.A. The response of precipitation minus evapotranspiration to climate warming: Why the “wet-get-wetter, dry-get-drier” scaling does not hold over land. J. Clim. 2015, 28, 8078–8092. [Google Scholar] [CrossRef]
- Sadeghi, M.; Ebtehaj, A.; Guala, M.; Wang, J. Physical connection of sensible and ground heat flux. J. Hydrol. 2021, 602, 126687. [Google Scholar] [CrossRef]
- Seguin, B.; Courault, D.; Guerif, M. Surface temperature and evapotranspiration: Application of local scale methods to regional scales using satellite data. Remote Sens. Environ. 1994, 49, 287–295. [Google Scholar] [CrossRef]
- Ford, T.W.; Rapp, A.D.; Quiring, S.M. Does afternoon precipitation occur preferentially over dry or wet soils in Oklahoma? J. Hydrometeorol. 2015, 16, 874–888. [Google Scholar] [CrossRef]
- Wei, X.; Huang, Q.; Huang, S.; Leng, G.; Qu, Y.; Deng, M.; Han, Z.; Zhao, J.; Liu, D.; Bai, Q. Assessing the feedback relationship between vegetation and soil moisture over the Loess Plateau, China. Ecol. Indic. 2022, 134, 108493. [Google Scholar] [CrossRef]
- Kunstmann, H.; Jung, G. Influence of soil-moisture and land use change on precipitation in the Volta Basin of West Africa. Int. J. River Basin Manag. 2007, 5, 9–16. [Google Scholar] [CrossRef]
- Kong, D.; Miao, C.; Wu, J.; Duan, Q. Impact assessment of climate change and human activities on net runoff in the Yellow River Basin from 1951 to 2012. Ecol. Eng. 2016, 91, 566–573. [Google Scholar] [CrossRef]
- Screen, J.A.; Simmonds, I. The central role of diminishing sea ice in recent Arctic temperature amplification. Nature 2010, 464, 1334–1337. [Google Scholar] [CrossRef]
- Routson, C.C.; McKay, N.P.; Kaufman, D.S.; Erb, M.P.; Goosse, H.; Shuman, B.N.; Rodysill, J.R.; Ault, T. Mid-latitude net precipitation decreased with Arctic warming during the Holocene. Nature 2019, 568, 83–87. [Google Scholar] [CrossRef]
- Hong, S.Y.; Kalnay, E. Role of sea surface temperature and soil-moisture feedback in the 1998 Oklahoma–Texas drought. Nature 2000, 408, 842–844. [Google Scholar] [CrossRef]
- Starr, V.P.; Peixoto, J.P. On the global balance of water vapor and the hydrology of deserts. Tellus 1958, 10, 188–194. [Google Scholar] [CrossRef]
- Lavers, D.A.; Simmons, A.; Vamborg, F.; Rodwell, M.J. An evaluation of ERA5 precipitation for climate monitoring. Quarterly J. R. Meteorol. Soc. 2022, 148, 3152–3165. [Google Scholar] [CrossRef]
- McNicholl, B.; Lee, Y.H.; Campbell, A.G.; Dev, S. Evaluating the Reliability of Air Temperature from ERA5 Reanalysis Data. IEEE Geosci. Remote Sens. Lett. 2021, 19, 1–5. [Google Scholar] [CrossRef]
- Held, I.M.; Soden, B.J. Robust responses of the hydrological cycle to global warming. J. Clim. 2006, 19, 5686–5699. [Google Scholar] [CrossRef]
- Ookouchi, Y.; Segal, M.; Kessler, R.C.; Pielke, R.A. Evaluation of soil moisture effects on the generation and modification of mesoscale circulations. Mon. Weather. Rev. 1984, 112, 2281–2292. [Google Scholar] [CrossRef]


Disclaimer/Publisher’s Note: The statements, opinions and data contained in all publications are solely those of the individual author(s) and contributor(s) and not of MDPI and/or the editor(s). MDPI and/or the editor(s) disclaim responsibility for any injury to people or property resulting from any ideas, methods, instructions or products referred to in the content. |
© 2023 by the authors. Licensee MDPI, Basel, Switzerland. This article is an open access article distributed under the terms and conditions of the Creative Commons Attribution (CC BY) license (https://creativecommons.org/licenses/by/4.0/).