Article

Stabilized Electrospun Polyacrylonitrile Fibers for Advancements in Clean Air Technology

1
Information Technology Laboratory, US Army Engineer Research and Development Center, Vicksburg, MS 39180, USA
2
Institute for Clean Energy Technology, Mississippi State University, 205 Research Blvd., Starkville, MS 39759, USA
3
Geotechnical and Structures Laboratory, US Army Engineer Research and Development Center, Vicksburg, MS 39180, USA
*
Author to whom correspondence should be addressed.
Atmosphere 2023, 14(3), 573; https://doi.org/10.3390/atmos14030573
Submission received: 20 December 2022 / Revised: 1 March 2023 / Accepted: 13 March 2023 / Published: 16 March 2023
(This article belongs to the Special Issue Advances in Understanding Aerosols Filtration)

Abstract

:
Particulate matter air pollution and volatile organic compounds released into the air from the incomplete combustion of fossil fuels and wildfires creates significant damage to human health and the environment. Advances in air filtration and purification technology are needed to mitigate aerosol hazards. This article details an effort to explore the potential benefits of new materials and methods for the production of nonwoven air filtration media through electrospinning and stabilizing polyacrylonitrile fibers. The investigated production methods include electrospinning fibrous matting onto a stainless steel wire mesh and stabilizing the nonwoven media in a chamber furnace. The media is then tested for air filtration penetration and airflow resistance, and the fiber size distribution is measured using scanning electron microscopy. The experimental results show that the electrospun media approaches the performance criteria for airflow resistance and particle capture efficiency of high-efficiency particulate air (HEPA) filter media. Furthermore, performance estimations for electrospun media of increased thickness and for a decreased filtration velocity show potential to exceed the HEPA media resistance and efficiency criteria. Thus, it is suggested that electrospun and stabilized nonwoven fibrous media are candidates as alternatives to traditionally manufactured HEPA media and may potentially benefit modern air filtration technology and reduce hazards associated with particulate matter. Additionally, the authors recommend future exploration into the carbonization and activation of electrospun filter media for the adsorption and mitigation of volatile organic compounds as a secondary benefit, while maintaining high efficiency and low airflow resistance in the removal of particulate matter from aerosol streams.

1. Introduction

Recent studies indicate the magnitude of global health problems associated with particulate matter (PM) air pollution [1]. The World Health Organization estimates between seven and eight million people die each year from breathing poor quality air, while 92% of the global population live in areas that exceed dangerous levels of particulate aerosol from both indoor and outdoor sources [2]. Global industrialization and population growth have led to increased emissions of air pollution from the combustion of fossil fuel, including PM, ground-level ozone (O3), nitrogen oxides (NOx), sulfur oxides (SOx), volatile organic compounds (VOCs), and carbon monoxide (CO) [3]. These pollutants and accompanying greenhouse gases impact our environment and are leading causes of climate change. While high-efficiency particulate air (HEPA) filters are effective in the mitigation of PM aerosols, they are not designed for the adsorption of VOCs [4,5,6]. The American Society of Mechanical Engineers (ASME) defines a HEPA filter as an extended medium dry-type pleated air filter with rigid casing that exhibits a minimum efficiency of 99.97% when tested with an aerosol of 0.3 µm diameter particles [7]. Modern HEPA filters are produced from decades-old technology with melt-blown glass fibers that are prone to fire and water damage [8,9]. The exploration and development of alternative fiber materials and production methods for HEPA filtration may yield improvements for safety and efficiency [10]. Advances in electrospinning technology enable further research into composite carbon nanofibers for air filtration. Electrospinning has seen an increase in popularity over the past several decades due to an increase in the exploration of nanomaterial technology [11]. Electrospinning has led to broad technological advancements in scientific, medical, and engineering fields. For example, electrospinning has enabled the production of new materials important for medical wound dressings, drug delivery, and water filtration [12,13,14,15]. Electrospun polyacrylonitrile nanofibers have proven to be effective in air filtration for the removal of aerosol pollution, which is the focus of this effort [16,17,18,19,20,21].
The goal of this research is to explore the viability of producing nonwoven fibrous air filtration media through electrospinning and stabilizing polyacrylonitrile fibers. To accomplish this, electrospinning technology in the fabrication of HEPA filtration media is investigated. Three objectives of this work include the optimization of electrospinning parameters for the production of a nonwoven mesh from a polyacrylonitrile solution, the stabilization of the electrospun mesh into durable air filtration media, and achieving air filtration test results that compare with published standards for contemporary HEPA filter media. Eventually, this will lead to activated carbon filter materials that potentially outperform and replace contemporary HEPA filter media.

1.1. Electrospun Polyacrylonitrile Fibers

Polyacrylonitrile is a polymer with nitrile functional groups (CN) attached to a polyethylene backbone with a linear formula (C3H3N)n. Stabilized polyacrylonitrile fibers are noncombustible, flame resistant, corrosion resistant, and mildew and mold resistant. Additionally, stabilized polyacrylonitrile fibers do not degrade from UV light, do not easily dissolve, and have a thermal decomposition temperature of 327 °C [10]. While acrylic fibers can be dry-spun, wet-spun, or electrospun from polyacrylonitrile, the advantage of electrospinning is the ease of attaining sub-micron fiber diameters. Electrospinning polyacrylonitrile fibers typically results in fiber diameters in the range of 5 nm to 500 nm [22]. The stretching and drawing of polyacrylonitrile fibers during the electrospinning process serves to reduce the fiber diameter while also aligning the polymer molecules, which increases the resulting tensile strength [23].

1.2. Polyacrylonitrile Stabilization

Polyacrylonitrile fiber stabilization occurs between 200 °C and 300 °C in air. At a temperature over 180 °C, homopolymer polyacrylonitrile molecular chains unfold and slide. Oxidation, dehydrogenation, and cyclization are the key chemical reactions in polyacrylonitrile stabilization, as shown in Figure 1 [24]. In the oxidation reaction, oxygen atoms attach to the carbon chain, ejecting two hydrogen atoms in the form of N2 gas. The fibers incorporate approximately 8% oxygen during this exothermic process. Oxidation is the gain of oxygen atoms and loss of hydrogen atoms. In the dehydrogenation reaction, double bonds are formed between carbon atoms to stabilize the carbon chain and eject oxygen and hydrogen atoms in the form of water vapor and N2 gas. In the cyclization reaction, the C≡N triple bonds are broken, while single and double bonds are formed in a continuous ladder structure between alternating carbon and nitrogen atoms.
While carbonization is not achieved within this current effort, a discussion of the benefits of carbonization is important. Polyacrylonitrile nanofibers can be carbonized into carbon nanofibers through a multi-phase process including oxidative stabilization and inert carbonization. Polyacrylonitrile carbonization occurs between 1000 °C and 1500 °C, which yields a turbostratic carbon fiber structure of folded basal planes [23]. Nonwoven carbon fiber media are desirable for air filtration. In an overall comparison of mechanical, thermal, and chemical properties, carbon fibers show superior quality among natural cellulose, regenerated cellulose, keratin, polymer, aramid, ceramic, quartz, glass, mineral, volcanic, and metallic fibers [10]. Specifically, carbon fibers demonstrate high tensile strength, stiff tensile modulus, and withstand extreme temperatures [10]. Additionally, carbon fibers have a very low moisture regain and very low thermal expansion, both of which are undesirable for air filter media [10]. Overall, electrospun carbonized nonwoven nanofibrous media have significant potential for high efficiency and low resistance air filtration [10].

2. Materials and Methods

Polyacrylonitrile was selected as the electrospinning material because it is a common precursor of carbon fibers. Nonwoven nanofibrous carbon fiber media show significant potential for particulate air filtration [10]. Polyacrylonitrile was obtained from Sigma Aldrich (St. Louis, MO, USA) with an average molecular weight of 150,000 (Product Number 181315, PCode 1002978354) and was used as received. Dimethylformamide (DMF) was obtained from Sigma Aldrich with an assay of 99.8% (Product Number 319937, PCode 1002326371) and was used as the solvent.

2.1. Solution Preparation

Solution concentrations and molecular weight selection were informed by previous works in the literature which obtained good results for polyacrylonitrile fibers with 8% to 16% concentration for 73,400 g/mol and 121,000 g/mol molecular weights [26]. Initially, three ten-gram solutions of polyacrylonitrile dissolved in DMF were prepared at 6%, 9%, and 12% weight ratios. The solutions were mixed overnight at room temperature in 20 mL glass bottles at 600 rpm on a Corning PC-620D magnetic stirring plate. All three solutions were manually tested for electrospinning suitability by pumping through stainless steel needles of 18-, 21-, and 23-gauge. The 6% and 9% solutions flowed adequately through the 21-gauge and 23-gauge needles with low-pressure resistance. However, the higher viscosity 12% solution created unacceptable backpressure on the manual pump using the largest opening 18-gauge needle. The 12% solution was discontinued from further use.

2.2. Stainless Steel Woven Wire Mesh

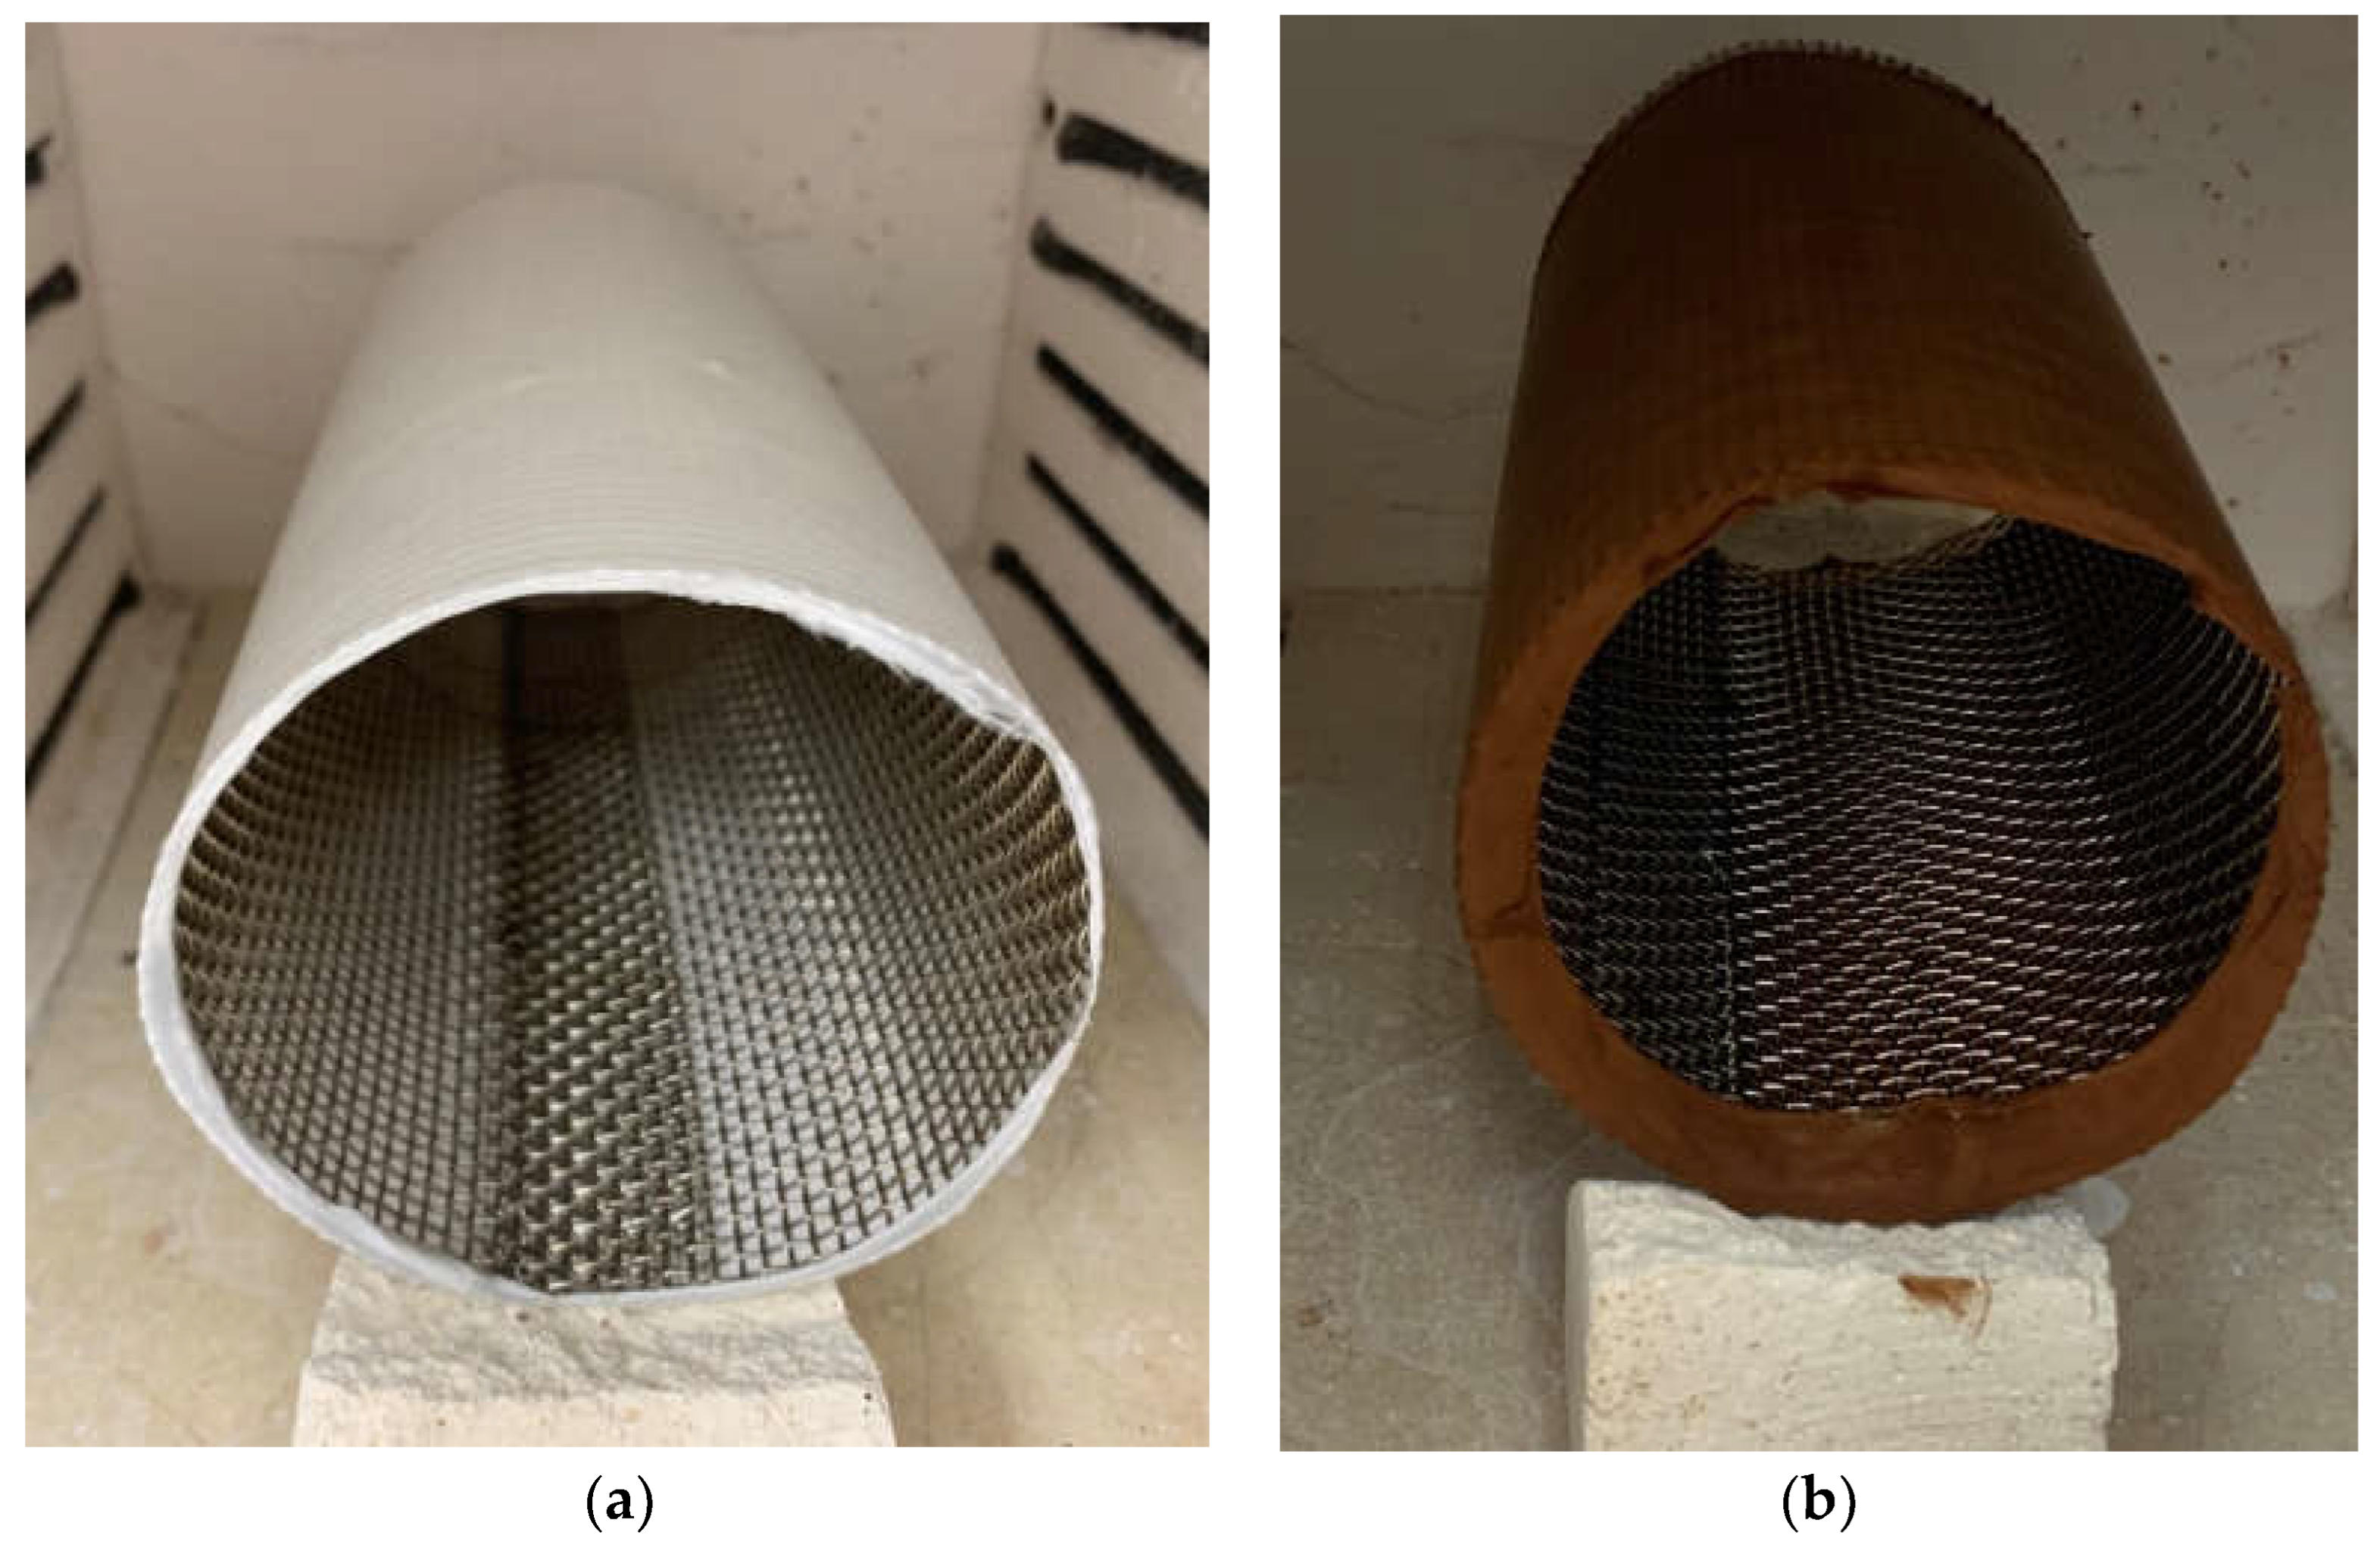
Type 304 stainless steel woven wire meshes were obtained from local sources with dimensions shown in Table 1. A 20-gauge mesh was used for a flat plate collector, while an 8-gauge mesh was used for a 939 mm diameter cylindrical roller collector. The stainless steel meshes were configured for flat plate and roller collection, as shown in Figure 2.

2.3. Electrospinning

The solutions were electrospun into polyacrylonitrile fibers on a model ESR200R2D electrospinner (NanoNC, Seoul, Republic of Korea). The electrospinner was first configured for vertical deposition onto the horizontal stainless steel flat plate, and then later configured for horizontal deposition onto the roller collector. For the flat plate setup, the 20-gauge stainless steel mesh was cut to 300 mm × 405 mm and fastened onto the collector plate using steel binder clips, as shown in Figure 2a. For the roller setup, the 8-gauge stainless steel mesh was cut to dimensions 295 mm × 152 mm and fastened into a cylinder with a 93.9 mm diameter, as shown in Figure 2b. Each polyacrylonitrile-DMF solution was placed into a 20 mL plastic syringe bottle with a 25 mm long stainless steel needle. The syringe bottle was loaded into the electrospinner, and the tip-to-collector distance was adjusted manually. The stainless steel needle was electrified to a designated potential, while the collector was grounded or set to a negative potential. The solutions were pumped through the syringe needle at a constant volumetric flow rate. The electrospinning configurations are shown in Figure 3.
Electrospinning involves the optimization of variables to obtain the desired results of fiber size and shape. Processing variables include electric field potential, the shape of the electric field, distance between needle and collector, direction from needle to collector, needle diameter, and pump flow rate. Optimum conditions for electrospinning result in the consistent, steady flow of polymer solution through the syringe needle with no droplet sputtering from the tip of the needle, no hardening of solution within the syringe or on the needle, and consistent uniform deposition of fiber mesh on the collector. Previous experimental studies in the literature have shown smaller diameter polyacrylonitrile fibers result from lower concentration solution mixtures at a higher voltage and greater tip-to-collector distance, while larger diameter polyacrylonitrile fibers result from higher concentration solution at a lower voltage and smaller tip-to-collector distance [27].
Optimum electrospinning conditions were achieved in this work by the continual adjustment of the electrospinning parameters. One adjustment was the needle diameter, for which three gauges were tried: 18-, 21-, and 23-gauge. If the needle diameter is too small, the pressure required to flow the solution through the needle causes the pump to fail. The 6% and 9% solutions flowed adequately through both the 21- and 23-gauge needles up to 2.0 mL/h without pump failure. The smaller needle diameter (23-gauge) resulted in fewer problems with solution drips from the needle tip and became the optimal choice for both solutions. A second parameter is the tip-to-collector distance, which was set at 15 cm. The tip-to-collector distance and needle diameter could not be adjusted during electrospinning. These parameters were set and maintained constant for each trial, which enabled optimization of the remaining parameters (pump flow rate and electric potential). The pump flow rate governed the flow of solution through the needle into the electrified solution bubble at the tip of the stainless steel needle. If the rate was too low, the bubble retracted into the needle as the solution jet repetitively stopped and started, which created droplet sputtering upon each restart. If the flow rate was too high, the solution bubble expanded and dripped from the needle tip. The optimal condition included the observation of a constant size solution bubble at the needle tip with steady flow through the needle equal to the steady flow from the bubble into the jet. Adjustment of the electric potential from needle to collector governed the flow rate of the solution from the bubble into the jet, which was optimized simultaneously with the pump flow rate. Pump flow rates were adjusted between 0.5 and 2.0 mL/h, while the electric potential was adjusted between 20 and 35 kV. The drum rotational speed was maintained at 180 RPM in order to avoid fiber alignment of the resulting nonwoven mesh. The optimal parameters for each trial are shown later in Table 2.
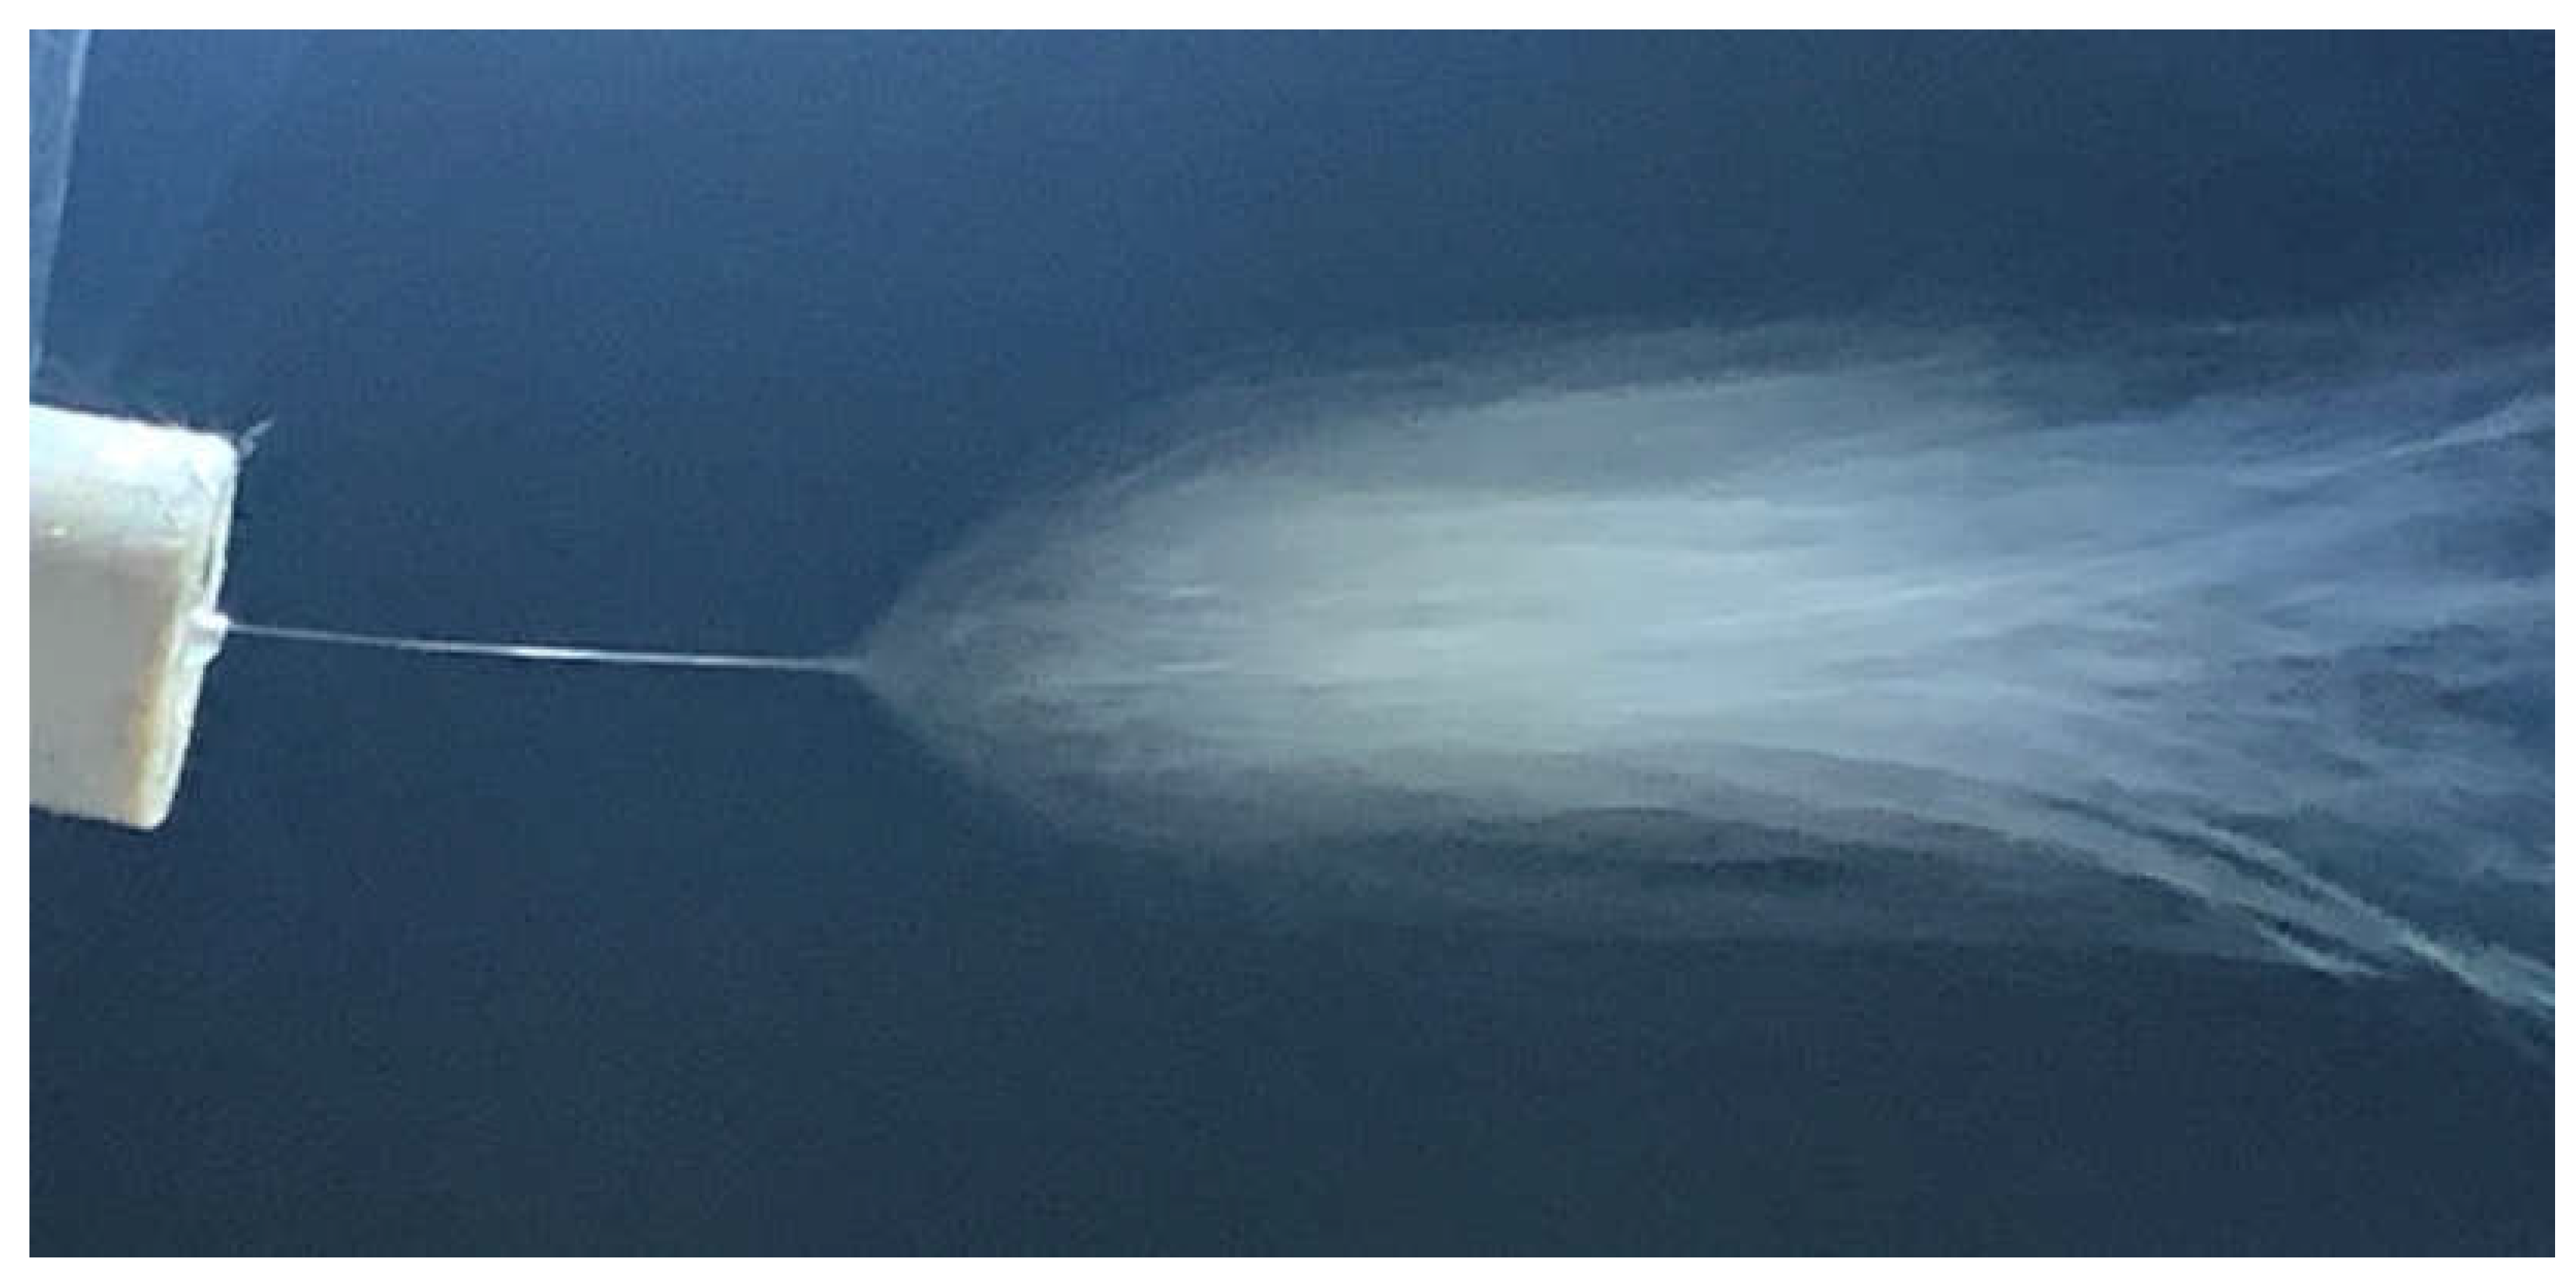
Adjustment of the electrospinning parameters resulted in stable polyacrylonitrile jets, as shown in Figure 4. The electrostatically charged solution was ejected from the stainless steel needle in a straight jet towards the collector. After approximately two centimeters, the jet destabilized and whipped, as seen in Figure 4. The solvent evaporates on the flight from the syringe needle to the collector, where the residual polyacrylonitrile fibers form nonwoven fibrous mesh.

2.4. Polyacrylonitrile Stabilization

Important process parameters for polyacrylonitrile fiber stabilization include the temperature, temperature ramp rate, and duration. Previous studies for polyacrylonitrile fiber stabilization informed the experimental setup [28,29,30]. A model ELF 11/23 chamber furnace (Carbolite, Hope Valley, UK) was used to stabilize the as-spun polyacrylonitrile fibers into stabilized polyacrylonitrile fibers. Stainless steel mesh with as-spun polyacrylonitrile fibers removed from the electrospinner were allowed to dry for 24 h prior to placement into the furnace. The furnace was programmed for heating to 270 °C, which was anticipated as the optimal stabilization temperature [29].
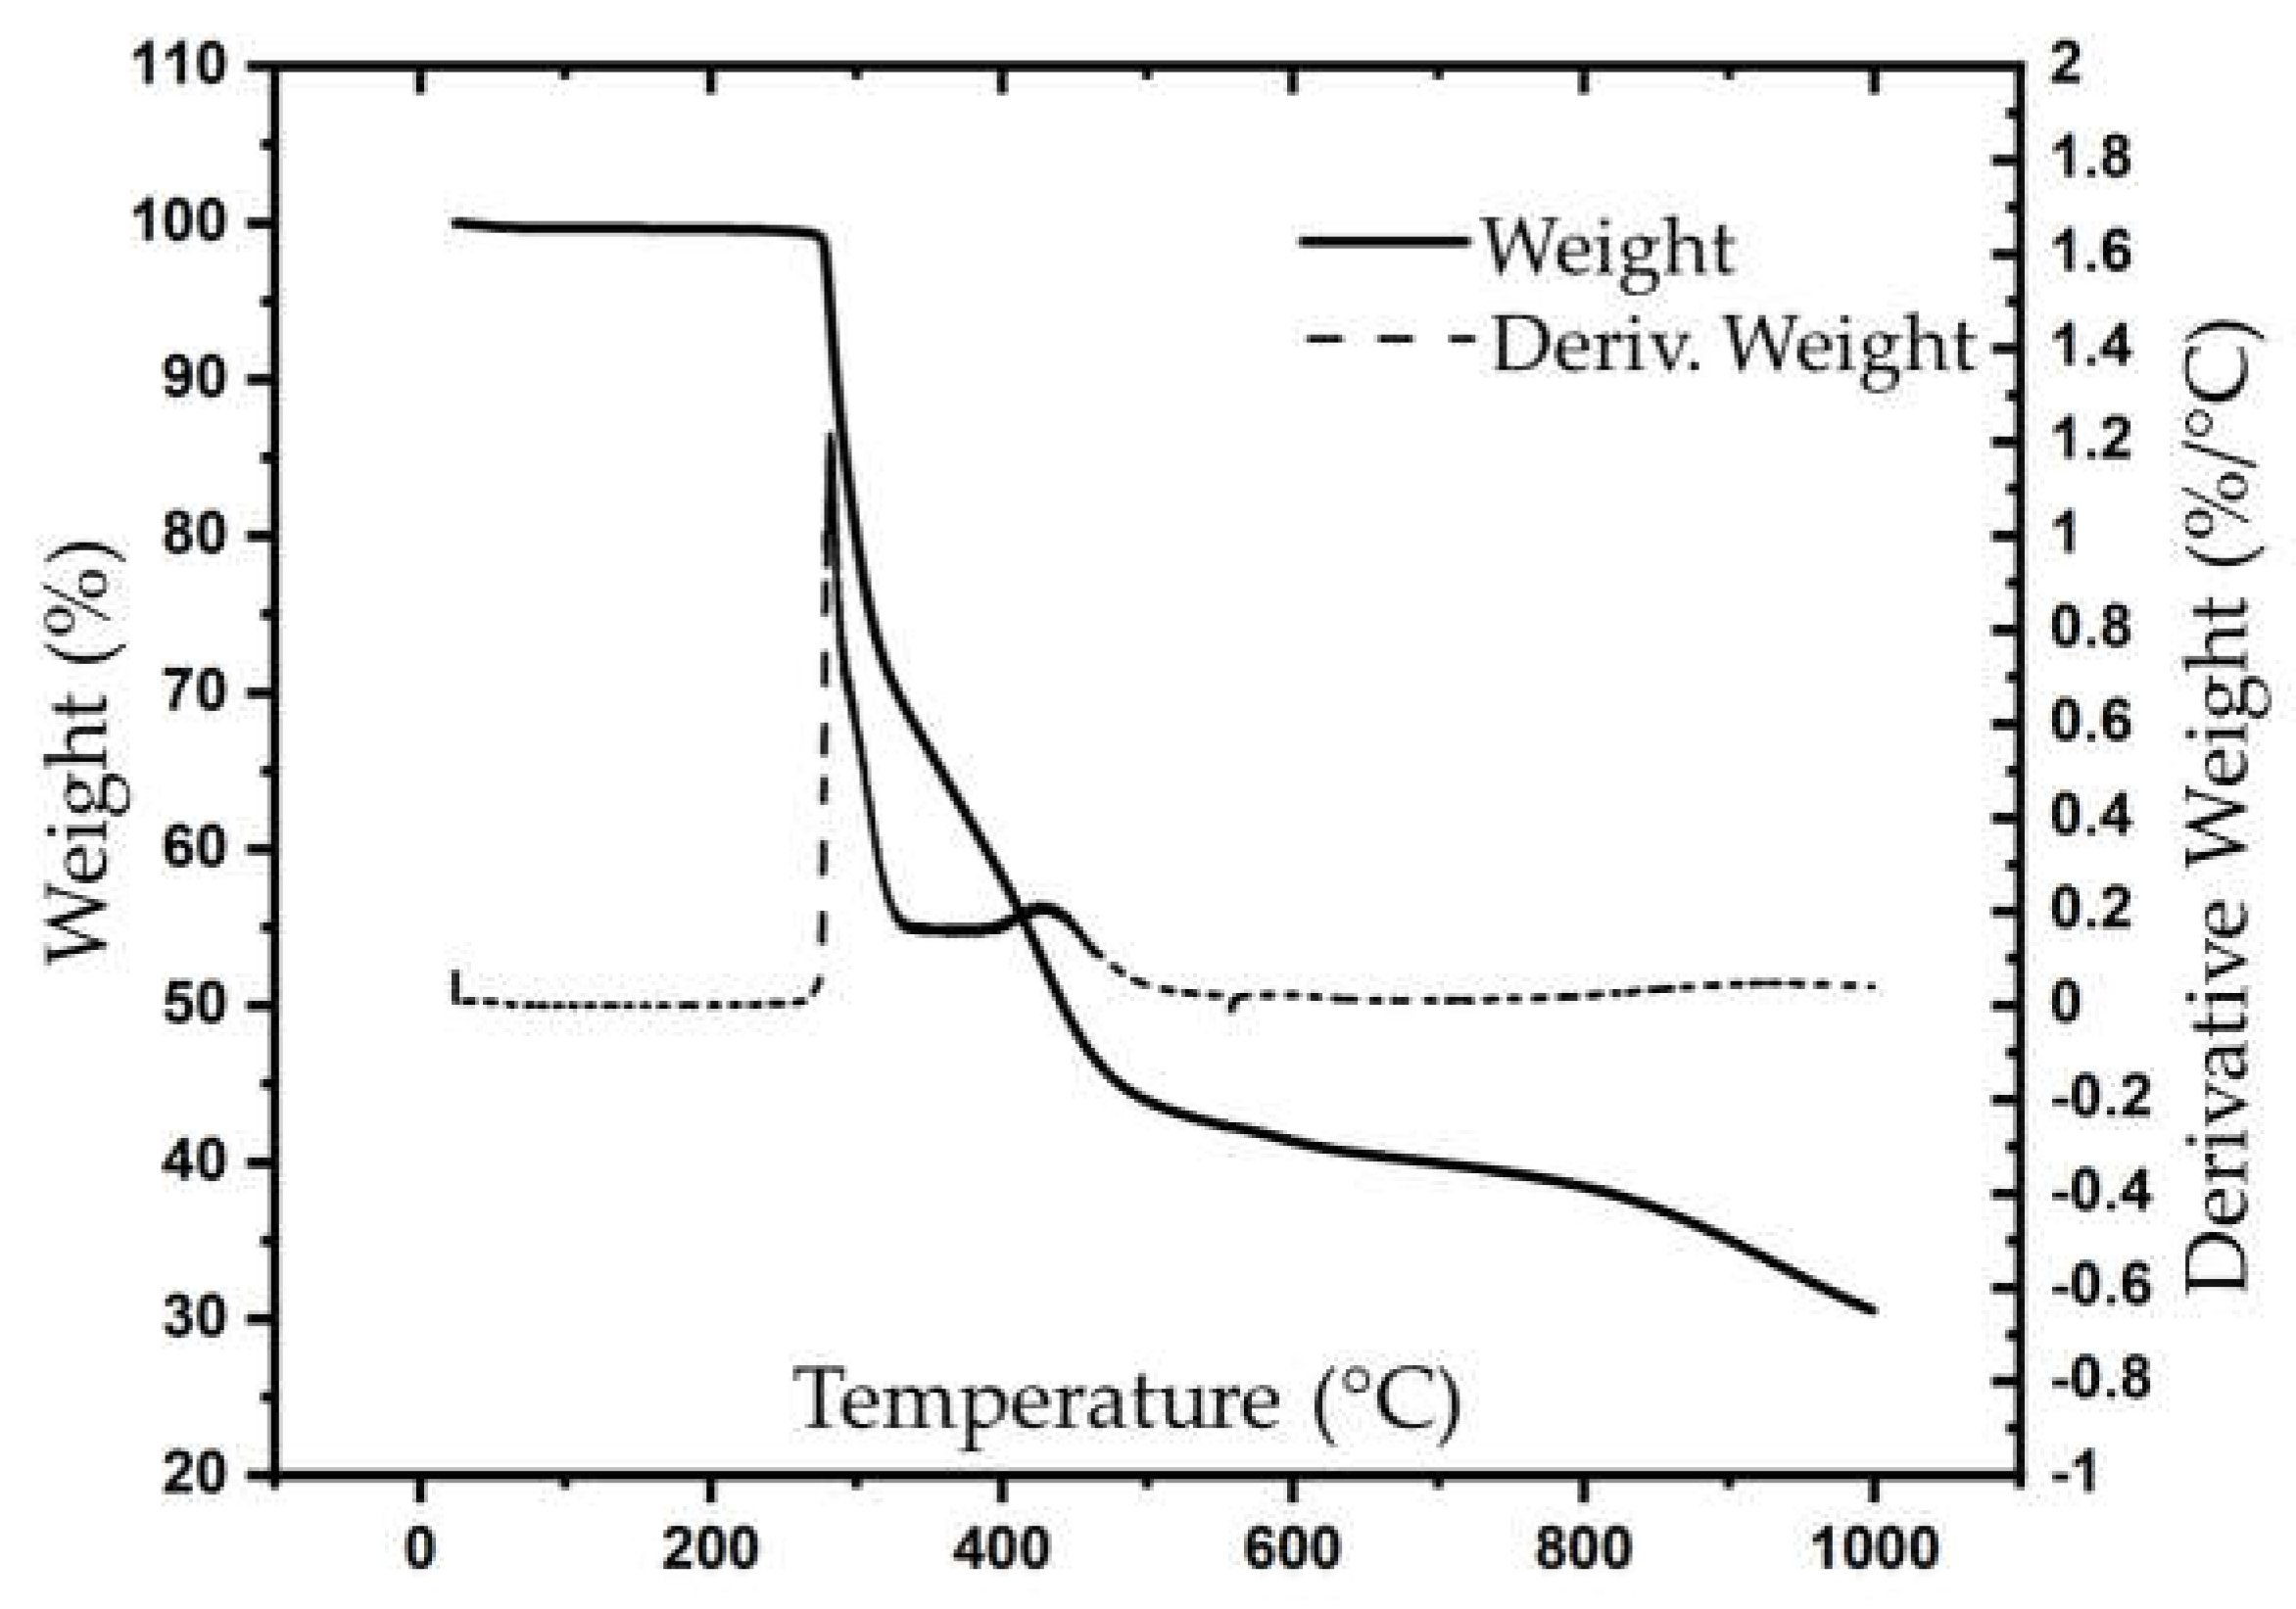
A thermogravimetric analysis was performed using a TA Instruments TGA 5500. The PAN sample was run at 10 °C/min to 1000 °C under nitrogen atmosphere. Onset degradation was observed at 278 °C and a secondary degradation event occurred at 426 °C. The overall weight change at 1000 °C was 69%. Figure 5 shows the TGA analysis.
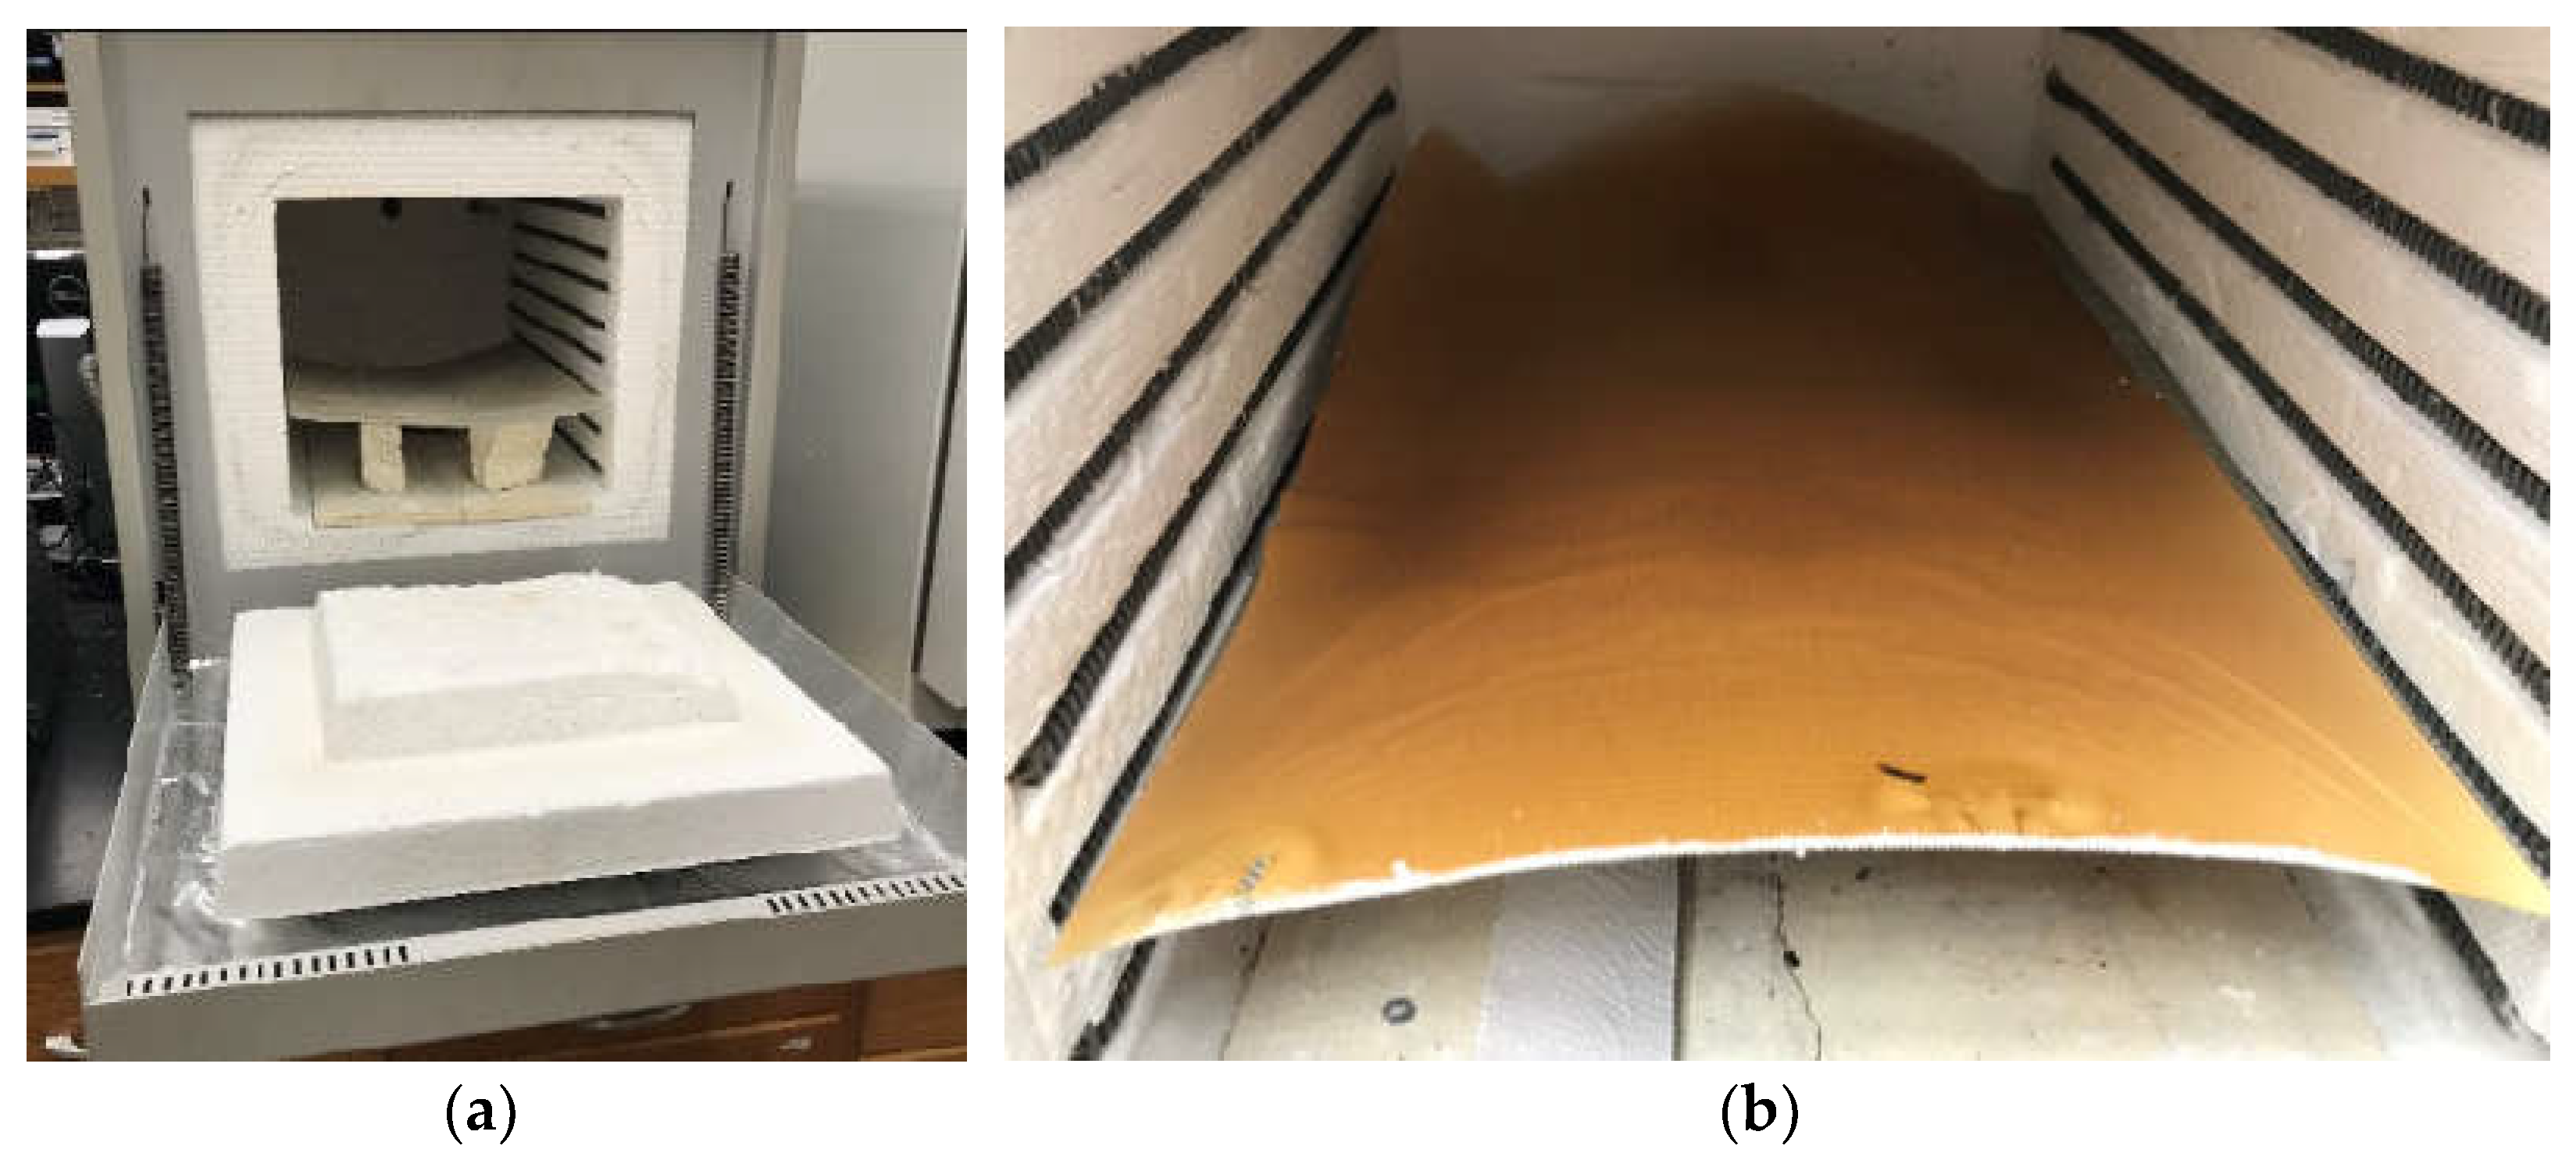
Initially, a heating ramp rate of 5 °C/min was programmed; however, tests at that rate showed shrinking and tearing of the nonwoven media. The heating rate was reduced for subsequent iterations to 1 °C/min for a more even heating rate to shrinkage problems. Other authors reported optimal heating ramp rates between 2 °C/min and 5 °C/min [28]. The stabilization is shown in Figure 6.

2.5. Polyacrylonitrile Nonwoven Media Characterization

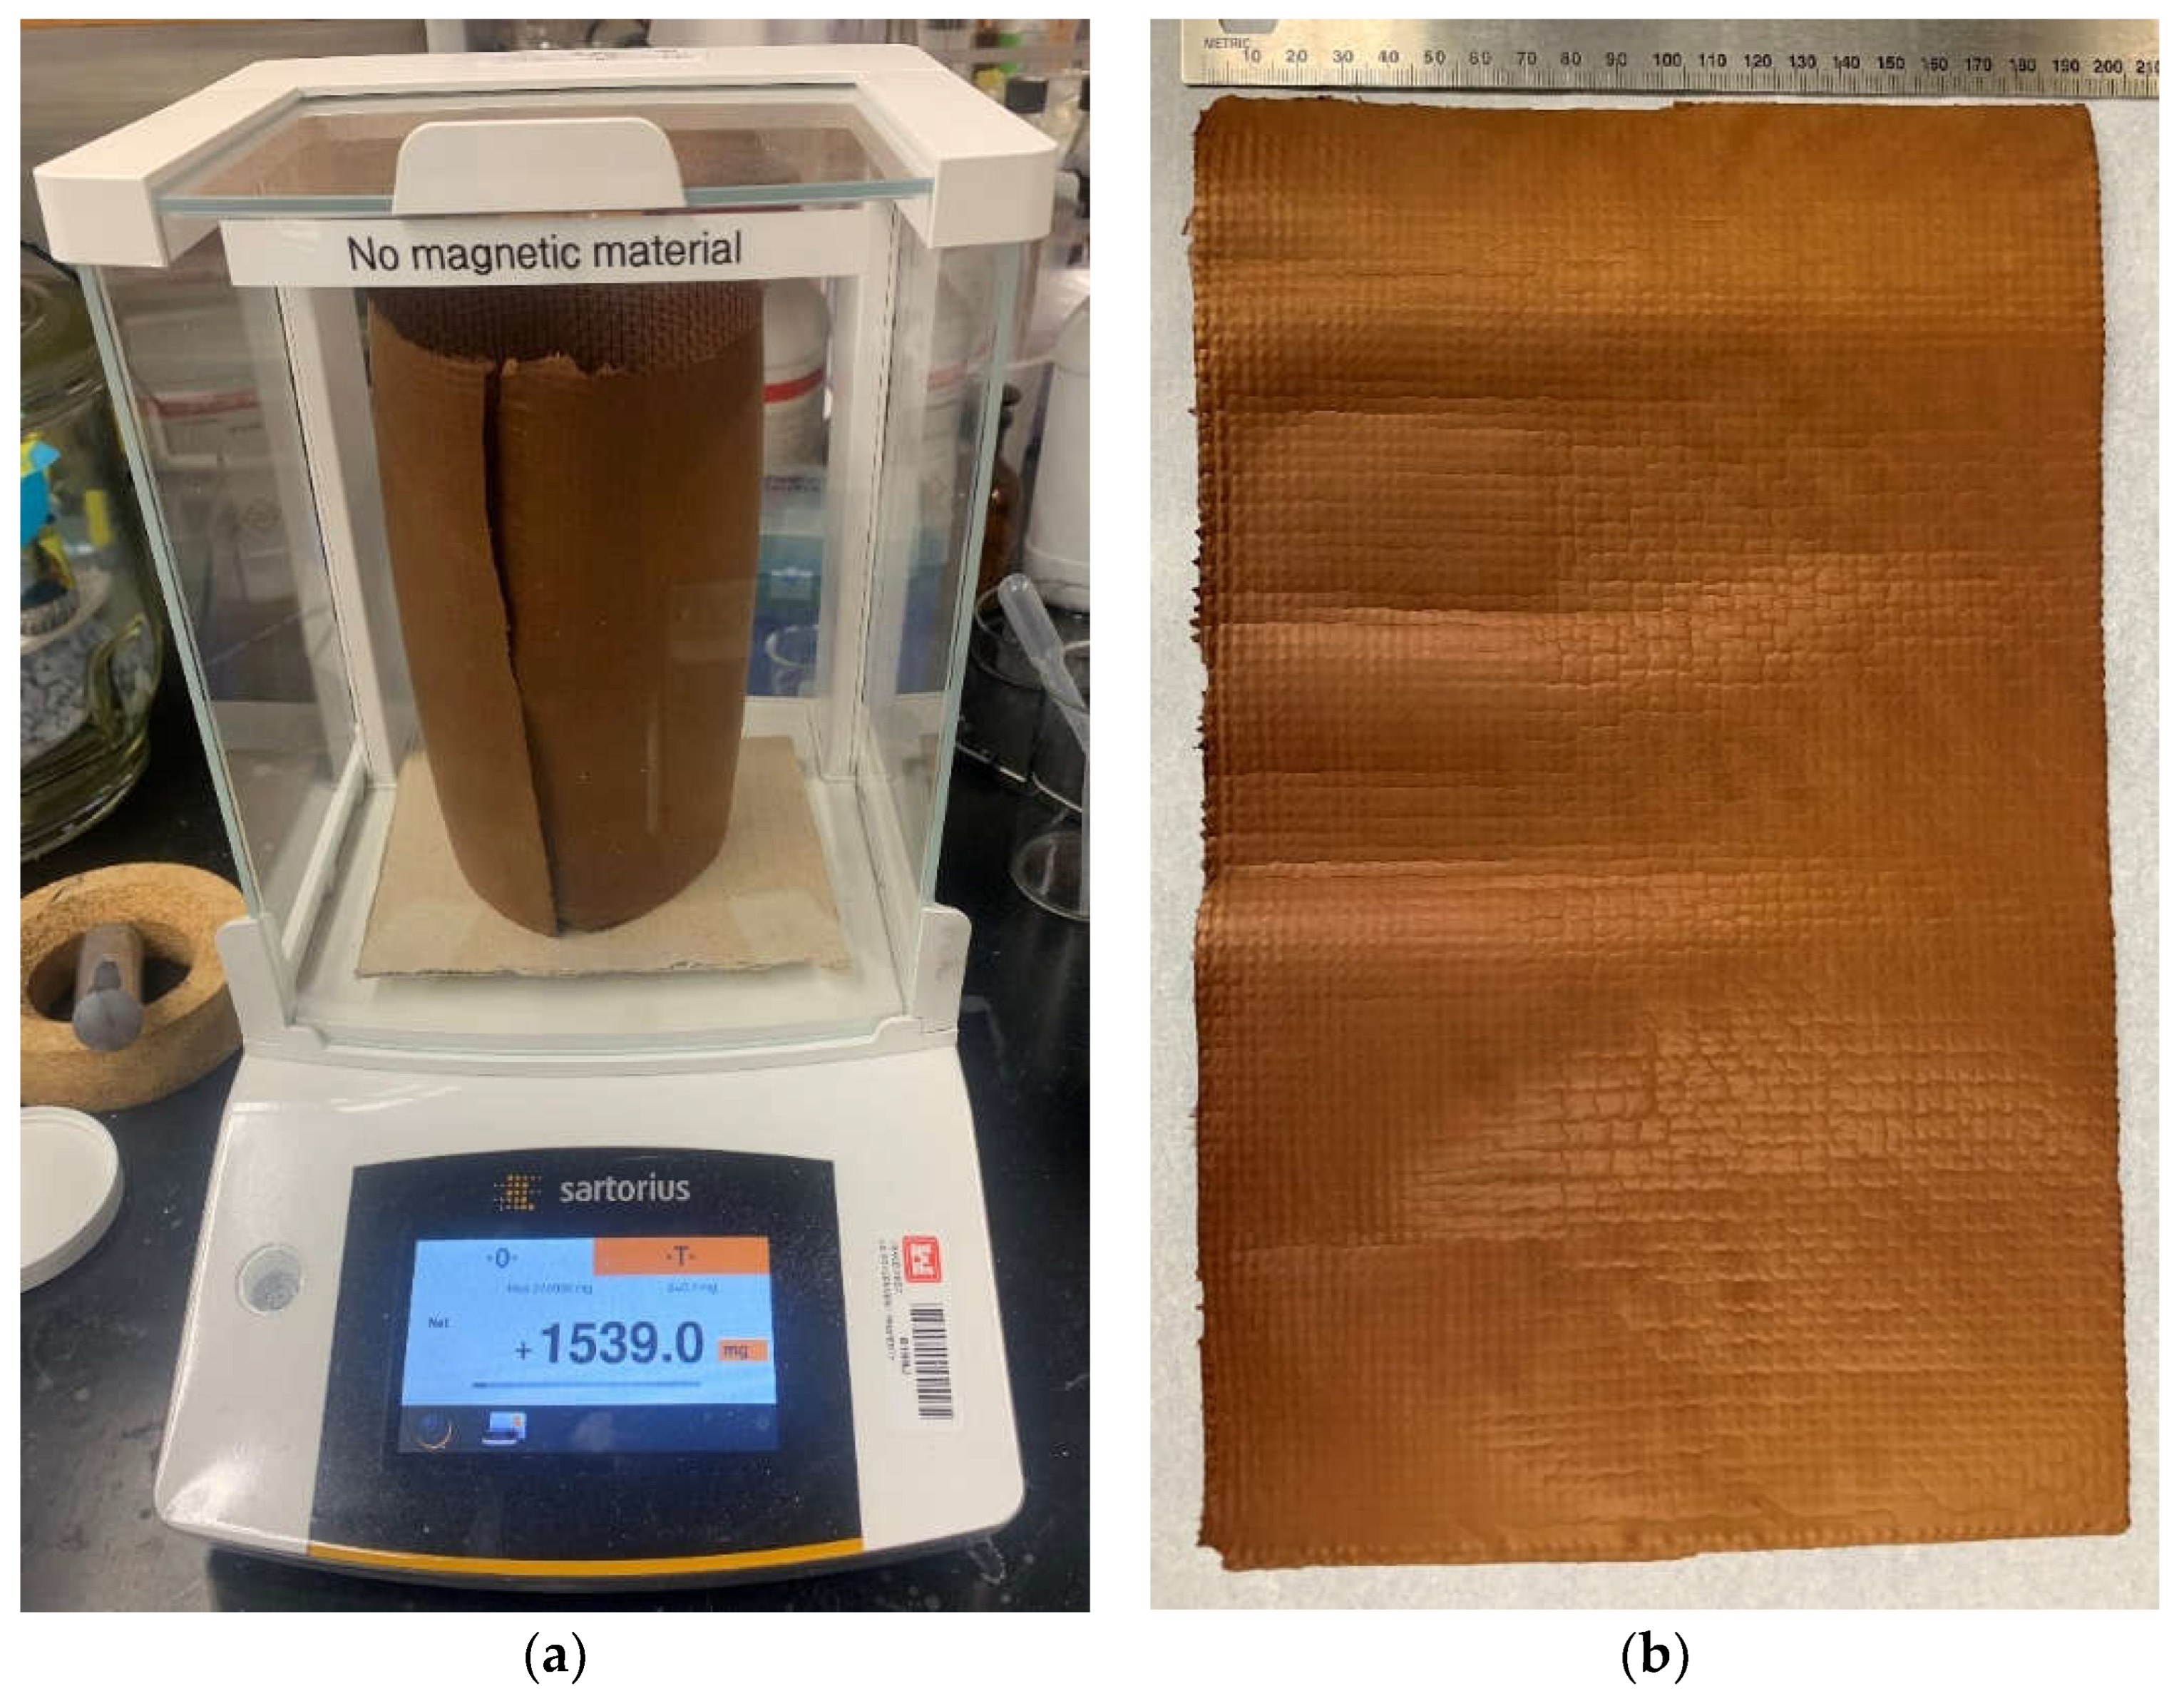
The stabilized polyacrylonitrile nonwoven media detached easily from the stainless steel wire mesh. The media was measured and weighed on a Sartorius digital scale, as shown in Figure 7. A summary of the solution, electrospinning, and stabilization parameters is provided in Table 2.

2.6. Air Filtration Testing

The air filter media were tested using a model 8130A automated filter tester (TSI Inc., Shoreview, MN, USA). Polyalphaolefin (PAO) was the challenge aerosol for testing, with estimated particle size distribution with a geometric mean diameter of 0.2 µm and geometric standard deviation of 1.6. The flat media filtration test area was a circular cross section with a diameter of 114.3 mm and an area of 102.6 cm2. The nominal volumetric flow rate was set to 32.0 L/min with standard room temperature, air pressure, and relative humidity, resulting in a projected face velocity of 5.20 cm/s through the filter media. Regarding the airflow resistance measurement, the stated accuracy of the filter tester was ±25 Pa [31]. Finally, although the accuracy of the efficiency measurements was not stated, it is reasonable to assume that the error is negligibly low, due to the two laser-based photometers used for this purpose. Laser-based light-scattering instruments are known to be highly accurate for particles above the nanometer range, and the photometer response has a linear correlation with the concentration of the calibrated particle type [32], leading to an accurate and repeatable measurement.

3. Results

3.1. As-Spun Nonwoven Fibrous Media

The 6% and 9% solutions of polyacrylonitrile electrospun easily and uniformly onto the stainless steel wire mesh grounded collector. The as-spun polyacrylonitrile fibers were white in color and covered the flat mesh and cylindrical mesh. The roller collector achieved a more uniform distribution of fibers than the flat mesh collector. Stabilizing the polyacrylonitrile media resulted in a dark brown shade, as shown in Figure 8, which compares the resulting polyacrylonitrile nonwoven as-spun and stabilized media.

3.2. Effects of Stabilization

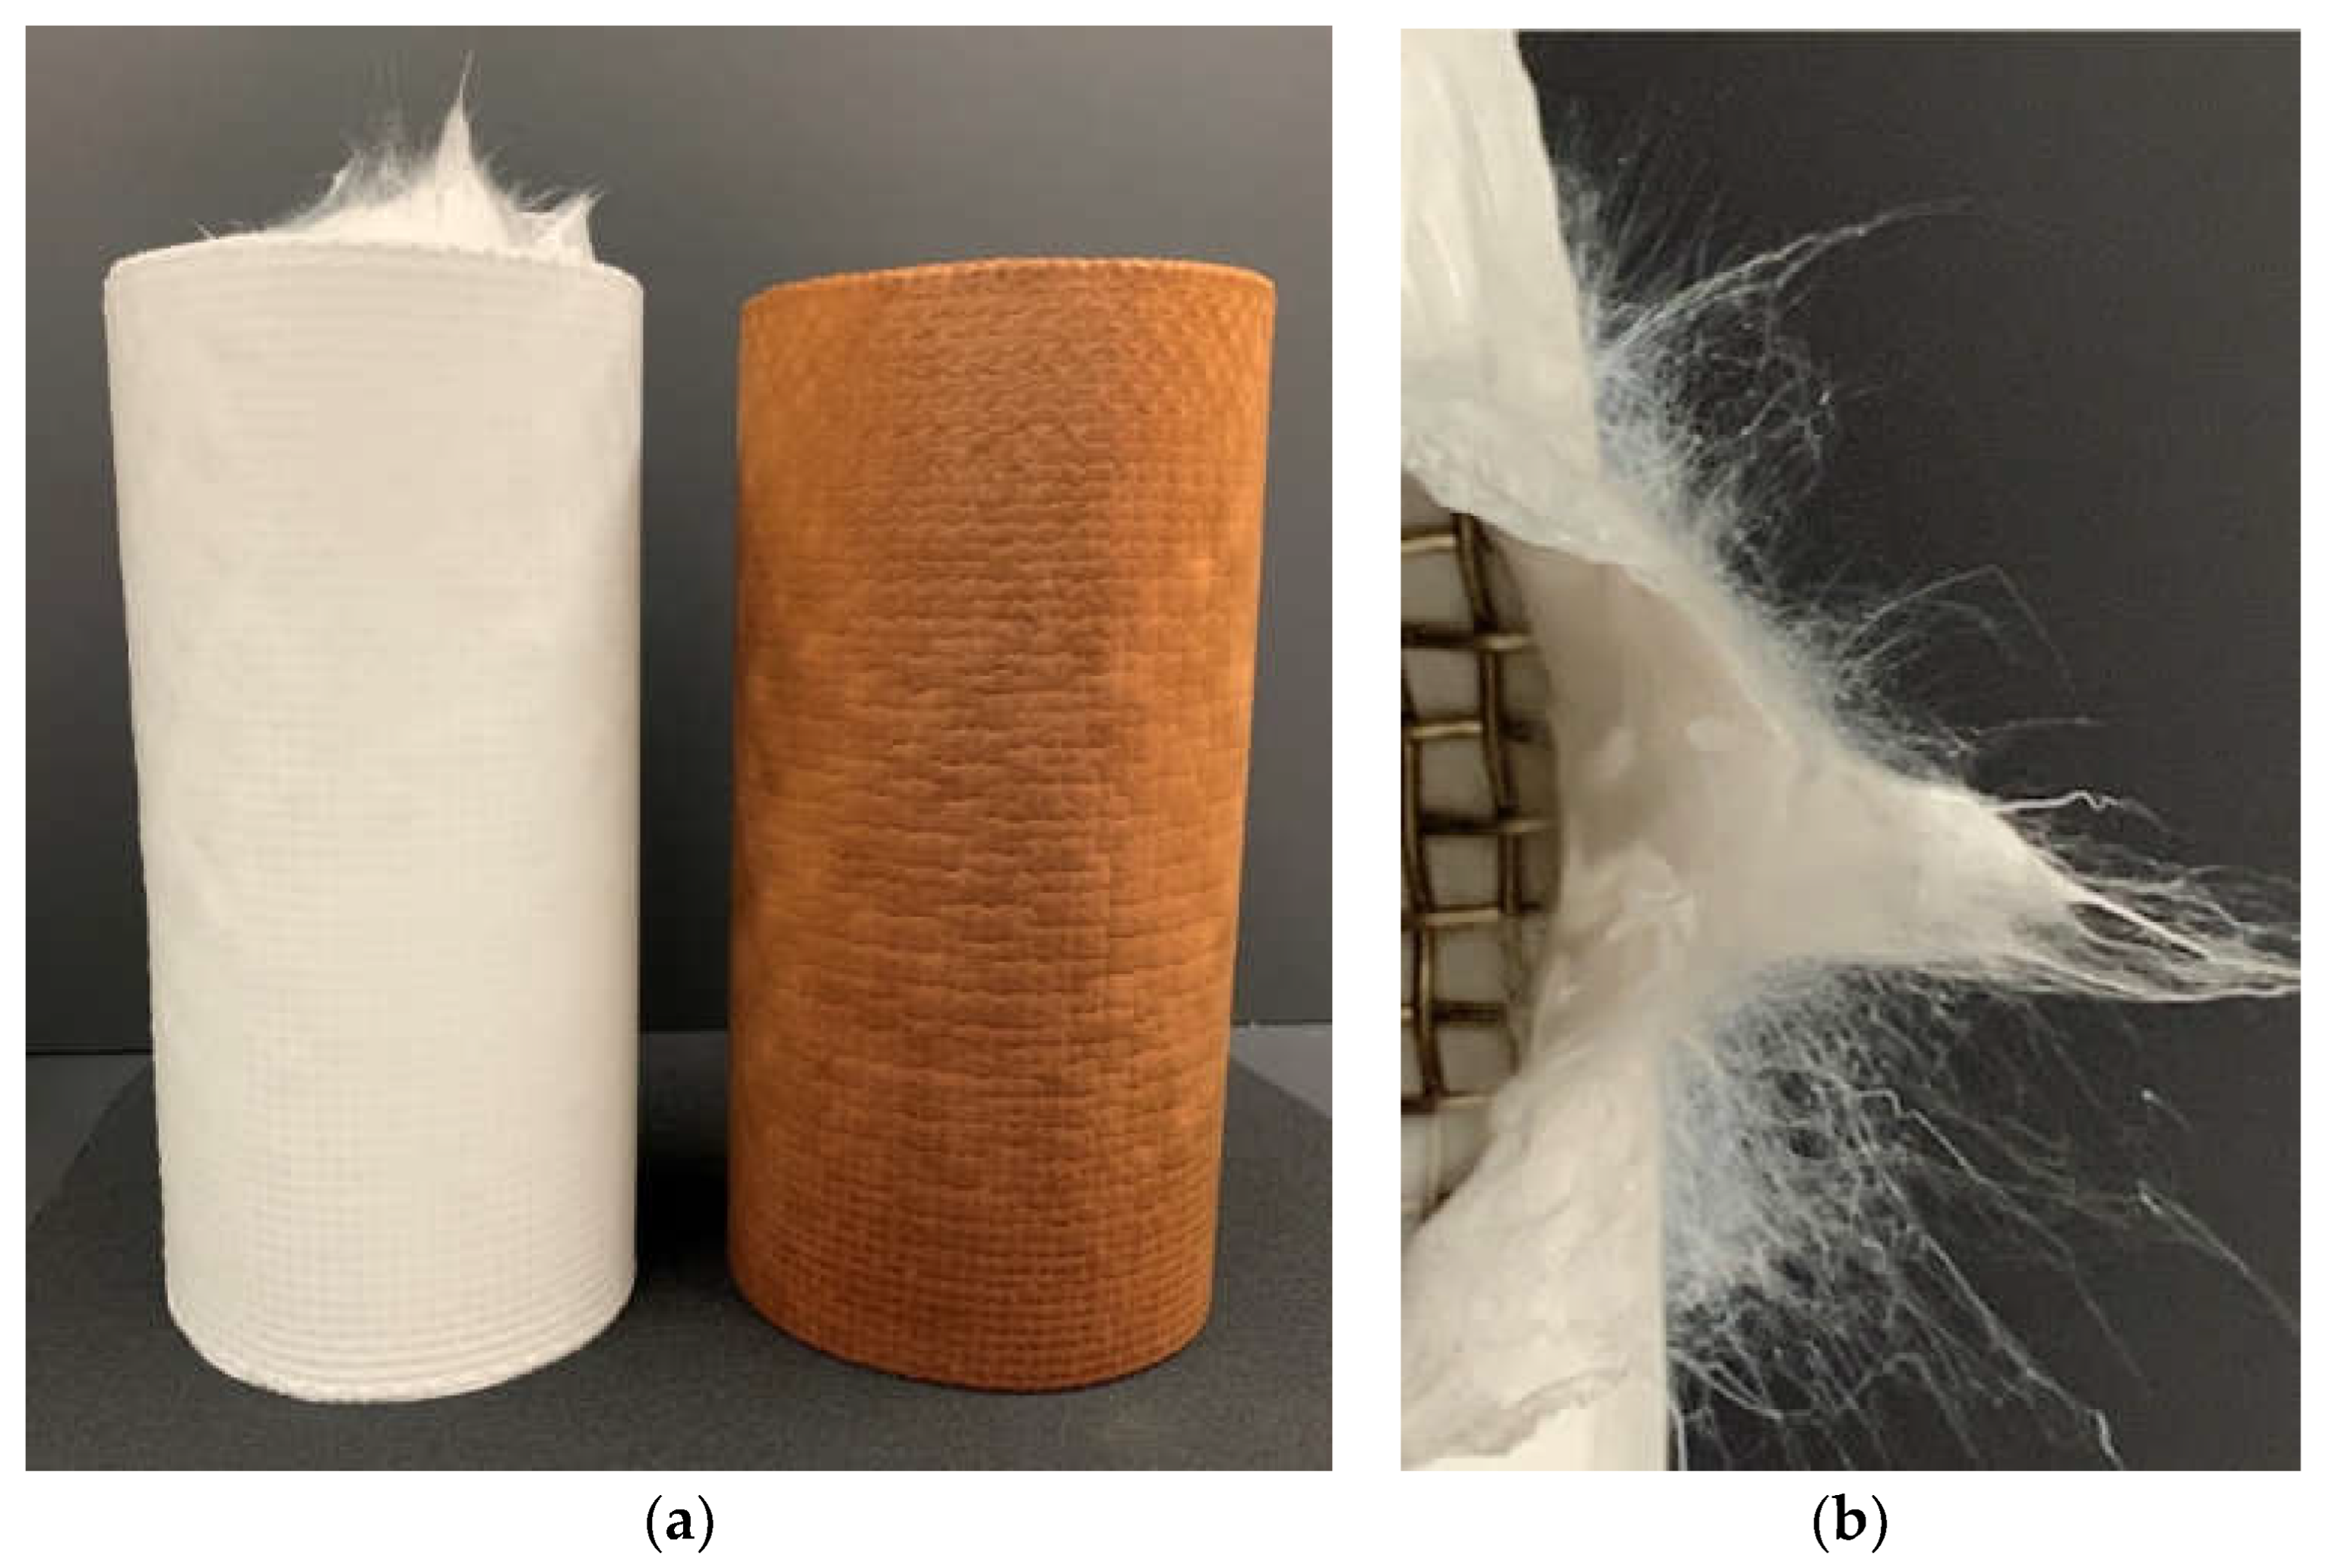
Prior to stabilization, the delicate nature of the white polyacrylonitrile fibrous media prevented removal from the stainless steel mesh without tearing and damaging. After stabilization, the media were easily detached from the stainless steel mesh, as shown above in Figure 7b. Figure 9 illustrates the physical characteristics of as-spun and stabilized polyacrylonitrile fibrous media.
The stabilizing temperature was set at 270 °C for all iterations; however, the temperature ramp rate and stabilization duration were adjustable parameters. If the nonwoven polyacrylonitrile media were not exposed to the stabilization temperature for a long enough duration, the color was lighter, as shown in Figure 10a. If the temperature ramp rate was set too high, the media tore from the effects of shrinkage, as shown in Figure 10b–d. The optimal temperature ramp rate was experimentally determined as 1.0 °C/min, while the stabilization duration was experimentally determined as 240 min after reaching 270 °C. The under-stabilized and torn media shown in Figure 10 were not tested.

3.3. SEM Imaging of Nonwoven Fibrous Media

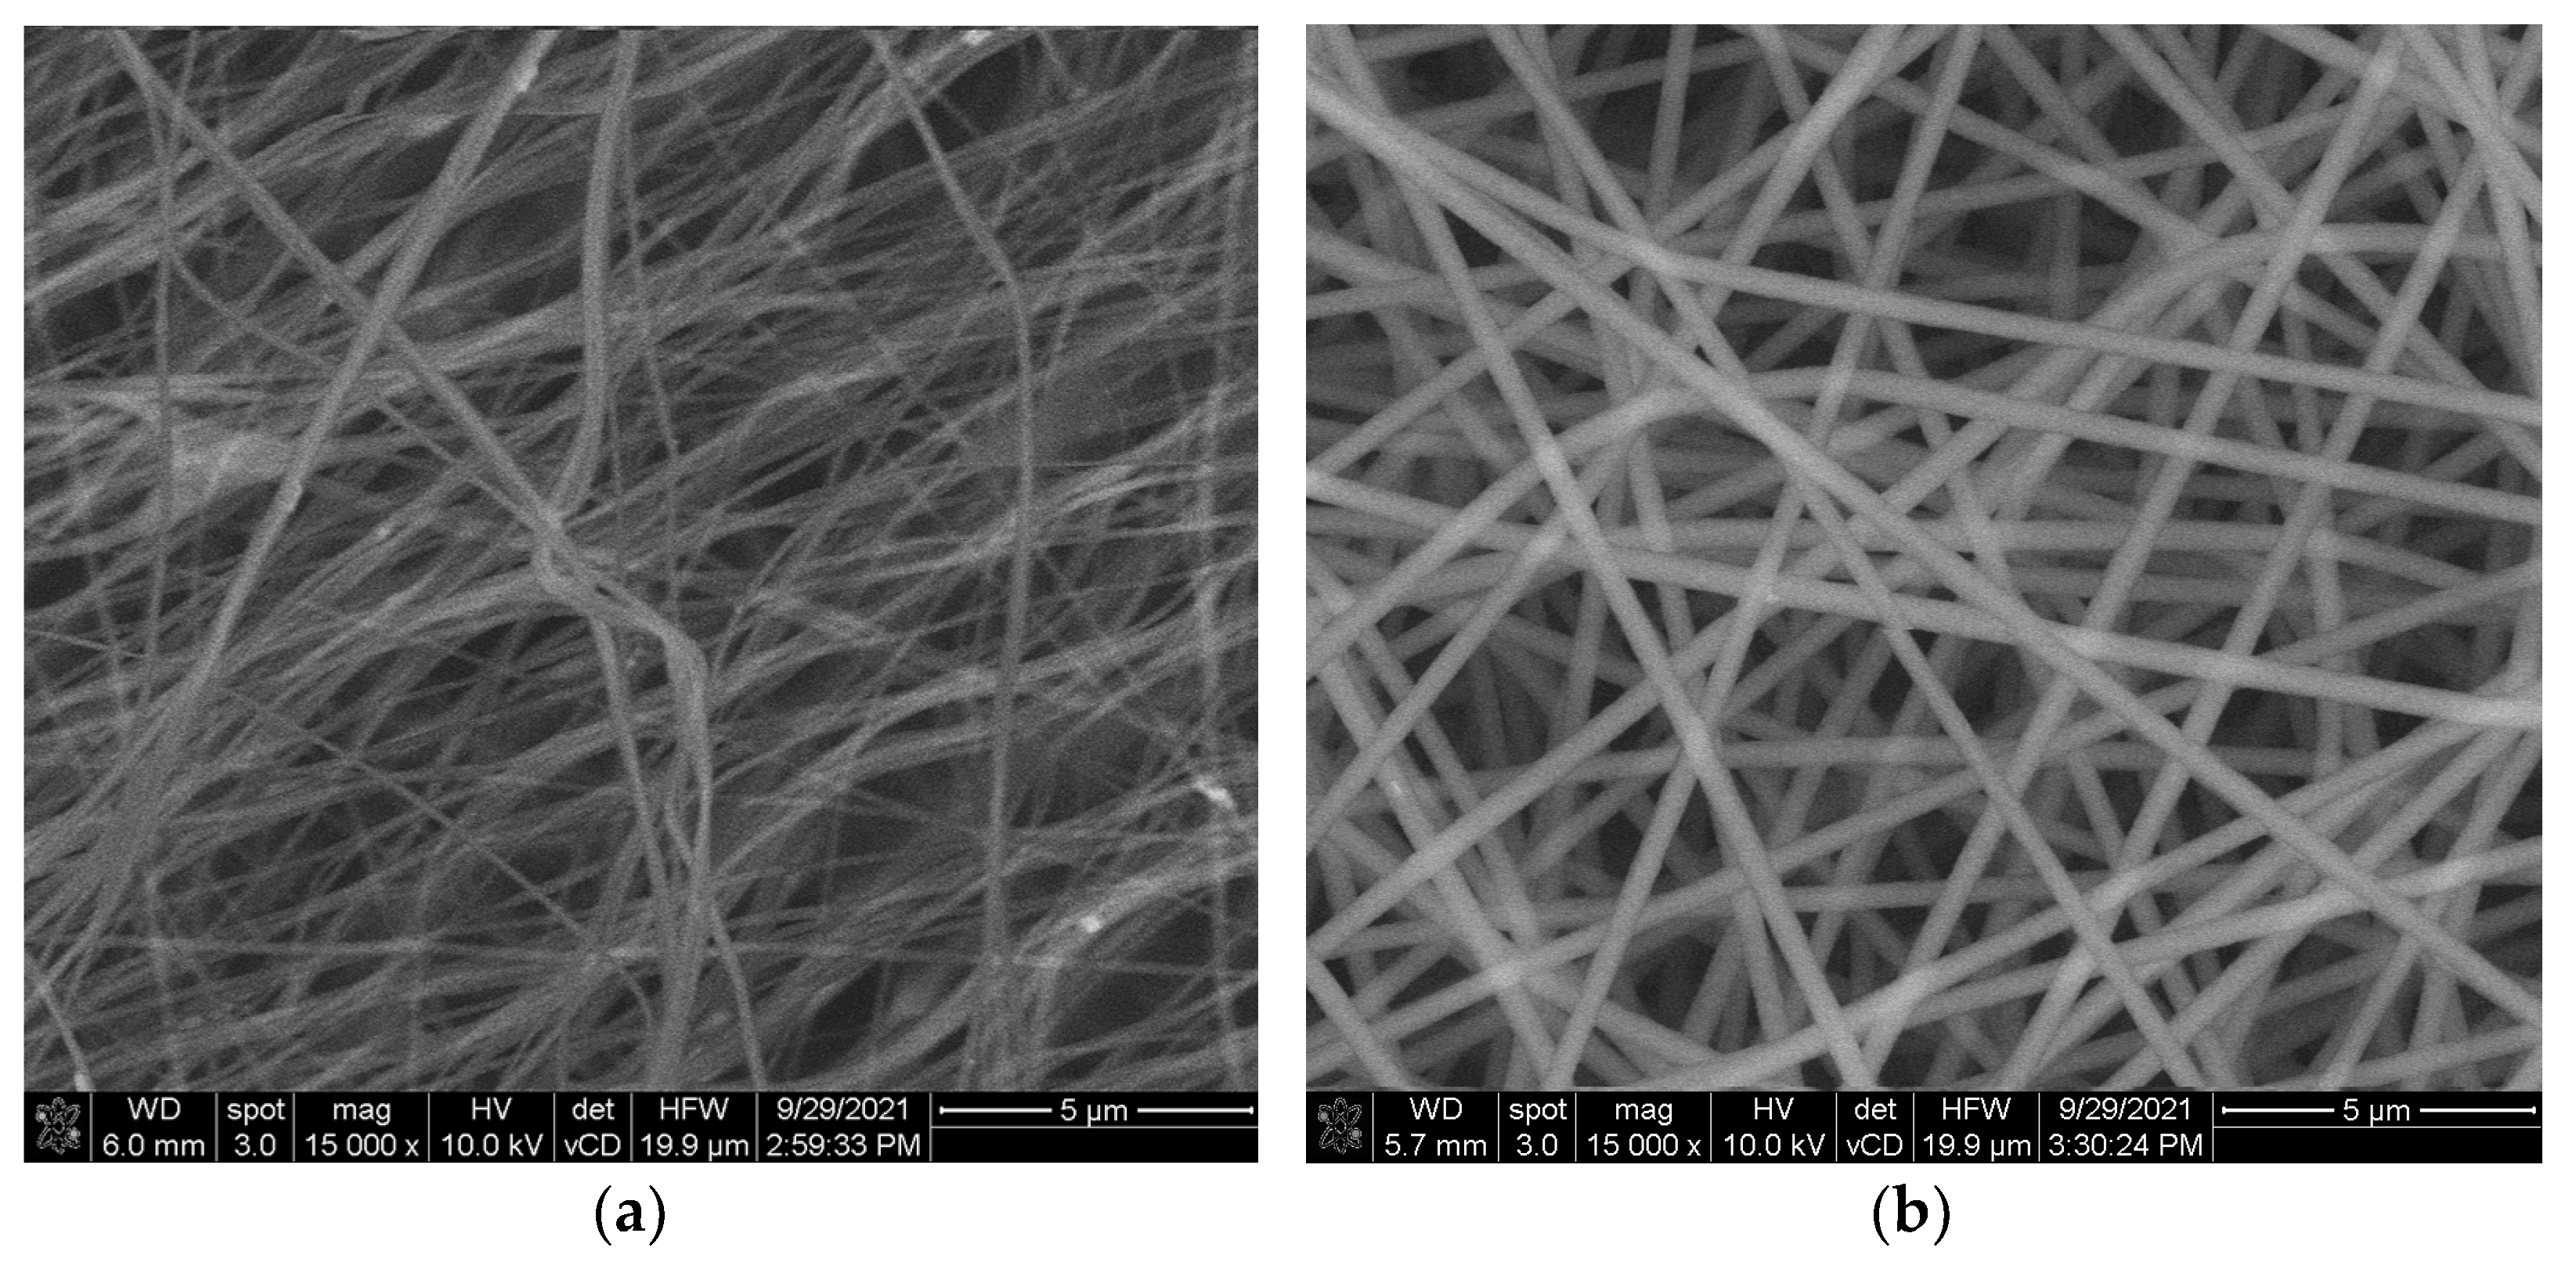
The resulting fibers were observed and photographed at 15,000× magnification with a model 6500 F Field Emission SEM (JEOL USA, Inc., Peabody, MA, USA). Figure 11 compares the results of the 6% solution and the 9% solution. As can be seen in the images, the 9% solution produced a more homogeneous spacing of individual fibers and more consistent fiber diameter sizes than the 6% solution. The notable bundling effect of fibers in the 6% solution results shown in Figure 11a creates inhomogeneity that is not present in the 9% solution results shown in Figure 11b.

3.4. Fiber Diameter Measurements

Fiber diameter sizes were measured from the SEM imagery using the ImageJ software [33,34]. Four SEM images were analyzed for the 6% and 9% filter media, each at 15,000× magnification. Each image was sampled for 100 fiber diameter measurements. The less viscous 6% polyacrylonitrile solution produced a nonwoven mesh with average fiber diameters of 216.1 nm. The more viscous 9% solution produced nonwoven mesh with average fiber diameters of 461.6 nm, more than twice the diameter of the 6% solution. As anticipated with all electrospinning process parameters constant, the higher concentration polyacrylonitrile solution produced larger diameter fibers than the lower concentration.

3.5. Air Filtration Testing

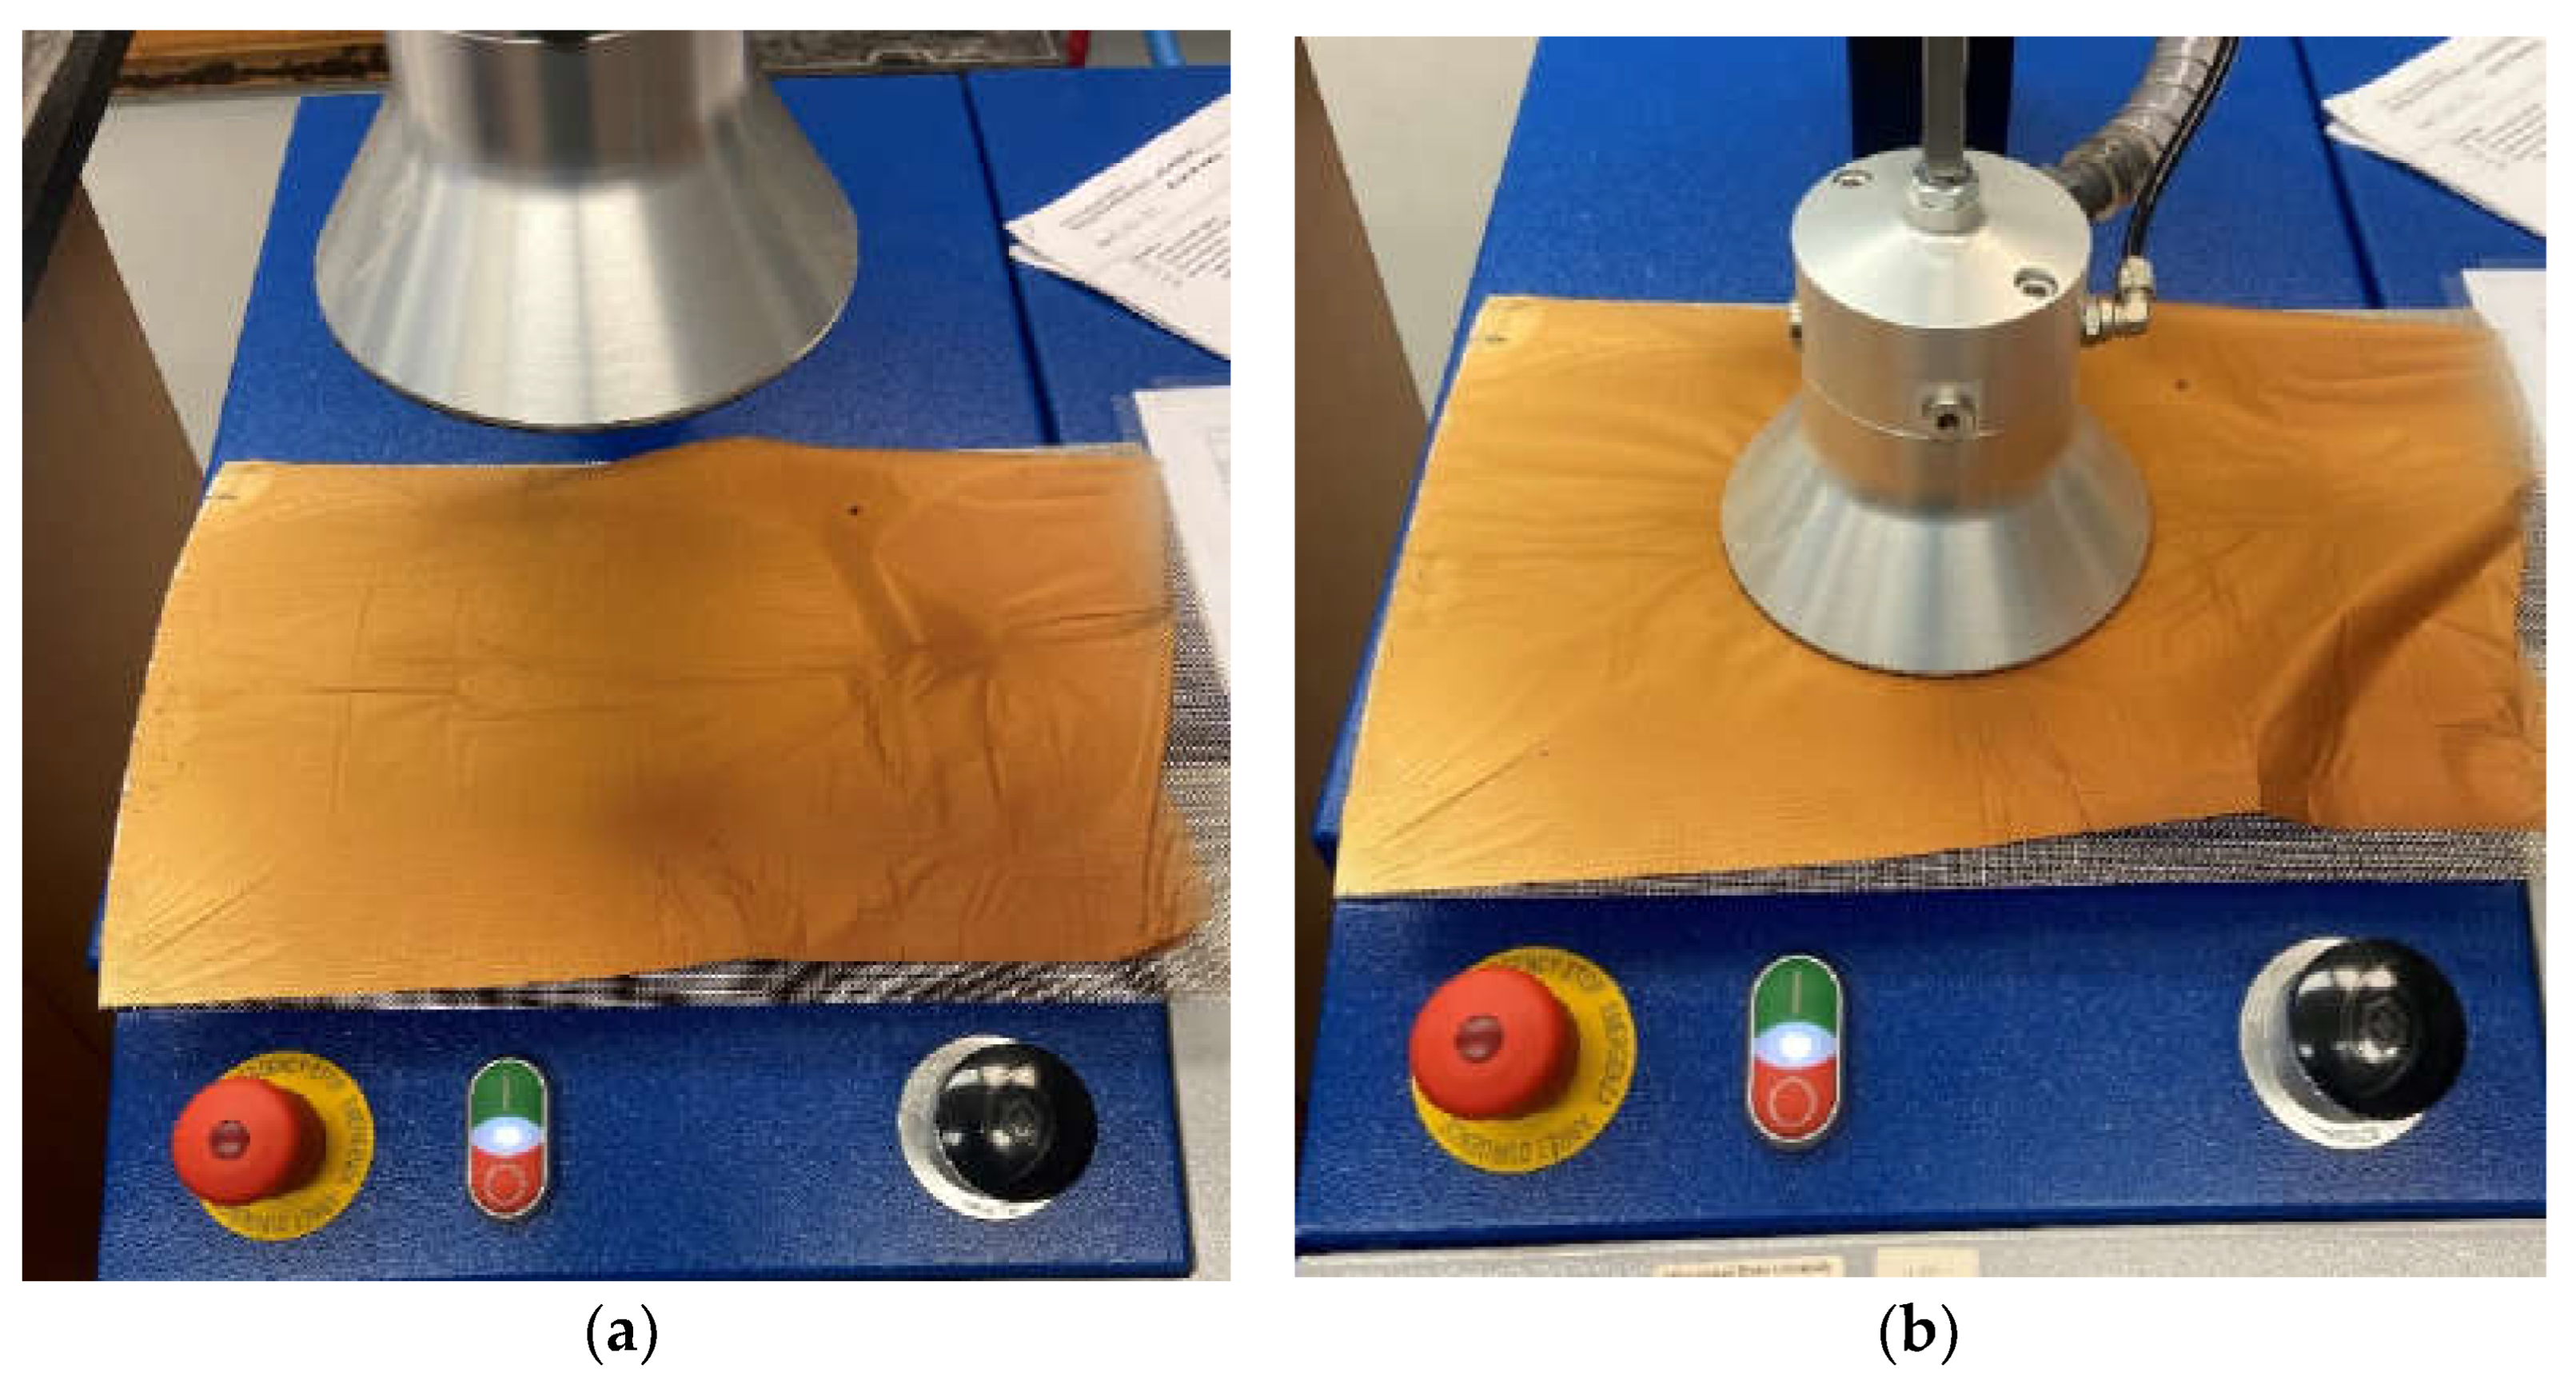
Each sample was subjected to five consecutive tests without removal from the testing machine, which required the test holder to open and close five times on each media sample. The stainless steel mesh served as a support structure for the media during the air filtration testing. The media loosely detached from the stainless steel mesh, which was on the downstream side of the airflow through the media. Due to the delicacy of the samples, the opening and closing of the test machine resulted in visible damage to the media, which affected the filtration performance. The machine clamps tightly onto the media and support mesh, which can cause tearing of the media from the supporting stainless steel mesh. In particular, the damage to the air filtration testing of trial #2 rendered the results unusable. Testing airflow channeling through damaged media shows very low flow resistance and very low filtration efficiency. Minimal media damage of trial #1 and trial #3 enabled the use of the data for 6% and 9% solutions, respectively. The data from trial #1 and trial #3 are subsequently represented in the air filtration efficiency and airflow resistance calculations that follow. Figure 12 shows the air filtration testing in progress.

3.5.1. Air Filtration Performance Standards

The ASME Code on Nuclear Air and Gas Treatment (AG-1) provides standards for which to evaluate air filtration efficiency and air pressure drop across the filter for nuclear grade HEPA filters [7]. The qualification standards include achieving a minimum of 99.97% air filtration efficiency of 0.3 µm particles, while sustaining a maximum airflow resistance of 320 Pa at a filtration velocity of 2.5 cm/s. While neither sample achieved AG-1 HEPA filter standards for minimum efficiency and maximum resistance at the experimental filtration velocity of 5.2 cm/s, the results indicate potential for achieving HEPA standards by improving the production parameters of the electrospun stabilized polyacrylonitrile.

3.5.2. Air Filtration Efficiency

The filtration testing for both filter media showed a trend of increasing penetration and decreasing filtration efficiency as the filter media became loaded with aerosol. This trend of increasing penetration through a constant flow rate is expected for liquid oil-based aerosol droplets and thin filter media [35]. The 6% polyacrylonitrile medium showed an initial efficiency of 99.8%, which decreased to around 98.0% as loading progressed. The 9% medium showed an initial filter efficiency of 97.8%, which decreased only slightly to 97.6% as the loading progressed. While both filter media achieved high filtration efficiency, neither achieved HEPA qualification standards of 99.97% filtration efficiency.

3.5.3. Airflow Resistance

The airflow resistance measurements across each filter indicated an increasing pressure drop across the media as the filters were loaded with aerosol. Before loading, the clean 6% polyacrylonitrile filter registered a flow resistance of 459.0 Pa. The pressure differential across the media increased to 512.9 Pa as the filter was loaded with liquid oil-based aerosol droplets. The clean 9% filter registered an airflow resistance of 154.0 Pa, which is significantly less resistance than the 6% media and within HEPA quality standards. The pressure differential across the 9% media increased slightly from 154.0 Pa to 157.9 Pa throughout aerosol loading. Table 3 shows the initial test results for the clean media.

4. Discussion

The results indicate strong potential for the creation of nonwoven fibrous air filtration media by electrospinning and stabilizing polyacrylonitrile. Polyacrylonitrile dissolved easily in DMF and produced solutions that were consistent, stable, and easy to electrospin. The mixed solutions, sealed in airtight containers, maintained consistent properties with no precipitation or hardening over extended duration. The fibrous coverage on the stainless steel wire mesh was uniform and consistent.

4.1. Effects of Fiber Diameter and Solidity on Air Filtration Efficiency

The air filtration efficiency for nonwoven fibrous media at low Reynolds number laminar flow can be calculated analytically using the single fiber efficiency (SFE) model, which is well covered in the literature [36,37,38,39]. The total filter efficiency E F can be calculated as shown in Equation (1), where α is the solidity or solid volume fraction of fibers in the filter, t is the filter thickness, E Σ is the single fiber efficiency, and d f is the mean fiber diameter [40].
E F = 1 exp ( 4 α E Σ t π d f )
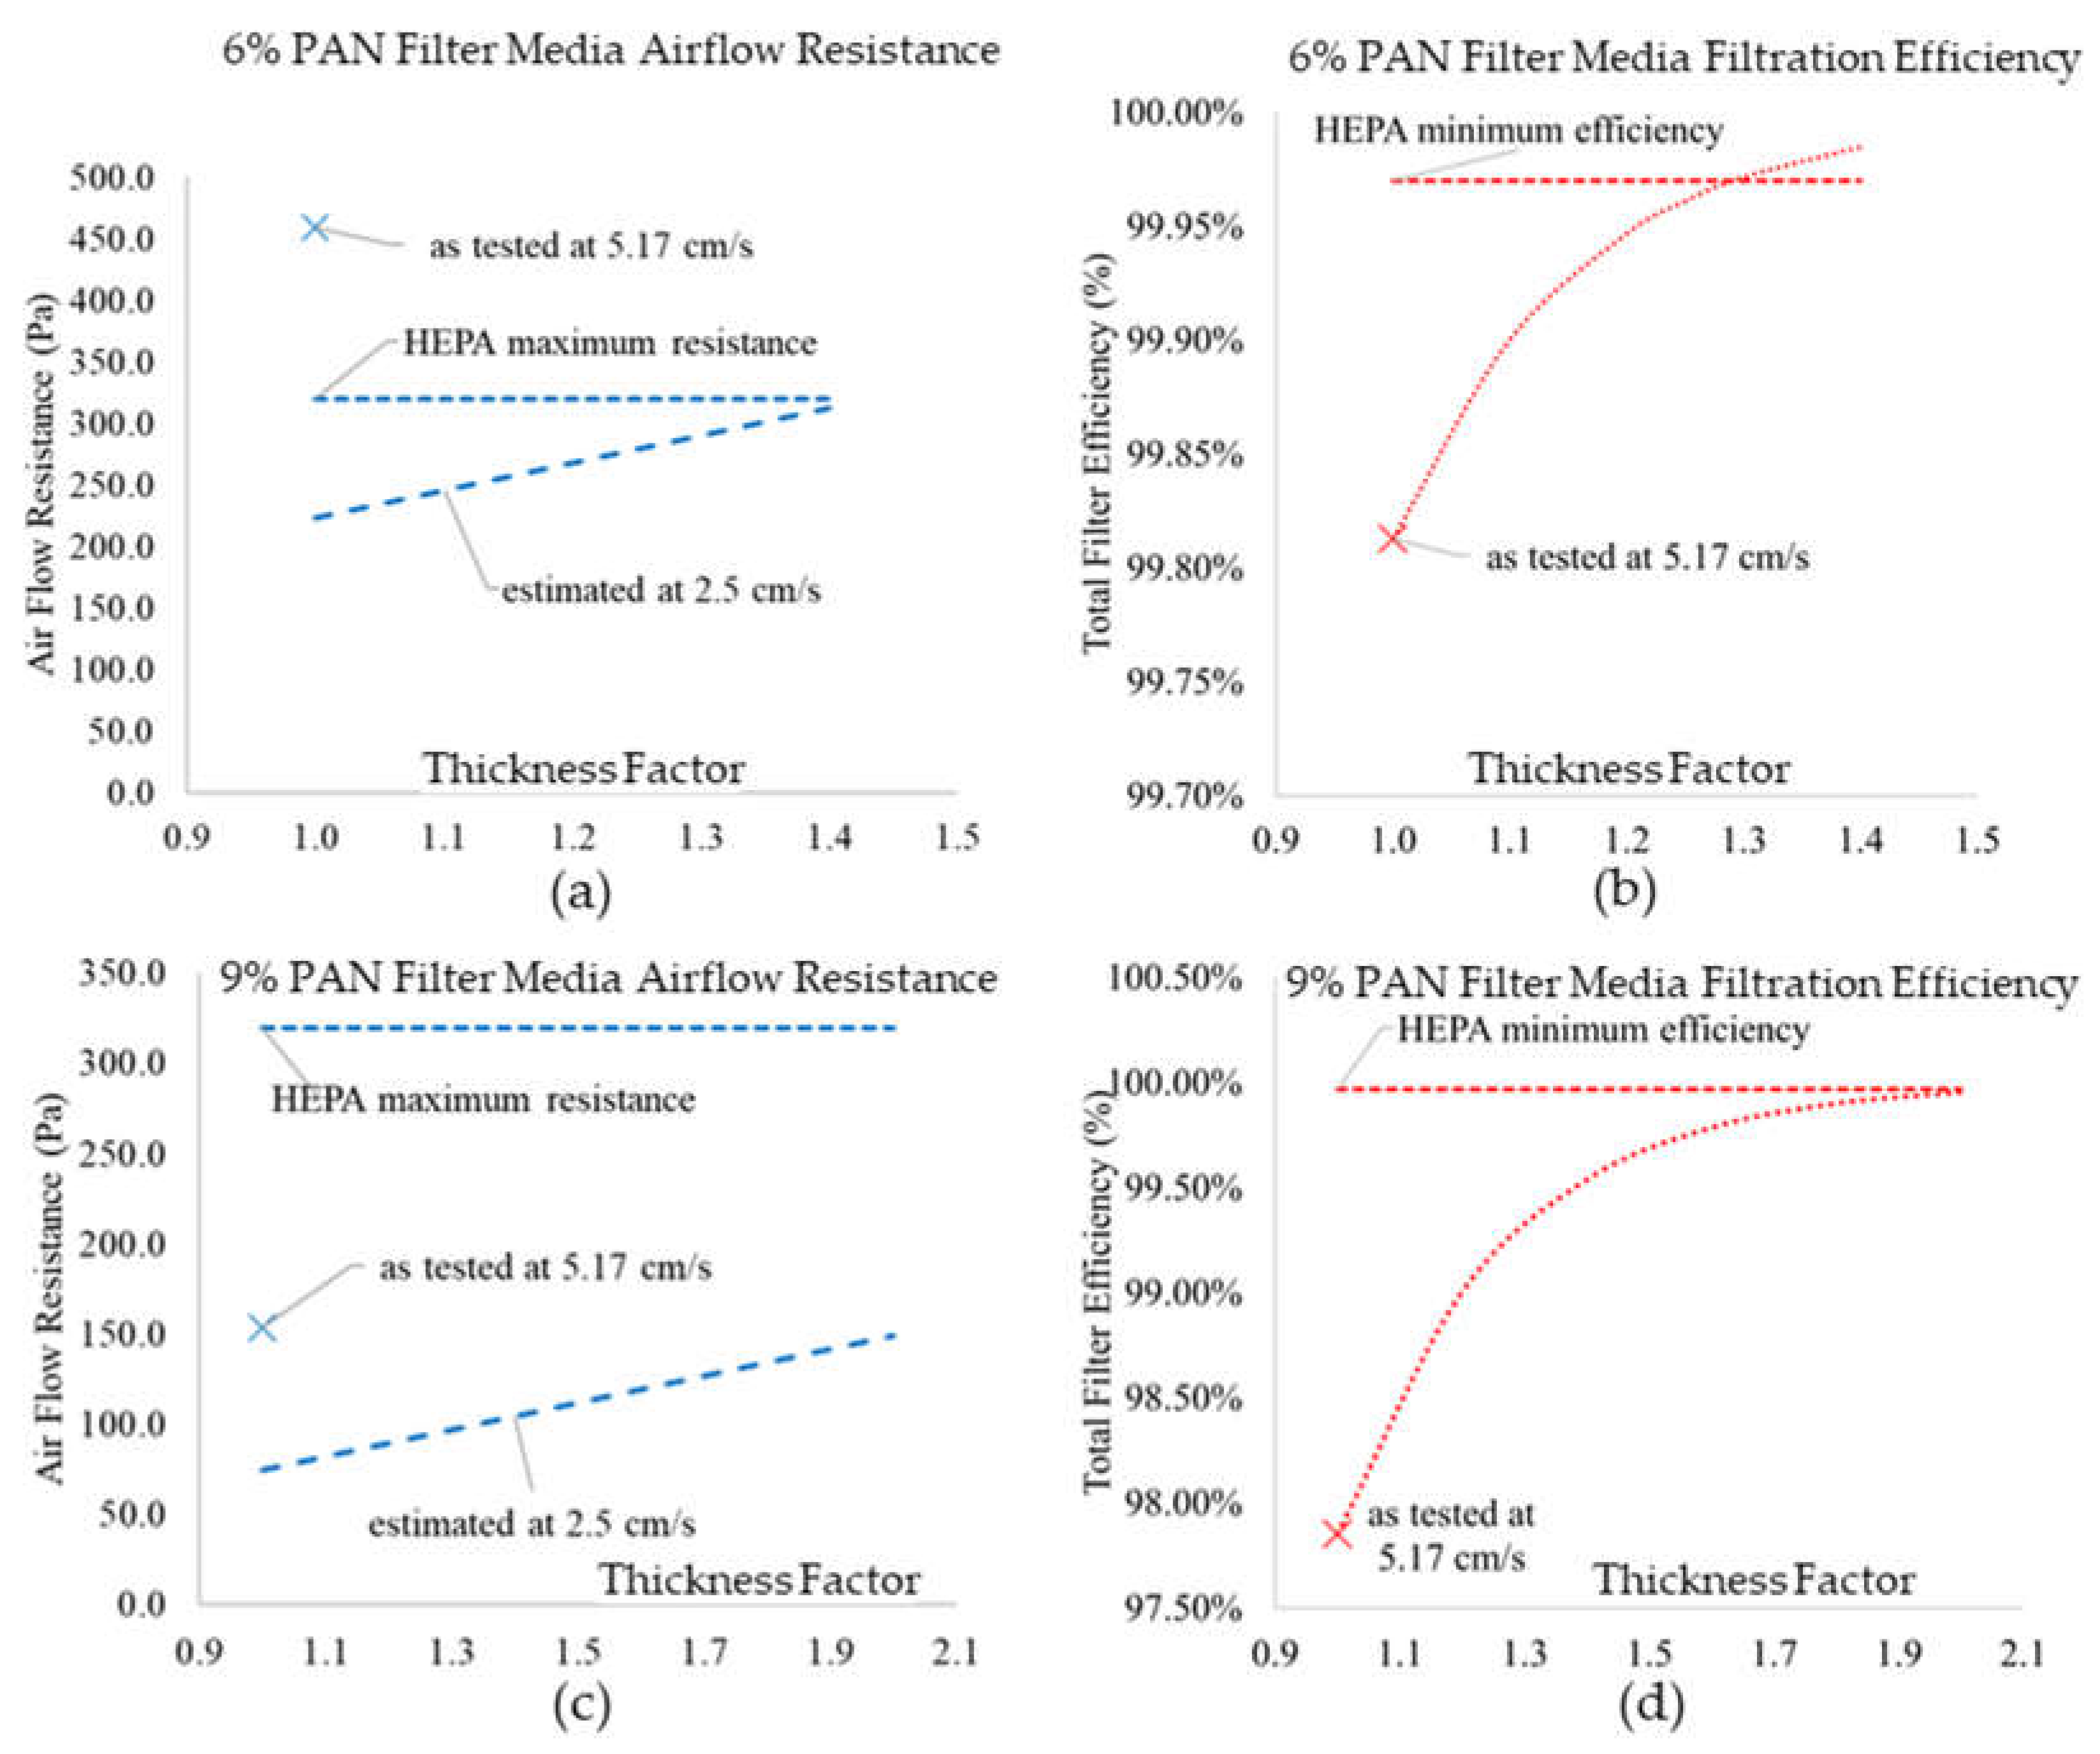
From this equation, increasing the filter thickness, increasing the filter solidity, and decreasing the fiber diameter size will increase the total filter efficiency. If the filter solidity remains constant, filters with finer diameter fibers will have a greater surface area throughout the medium, which increases the total filter efficiency. The effect of fiber diameter sizes can be seen in the results shown in Figure 13. The 6% filter medium with 216.1 nm diameter fibers resulted in a higher filtration efficiency than the 9% solution filter, with fibers more than twice the diameter size at 461.6 nm.
While the filter solidity is difficult to measure, it is reasonable to believe from observation of the 6% polyacrylonitrile filter medium shown in Figure 10a that it has more densely packed fibers and greater solidity than the 9% polyacrylonitrile medium in Figure 10b. A simple explanation for the higher total filter efficiency of the 6% filter media is that the smaller diameter fibers and higher filter solidity created more surface area throughout the media, which enhanced the collection efficiency of diffusion and interception. This explanation implicitly assumes equal thickness of the filter media, although a difference in media thickness could also be responsible for the difference in the capture efficiency.

4.2. Effects of Fiber Diameter on Airflow Resistance

The airflow resistance across filter media, as measured by the pressure differential on the upstream and downstream sides of the filter, can be analytically calculated using a relationship developed by C. N. Davies similar to Darcy’s Law for fluid flow in a porous medium [41]. Davies developed an empirical correlation for the pressure drop across air filter media as a function of the filter solidity α . Equation (2) provides an analytical calculation for airflow resistance Δ P using the filter solidity α , the filter thickness t , the average fiber diameter d f , the airflow velocity U 0 , and air viscosity η [40].
Δ P = η t U 0 d f 2 [ 64 α 1.5 ( 1 + 56 α 3 ) ]  
Equation (2) shows that an increase in airflow resistance is directly proportional to an increase in the filter thickness, air viscosity, and airflow velocity; inversely proportional to the square of the mean fiber diameter size; and proportional to a function of the filter solidity. Air filters with smaller diameter fibers and greater solidity have higher airflow resistance than filters with larger diameters and less solidity. This effect of fiber diameter sizes and solidity can be seen in the results shown in Figure 13, given the differences between the two media. It is reasonable to conclude from a visual inspection of the respective SEM media images in Figure 10 that the greater solidity resulting from densely packed fibers in the 6% medium is influential in the much greater airflow resistance than the less densely packed fibers of the 9% filter medium.

4.3. Estimated Change in Filtration Efficiency for Thicker Media and Slower Air Velocity

When considering the media and the process used to create it, the possibility exists that the characteristics of the media and testing conditions may be altered to achieve the efficiency qualification standard. Considering the analytical relationship between media thickness and filtration efficiency shown in Equation (1), it may be inferred that the filtration efficiency would increase with thicker filter media. Considering a hypothetical clean media 1.4 times thicker than the 6% media, the estimated total filter efficiency improves from 99.81% to 99.98%. Similarly, considering a hypothetical clean media double the thickness of the 9% media, the total filter efficiency improves from 97.85% to 99.95%. This trend is illustrated in Figure 12 for thicknesses varying from 1.0 to 2.0 times the media thickness used during the test. It is worth noting here that it is not simple to estimate the change in filtration efficiency from a change in velocity based upon the gathered experimental data. However, assuming that the diffusion and interception collection mechanisms are dominant, as is expected for 0.2 µm particles with a face velocity of 5.20 cm/s, it is logical that a decrease in velocity would yield an increase in capture efficiency [37]. Therefore, it is reasonable to estimate the change in filtration efficiency due to an increased media thickness, while it is also conceptually sound to assert that the estimated efficiency will be even greater at a slower filtration velocity.

4.4. Estimated Change in Airflow Resistance for Thicker Media and Slower Air Velocity

The airflow resistance constitutes another potential issue when comparing the electrospun media to the HEPA standard. With the relationship between the media thickness, airflow velocity, and airflow resistance shown in Equation (2), an estimate may be made for the airflow resistance of similar media. Considering a hypothetical clean media 1.4 times thicker than the 6% media with an airflow velocity of 2.5 cm/s, the estimated airflow resistance decreases from 458.9 Pa to 311.9 Pa. Similarly, considering a hypothetical clean media double the thickness of the 9% media with an airflow velocity of 2.5 cm/s, the estimated airflow resistance decreases from 154.0 Pa to 148.9 Pa.
Given the already relative closeness of the tested media to the HEPA qualification standards (minimum filtration efficiency of 99.97% with maximum airflow resistance of 320 Pa at a velocity of 2.5 cm/s), it is reasonable to assume that similar electrospun media with a greater thickness would achieve the standards. The comparison of tested and estimated filter media is shown in Table 4 below and graphed in Figure 13.

4.5. Figure of Merit Comparison

The overarching objective of any air filter design is to maximize the filtration efficiency while minimizing the airflow resistance. The calculation of the filter figure of merit (FOM), also known as the filter quality factor, enables a direct comparison of the different physical characteristics as they relate to the overall performance using a combination of filtration efficiency and airflow resistance. For simplicity, it is worth noting that a larger value is considered better, although it is possible to achieve the same FOM value by adjusting the filtration efficiency, airflow resistance, or a combination of both. The FOM is calculated as shown in Equation (3) [37].
FOM = ln ( 1 E F ) Δ P
Using this equation, the calculated FOM for the 6% stabilized PAN filter medium from trial #1 and the 9% stabilized PAN filter medium from trial #3 are shown in Table 4 below. A hypothetical HEPA filter that exactly meets the minimum ASME specifications of 99.97% filtration efficiency for 0.3 µm particles, while sustaining a maximum airflow resistance of 320 Pa at a filtration velocity of 2.5 cm/s, has a calculated FOM of 0.0253. The 9% stabilized PAN filter medium nearly achieved this FOM quality rating with a calculated value of 0.0250. Estimations of filtration efficiency and airflow resistance for thicker media and slower air velocity below indicate both the 6% and 9% stabilized PAN media would be well within the calculated FOM quality rating for a hypothetical minimum specification HEPA filter.
It is worthwhile to note the limitation of using the FOM calculation as a comparison of air filter media. Minimum filter FOM is not specified by ASME AG-1, which instead specifies individual standards for maximum airflow resistance and minimum filtration efficiency [7]. The FOM only applies to a particular filter application at constant airflow rate and changes as the efficiency and airflow resistance change. The FOM cannot be attributed to the filtration media that compose an air filter, as stacking additional media together to increase the thickness, for example, also changes the resulting FOM calculation. These observations are seen in Table 4, as the calculated FOM for both the 6% and 9% air filtration media changed significantly when estimating the performance of hypothetical media at different thicknesses and airflow velocity. While it is beyond the scope of this work to develop an alternative to the FOM calculation, it is worthwhile to suggest the usefulness of a better method to quantify the quality of air filtration media.

4.6. Comparison of Stabilized Polyacrylonitrile Mesh with Glass Fiber HEPA Media

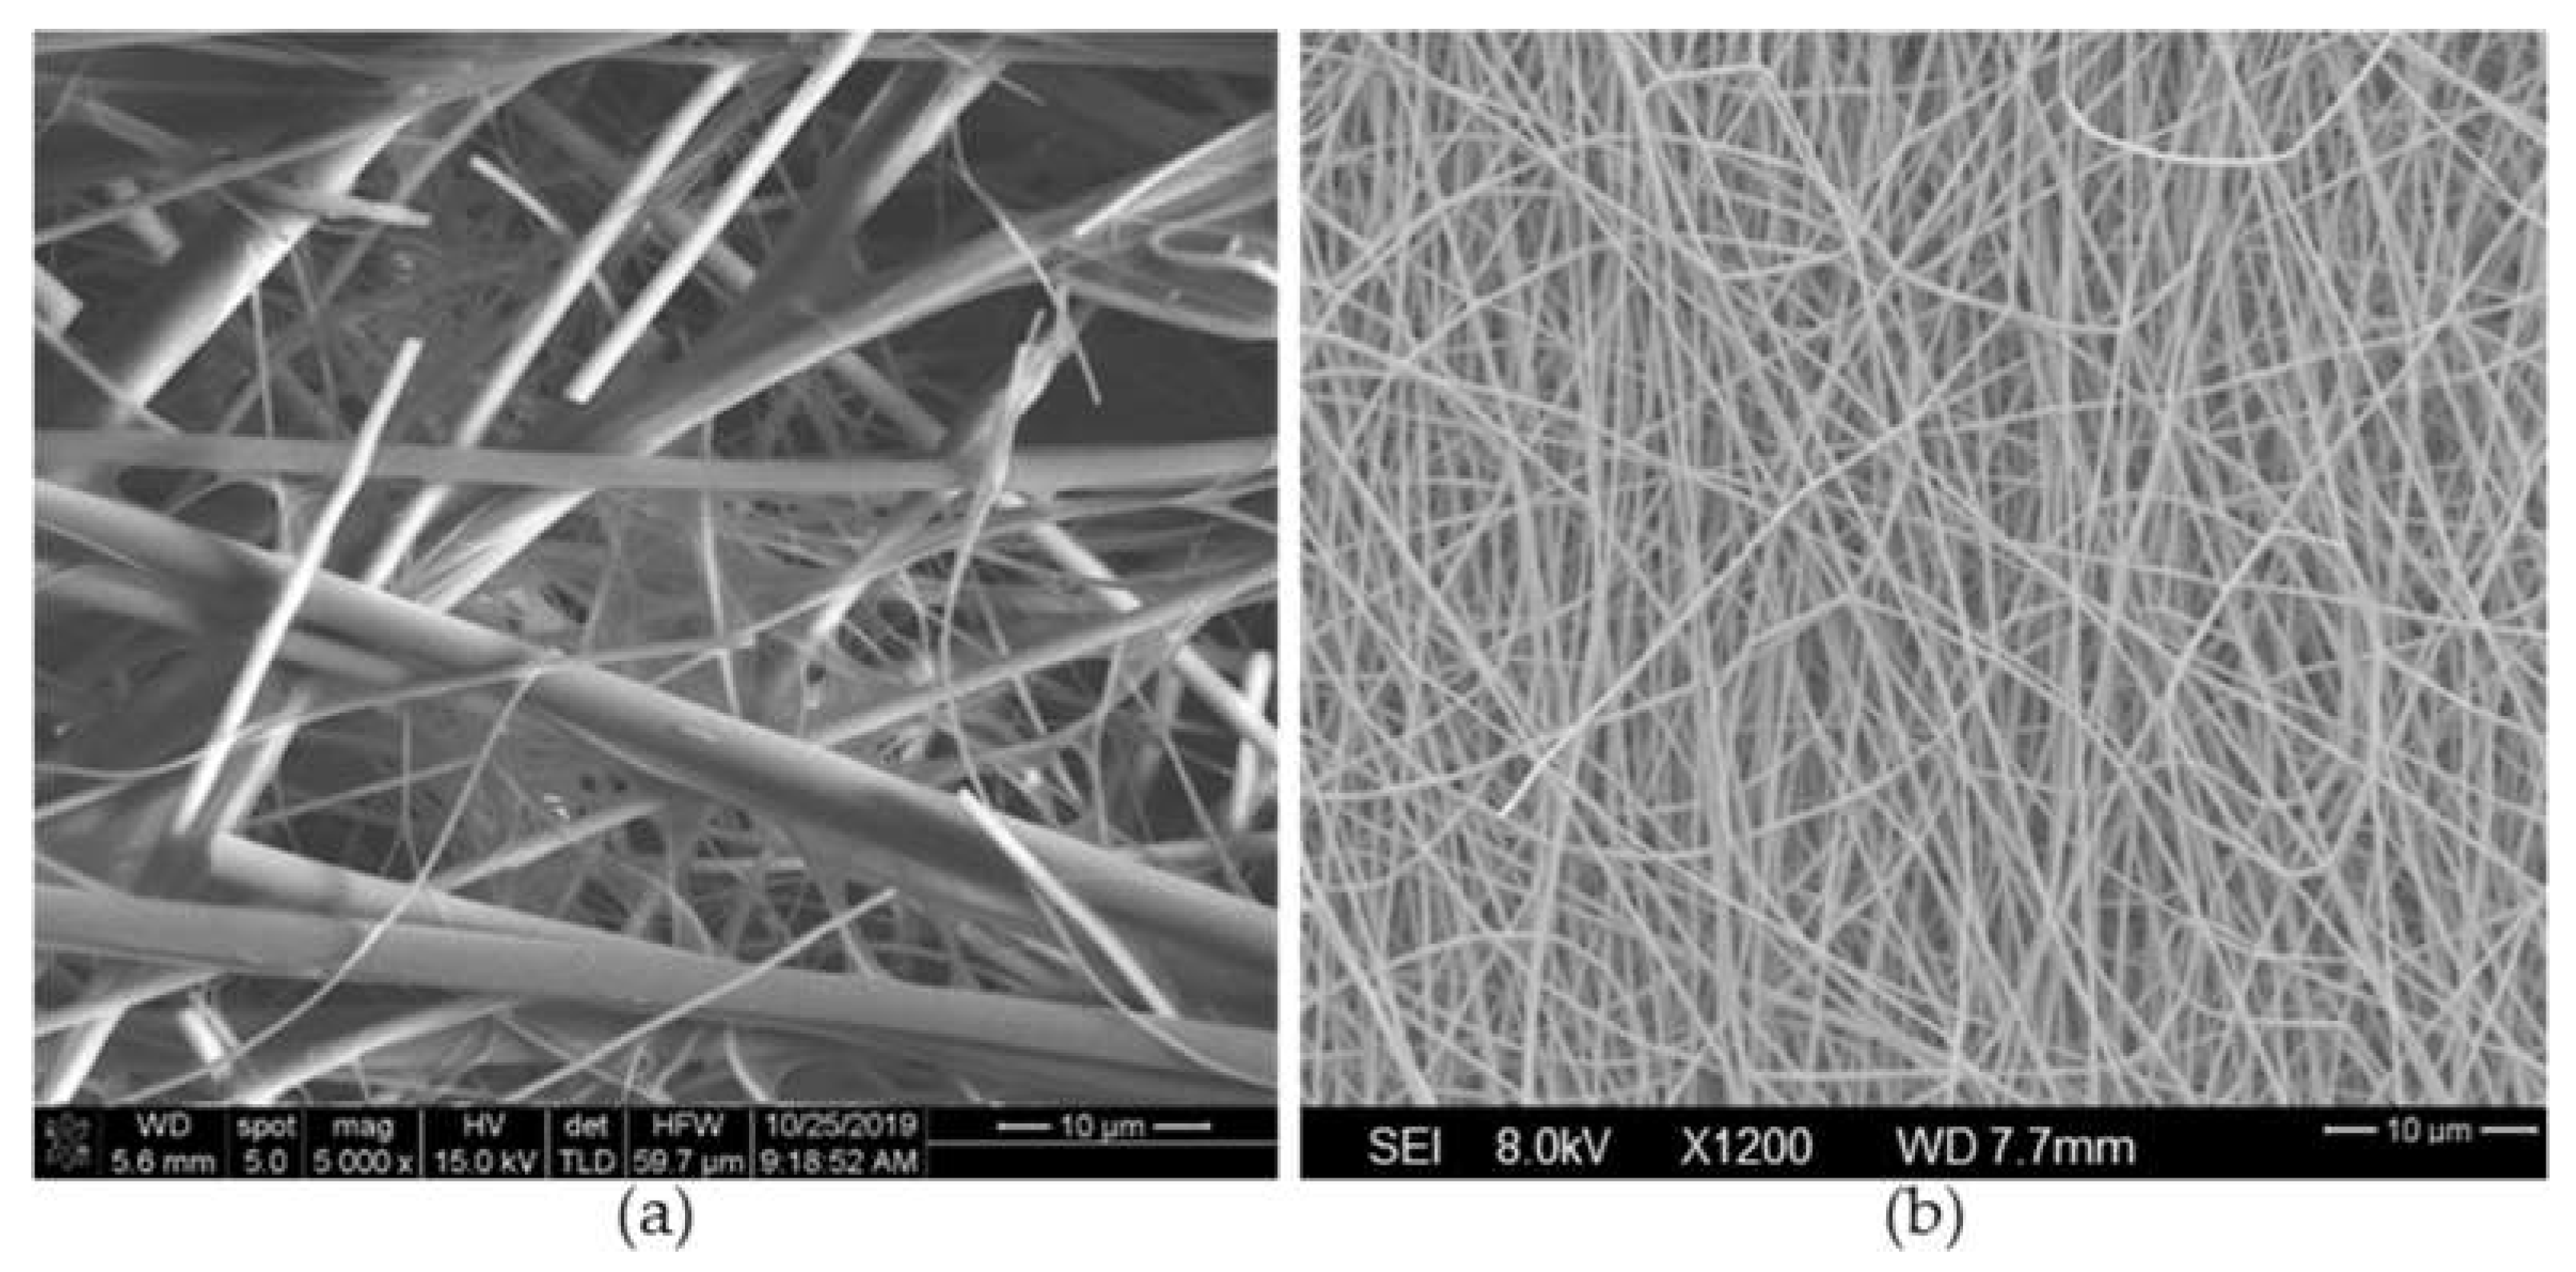
The imagery comparison of the electrospun polyacrylonitrile fibers with HEPA filter glass fibers indicates that the electrospun fibers are much more uniform in shape and size, and more homogeneous than glass HEPA filter fibers. A comparison of glass fiber HEPA filter medium and stabilized polyacrylonitrile fiber medium is shown in Figure 14, where it is worth noting that the HEPA glass fiber media are standard, commercially available AG-1 compliant.
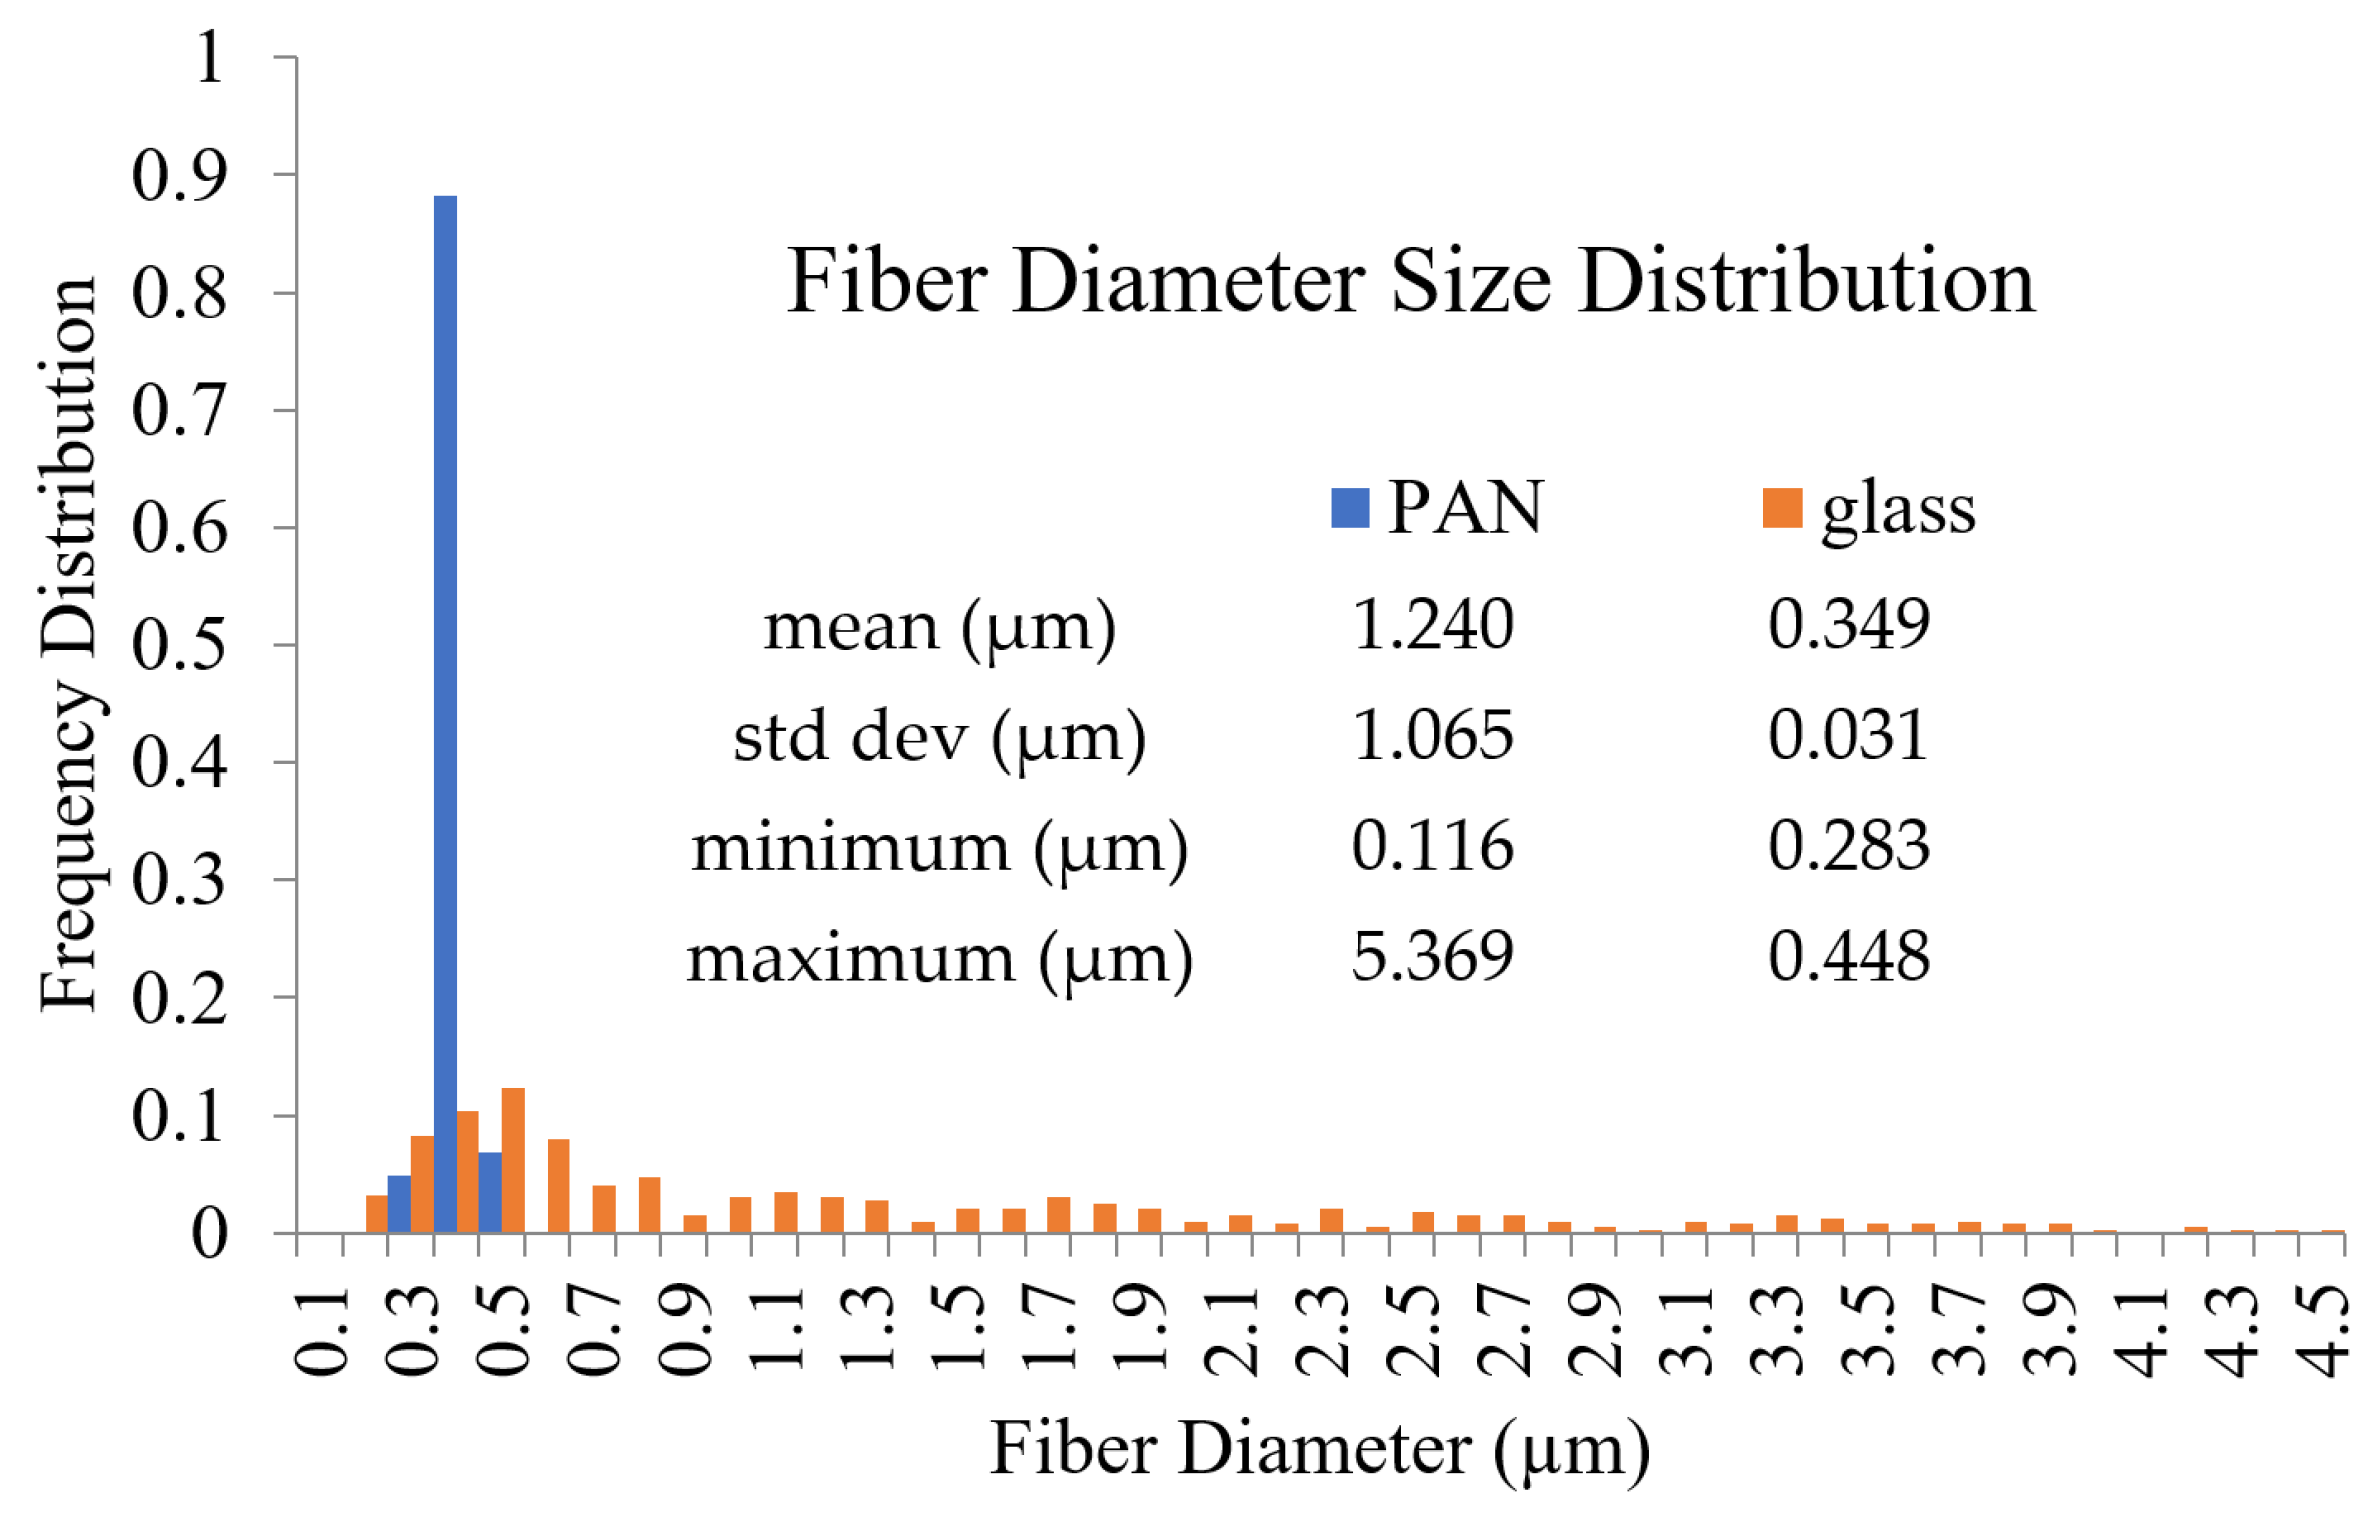
The glass fiber HEPA medium has a range of fiber diameter sizes from 116 nm to 5.37 µm, while the electrospun polyacrylonitrile fibers have a narrow range from 283 nm to 448 nm. An advantage of the glass fiber HEPA filter medium is that the larger diameter fibers provide strength to the mesh. Alternatively, an advantage of the stabilized polyacrylonitrile fiber media is the homogeneous distribution of uniformly sized fibers, which helps avoid the creation of abnormally large airflow channels through the media. Airflow channels facilitate the transport of aerosol particles, which leads to increased penetration. Due to its inhomogeneous nature, airflow channels are common for melt-blown glass fiber HEPA media, as shown in Figure 13. Large airflow channels also reduce the overall airflow resistance through the media, which leads to a lower pressure drop across the media. Thus, the concept of flow channeling creates a complex dynamic for the glass fiber HEPA media, although it is also likely that the electrospun media experience this channeling effect to some extent, since they are also characterized by random fiber orientations. The fiber diameter size distribution is compared in the histogram shown in Figure 15.

5. Conclusions and Future Research

The result of this effort indicates excellent viability for electrospun and stabilized polyacrylonitrile nonwoven air filter media. Electrospinning polyacrylonitrile fibers is a viable method of producing a homogeneous filter medium with a uniform distribution of fibers. Adjustments in the electrospinning and stabilizing process variables result in tunable filter media characteristics, including fiber diameter sizes, filter solidity, and filter thickness. In turn, the filter solidity, filter thickness, and fiber diameter sizes are the characteristics of the air filter that determine both air filtration efficiency and airflow resistance.

5.1. Recommendation for Future Research

HEPA filters are designed to remove particulate matter from aerosol streams and are not currently designed to abate VOCs. Airborne VOCs released into the air from natural and accidental fires and the incomplete combustion of fossil fuels damages our environment and contributes to global warming. Combined with nitrogen oxide, airborne VOCs create ground-level ozone, smog, health problems, and climate damage [42]. Experiments with activated polyacrylonitrile-based carbon nanofibers have shown noteworthy adsorption of the common VOC formaldehyde [20]. Activated carbon has long been used as an adsorbent for air purification and separation, while the increased surface area ratio is an attractive benefit of activated carbon nanofibers [43].

5.2. The Use of Graphene in Air Purification

The authors believe the electrospun filter media produced in this effort can be improved using additives to create composite material fibers, as well as through carbonizing the filter media. The use of graphene may lead to the production of air filters that adsorb VOCs, while also separating particulate matter from aerosol streams.
The benefit of activated carbon is well established in air purification technology for the removal of hydrocarbons. However, activated carbon alone lacks effectiveness to adsorb formaldehyde and other low molecular weight VOCs, although composite materials with graphene, GO, and reduced GO are well suited for VOC adsorption [44]. Kumar et. al. illustrated the potential for graphene-based composite materials to evolve into next-generation air filter materials for VOC adsorption and mitigate airborne hazards causing harm to the environment and climate [44]. Recent efforts of electrospinning polyacrylonitrile with GO and polyimide have demonstrated promising results of filtration efficiency and airflow resistance [45]. Finally, studies have shown enhanced mechanical properties gained by electrospun polyacrylonitrile fibers infused with GO [45,46].

5.3. Activated Carbon Air Filter Media

The activation of polyacrylonitrile–graphene media may create air filter materials that adsorb hazardous airborne VOCs, while also removing PM2.5 particulate matter from the air. The successful development of graphene-based nanomaterials with high VOC adsorption could significantly improve air separation and purification technology, as well as improve air quality. The authors recommend future research, experimentation, and testing of electrospun and carbonized composite polyacrylonitrile–graphene nonwoven nanofibrous media to advance innovative materials technology into air purification capabilities that enable the mitigation of VOC airborne hazards, while simultaneously separating hazardous particles from the air.

Author Contributions

Conceptualization: I.P.B. and H.C.; Formal analysis: I.P.B., G.B. and M.U.-A.; Funding acquisition: T.L.T. and G.R.; Investigation: I.P.B., G.B. and M.U.-A.; Methodology: H.C., I.P.B. and G.B.; Project administration: G.R.; Resources: T.L.T. and G.R.; Supervision: H.C.; Visualization: I.P.B., G.B. and M.U.-A.; Writing—original draft: I.P.B.; Writing—review and editing: I.P.B., G.B., M.U.-A., T.L.T. and H.C. All authors have read and agreed to the published version of the manuscript.

Funding

This research received no external funding.

Data Availability Statement

The data presented in this study are available on request from the corresponding author.

Acknowledgments

The authors acknowledge the financial support provided by the Information Technology Laboratory, U.S. Army Engineer Research and Development Center. Permission was granted by the Director of the Information Technology Laboratory to publish this information.

Conflicts of Interest

The authors declare no conflict of interest.

References

  1. Mukherjee, A.; Agrawal, M. A Global Perspective of Fine Particulate Matter Pollution and Its Health Effects. In Reviews of Environmental Contamination and Toxicology Volume 244; de Voogt, P., Ed.; Springer International Publishing: Cham, Switzerland, 2018; pp. 5–51. [Google Scholar] [CrossRef]
  2. United Nations Environment Programme. Actions on Air Quality: A Global Summary of Policies and Programmes to Reduce Air Pollution. Nairobi, 2 July 2017. 2021. Available online: http://www.unep.org/resources/assessment/actions-air-quality (accessed on 7 March 2022).
  3. Cavaliere, S. Electrospinning for Advanced Energy and Environmental Applications; Routledge: Oxfordshire, UK; CRC Press: Boca Raton, FL, USA, 2017; Available online: https://www.routledge.com/Electrospinning-for-Advanced-Energy-and-Environmental-Applications/Cavaliere/p/book/9781138749085 (accessed on 3 February 2023).
  4. Schumacher, S.; Banda Sanchez, A.; Caspari, A.; Staack, K.; Asbach, C. Testing Filter-Based Air Cleaners with Surrogate Particles for Viruses and Exhaled Droplets. Atmosphere 2022, 13, 1538. [Google Scholar] [CrossRef]
  5. Szczotko, M.; Orych, I.; Mąka, Ł.; Solecka, J. A Review of Selected Types of Indoor Air Purifiers in Terms of Microbial Air Contamination Reduction. Atmosphere 2022, 13, 800. [Google Scholar] [CrossRef]
  6. Fermo, P.; Artíñano, B.; De Gennaro, G.; Pantaleo, A.M.; Parente, A.; Battaglia, F.; Colicino, E.; Di Tanna, G.; Goncalves da Silva Junior, A.; Pereira, I.G.; et al. Improving indoor air quality through an air purifier able to reduce aerosol particulate matter (PM) and volatile organic compounds (VOCs): Experimental results. Environ. Res. 2021, 197, 111131. [Google Scholar] [CrossRef]
  7. American Society of Mechanical Engineers. Code on Nuclear Air and Gas Treatment ASME AG-1-2019; ASME: New York, NY, USA, 2020. [Google Scholar]
  8. Finkenauer, L.R.; Lee, S.B.; Kelly, J.P.; Haslam, J.J. Fire- and Water-Resistant Prefilter; LLNL-TR-771457; Lawrence Livermore National Lab. (LLNL): Livermore, CA, USA, 2019. [Google Scholar] [CrossRef]
  9. Conway, J. HEPA Filters Used in the Department of Energy’s Hazardous Facilities; Defense Nuclear Safety Board: Washington, DC, USA, 1999; DNFSB/TECH-23. Available online: https://www.dnfsb.gov/documents/reports/technical-reports/hepa-filters-used-department-energys-hazardous-facilities (accessed on 12 March 2023).
  10. Beckman, I.P.; Berry, G.; Cho, H.; Riveros, G. Alternative High-Performance Fibers for Nonwoven HEPA Filter Media. Aerosol Sci. Eng. 2022, 1–23. [Google Scholar] [CrossRef]
  11. Huang, Z.-M.; Zhang, Y.-Z.; Kotaki, M.; Ramakrishna, S. A review on polymer nanofibers by electrospinning and their applications in nanocomposites. Compos. Sci. Technol. 2003, 63, 2223–2253. [Google Scholar] [CrossRef]
  12. Lv, H.; Guo, S.; Zhang, G.; He, W.; Wu, Y.; Yu, D.-G. Electrospun Structural Hybrids of Acyclovir-Polyacrylonitrile at Acyclovir for Modifying Drug Release. Polymers 2021, 13, 4286. [Google Scholar] [CrossRef] [PubMed]
  13. Huang, C.; Xu, X.; Fu, J.; Yu, D.-G.; Liu, Y. Recent Progress in Electrospun Polyacrylonitrile Nanofiber-Based Wound Dressing. Polymers 2022, 14, 3266. [Google Scholar] [CrossRef]
  14. Xu, X.; Lv, H.; Zhang, M.; Wang, M.; Zhou, Y.; Liu, Y.; Yu, D.-G. Recent progress in electrospun nanofibers and their applications in heavy metal wastewater treatment. Front. Chem. Sci. Eng. 2023, 1–27. [Google Scholar] [CrossRef]
  15. Guo, L.; Zhao, B.; Jia, Y.; He, F.; Chen, W. Mitigation Strategies of Air Pollutants for Mechanical Ventilated Livestock and Poultry Housing—A Review. Atmosphere 2022, 13, 452. [Google Scholar] [CrossRef]
  16. Hartati, S.; Zulfi, A.; Maulida, P.Y.D.; Yudhowijoyo, A.; Dioktyanto, M.; Saputro, K.E.; Noviyanto, A.; Rochman, N.T. Synthesis of Electrospun PAN/TiO2/Ag Nanofibers Membrane as Potential Air Filtration Media with Photocatalytic Activity. ACS Omega 2022, 7, 10516–10525. [Google Scholar] [CrossRef]
  17. Roche, R.; Yalcinkaya, F. Electrospun Polyacrylonitrile Nanofibrous Membranes for Point-of-Use Water and Air Cleaning. ChemistryOpen 2019, 8, 97–103. [Google Scholar] [CrossRef] [PubMed]
  18. Song, Y.; Wang, Y.; Xu, L.; Wang, M. Fabrication and Characterization of Electrospun Aligned Porous PAN/Graphene Composite Nanofibers. Nanomaterials 2019, 9, 1782. [Google Scholar] [CrossRef] [Green Version]
  19. Liu, C.; Hsu, P.-C.; Lee, H.-W.; Ye, M.; Zheng, G.; Liu, N.; Li, W.; Cui, Y. Transparent air filter for high-efficiency PM2.5 capture. Nat. Commun. 2015, 6, 6205. [Google Scholar] [CrossRef] [Green Version]
  20. Lee, K.J.; Shiratori, N.; Lee, G.H.; Miyawaki, J.; Mochida, I.; Yoon, S.-H.; Jang, J. Activated carbon nanofiber produced from electrospun polyacrylonitrile nanofiber as a highly efficient formaldehyde adsorbent. Carbon 2010, 48, 4248–4255. [Google Scholar] [CrossRef]
  21. Sundarrajan, S.; Tan, K.L.; Lim, S.H.; Ramakrishna, S. Electrospun Nanofibers for Air Filtration Applications. Procedia Eng. 2014, 75, 159–163. [Google Scholar] [CrossRef] [Green Version]
  22. Gupta, B.S.; Afshari, M. Polyacrylonitrile fibers. In Handbook of Properties of Textile and Technical Fibres; Elsevier: Amsterdam, The Netherlands, 2018; pp. 545–593. [Google Scholar] [CrossRef]
  23. Newcomb, B.A.; Chae, H.G. The properties of carbon fibers. In Handbook of Properties of Textile and Technical Fibres; Elsevier: Amsterdam, The Netherlands, 2018; pp. 841–871. [Google Scholar] [CrossRef]
  24. Beckman, I.; Lozano, C.; Freeman, E.; Riveros, G. Fiber Selection for Reinforced Additive Manufacturing. Polymers 2021, 13, 2231. [Google Scholar] [CrossRef] [PubMed]
  25. Khayyam, H.; Naebe, M.; Zabihi, O.; Zamani, R.; Atkiss, S.; Fox, B. Dynamic Prediction Models and Optimization of Polyacrylonitrile (PAN) Stabilization Processes for Production of Carbon Fiber. IEEE Trans. Ind. Inform. 2015, 11, 887–896. [Google Scholar] [CrossRef]
  26. Yördem, O.S.; Papila, M.; Menceloğlu, Y.Z. Effects of electrospinning parameters on polyacrylonitrile nanofiber diameter: An investigation by response surface methodology. Mater. Des. 2008, 29, 34–44. [Google Scholar] [CrossRef] [Green Version]
  27. Wang, T.; Kumar, S. Electrospinning of polyacrylonitrile nanofibers. J. Appl. Polym. Sci. 2006, 102, 1023–1029. [Google Scholar] [CrossRef]
  28. Wu, M.; Wang, Q.; Li, K.; Wu, Y.; Liu, H. Optimization of stabilization conditions for electrospun polyacrylonitrile nanofibers. Polym. Degrad. Stab. 2012, 97, 1511–1519. [Google Scholar] [CrossRef]
  29. Fitzer, E.; Frohs, W.; Heine, M. Optimization of stabilization and carbonization treatment of PAN fibres and structural characterization of the resulting carbon fibres. Carbon 1986, 24, 387–395. [Google Scholar] [CrossRef]
  30. Szepcsik, B.; Pukánszky, B. The mechanism of thermal stabilization of polyacrylonitrile. Thermochim. Acta 2019, 671, 200–208. [Google Scholar] [CrossRef] [Green Version]
  31. TSI Incorporated. Certitest Automated Filter Tester Model 8130A l Specification Sheet. Available online: https://tsi.com/getmedia/061e0676-ae77-43c5-baf3-f8bd1fd2fb93/Filter%20Tester%208130A_US_5001770_RevC_Web?ext=.pdf (accessed on 12 March 2023).
  32. Gebhart, J. Optical Direct-Reading Techniques: Light Intensity Systems. In Aerosol Measurement: Principles, Techniques, and Applications, 2nd ed.; Wiley-InterScience, Inc.: Hoboken, NJ, USA; pp. 419–454.
  33. ImageJ Image Processing and Analysis in Java. Available online: https://imagej.net/ij/index.html (accessed on 12 March 2023).
  34. Schneider, C.A.; Rasband, W.S.; Eliceiri, K.W. NIH Image to ImageJ: 25 years of image analysis. Nat. Methods 2012, 9, 671–675. [Google Scholar] [CrossRef] [PubMed]
  35. Charvet, A.; Thomas, D. 6—Filtration of Liquid Aerosols. In Aerosol Filtration, 1st ed.; Elsevier: Amsterdam, The Netherlands, 2017; pp. 161–188. [Google Scholar]
  36. Davies, C.N. Air Filtration; Academic Press: London, UK; New York, NY, USA, 1973. [Google Scholar]
  37. Hinds, W.C. Aerosol Technology: Properties, Behavior, and Measurement of Airborne Particles, 2nd ed.; Wiley: New York, NY, USA, 1999. [Google Scholar]
  38. Brown, R.C. Air filtration: An Integrated Approach to the Theory and Applications of Fibrous Filters; Pergamon Press: Oxford, UK; New York, NY, USA, 1993. [Google Scholar]
  39. Berry, G.; Beckman, I.; Cho, H. A comprehensive review of Particle loading models of fibrous air filters. J. Aerosol Sci. 2022, 167, 106078. [Google Scholar] [CrossRef]
  40. Beckman, I.P.; Berry, G.; Cho, H.; Riveros, G. Digital Twin Geometry for Fibrous Air Filtration Media. Fibers 2021, 9, 84. [Google Scholar] [CrossRef]
  41. Davies, C.N. The Separation of Airborne Dust and Particles. Proc. Inst. Mech. Eng. 1953, 167, 185–213. [Google Scholar] [CrossRef] [Green Version]
  42. Centers for Disease Control and Prevention. Climate Change Decreases the Quality of the Air we Breathe. Available online: https://www.cdc.gov/climateandhealth/pubs/air-quality-final_508.pdf (accessed on 12 March 2023).
  43. Zhang, L.; Aboagye, A.; Kelkar, A.; Lai, C.; Fong, H. A review: Carbon nanofibers from electrospun polyacrylonitrile and their applications. J. Mater. Sci. 2014, 49, 463–480. [Google Scholar] [CrossRef]
  44. Kumar, V.; Lee, Y.-S.; Shin, J.-W.; Kim, K.-H.; Kukkar, D.; Fai Tsang, Y. Potential applications of graphene-based nanomaterials as adsorbent for removal of volatile organic compounds. Environ. Int. 2020, 135, 105356. [Google Scholar] [CrossRef]
  45. Dai, H.; Liu, X.; Zhang, C.; Ma, K.; Zhang, Y. Electrospinning Polyacrylonitrile/Graphene Oxide/Polyimide nanofibrous membranes for High-efficiency PM2.5 filtration. Sep. Purif. Technol. 2021, 276, 119243. [Google Scholar] [CrossRef]
  46. Li, J.; Hu, Y.; Qiu, H.; Yang, G.; Zheng, S.; Yang, J. Coaxial electrospun fibres with graphene oxide/PAN shells for self-healing waterborne polyurethane coatings. Prog. Org. Coat. 2019, 131, 227–231. [Google Scholar] [CrossRef]
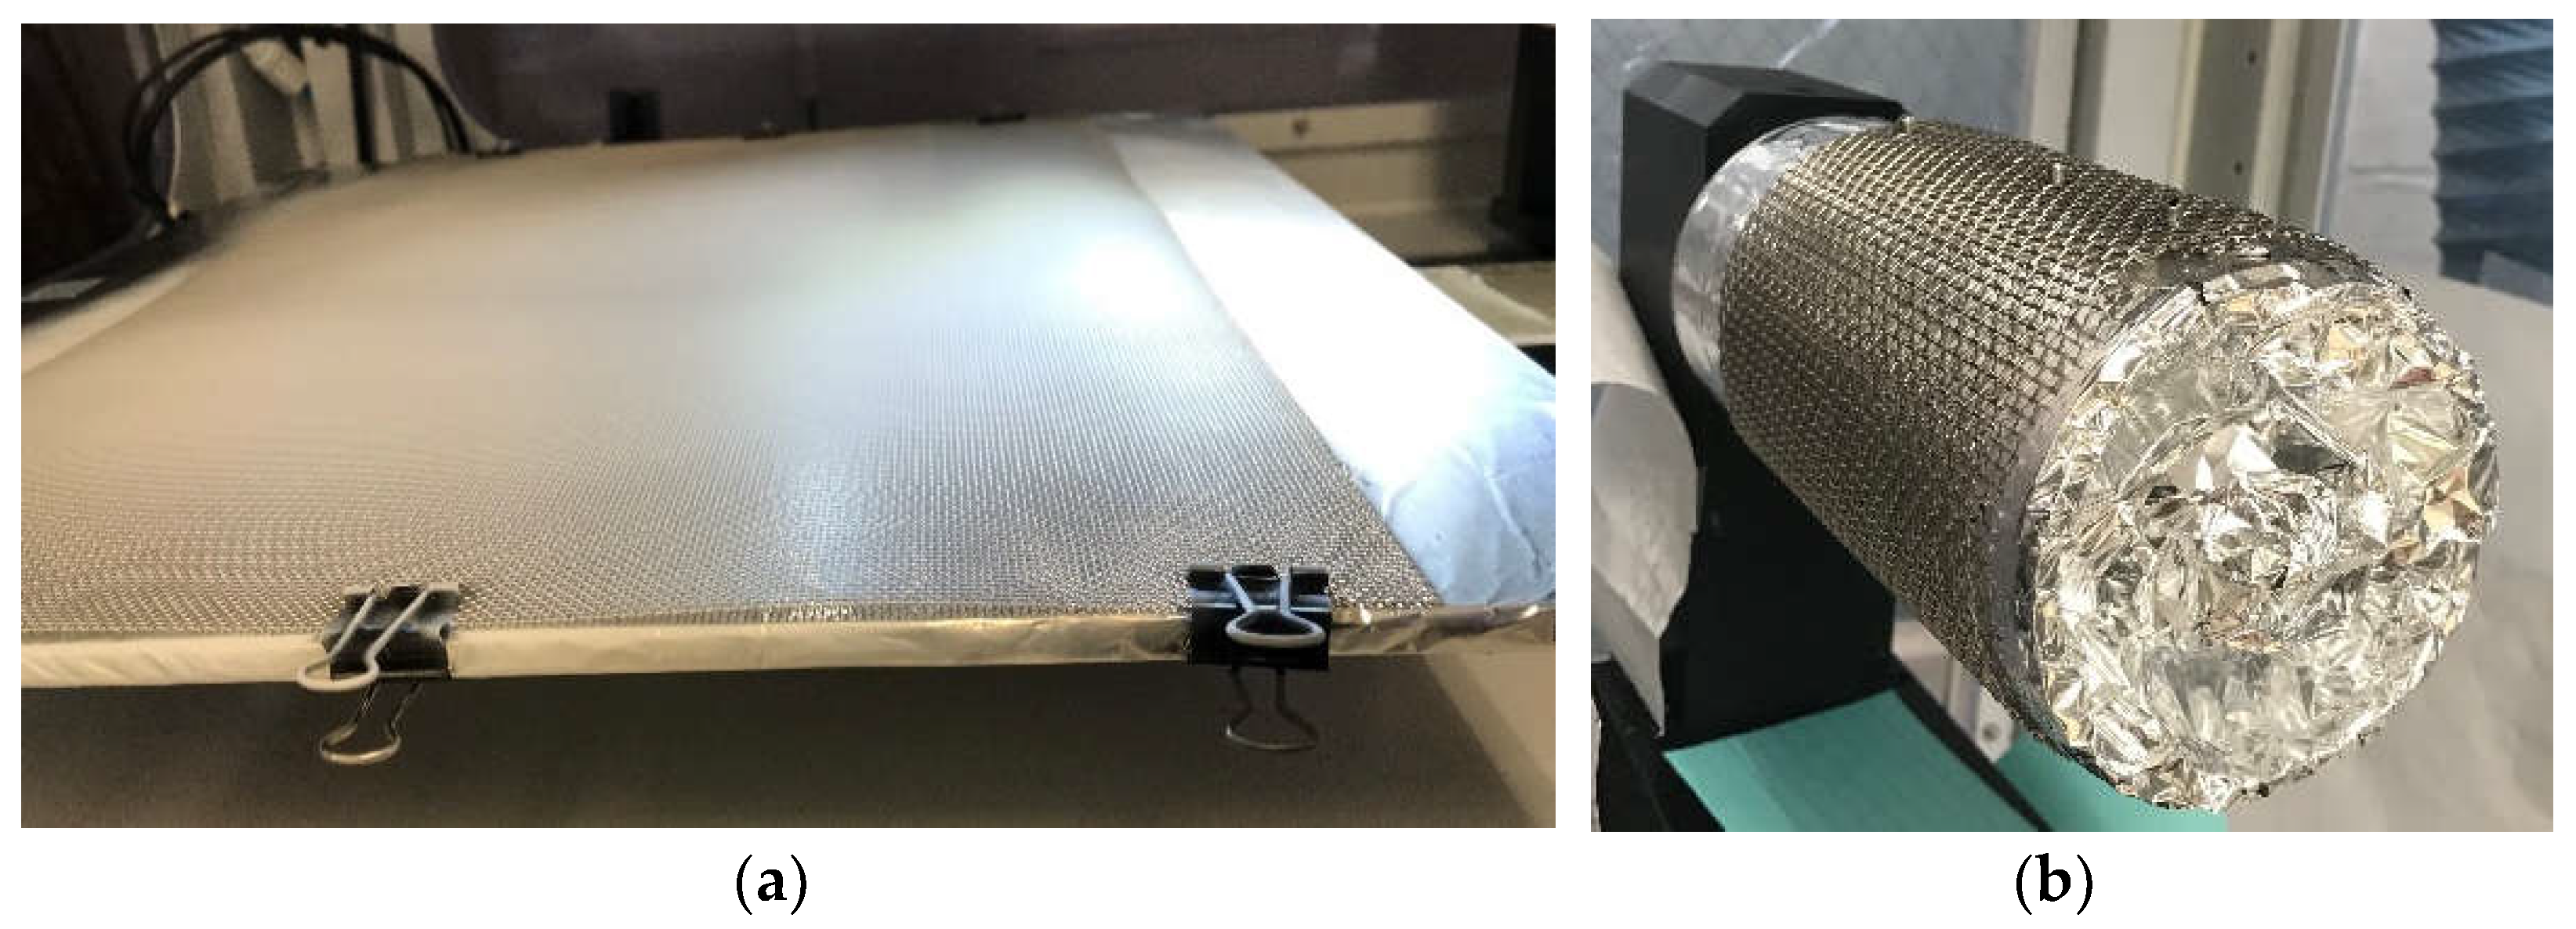
Figure 1. Polyacrylonitrile fiber stabilization process [24,25].
Atmosphere 14 00573 g001
Figure 2. Stainless steel woven wire mesh. (a) Flat plate collector. (b) Roller collector.
Atmosphere 14 00573 g002
Figure 3. Electrospinning configurations. (a) NanoNC model ESR200R2D electrospinner. (b) Vertical alignment onto flat plate. (c) Spray pattern for vertical deposition. (d) Side view of horizontal alignment onto cylindrical roller. (e) Rear view of roller deposition.
Atmosphere 14 00573 g003
Figure 4. Electrospinning jet formation.
Atmosphere 14 00573 g004
Figure 5. Thermogravimetric analysis of as-received PAN.
Atmosphere 14 00573 g005
Figure 6. Stabilization of flat media. (a) Chamber furnace. (b) Stabilized flat plate (trial #3).
Atmosphere 14 00573 g006
Figure 7. Size and weight measurements of stabilized polyacrylonitrile media for trial #6. (a) Detached media weight measurement on digital scale. (b) Size measurement.
Atmosphere 14 00573 g007
Figure 8. Stabilization of cylindrical media for trial. (a) As-spun polyacrylonitrile fiber media for trial #5. (b) Stabilized polyacrylonitrile media for trial #4.
Atmosphere 14 00573 g008
Figure 9. Comparison of as-spun media with stabilized media. (a) Side-by-side comparison for trial #6 (as-spun) and trial #5 (after stabilization). (b) Close up view of as-spun polyacrylonitrile fibers.
Atmosphere 14 00573 g009
Figure 10. Effects of stabilization. (a) A shortened 60 min duration resulted in partial stabilization. (b) An excessive 720 min stabilization resulted in tearing. (c,d) An excessive temperature ramp rate of 5 °C/min resulted in rapid shrinking and tearing.
Atmosphere 14 00573 g010
Figure 11. Qualitative comparison of resulting nonwoven media at 15,000× magnification. (a) SEM image of filter medium resulting from 6% polyacrylonitrile solution, trial #1. (b) SEM image of filter medium resulting from 9% polyacrylonitrile solution, trial #3.
Atmosphere 14 00573 g011
Figure 12. Air filtration testing of trial #3. (a) TSI8130A test machine setup and preparation. (b) Air filtration test in progress.
Atmosphere 14 00573 g012
Figure 13. Air filtration efficiency and airflow resistance. (a) Airflow resistance of 6% media. (b) Filtration efficiency of 6% media. (c) Airflow resistance of 9% media. (d) Filtration efficiency of 9% media.
Atmosphere 14 00573 g013
Figure 14. Comparison of electrospun polyacrylonitrile fibers with glass HEPA filter media. (a) Glass fiber HEPA filter media. (b) Stabilized electrospun fiber polyacrylonitrile filter media.
Atmosphere 14 00573 g014
Figure 15. Fiber diameter size distribution of glass HEPA filter paper and polyacrylonitrile media.
Atmosphere 14 00573 g015
Table 1. Stainless steel wire mesh dimensions.
GaugeUseAperture
(μm)
Wire Diameter
(μm)
Open Area
(%)
20-gauge SS meshFlat Plate90040052
8-gauge SS meshRoller250080060
Table 2. Summary of solution, electrospinning, and stabilization parameters.
Trial123456
Polyacrylonitrile (by weight)6.09.09.09.09.09.0
Electrospinning Details
OrientationFlatFlatFlatRollerRollerRoller
Needle Gauge232323232323
Tip-to-collector (cm)151515151515
Electric Potential (kV)202020252530
Pump Rate (mL/h)0.80.80.91.11.11.1
Pump Time (min)2131732335455451091
Roller Speed (rpm)---180180180
Total Deposition (mL)2.842.303.4910.010.020.0
Stabilization Details
Stabilization Temp (°C)270270270270270270
Temp Ramp (°C/min)5.05.05.01.01.01.0
Stabilization Time (min)240120240240240240
Resultant Mass
Stabilized Mass (mg)-- 764.1825.01257.3
Areal density (mg/cm2)-- 1.1941.2891.965
Table 3. Air filtration testing results.
6% PAN Media
Trial #1
9% PAN Media
Trial #3
Fiber Diameter Mean (nm)216.1461.6
Fiber Diameter Standard Deviation (nm)69.296.9
Airflow Velocity (cm/s)5.155.17
Particle Penetration (%)2.172.38
Initial Filtration Efficiency (%)97.8397.62
Initial Airflow Resistance (Pa)512.9157.9
Calculated Figure of Merit (1/Pa)0.01370.0250
Table 4. Comparison of filtration results to ASME AG-1 standards.
Estimates for Clean MediaAirflow
Velocity
(cm/s)
Airflow
Resistance
(Pa)
Total Filter
Efficiency
(%)
Figure of Merit
(1/Pa)
HEPA Standard2.5320.099.970.0253
6% Media as Tested5.2459.099.810.0137
6% Media (estimated at 1.4× thickness)2.5311.9>99.98>0.0282
9% Media as Tested5.2154.097.850.0250
9% Media (estimated at 2× thickness)2.5148.9>99.95>0.0516
Disclaimer/Publisher’s Note: The statements, opinions and data contained in all publications are solely those of the individual author(s) and contributor(s) and not of MDPI and/or the editor(s). MDPI and/or the editor(s) disclaim responsibility for any injury to people or property resulting from any ideas, methods, instructions or products referred to in the content.