Article

Simulation Study of Microphysical and Electrical Processes of a Thunderstorm in Sichuan Basin

1
College of Electronic Engineering, Chengdu University of Information Technology, Chengdu 610225, China
2
Key Laboratory of Atmospheric Sounding, CMA, Chengdu 610225, China
3
Plateau Atmosphere and Environment Key Laboratory of Sichuan Province, College of Atmospheric Science, Chengdu University of Information Technology, Chengdu 610225, China
*
Author to whom correspondence should be addressed.
Atmosphere 2023, 14(3), 574; https://doi.org/10.3390/atmos14030574
Submission received: 18 February 2023 / Revised: 13 March 2023 / Accepted: 14 March 2023 / Published: 17 March 2023
(This article belongs to the Section Meteorology)

Abstract

:
Based on the Morrison Two-Moment Scheme coupled with the non-inductive electrification mechanism and the discharge parameterization scheme in the Weather Research and Forecasting (WRF) model, a thunderstorm process was simulated by using the WRF electrical coupling model in Sichuan Basin on 21 July 2019, in this paper. Through analysis and discussion of the macroscopic and microscopic characteristics of the thunderstorm activity and the microphysical and dynamic processes, respectively, the study shows that the simulation results of radar echo and lightning are well consistent with the meteorological observation which indicates the WRF model has a certain ability to reproduce the thunderstorm process in Sichuan Basin, there is a good correspondence between the main electrification area and the distribution position of the ice-phase particles in the thunderstorm. The simulated charge structure of the thunderstorm is that the graupel particles are mainly negatively charged, the ice crystals and snow particles are mainly positively charged, and the thunderstorm shows a dipole charge structure with an upper positive charge center and a lower negative charge center. It also shows that the updrafts greatly influence ice-graupel and snow-graupel collisions during the thunderstorm discharge process, the higher the updraft speed, the stronger the electrical activity, and, especially, the stronger the discharge process of ice-particle collisions and separation.

1. Introduction

Thunderstorms are usually localized convective weather accompanied by precipitation and lightning [1,2]. The Sichuan Basin has the characteristics of complex terrain and variable weather conditions, which makes it a place where thunderstorms and other small-scale disastrous weather occur frequently [3,4]. Lightning is usually derived from thunderstorm processes, but the electrification and discharge processes are extremely complex in thunderstorms. It is extremely difficult to obtain the microphysical and dynamic processes within thunderstorms by observational means [5], so numerical simulation has become an important tool for the study of thunderstorms.
At present, the numerical simulation of the discharge process has achieved great results in thunderstorms. Many scholars have studied and analyzed the charge structure of thunderstorm clouds in different regions of China. The results show that the charge structure of thunderstorms is highly variable in different regions. Zhang et al. [6] found by observational means that thunderstorms often show a dipole charge structure with an upper positive charge center and a lower negative charge center in most southern regions of China. Cui et al. [7] found that thunderstorms had a tripolar charge structure in the inland plateau of China by the inversion of electric field data. Zheng et al. [8] studied the lightning activity and charge structure evolution characteristics of a hail process in Beijing by using the method of combining total flash positioning data and radar data, and the results show that the thunderstorms present a reverse charge structure during the hail period, then the thunderstorms present a tripolar charge structure after the hail. Li et al. [9] pointed out that the charge structure of thunderstorms presented different types in different stages with the development of thunderstorms in the study of thunderstorms in Qinghai province, China.
It is recognized that the electrification process of thunderstorms is mainly determined by the inductive electrification and non-inductive electrification mechanism between ice-phase particles, in which the non-inductive electrification mechanism plays a dominant role [10,11]. The complex and variable charge structure in a thunderstorm is mainly related to the charge after the collision and separation of different hydrometeors, which is related to the dynamic process of thunderstorms [12]. To explore the microphysical and dynamic processes of thunderstorms, many scholars have coupled various electrification mechanisms in different cloud models to simulate thunderstorm processes [13], which is of great significance to the study of the electrification process in thunderstorms. Therefore, it is necessary to study the microphysical and dynamic processes of thunderstorms to simulate the electrification and discharge processes in thunderstorms more accurately.
Many scholars [13,14,15,16] have coupled different charging mechanisms and discharge schemes into different mesoscale models and found that it is feasible to use mesoscale models to directly predict thunderstorm lightning activity. Most of the previous studies [16,17] used mesoscale models to simulate the squall line and supercell activity in China, and the simulation of thunderstorm small cell electrical activity is less. Due to the special topography of the Sichuan Basin, it is very difficult to capture small thunderstorm cells caused by atmospheric convection, so it is necessary to carry out corresponding numerical simulation research.
In this paper, the WRF model coupled with the non-inductive electrification mechanism and the discharge process in the Morrison Two-Moment Scheme [13], is used to simulate a local thunderstorm process in Sichuan Basin. Combined with the microphysical and dynamic processes output by the WRF model, the microphysical characteristics of the thunderstorm are analyzed under the special terrain of the Sichuan Basin, and the relationships among the hydrometeors, electrical processes, and the charge structure are discussed in the thunderstorm cell. This has certain scientific significance for the study of local thunderstorm electricity in the Sichuan Basin under special terrain.

2. Materials and Methods

2.1. Data

The data used in this paper mainly include the following items. (1) China Meteorological Administration Lightning Detection Network Advanced TOA and Direction (CMA-LDN ADTD) lightning data has the advantage of a large detection range. The detection time resolution of ADTD is 0.1 μs, and its measurement data mainly include the location of lightning, charge transferred by discharge, energy, and steepness [18,19]. (2) China’s New Generation S-band Doppler radar (CINSAD-SC) can monitor severe convective weather over a radius of 400 km with a temporal resolution of 6 min, and the radar observation data have been used in many meteorological fields [20,21]. (3) The Final Operational Global Analysis data (FNL) of 1.0 × 1.0 grids every six hours, which is jointly produced by the National Centers for Environmental Prediction (NCEP, College Park, MD, USA) and the National Center for Atmospheric Research (NCAR, Asheville, NC, USA), is used as the initial field data of the WRF model [22].
The Sichuan Basin has a complex topography and changeable weather, and thunderstorms mostly occur at night with short duration and small distribution ranges. According to the conclusion of previous scholars’ analysis of typical thunderstorms in Sichuan [23], this case is adopted to analyze the microphysical and dynamic processes of representative thunderstorms in the Sichuan Basin.

2.2. The WRF Model

The WRF model coupled with the non-inductive electrification (SP98) mechanism [24] and the discharge parameterization scheme in the Morrison Two-Moment Scheme [24] is used to simulate the thunderstorm process in Sichuan Basin with the FNL reanalysis data for the initial field and boundary conditions. The duration of the WRF simulation is 24 h from 6:00 UTC on 21 July to 6:00 UTC on 22 July 2019. The WRF model adopts the triple nested domain, and the outermost layer has a horizontal resolution of 27 km with 105 × 105 grid points, the middle layer is 9 km with 181 × 199 grid points, and the innermost layer is 3 km with 193 × 184 grid points. The output data intervals of the three nested layers are 120 min, 60 min, and 6 min, respectively. Here, the output data of the innermost layer with an interval of 6 min are used.
For the WRF model, the microphysical scheme adopts the Morrison Two-Moment Scheme [24,25] coupled with the electrification and discharge processes, in which the electrification process mainly considers the non-inductive electrification process of ice-graupel and snow-graupel collisions [13]. Other parameterization schemes of the WRF model mainly include the longwave radiation scheme of the Rapid Radiative Transfer Model (RRTM) [26], the shortwave radiation scheme of the Dudhia [27], the Noah land-surface scheme [28], the Yonsei University (YSU) planetary boundary layer scheme [29], no cumulus parameterization scheme for the innermost layer, and the Kain–Fritsch cumulus parameterization scheme for the remaining two grid layers [30,31].

2.3. Microphysical Process

The Morrison Two-Moment Scheme can accurately deal with the spectral distribution of microphysical particles and take into account the number concentration, and mass mixing ratio of water vapor, cloud droplets, ice crystals, snowflakes, raindrops, and graupel particles. However, there is no microphysical process of ice-graupel and snow-graupel collision separation in the Morrison Two-Moment Scheme, thus, the physical processes of ice-graupel and snow-graupel particles collisions are implanted into the Morrison Two-Moment Scheme [32]. The accretion rate of snow by graupel particles ( P GACS ) is given by:
P GACS = π 2 E GS n 0 S n 0 G | U G U S | ( ρ s / ρ ) × ( 5 λ S 6 λ G + 2 λ S 5 λ G 2 + 0.5 λ S 4 λ G 3 )
where the collection efficiency of graupel for snow particles is E GS , the interception parameters of graupel and snow particles are n 0 G and n 0 S , the terminal velocity of graupel and snow particles are U G and U S , the slope parameters of graupel and snow particles are λ G and λ S . The accretion rate of ice crystals by graupel particles is given by:
P GACI = π E GI n 0 G q CI ( 3.5 ) 4 λ G 3.5 ( 4 g ρ G 3 C D ρ ) 1 2
where the collection coefficient of graupel collecting ice crystals is   E GI , the mixing ratio of ice crystals is q CI , the drag coefficient of graupel particles is C D .

2.4. Non-Inductive Electrification Process

The main consideration here is the non-inductive electrification mechanism caused by the collision and separation of ice-graupel and snow-graupel. Mansell et al. [33,34] compared five parametric schemes for non-inductive electrification including the SP98, TAK, S91, GZ, and RAR schemes. By comparing the observation data, it is pointed out that the SP98 scheme can better reproduce the charge and lightning development process, and Mansell et al. [33,34] adjusted the lowest temperature to make the charging range more widely available in the SP98 scheme. Therefore, the adapted SP98 scheme is used for the non-inductive electrification mechanism analysis, the average charge separation amount per rebounding collision in the SP98 scheme is written as:
Δ Q = Bd a V b δ q ±
where B , a , and b are constants, as shown in Table 1. The diameter of ice crystals or snow particles is d in meters, and the relative fall speed is V (unit: m s−1) [34].
The positive charge of graupel particles is expressed as:
δ q + = 6.74 ( RAR RAR C )
The negative charge of graupel particles is expressed as:
δ q = 3.9 ( RAR C 0.1 ) ( 4 [ RAR ( RAR C + 0.1 ) / 2 RAR C 0.1 ] 2 1 )
where, the rime accretion rate ( RAR ) is calculated as the effective liquid water content multiplied by the fall speed of the graupel particles, and the temperature function of the critical rime accretion rate ( RAR C ) is expressed as:
RAR C = { s ( T ) :                           T > 23.7   ° C                     k ( T ) :     23.7   ° C > T > 40   ° C     0     :                           T 40   ° C                              
When the RAR is less than the RAR C , the graupel particle carries a negative charge and vice versa. If the temperature is above −23.7 °C, the function of s ( T ) is expressed as:
s ( T ) = 1.0 + 7.9262 × 10 2 T + 4.4847 × 10 2 T 2 + 7.4754 × 10 3 T 3 + 5.4686 × 10 4 T 4 + 1.6757 × 10 5 T 5 + 1.7613 × 10 7 T 6
It was found that the liquid cloud droplets still existed in the region of clouds when the temperature was −37.5 °C [35], so the lowest temperature of the function k ( T ) was adjusted from −32.47 °C to −40 °C in the SP98 scheme.
k ( T ) = 3.4 [ 1.0 ( | T + 23.7 | 40.0 23.7 ) 3 ]  

2.5. Lightning Parameterization

The electric potential Φ s obtained by solving the Poisson equation on all grid points:
2 Φ = ρ ε  
where the total charge density is ρ , and the electric permittivity of air is ε   ( 8.859 × 10 12 N 1 m 2 C 2 ) . The electric field E is obtained by calculating the negative difference of the electric potential.
E = Φ  
When the electric field exceeds the discharge threshold in the vertical direction of a grid point, which is the lightning excitation point [36]. The breakdown field E init is expressed as:
E init = 201.7 × exp ( z / 8.4 )  
where z is the altitude in km. To make the discharge position within a reasonable altitude range and avoid the discharge altitude being unduly high or low, the breakdown field E init is limited from 30 kV m−1 to 125 kV m−1 [33].

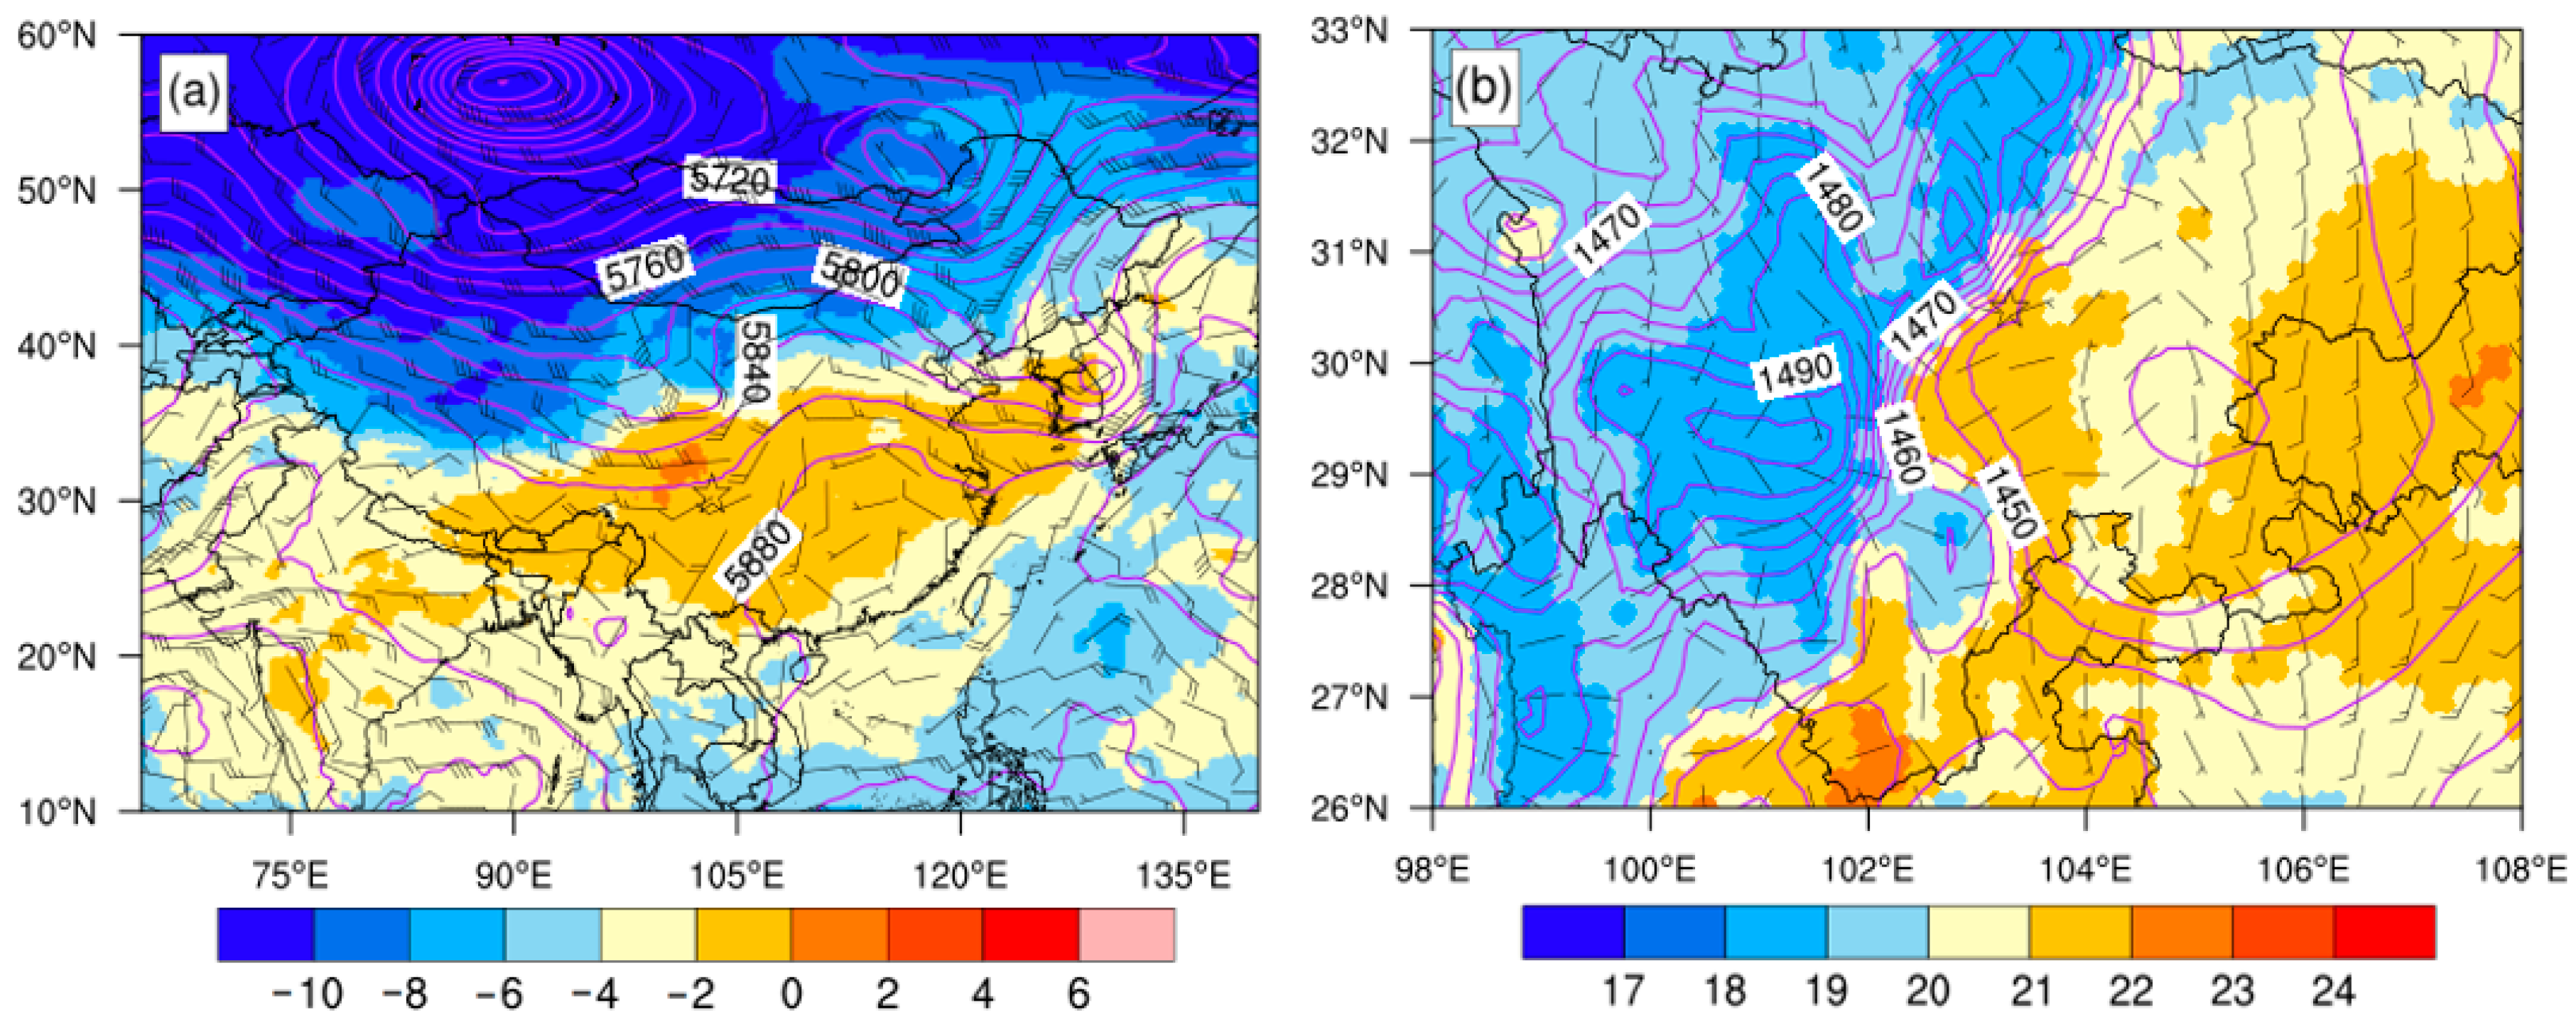
3. Atmospheric Circulation Background

This strong convective weather process occurred in the central and eastern Sichuan Basin beginning on 21 July 2019. This paragraph analyzes the atmospheric circulation situation of thunderstorm weather and the triggering environmental conditions at 500 hPa and 850 hPa geopotential height, then the regularity and characteristics of the thunderstorm weather process are summarized.
At 15:00 UTC on 21 July 2019, the atmospheric circulation at 500 hPa (Figure 1a) showed two troughs and two ridges in the middle and high latitudes, with a closed low-pressure center in the Siberia region that constantly splits the cold air southward. The Sichuan Basin is controlled by the southwest warm and humid airflow on the west side of the anticyclone anomalies, and the contour line of 5880 gpm is a cyclonic turning point in Sichuan. The combination of the anticyclone anomalies and the westerly trough provides a strong environmental background condition for the strong convective weather. The southwest vortex is a cyclonic or low vortex with a closed contour occurring at 850 hPa or 700 hPa geopotential height in Southwest China [37,38]. In the atmospheric circulation situation at 850 hPa (Figure 1b), the southwest vortex is located in the eastern part of Sichuan Province controlled by a wide range of low-pressure cyclones, and the wind direction is counterclockwise and converges to the low-pressure center. The low-level cyclonic vorticity convergence is conducive to the formation of updrafts to transport water vapor upward, which triggers the occurrence of strong convective weather.
In general, Sichuan Basin is located on the west side of the subtropical high-pressure belt. The southwest warm-humid airflow collides with the cold air moving southward from the Siberian Plain, and the cold and warm air intersects. The periphery of the subtropical high-pressure belt is affected by the subtropical high-pressure belt, the southwest warm and humid airflow, and the southwest vortex, resulting in strong convective weather processes in local areas of the Sichuan Basin.

4. Analysis of Simulation Results

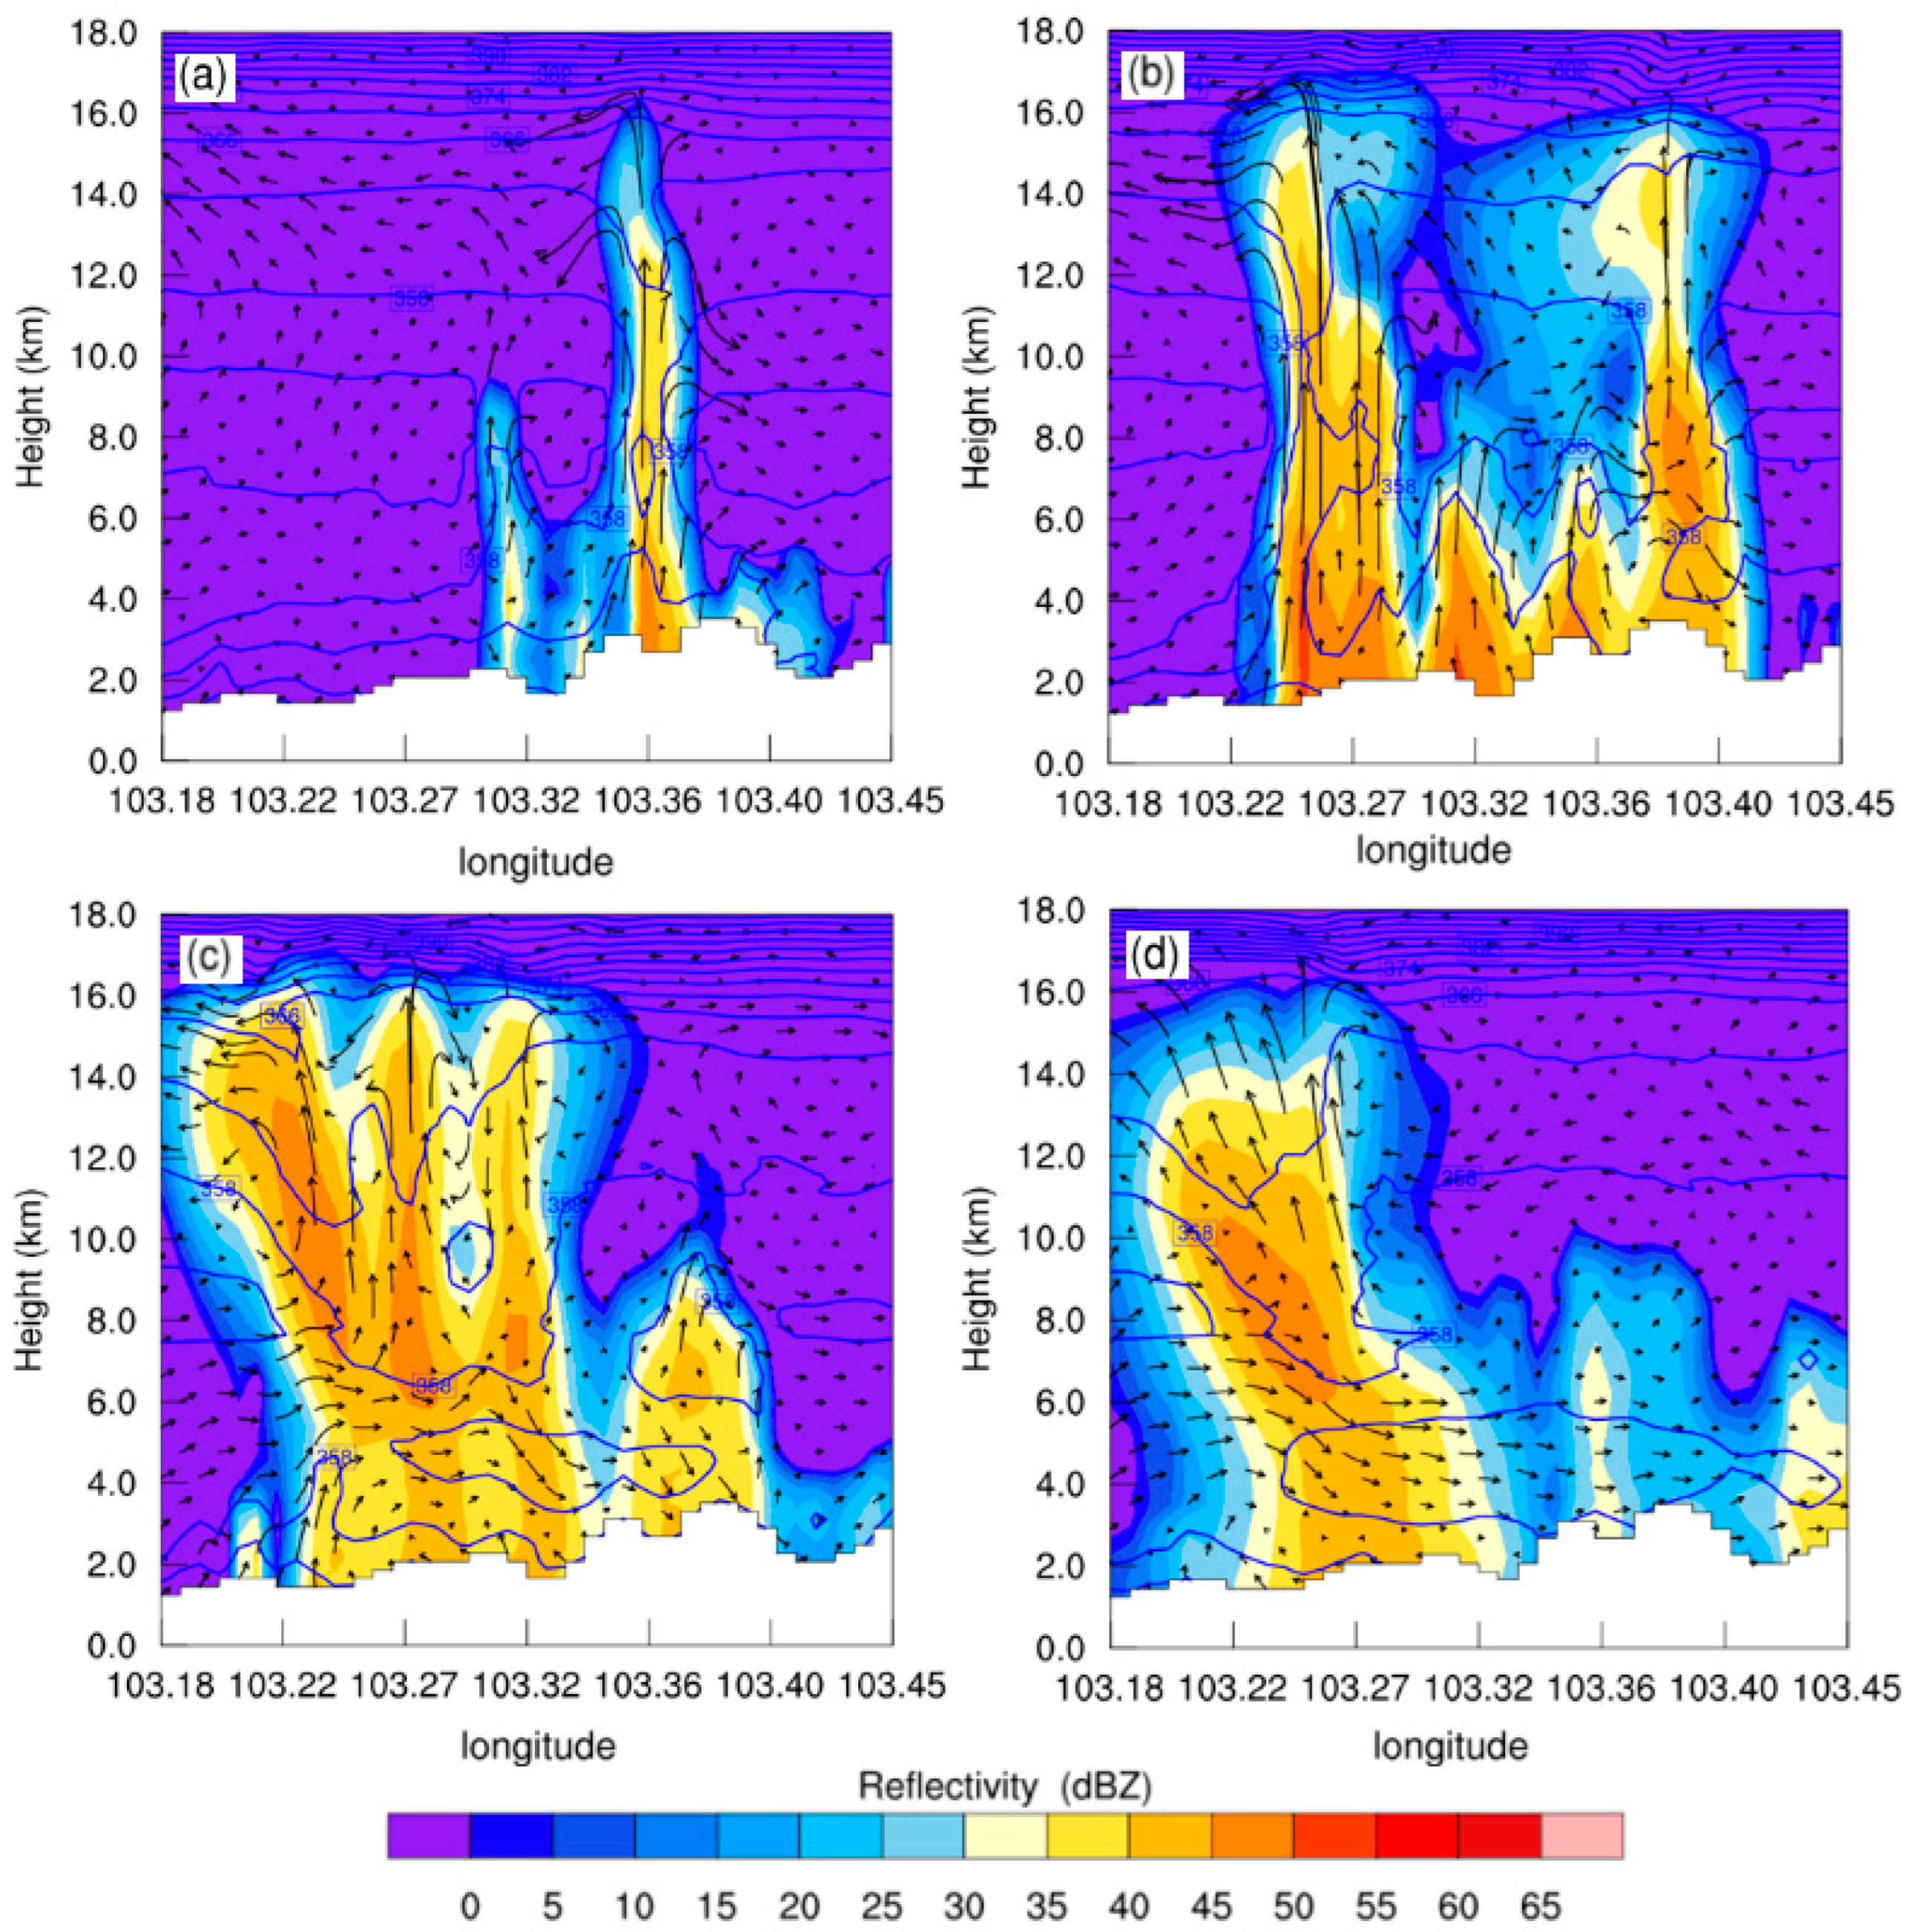
4.1. Numeral Simulation and Validation

The observation data of the CINSAD-SC set in Sichuan are used to test the effect of the WRF model, and the radar reflectivity simulated by the WRF model and observed by the CINSAD-SC are shown in Figure 2. By comparing the simulated radar reflectivity (Figure 2a) and the observed data (Figure 2c) at 14:00 UTC on 21 July 2019, it can be seen that the simulated and observed radar echo evolution process and maximum echo intensity are consistent, but the simulated results of the radar echo have a certain deviation from the observation data in position. The simulated radar echo has a wider distribution range and a higher latitude position, and the observed radar echo is more dispersed. The maximum intensity of simulated and observed radar echo is about 55 dBZ, and the range spreads eastward and southward with time. In general, although there is a certain deviation between the two strong echo center positions, the echo evolution process and intensity can correspond well still. For the electrical activity analysis of thunderstorms, the evolution process and intensity of the radar echo have decisive significance when focusing on internal microphysical and electrical processes, so the WRF model can well meet the simulation analysis of the thunderstorm process in the Sichuan Basin.
By comparing the lightning frequency between the ADTD lightning location data and the simulated output of the WRF model in a 6 h duration from 12:00 UTC to 18:00 UTC, further reliability validation of the WRF model in the thunderstorm process was carried out. From the simulated (Figure 3a) and the observed (Figure 3b) lightning location maps, the lightning distribution range is relatively consistent, but the number is somewhat different from the actual observation. Theoretically, due to the time step, the number of simulated lightning of WRF should be less than observed, but the output data of the WRF model cannot distinguish between intracloud lightning and cloud-to-ground lightning, only the total frequency of lightning, while the observed ADTD data only contains cloud-to-ground lightning. Therefore, it seems that the number of simulated lightning is greater than the number of observed lightning.
The ERA5 reanalysis data proved to be reliable for assessing wind energy potential over most land and sea levels [39]. Therefore, the wind field data of ERA5 global reanalysis is selected as the observation data to compare with the wind field at 500 hPa simulated by the WRF model at 12:00 UTC and 18:00 UTC (Figure 4). The results show that both simulated and observed wind fields appear as anticyclonic vortices in central and southern China under the influence of subtropical high pressure. The southwestern warm and humid airflow at the periphery of the subtropical high-pressure belt intersects with the cold air moving southward from the Siberian plain in the Sichuan basin.
In summary, the WRF model can reproduce the radar echoes, the lightning characteristics, and the wind field environment of this thunderstorm process, which indicates that the WRF model has a certain simulation capability for this thunderstorm process. The following section will analyze the microphysical and dynamical characteristics of this thunderstorm process in detail on this basis.

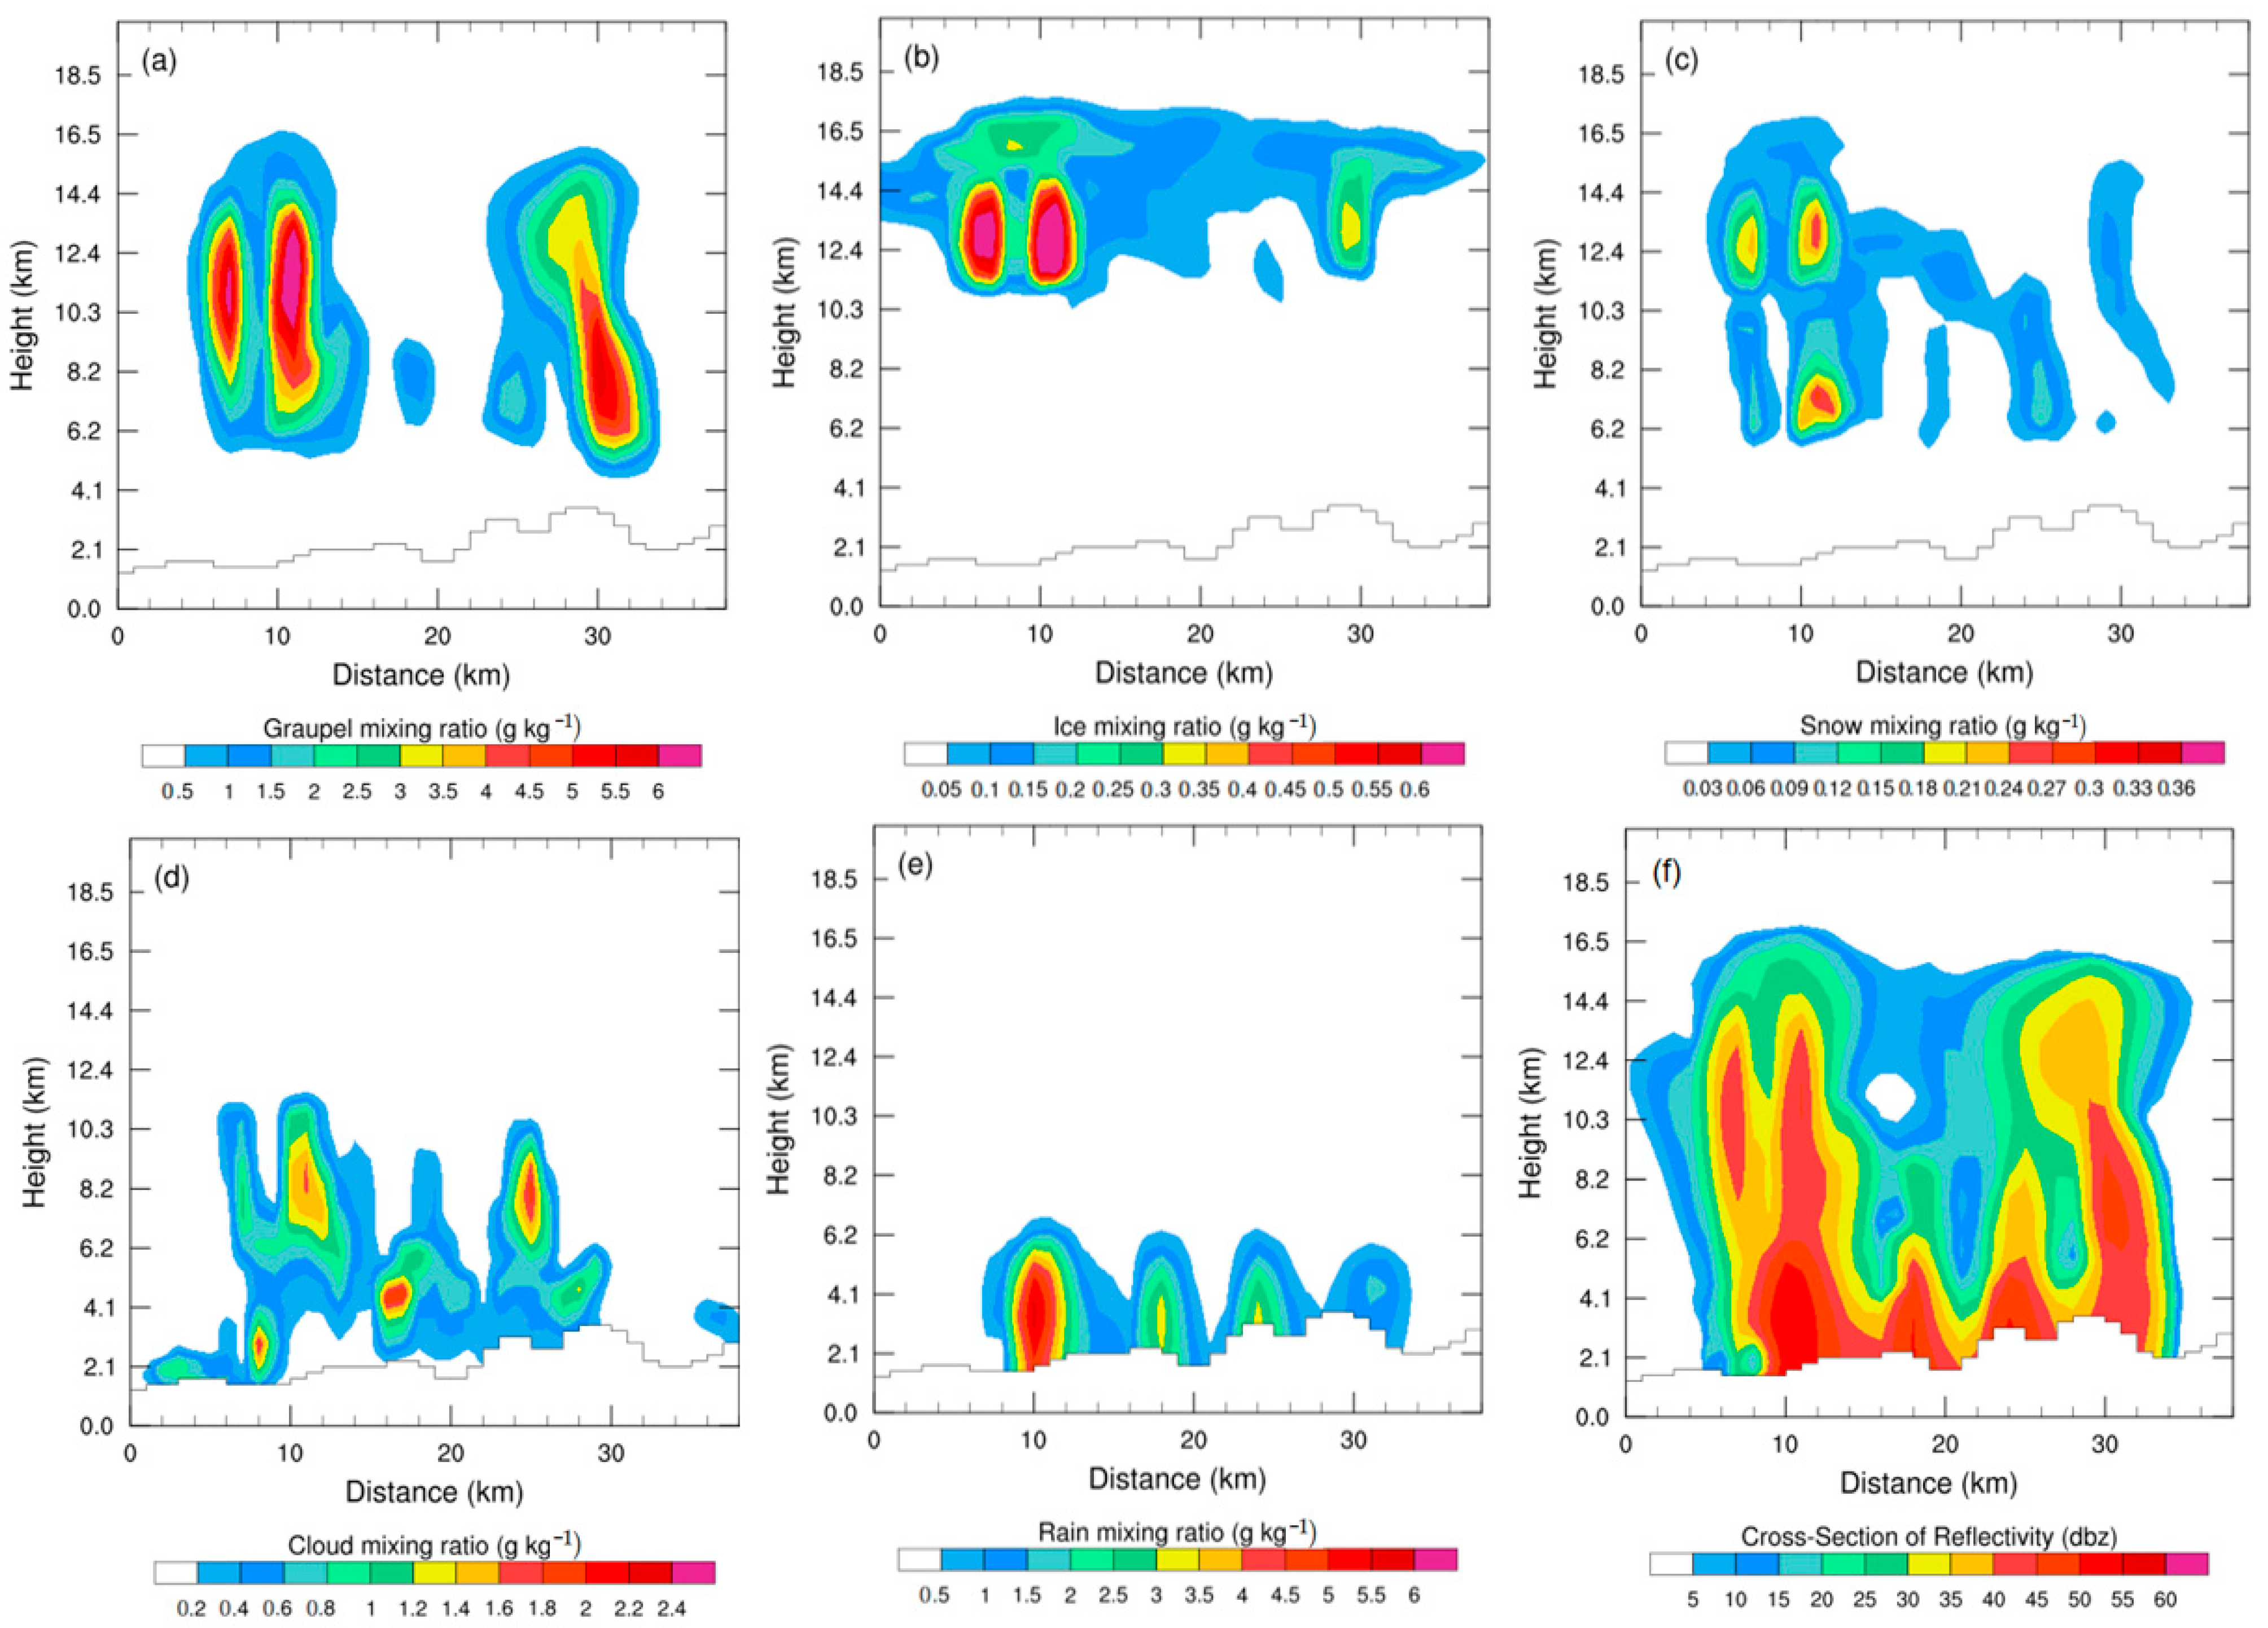
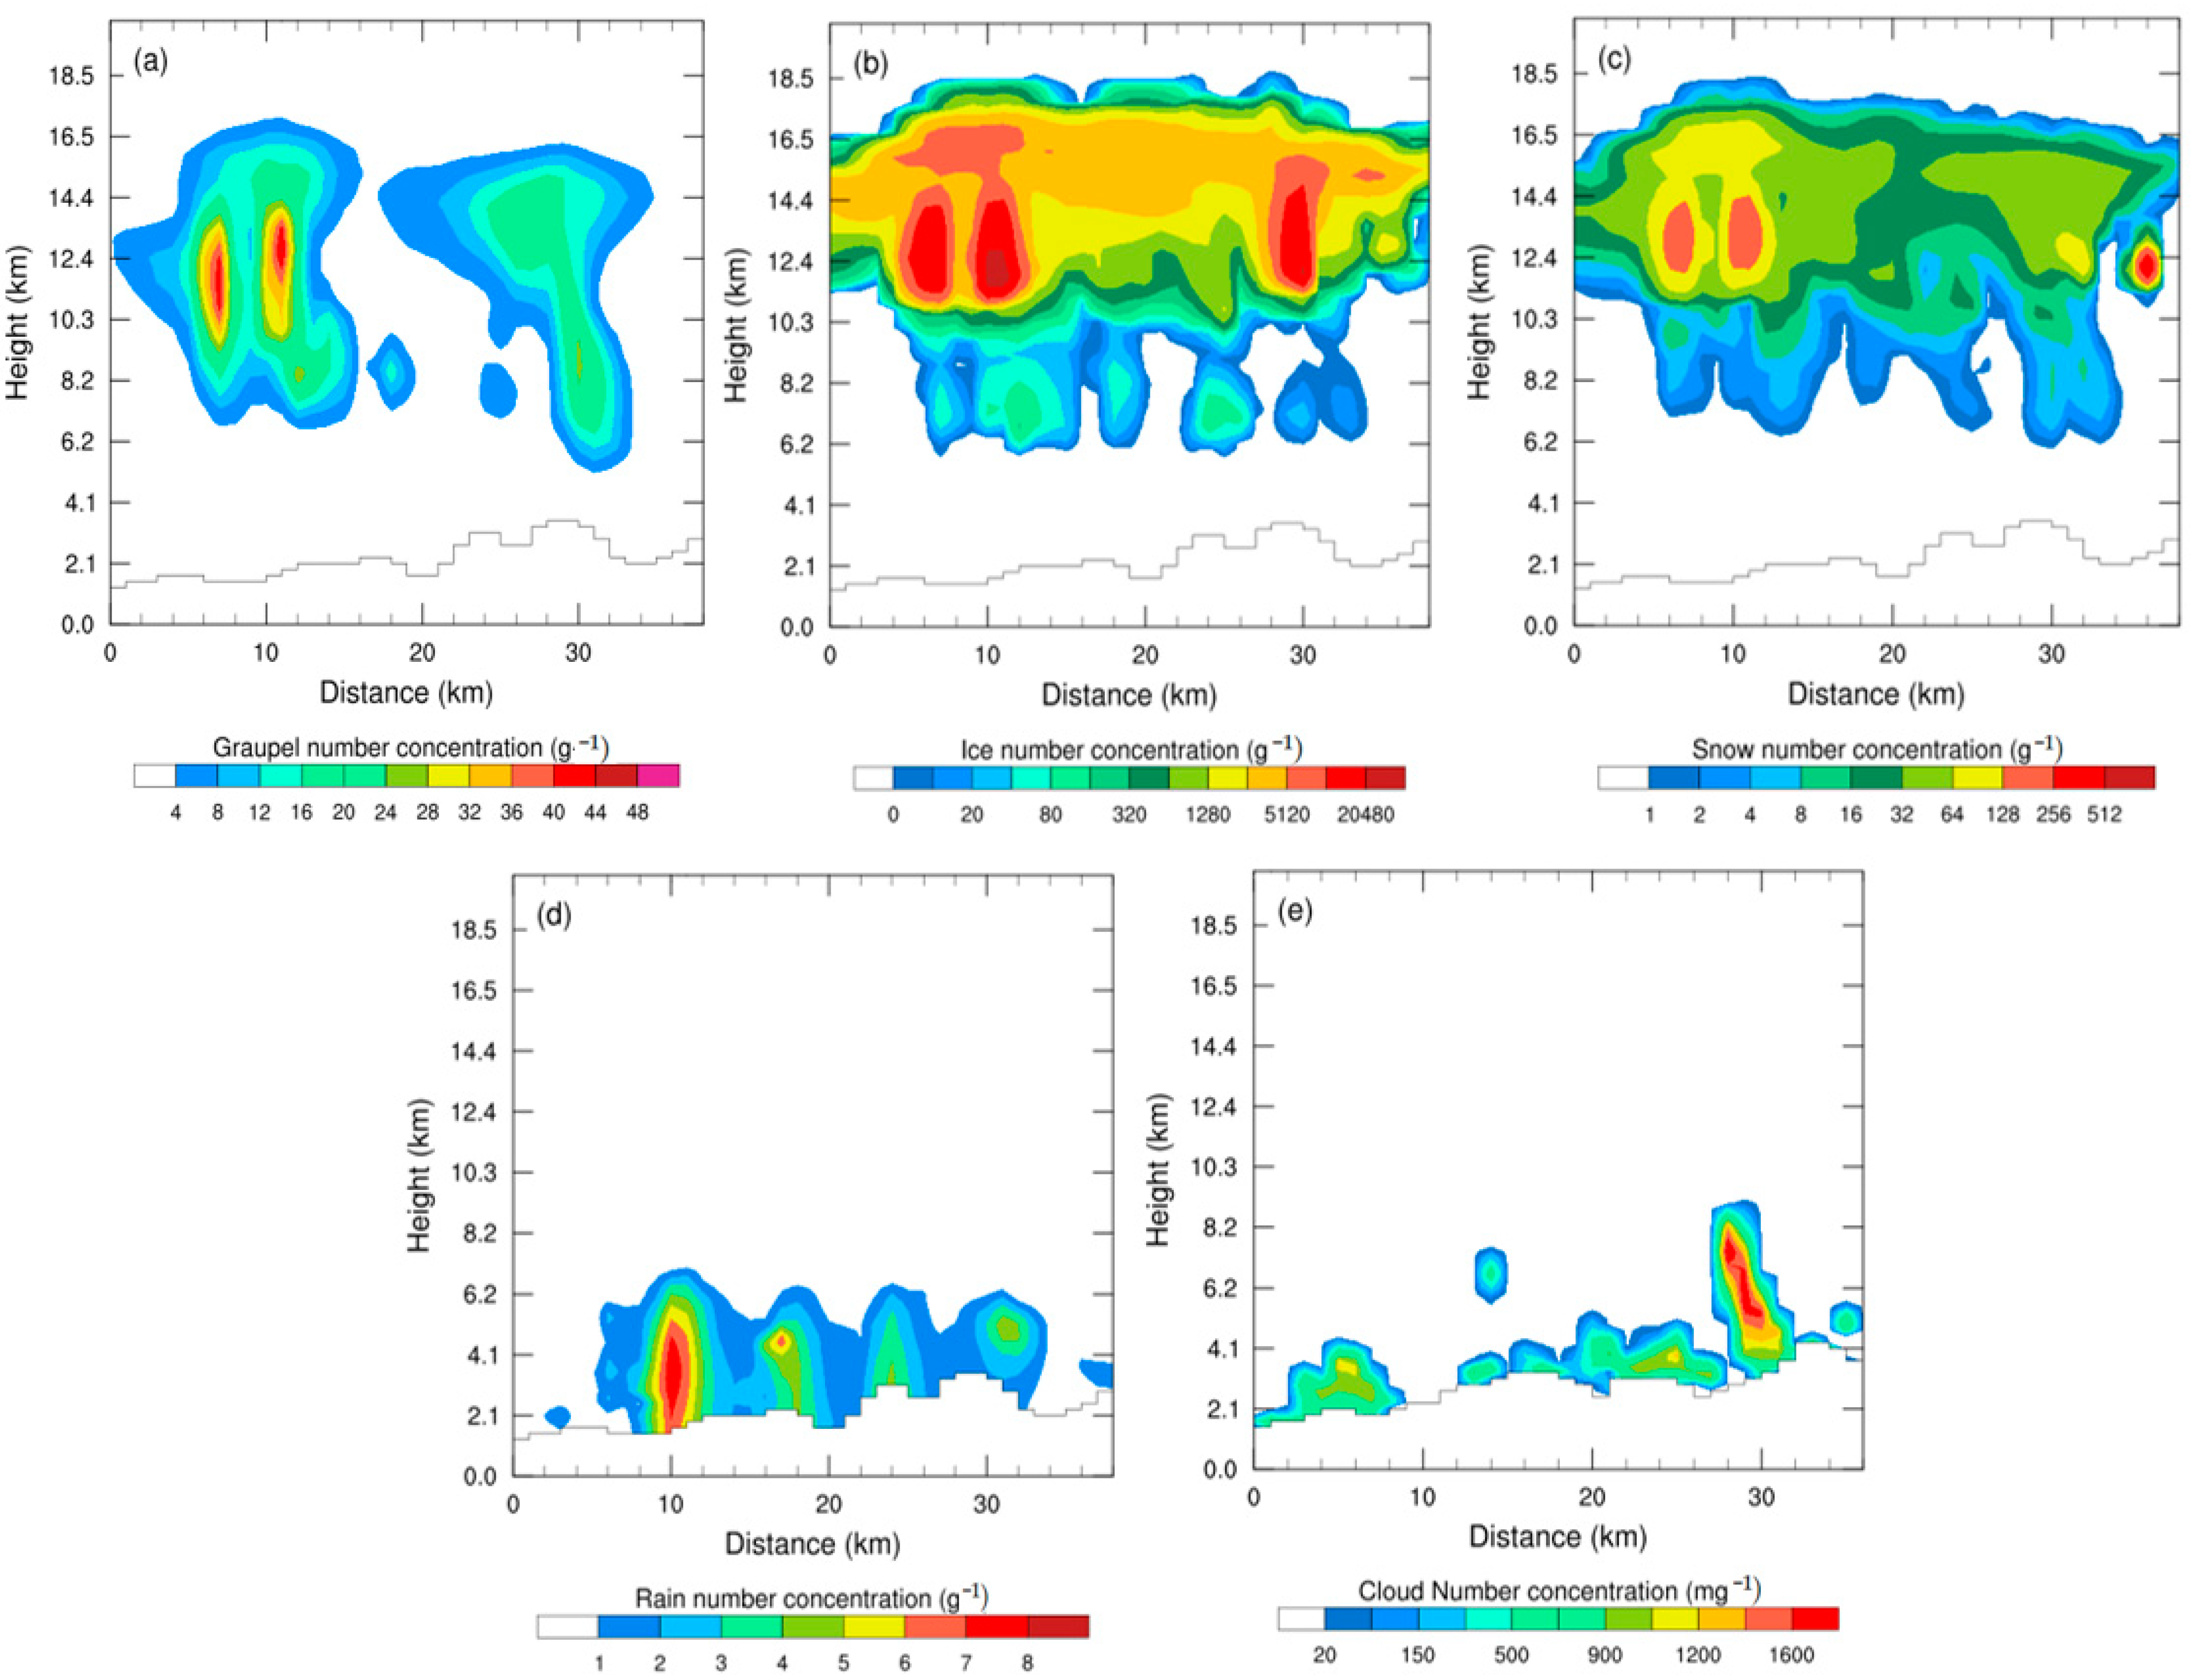
4.2. Microphysical Characteristics Analysis

The thunderstorm in the vigorous developing stage at 14:00 UTC is adopted to make a vertical cross-section along the strong radar echo area in the WRF model (Figure 2a), and the microscopic characteristics of thunderstorms in the Sichuan Basin are discussed. The charge carriers in thunderstorms are various hydrometeors, and the electrification and charge structure of thunderstorms are determined by the distribution of the mixing ratio and the number concentration of particles [40]. Therefore, analyzing the characteristics of hydrometeors is an important means to study the microscopic characteristics of thunderstorms.
The duration of the thunderstorm cell from initial appearance to extinction is about 3 h. During the period from 14:00 UTC to 15:00 UTC, the thunderstorm showed a stage of vigorous development to maturity, and the strong echo area increased gradually with the maximum intensity of radar echo of about 55 dBZ. Since the non-inductive electrification mechanism used mainly considers the collisions and separation of ice-graupel and snow-graupel particles, the distribution and the number concentration of graupel particles, ice crystals, and snow particles play a key role in the electrification process.
The vertical distribution of graupel particles (Figure 5a) ranged from 6 to 16 km at 14:00 UTC with a maximum mixing ratio of 7.9 g·kg−1. The ice crystal particles (Figure 5b) are mainly distributed at 11 to 16 km altitude, with the highest distribution altitude of about 13 km with a maximum value of 0.82 g·kg−1. The distribution altitude of snow particles (Figure 5c) is consistent with that of graupel particles at 6 to 16 km with a maximum value of 0.28 g·kg−1. Snow particles are polymers of ice crystals, water, and other substances, so the morphology of the snow particles and ice particles are more consistent in the vertical distribution, but the altitude of the snow particles is generally lower than the ice crystal particles. The cloud droplet (Figure 5d) distribution is at an altitude range of 3 to 10 km with a maximum mixing ratio of 2.0 g·kg−1. The raindrops (Figure 5e) have a low vertical distribution altitude of less than 6 km with a maximum value mixing ratio of 5.79 g·kg−1, which is more consistent with the vertical profile of the strong radar reflectivity. The strong echo region of the reflectivity (Figure 5f) is wide with a maximum value of 54.7 dBZ, and the echo top is up to 16 km. From the vertical profile of the mixing ratio of hydrometeors in thunderstorms, it can be seen that when thunderstorms develop vigorously, the mixing ratio of particles is relatively large, which is extremely beneficial to the electrification process of thunderstorms.
Figure 6 shows the vertical profile of hydrometeor number concentration at the same time and location in Figure 5. The number concentration of graupel particles (Figure 6a) is generally distributed from 7 to 16 km and the center of vertical distribution altitude is about 12 km with a maximum value of 45.16 g−1. The shape and distribution height of the number concentration of the ice crystals (Figure 6b) and snow particles (Figure 6c) are greatly similar in the vertical direction. The number concentration vertical distribution of ice crystals and snow particles is mainly at the altitude of 10 to 16 km, there are also at 6 to 10 km, where the particle number concentration is generally lower. The number concentration of snow particles is much lower than that of ice crystals, and the maximum values of both particles are 26,496.3 g−1 and 447.29 g−1, respectively. The vertical distribution altitude of raindrops (Figure 6d) is below 6 km with a maximum number concentration of 7.91 g−1. The distribution altitude of cloud droplets (Figure 6e) is generally below 8 km with a maximum number concentration of 1905.93 mg−1, and it is significantly higher at the altitude of 6 km than at other regions, this indicates that a strong updraft transports cloud droplets to higher altitudes with stronger convective activity.
The electrification process of thunderstorms depends on the interaction of ice-phase particles including ice crystals, snow, and graupel particles, in which the collisions and separation of ice-graupel and snow-graupel particles play a decisive role. From the distribution altitude and the number concentration of ice-phase particles, it can be seen that the collision area of the ice-graupel and snow-graupel is mainly at 6 to 15 km altitude, i.e., the distribution position of the electrification area.

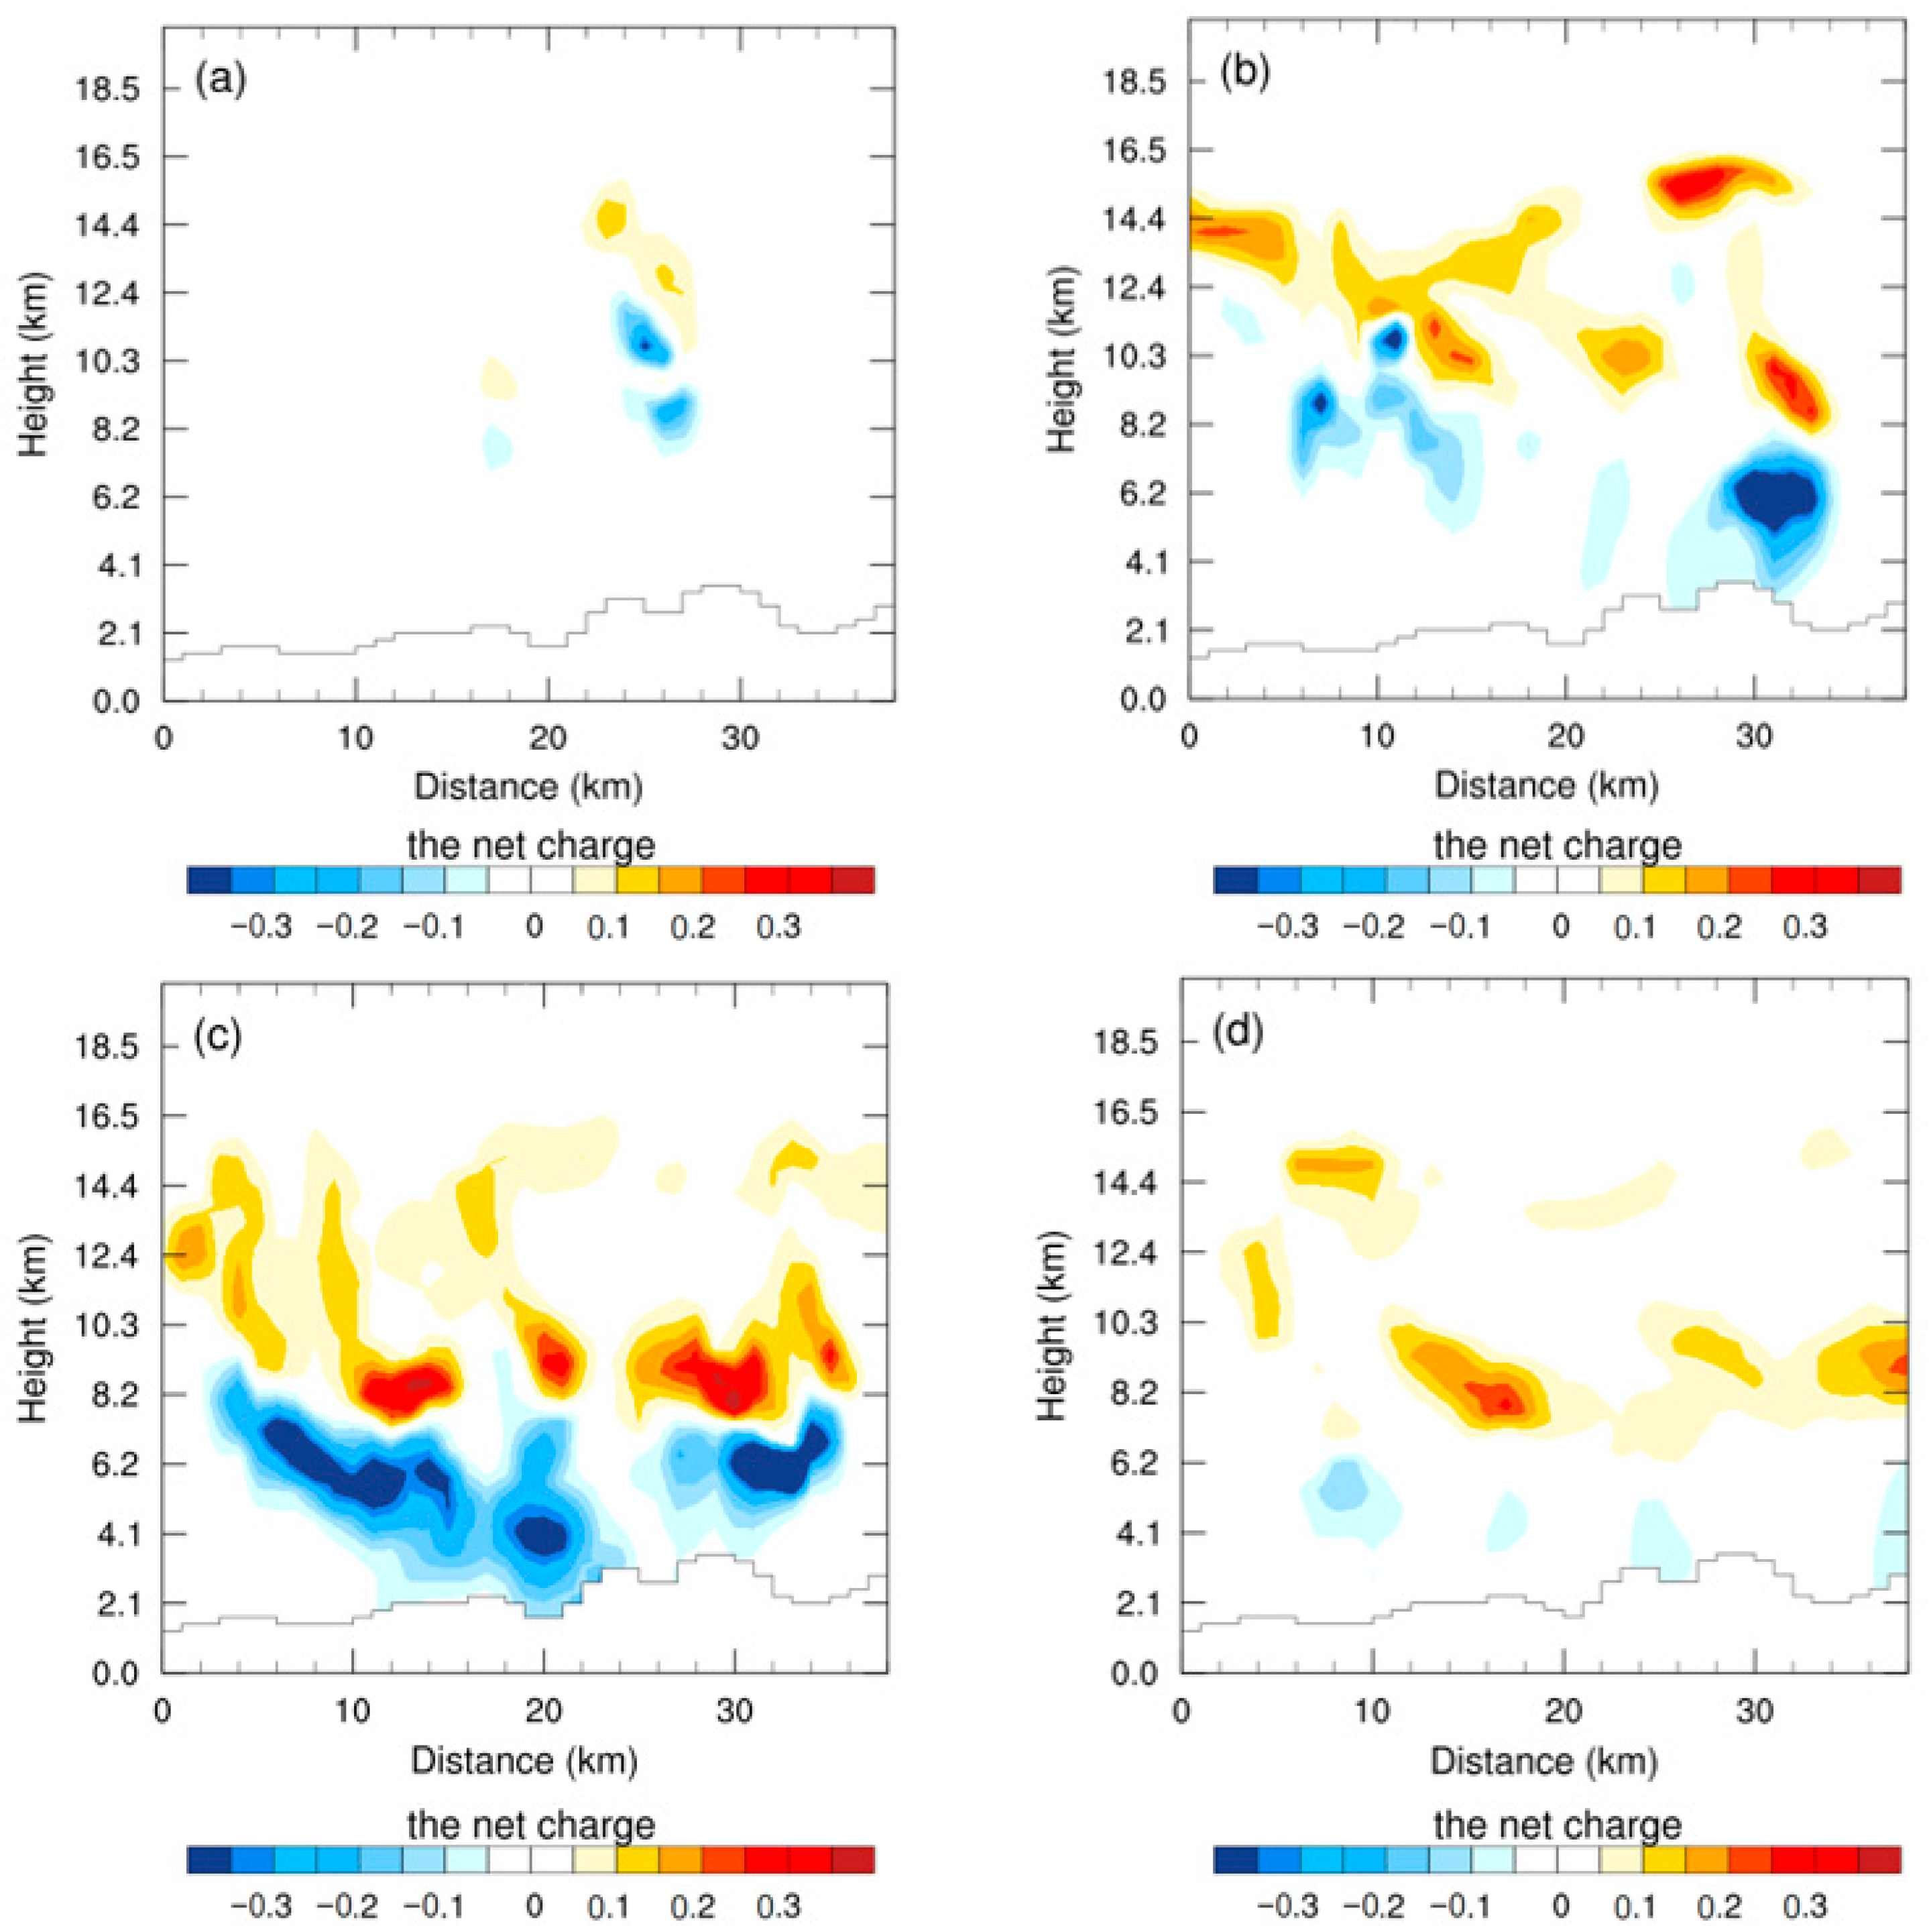
4.3. Charge Structure

Figure 7 shows the vertical profile of the charge density of ice crystals, snow particles, and graupel particles at 14:00 UTC. The collisions and separation of ice-graupel and snow-graupel particles mainly occur at the altitudes of 6 to 15 km, which is well consistent with the distribution area of ice-phase particles number concentration, but the maximum charge density of graupel particles and ice crystals is much larger than that of snow particles. The charge density of graupel particles (Figure 7a), the distribution height below 14 km with the maximum negative charge density of −4.21 nC m−3, mainly carries negative charges after colliding with ice crystals and snow particles. The charge density of ice crystals (Figure 7b) mainly carries positive charges after collisions and separation with the maximum positive charge density of 4.34 nC m−3. The distribution of ice crystals with charge is at the altitude of 6 to 15 km, and there are no ice crystals with a charge above 15 km. This may be considered that the position of ice-phase particles plays a decisive role in the generation of positive and negative charges in collision and separation. Snow particles (Figure 7c) mainly carry positive charges after collision and separation with the maximum positive charge density of 0.065 nC m−3.
The charge density of 13:00 UTC to 16:00 UTC is used to analyze the thunderstorm charge structure from initial appearance to extinction. Each stage of the thunderstorm presents a dipole charge structure with an upper positive charge center and a lower negative charge center by the vertical profile of net charge (Figure 8). According to the mixing ratio, number concentration, and charging of ice-phase particles, the positive charge region is mainly determined by the charge density of ice crystals and snow particles. The distribution height of the positive charge is mainly at the altitude of 8 to 15 km with the maximum positive charge of 0.41 nC m−3 at 15:00 UTC. The negative charge area is mainly determined by the charge density of graupel particles. The distribution height of the negative charge in the mature period is below 8 km with a maximum negative charge of −1.01 nC m−3. The distribution height of the negative charge area gradually decreases with the development of the thunderstorm cell, and the negative charge region in the lower part of the thunderstorm gradually contacts the ground from maturity to extinction.

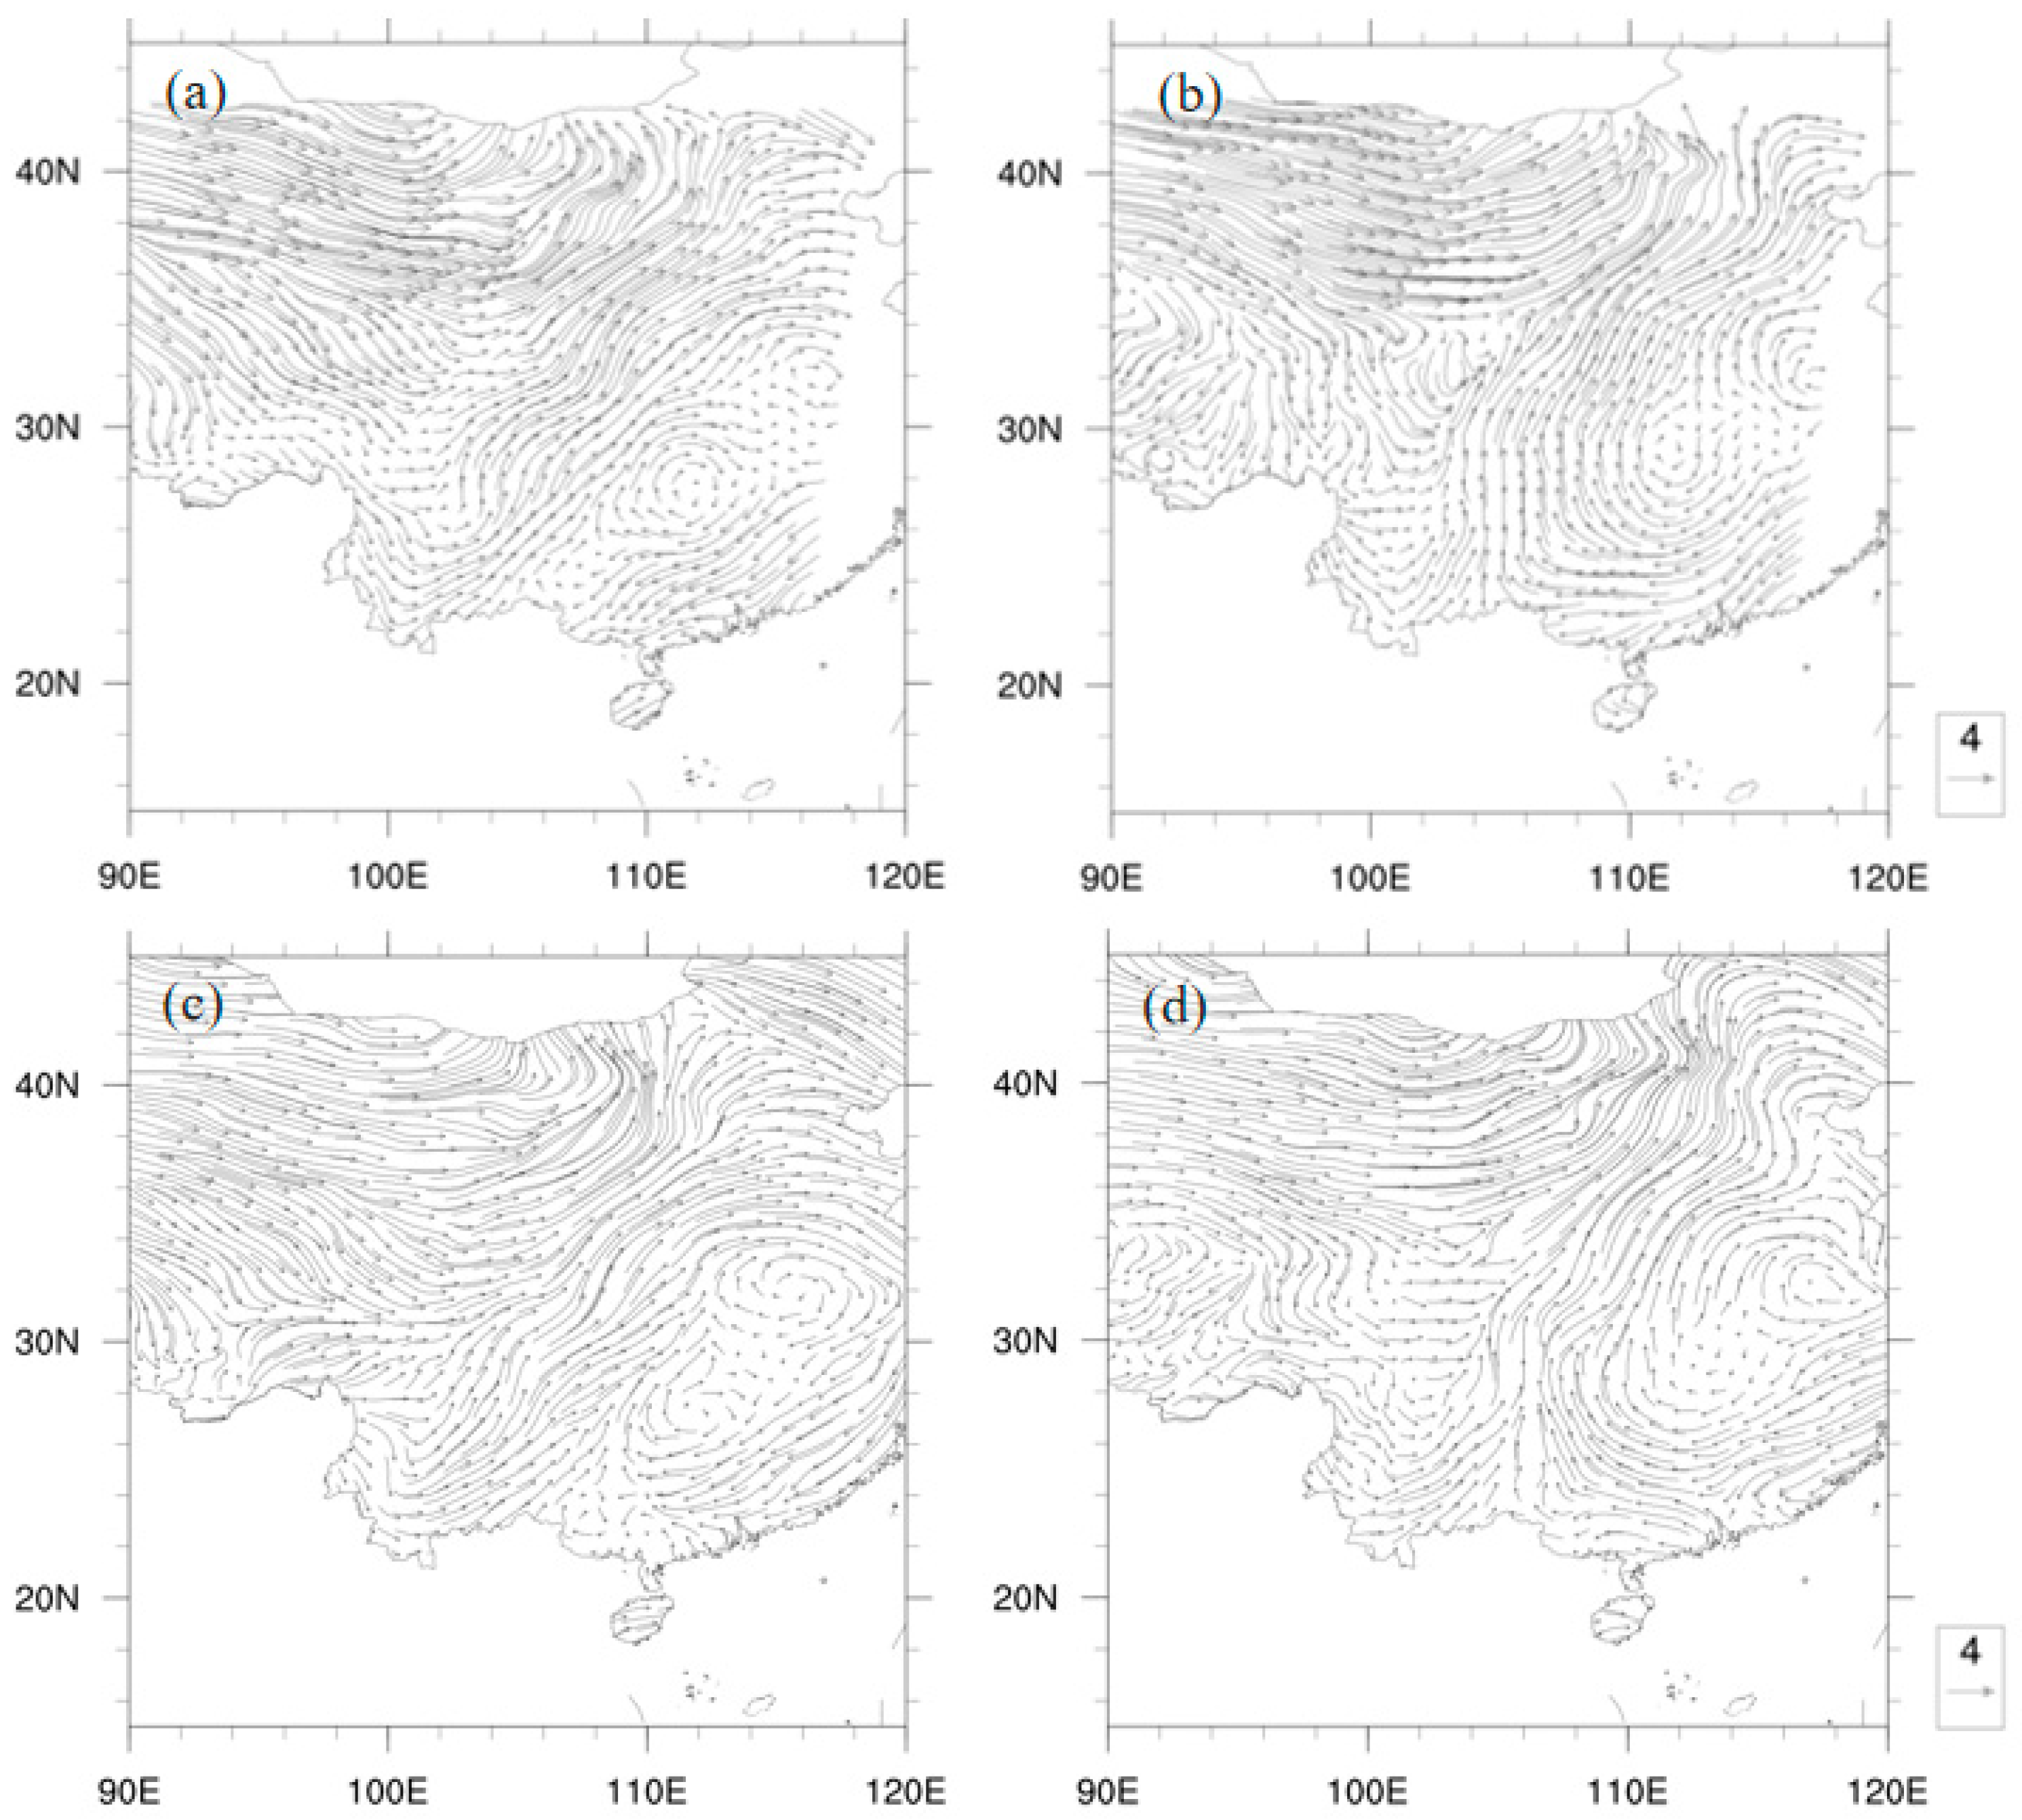
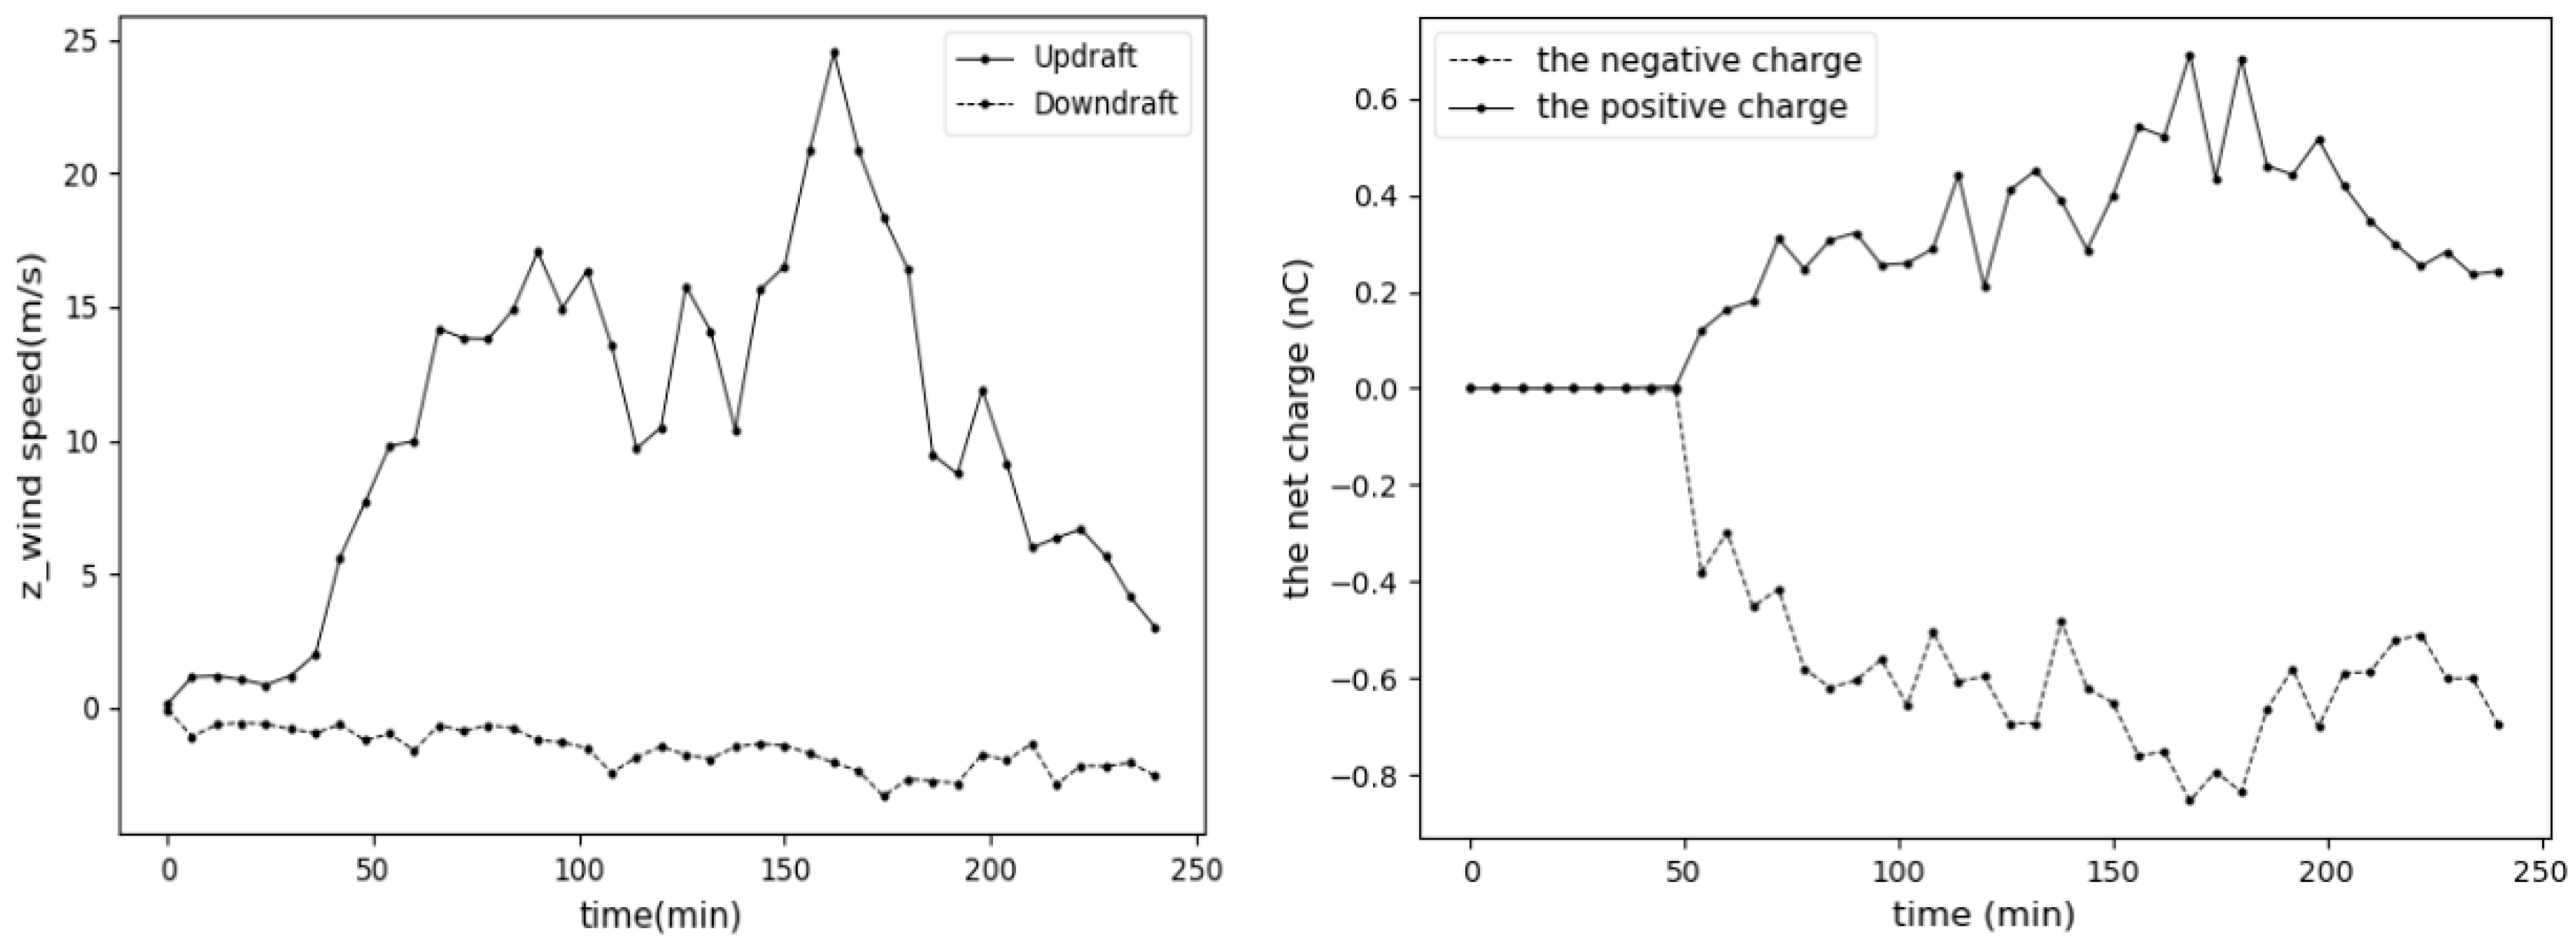
4.4. The Updraft and Downdraft

The updraft and downdraft in thunderstorms determine the vertical distribution height of the mixing ratio and the number concentration of hydrometeors [41], which affect the transport, collision, and consumption of particles, thus affecting the charge structure and lightning discharge characteristics in thunderstorms. This paragraph will analyze the vertical updraft and downdraft in different stages of the thunderstorm dynamic evolution process.
At the beginning of the thunderstorm cell generation stage (Figure 9a), the strong radar echo area is the core area of the strong updraft below 12 km. The pseudo-equivalent potential temperature, which is the potential temperature after all the water vapor condenses and falls [42], changes significantly with the updraft. In the vigorous developing stage (Figure 9b), the radar echo height increases to more than 16 km, and the strong echo area is also affected and gets to 12 km with the increase in the updraft. In the mature stage of the thunderstorm cell (Figure 9c), the distribution height of strong echo rises from 6 to 14 km by the influence of the updraft. The maximum reflectivity of radar echo is larger than 45 dBZ, and there is a certain downdraft under the thunderstorm cell. The simulated output indicates that a large number of charged hydrometeors fall into the cloud to produce precipitation in the mature late stage of the thunderstorm cell. In the extinction stage of the thunderstorm cell (Figure 9d), the radar echo top height decreased significantly with the velocity decreasing of updraft and downdraft.
In strong convective weather, if the vertical updraft velocity is greater, the discharge process of the collision and separation of the ice-phase particles is stronger, and the frequency of lightning occurrence is larger. Figure 10 shows the evolution of the maximum vertical velocity, positive charge density, and negative charge density with time. The 12:00 UTC on the horizontal axis is recorded as zero minutes, and the updraft is small in the thunderstorm cell at this time. The thunderstorm cell begins to develop gradually with the increasing updraft at 12:42 UTC, and the ice-phase particles collided and separated under the influence of the updraft. The maximum charge density of ice-phase particles increases after the process of collision and separation. From the 108th minute (about 13:48 UTC) to the 162nd minute (about 14:42 UTC), the updraft velocity increased significantly, and the maximum net charge density also increased significantly. These results show that the thunderstorm cell developed vigorously in this period and then evolved into the mature stage after 14:10 UTC. The updraft is strong with generated intense discharge activity in the cell during the mature stage. At the same time, the velocity of the downdraft under the thunderstorm cell gradually increases and leads to the hydrometeors gradually falling and forming precipitation.

5. Results and Discussion

Based on the WRF model, the non-inductive electrification mechanism and the discharge parameterization process are coupled in the Morrison Two-Moment scheme to simulate a strong thunderstorm process in Sichuan Basin on 21 July 2019. The reliability of the WRF model in simulating strong convective weather is validated, and the microphysical and dynamic processes of the thunderstorm are analyzed. The conclusions are as follows.
(1)
The simulation results of the WRF model are correlated with the observed radar reflectivity, lightning characteristics, and the wind field environment in the thunderstorm process, indicating that the WRF model has the ability to reproduce this thunderstorm process in the Sichuan Basin.
(2)
The higher content of hydrometeors and stronger convective development in the thunderstorm cell are very favorable to the electrical process of thunderstorms and contribute to the formation of a stable charge structure. Discovered by simulation based on the WRF model, the graupel particles mainly distribute at the height of 8 to 15 km, the shape and distribution height of the number concentration of ice crystals and snow particles is greatly the same, and the distribution height can reach more than 16 km. The core of the electrification area corresponds well with the hydrometeors.
(3)
With collisions and separation of ice-phase particles, graupel particles mainly carry negative charges, while ice crystals and snow particles mainly carry positive charges. The charge density of snow particles is generally lower than that of ice crystals and graupel particles. From the perspective of time evolution, each stage of the thunderstorm cell presents a typical dipole charge structure.
(4)
Lightning activity is affected by the updraft and downdraft, and the updraft velocity plays a key role in the distribution of ice-phase particles. With the higher velocity of the updraft in a thunderstorm, the discharge is stronger during the collisional and separation of ice-phase particles. There is a certain downdraft under the thunderstorm cell which pulls down a huge amount of charged hydrometeors to form precipitation in the late mature stage of the thunderstorm.
In this paper, the microphysical and dynamic processes of the thunderstorm cell are analyzed with numerical simulation in the Sichuan Basin under special terrain. The results of the simulation are consistent well with the observation. The electrical coupling of the WRF model can be used to analyze the electrical process of thunderstorm cells in the Sichuan Basin, and the relationships among the hydrometeors, electrical processes, and charge structure are discussed in the electrical process of thunderstorm cells. The updraft affects the collision and separation of hydrometeors, which is most closely related to the charging density and lightning. However, there are great differences in the charge structure and discharge mechanism of different types of thunderstorms in different regions, and the terrain in the western Sichuan Basin is complex and changeable. This study only analyzed a single case of a thunderstorm in the Sichuan Basin. The edge areas of the Sichuan Basin are mostly mountainous areas with complex topography, and the general applicability of the WRF model to other thunderstorm processes in various regions of the Sichuan Basin also needs to be verified by a large number of cases.
Several researchers [43,44] have studied the dynamics and microphysical processes during the development of thunderstorms, indicating that hydrometeors are the main carriers of charge in thunderstorms and that the charge structure is related to the amount of charge and charge polarity carried by hydrometeors. Miller et al. [45] pointed out that the concentration of graupel particles is one of the most important factors affecting thunderstorm activity. The electrification process is mainly caused by the collision and separation of graupel particles with ice crystals or snow particles, while the collision and separation of hydrometeors mainly depend on the updraft. Many previous studies have simulated the electrical activities of squall lines and supercells in China [16,17]. The simulation results are consistent with previous observations and simulation studies [6,46,47], the thunderstorm cell is a dipole charge structure, the collision and separation of ice-phase particles determine the charge distribution, and the updraft is closely related to the charge density. With the in-depth study of thunderstorms by scholars, a reasonable and complete electrical parameterization scheme is an urgent need for numerical simulation of thunderstorm processes under special terrain in the future.

Author Contributions

Z.G. and J.Z. conceived and designed the study. P.Z. improved the WRF model coupled with electrical processes. J.Z. wrote the manuscript. P.Z. and Z.G. revised the first draft paper. J.Z. and Z.Y. configure the WRF model. M.H. and D.S. processed the data. Z.G., J.Z. and P.Z. interpreted the study’s implications and provided discussion and future research suggestions. All authors have read and agreed to the published version of the manuscript.

Funding

This research was jointly supported by the Sichuan Science and Technology Support Program (2022YFG0234), the National Natural Science Foundation of China (42075001, 41905126), the Sichuan Science and Technology Support Program (2021YJ0393), and the Technological Innovation Capacity Enhancement Program of Chengdu University of Information Technology (KYQN202201).

Institutional Review Board Statement

Not applicable.

Informed Consent Statement

Not applicable.

Data Availability Statement

The public data of the FNL can be downloaded from https://doi.org/10.5065/D6M043C6 (accessed on 21 July 2019), and other data are available by contacting the corresponding author.

Acknowledgments

The authors would like to express their sincere thanks to the Sichuan Provincial Meteorological Service Center for providing the research data used in this study.

Conflicts of Interest

The authors declare no conflict of interest.

References

  1. Seity, Y.; Soula, S.; Sauvageot, H. Lightning and precipitation relationship in coastal thunderstorms. J. Geophys. Res. 2001, 106, 22801–22816. [Google Scholar] [CrossRef]
  2. Price, C.G. Lightning Applications in Weather and Climate Research. Surv. Geophys. 2013, 34, 755–767. [Google Scholar] [CrossRef]
  3. Zhao, P.; Xiao, H.; Liu, C.; Zhou, Y.; Xu, X.; Hao, K. Evaluating a simple proxy for climatic cloud-to-ground lightning in Sichuan Province with complex terrain, Southwest China. Int. J. Climatol. 2021, 42, 3909–3927. [Google Scholar] [CrossRef]
  4. Zhao, P.; Xiao, H.; Liu, C.; Zhou, Y. Dependence of Warm Season Cloud-to-Ground Lightning Polarity on Environmental Conditions over Sichuan, Southwest China. Adv. Meteorol. 2021, 2021, 1500470. [Google Scholar] [CrossRef]
  5. Wu, B.; Verlinde, J.; Sun, J. Dynamical and microphysical retrievals from Doppler radar observations of a deep convective cloud. J. Atmos. Sci. 2000, 57, 262–283. [Google Scholar] [CrossRef]
  6. Zhang, Y.; Liu, X.; Xiao, Q. An analysis of characteristics of thunderstorm and artificially triggered lightning in the north and south of China. Plateau Meteorol. 1997, 16, 113–121. (In Chinese) [Google Scholar]
  7. Cui, H.H.; Qie, X.S.; Zhang, Q.L.; Zhang, Y.L.; Zhang, G.S.; Zhao, Y.; Kong, X.Z.; Yuan, T.; Yang, J.; Zhang, T. Equivalent electrical discharge structure of thunderstorm and simultaneous observation of multi-station of cloud flashes in Zhongchuan of Gansu. Plateau Meteorol. 2009, 28, 808–815. (In Chinese) [Google Scholar]
  8. Zheng, D.; Zhang, Y.; Meng, Q.; Lu, W.; Zhong, M. Lightning activity and electrical structure in a thunderstorm that continued for more than 24 h. Atmos. Res. 2010, 97, 241–256. [Google Scholar] [CrossRef]
  9. Li, Y.; Zhang, G.; Wen, J.; Wang, D.; Wang, Y.; Zhang, T.; Fan, X.; Wu, B. Electrical structure of a Qinghai–Tibet Plateau thunderstorm based on three-dimensional lightning mapping. Atmos. Res. 2013, 134, 137–149. [Google Scholar] [CrossRef]
  10. Mason, B.J. The generation of electric charges and fields in thunderstorms. Proc. R. Soc. A Math. Phys. Eng. Sci. 1988, 415, 303–315. [Google Scholar] [CrossRef]
  11. Rust, W.D.; Marshall, T.C. On abandoning the thunderstorm tripole-charge paradigm. J. Geophys. Res. 1996, 101, 23499–23504. [Google Scholar] [CrossRef]
  12. Ziegler, C.L.; MacGorman, D.R.; Dye, J.E.; Ray, P.S. A model evaluation of noninductive graupel-ice charging in the early electrification of a mountain thunderstorm. J. Geophys. Res. Atmos. 1991, 96, 12833–12855. [Google Scholar] [CrossRef]
  13. Zhao, P.; Yin, Y.; Xiao, H. The effects of aerosol on development of thunderstorm electrification: A numerical study. Atmos. Res. 2015, 153, 376–391. [Google Scholar] [CrossRef]
  14. Tan, Y.; Tao, S.; Liang, Z.; Zhu, B. Numerical study on relationship between lightning types and distribution of space charge and electric potential. J. Geophys. Res. Atmos. 2014, 119, 1003–1014. [Google Scholar] [CrossRef]
  15. Sun, L.; Qie, X.; Mansell, E.R.; Chen, Z.; Xu, Y.; Jiang, R.; Sun, Z. Feedback effect of electric field force on electrification and charge structure in thunderstorm. Acta Phys. Sin. 2018, 67, 169201. [Google Scholar] [CrossRef]
  16. Xu, L.; Zhang, Y.; Wang, F.; Zheng, D. Simulation of the electrification of a tropical cyclone using the WRF-ARW model: An idealized case. J. Meteorol. Res. 2014, 28, 453–468. [Google Scholar] [CrossRef]
  17. Chen, Z.; Qie, X.; Yair, Y.; Liu, D.; Xiao, X.; Wang, D.; Yuan, S. Electrical evolution of a rapidly developing MCS during its vigorous vertical growth phase. Atmos. Res. 2020, 246, 105201. [Google Scholar] [CrossRef]
  18. Li, P.; Zhai, G.; Pang, W.; Hui, W.; Zhang, W.; Chen, J.; Zhang, L. Preliminary Research on a Comparison and Evaluation of FY-4A LMI and ADTD Data through a Moving Amplification Matching Algorithm. Remote Sens. 2020, 13, 11. [Google Scholar] [CrossRef]
  19. Liu, Y.; Wang, H.; Li, Z.; Wang, Z. A verification of the lightning detection data from FY-4A LMI as compared with ADTD-2. Atmos. Res. 2021, 248, 105163. [Google Scholar] [CrossRef]
  20. He, G.; Sun, J.; Ying, Z.; Zhang, L. A Radar Radial Velocity Dealiasing Algorithm for Radar Data Assimilation and Its Evaluation with Observations from Multiple Radar Networks. Remote Sens. 2019, 11, 2457. [Google Scholar] [CrossRef] [Green Version]
  21. Wu, Z.; Huang, Y.; Zhang, Y.; Zhang, L.; Lei, H.; Zheng, H. Precipitation characteristics of typhoon Lekima (2019) at landfall revealed by joint observations from GPM satellite and S-band radar. Atmos. Res. 2021, 260, 105714. [Google Scholar] [CrossRef]
  22. Kalnay, E.; Kanamitsu, M.; Kistler, R.; Collins, W.; Deaven, D.; Gandin, L.; Iredell, M.; Saha, S.; White, G.; Woollen, J.; et al. The NMC/NCAR 40-year reanalysis project. Bull. Am. Meteorol. Soc. 1996, 77, 437–471. [Google Scholar] [CrossRef]
  23. Ren, J.; Xu, Z.; Chen, Q.; Zhang, Q. Climate Characteristics of Thunderstorm in Sichuan in Recent 54 years. Plateau Mt. Meteorol. Res. 2015, 35, 62–67. (In Chinese) [Google Scholar]
  24. Saunders, C.P.R.; Peck, S.L. Laboratory studies of the influence of the rime accretion rate on charge transfer during crystal/graupel collisions. J. Geophys. Res. 1998, 103, 13949–13956. [Google Scholar] [CrossRef]
  25. Morrison, H.; Gettelman, A. A New Two-Moment Bulk Stratiform Cloud Microphysics Scheme in the Community Atmosphere Model, Version 3 (CAM3). Part I: Description and Numerical Tests. J. Clim. 2008, 21, 3642–3659. [Google Scholar] [CrossRef]
  26. Mlawer, E.J.; Taubman, S.J.; Brown, P.D.; Iacono, M.J.; Clough, S.A. Radiative transfer for inhomogeneous atmospheres: RRTM, a validated correlated-k model for the longwave. J. Geophys. Res. 1997, 102, 16663–16682. [Google Scholar] [CrossRef] [Green Version]
  27. Dudhia, J. Numerical study of Convection Observed during the Winter Monsoon Experiment Using a Mesoscale Two-Dimensional Model. J. Atmos. Sci. 1989, 46, 3077–3107. [Google Scholar] [CrossRef]
  28. Chen, F.; Mitchell, K.; Schaake, J.; Xue, Y.; Pan, H.L.; Koren, V.; Duan, Q.Y.; Ek, M.; Betts, A. Modeling of land surface evaporation by four schemes and comparison with FIFE observations. J. Geophys. Res. 1996, 101, 7251–7268. [Google Scholar] [CrossRef] [Green Version]
  29. Hu, X.M.; Nielsen-Gammon, J.W.; Zhang, F. Evaluation of Three Planetary Boundary Layer Schemes in the WRF Model. J. Appl. Meteorol. Climatol. 2010, 49, 1831–1844. [Google Scholar] [CrossRef] [Green Version]
  30. Kain, J.S.; Fritsch, J.M. A One-Dimensional Entraining/Detraining Plume Model and Its Application in Convective Parameterization. J. Atmos. Sci. 1990, 47, 2784–2802. [Google Scholar] [CrossRef]
  31. Kain, J.S.; Fritsch, J.M. Convective Parameterization for Mesoscale Models: The Kain-Fritsch Scheme. In The Representation of Cumulus Convection in Numerical Models; Springer: Berlin/Heidelberg, Germany, 1993; pp. 165–170. [Google Scholar] [CrossRef]
  32. Lin, Y.; Farley, R.D.; Orville, H.D. Bulk Parameterization of the Snow Field in a Cloud Model. J. Clim. Appl. Meteorol. 1983, 22, 1065–1092. [Google Scholar] [CrossRef]
  33. Mansell, E.R.; MacGorman, D.R.; Ziegler, C.L.; Straka, J.M. Simulated three-dimensional branched lighting in a numerical thunderstorm model. J. Geophys. Res. 2002, 107, 4075. [Google Scholar] [CrossRef] [Green Version]
  34. Mansell, E.R.; MacGorman, D.R.; Ziegler, C.L.; Straka, J.M. Charge structure and lightning sensitivity in a simulated multicell thunderstorm. J. Geophys. Res. 2005, 110, D12101. [Google Scholar] [CrossRef] [Green Version]
  35. Rosenfeld, D.; Woodley, W.L. Deep convective clouds with sustained supercooled liquid water down to −37.5 °C. Nature 2000, 405, 440–442. [Google Scholar] [CrossRef]
  36. Marshall, T.C.; MacCarthy, M.P.; Rust, W.D. Electric field magnitudes and lightning initiation in thunderstorms. J. Geophys. Res. 1995, 100, 7097–7103. [Google Scholar] [CrossRef]
  37. Kuo, Y.; Cheng, L.; Bao, J. Numerical Simulation of the 1981 Sichuan Flood. Part I: Evolution of a Mesoscale Southwest Vortex. Mon. Weather Rev. 1988, 116, 2481–2504. [Google Scholar] [CrossRef]
  38. Yu, S.; Gao, W.; Xiao, D.; Peng, J. Observational facts regarding the joint activities of the southwest vortex and plateau vortex after its departure from the Tibetan Plateau. Adv. Atmos. Sci. 2016, 33, 34–46. [Google Scholar] [CrossRef]
  39. Giovanni, G. Reliability of ERA5 Reanalysis Data for Wind Resource Assessment: A Comparison against Tall Towers. Energies 2021, 14, 4169. [Google Scholar] [CrossRef]
  40. Zhao, P.; Zhang, Y.; Liu, C.; Zhang, P.; Xiao, H.; Zhou, Y. Potential Relationship Between Aerosols and Positive Cloud-to-Ground Lightning During the Warm Season in Sichuan, Southwest China. Front. Environ. Sci. 2022, 10, 945100. [Google Scholar] [CrossRef]
  41. Rajeevan, M.; Kesarkar, A.; Thampi, S.B.; Rao, T.N.; Radhakrishna, B.; Rajasekhar, M. Sensitivity of WRF cloud microphysics to simulations of a severe thunderstorm event over Southeast India. Ann. Geophys. 2010, 28, 603–619. [Google Scholar] [CrossRef]
  42. Lu, J.; Feng, T.; Li, J.; Cai, Z.; Xu, X.; Li, L.; Li, J. Impact of assimilating Himawari-8 derived layered precipitable water with varying cumulus and microphysics parameterization schemes on the simulation of Typhoon Hato. J. Geophys. Res. Atmos. 2019, 124, 3050–3071. [Google Scholar] [CrossRef]
  43. Williams, E.; Mushtak, V.; Rosenfeld, D.; Goodman, S.; Boccippio, D. Thermodynamic conditions favorable to superlative thunderstorm updraft, mixed phase microphysics and lightning flash rate. Atmos. Res. 2005, 76, 288–306. [Google Scholar] [CrossRef]
  44. Yang, J.; Zhao, K.; Zheng, Y.; Chen, H.; Chen, G. Microphysical Structure of Thunderstorms and Their Lightning Activity During the mei-yu and Post-mei-yu Periods Over Nanjing, Yangtze River Delta. Geophys. Res. Lett. 2022, 49, e2022GL100952. [Google Scholar] [CrossRef]
  45. Miller, K.; Gadian, A.; Saunders, C.; Latham, J.; Christian, H. Modelling and observations of thundercloud electrification and lightning. Atmos. Res. 2001, 58, 89–115. [Google Scholar] [CrossRef]
  46. Wang, C.; Zheng, D.; Zhang, Y.; Liu, L. Relationship between lightning activity and vertical airflow characteristics in thunderstorms. Atmos. Res. 2017, 191, 12–19. [Google Scholar] [CrossRef]
  47. Wang, F.; Zhang, Y.; Zheng, D. Impact of updraft on neutralized charge rate by lightning in thunderstorms: A simulation case study. J. Meteorol. Res. 2015, 29, 997–1010. [Google Scholar] [CrossRef]
Figure 1. The atmospheric circulation at 15:00 UTC on 21 July 2019: (a) 500 hPa; (b) 850 hPa. The purple contour is the isobaric line (unit: gpm). The color scale indicates temperature (unit: °C).
Atmosphere 14 00574 g001
Figure 2. Radar reflectivity was observed and simulated at 14:00 UTC (a,c) and 15:00 UTC (b,d) on 21 July 2019: (a,b) simulation; (c,d) observation. The black line is the position of the vertical section line.
Atmosphere 14 00574 g002
Figure 3. Six-hour lightning data: (a) simulation: the dots of freq = 1, freq = 2, and freq ≥ 3 indicate that the sum of intracloud and cloud-to-ground lightning frequency per minute is equal to 1, equal to 2, and greater than or equal to 3; (b) observation: the dots of positive and negative indicate positive and negative cloud-to-ground lightning.
Atmosphere 14 00574 g003
Figure 4. The wind field environment of 500 hPa was simulated and observed at 12:00 UTC (a,c) and 18:00 UTC (b,d) on 21 July 2019: (a,b) simulation; (c,d) observation.
Atmosphere 14 00574 g004
Figure 5. Vertical cross-section of the mixing ratio of particles at 14:00 UTC: (a) the mixing ratio of graupel particles; (b) the mixing ratio of ice crystal; (c) the mixing ratio of snow particles; (d) the mixing ratio of cloud droplets; (e) the mixing ratio raindrops; (unit: g·kg−1); (f) the radar reflectivity (unit: dBZ).
Atmosphere 14 00574 g005
Figure 6. The vertical profile of particle number concentration is made along the profile at 14:00 UTC: (a) graupel particles; (b) Ice crystals; (c) Snow particles; (d) Raindrops; (unit: g−1); (e) Cloud droplets (unit: mg−1).
Atmosphere 14 00574 g006
Figure 7. The charge density vertical section at 1400 UTC: (a) graupel particles; (b) ice crystals; (c) snow particles, in nC m−3.
Atmosphere 14 00574 g007
Figure 8. The net charge density vertical section: (a) 13:00 UTC; (b) 14:00 UTC; (c) 15:00 UTC; (d) 16:00 UTC, in nC m−3.
Atmosphere 14 00574 g008
Figure 9. The updraft and downdraft vertical section: (a) 13:00, (b) 14:00, (c) 15:00, (d) 16:00, (UTC); blue line is pseudo-equivalent potential temperature line.
Atmosphere 14 00574 g009
Figure 10. The evolution of maximum vertical wind speed (left) and net charge (right) with time.
Atmosphere 14 00574 g010
Table 1. Values of constants B, a, and b are used in Equation (3).
PolarityCrystal Size/µmBab
Positived < 1554.92 × 10133.762.5
Positive155 < d < 4524.04 × 1061.92.5
Positived > 45252.80.442.5
Negatived ≤ 2535.24 × 1082.542.8
Negatived > 25324.00.52.8
Disclaimer/Publisher’s Note: The statements, opinions and data contained in all publications are solely those of the individual author(s) and contributor(s) and not of MDPI and/or the editor(s). MDPI and/or the editor(s) disclaim responsibility for any injury to people or property resulting from any ideas, methods, instructions or products referred to in the content.

