Comparison of 24 h Surface Ozone Forecast for Poland: CAMS Models vs. Simple Statistical Models with Limited Number of Input Parameters
Abstract
:1. Introduction
2. Materials and Methods
2.1. Site Description
2.2. Meteorological Conditions
2.3. Data Description
2.3.1. Ground-Based Stations
2.3.2. CAMS
2.4. Models
2.4.1. Multiple Regression Analysis
2.4.2. Artificial Neural Network
3. Results
3.1. Diurnal and Seasonal Cycles of Surface O3 Concentration
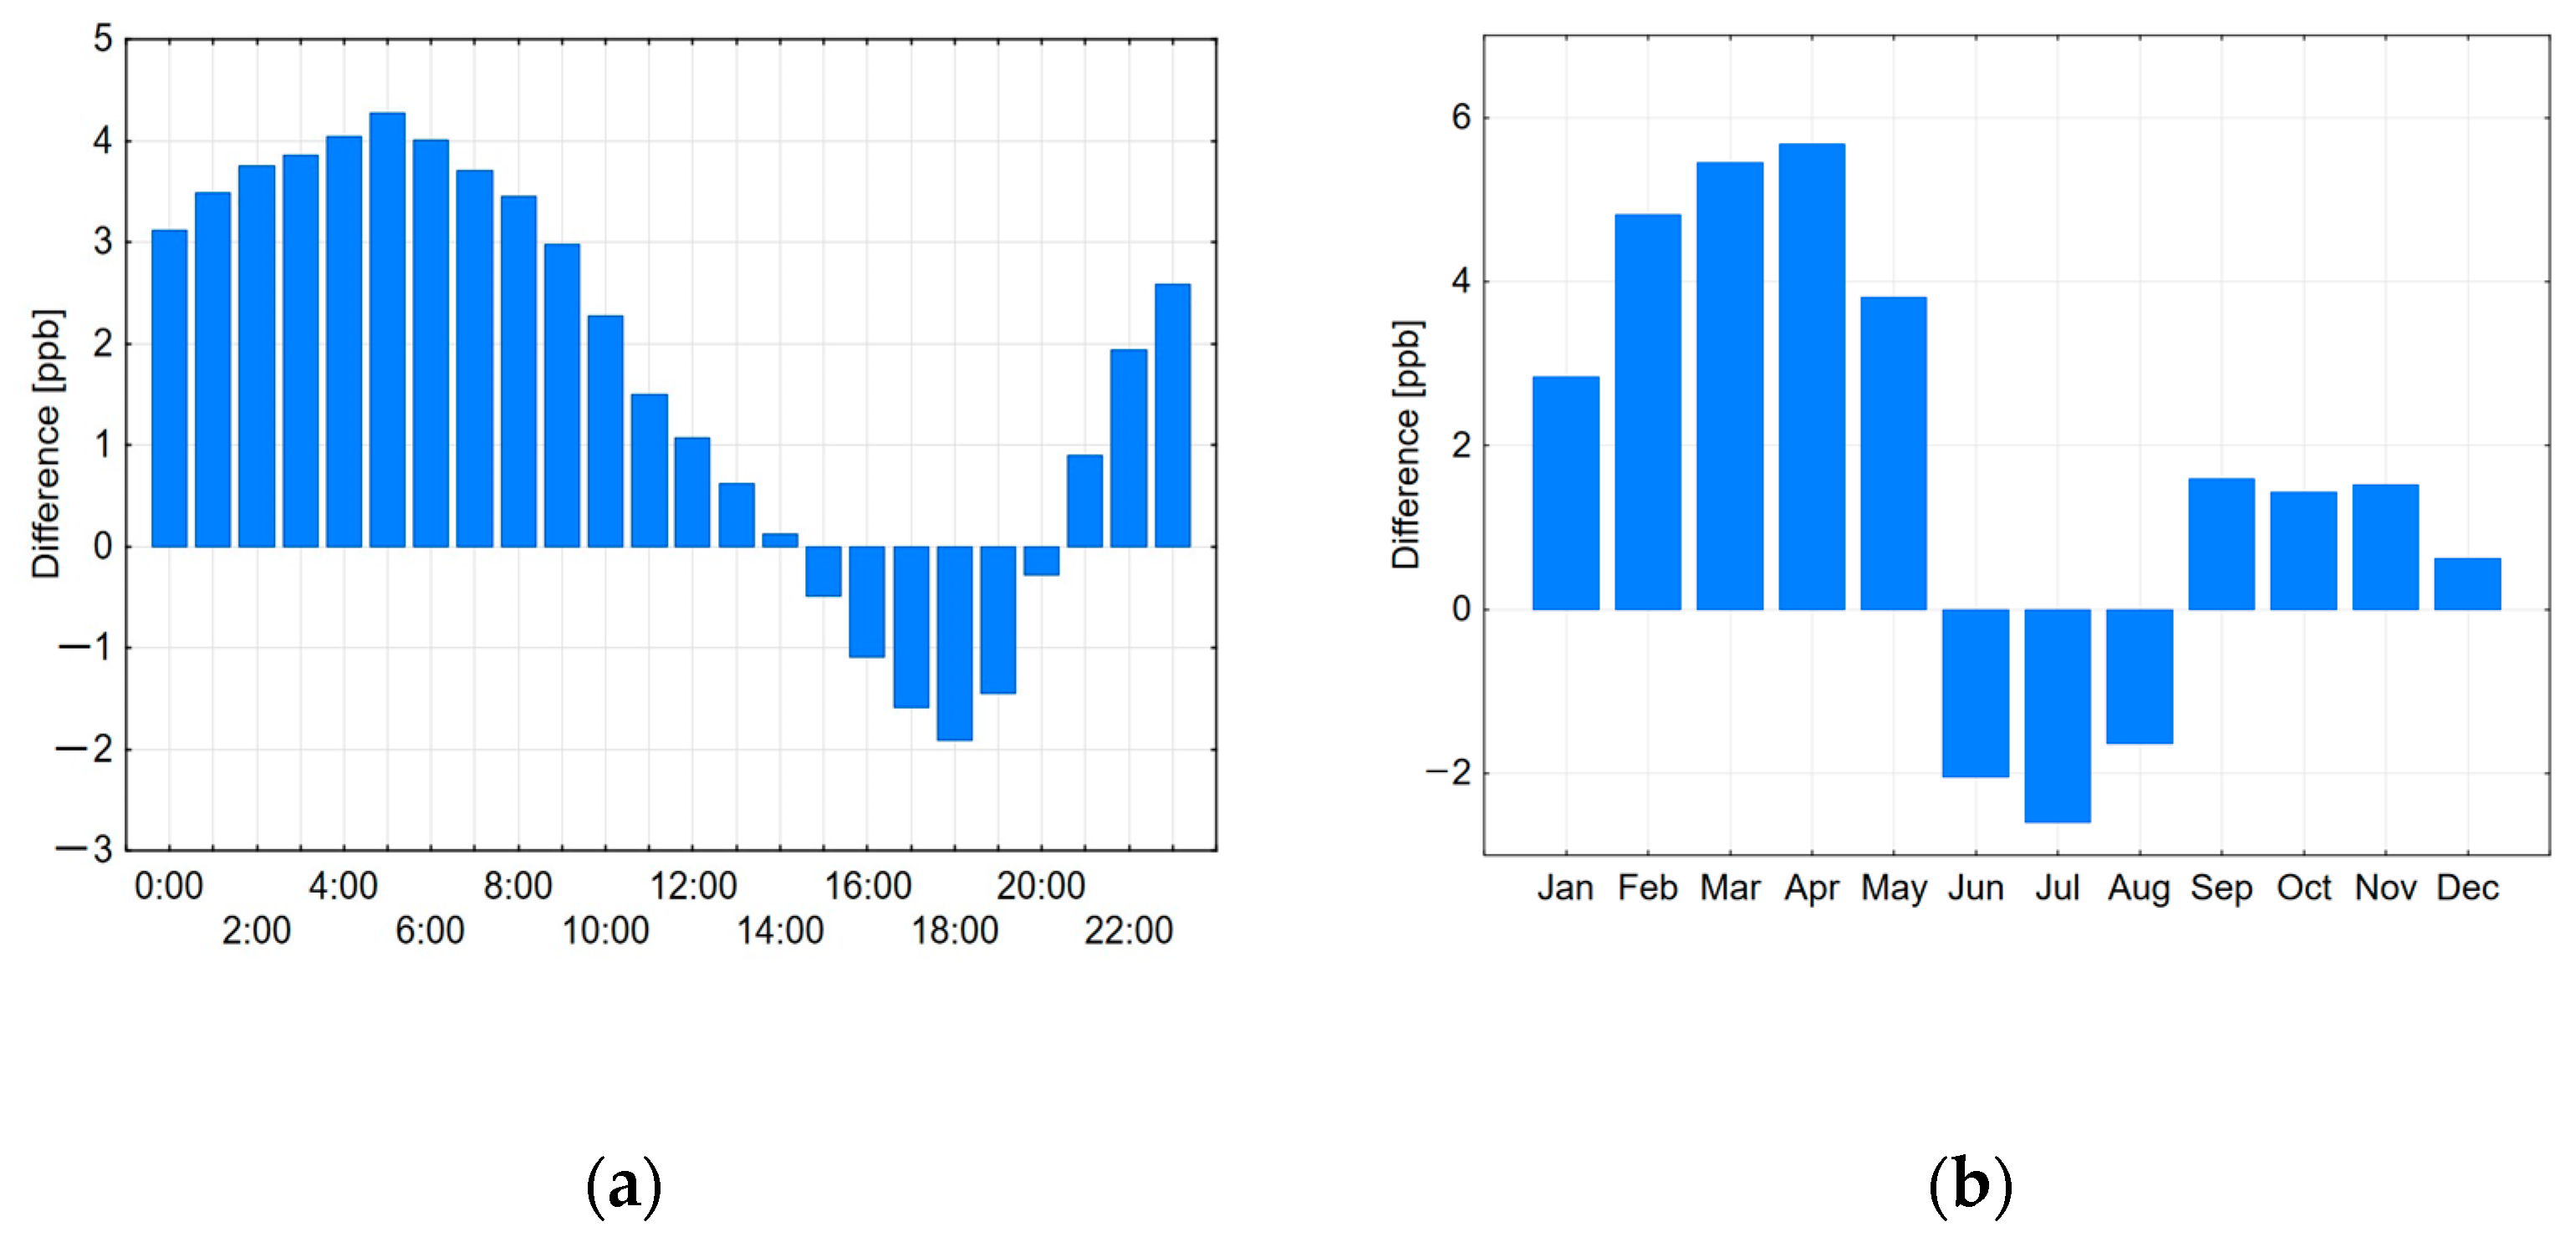
- The average surface O3 concentration is slightly higher at the rural station (25.1 ppb) than at the suburban (24.2 ppb). It is attributed to limited sinks of surface O3 in rural areas (especially lower NOx level results in less surface O3 destruction through titration processes).
- The cycle of diurnal variability of surface O3 is weaker (has lower diurnal amplitude) at the rural station. The highest difference between surface O3 concentration in Racibórz and Belsk was noted at 05:00 (~3.6 ppb). Lower concentrations in the suburban station during the night and morning hours are an indicator of the presence of fresh NO in urban areas [58]. Higher diurnal surface O3 maxima also indicate a high concentration of surface O3 precursors (NOx, VOC) at the site. The maximum of 1 h averaged surface O3 concentration was equal to 91.2 ppb in Racibórz (19 June 2021) while 80.9 ppb at Belsk (1 July 2019).
3.2. Seasonal Cycle of Surface O3 Concentration from CAMS Simulations
3.3. Quality of CAMS Forecasts
3.4. Performance of MLR and ANN Models
3.5. Comparison of Performance of MLR and ANN with CAMS Simulations
4. Discussion
5. Conclusions
Author Contributions
Funding
Institutional Review Board Statement
Informed Consent Statement
Data Availability Statement
Conflicts of Interest
References
- Ramsey, N.R.; Klein, P.M.; Moore, B. The Impact of Meteorological Parameters on Urban Air Quality. Atmos. Environ. 2014, 86, 58–67. [Google Scholar] [CrossRef]
- Crutzen, P. A Discussion of the Chemistry of Some Minor Constituents in the Stratosphere and Troposphere; Birkhg.user Verlag: Basel, Switzerland, Pure and Applied Geophysics; 1973; Volume 106. [Google Scholar]
- Seinfeld, J.H. Urban Air Pollution: State of the Science. Science 1989, 243, 745–752. [Google Scholar] [CrossRef]
- Jacob, D.J. Heterogeneous Chemistry and Tropospheric Ozone. Atmos. Environ. 2000, 34, 2131–2159. [Google Scholar] [CrossRef]
- Edwin, F. Danielsen Stratospheric-Tropospheric Exchange Based on Radioactivity, Ozone and Potential Vorticity. J. Atmos. Sci. 1968, 25, 502–518. [Google Scholar]
- Stohl, A. Stratosphere-Troposphere Exchange: A Review, and What We Have Learned from STACCATO. J. Geophys. Res. 2003, 108, 8516. [Google Scholar] [CrossRef]
- Hov, Ö.; Hesstvedt, E.; Isaksen, I.S.A. Long-Range Transport of Tropospheric Ozone. Nature 1978, 273, 341–344. [Google Scholar] [CrossRef]
- Gosten, H.; Heinrich, N.; Monnich, E.; Sprung, D.; Weppner, J.; Bakr Ramadan, A.; M Ezz El-din, M.R.; Ahmed, D.M.; Y Hassan, G.K. ON-line measurements of ozone surface fluxes: Part II. surface-level ozone fluxes onto the sahara desert. Atmos. Environ. 1996, 30, 911–918. [Google Scholar] [CrossRef]
- Atkinson, R. Atmospheric Chemistry of VOCs and NOx. Atmos. Environ. 2000, 34, 2063–2101. [Google Scholar] [CrossRef]
- Sillman, S. The Relation between Ozone, NOx and Hydrocarbons in Urban and Polluted Rural Environments. Atmos. Environ. 1999, 33, 1821–1845. [Google Scholar] [CrossRef]
- Dueñas, C.; Fernández, M.C.; Cañete, S.; Carretero, J.; Liger, E. Analyses of Ozone in Urban and Rural Sites in Málaga (Spain). Chemosphere 2004, 56, 631–639. [Google Scholar] [CrossRef]
- Han, J.; Kim, H.; Lee, M.; Kim, S.; Kim, S. Photochemical Air Pollution of Seoul in the Last Three Decades. J. Korean Soc. Atmos. Environ. 2013, 29, 390–406. [Google Scholar] [CrossRef] [Green Version]
- Pawlak, I.; Jarosławski, J. The Influence of Selected Meteorological Parameters on the Concentration of Surface Ozone in the Central Region of Poland. Atmosphere Ocean 2015, 53, 126–139. [Google Scholar] [CrossRef]
- Crutzen, P.J.; Zimmermann, P.H. The Changing Photochemistry of the Troposphere. Tellus A 1991, 43, 136–151. [Google Scholar] [CrossRef]
- Forster, P.; Alterskjaer, K.; Smith, C.; Colman, R.; Damon Matthews, H.; Ramaswamy, V.; Storelvmo, T.; Armour, K.; Collins, W.; Dufresne, J.; et al. SPM 923 7 Coordinating Lead Authors: Contributing Authors: Review Editors: Chapter Scientists: The Earth’s Energy Budget, Climate Feedbacks and Climate Sensitivity; Cambridge University Press: Cambridge, UK; New York, NY, USA, 2021; pp. 923–1054. [Google Scholar] [CrossRef]
- Sillman, S. Tropospheric Ozone and Photochemical Smog. In Treatise on Geochemistry; Elsevier: Amsterdam, The Netherlands, 2003; pp. 407–431. [Google Scholar]
- Malley, C.S.; Heal, M.R.; Mills, G.; Braban, C.F. Trends and Drivers of Ozone Human Health and Vegetation Impact Metrics from UK EMEP Supersite Measurements (1990–2013). Atmos. Chem. Phys. 2015, 15, 4025–4042. [Google Scholar] [CrossRef] [Green Version]
- Liu, X.; Tai, A.P.K.; Fung, K.M. Responses of Surface Ozone to Future Agricultural Ammonia Emissions and Subsequent Nitrogen Deposition through Terrestrial Ecosystem Changes. Atmos. Chem. Phys. 2021, 21, 17743–17758. [Google Scholar] [CrossRef]
- Wilson, A.; Rappold, A.G.; Neas, L.M.; Reich, B.J. Modeling the Effect of Temperature on Ozone-Related Mortality. Ann. Appl. Stat. 2014, 8, 1728–1749. [Google Scholar] [CrossRef]
- Logan, J.A. Tropospheric Ozone: Seasonal Behavior, Trends, and Anthropogenic Influence. J. Geophys.Res. Atmos. 1985, 90, 10463–10482. [Google Scholar] [CrossRef]
- Seinfeld, J.H.; Pandis, S.N. Atmospheric Chemistry and Physics: From Air Pollution to Climate Change, 2nd ed.; John Wiley & Sons: New York, NY, USA, 2006. [Google Scholar]
- Sillman, S.; Samson, P.J. Impact of Temperature on Oxidant Photochemistry in Urban, Polluted Rural and Remote Environments. J. Geophys. Res. 1995, 100, 11497. [Google Scholar] [CrossRef]
- Arya, S.P. Air Pollution Meteorology and Dispersion; Oxford University Press: Oxford, UK, 1999. [Google Scholar]
- Lelieveld, J.; Crutzen, P.J. The Role of Clouds in Tropospheric Photochemistry. J. Atmos. Chem. 1991, 12, 229–267. [Google Scholar] [CrossRef]
- Zhang, L.; Brook, J.R.; Vet, R. A Revised Parameterization for Gaseous Dry Deposition in Air-Quality Models. Atmos. Chem. Phys. 2003, 3, 2067–2082. [Google Scholar] [CrossRef] [Green Version]
- Hodnebrog, Ø.; Solberg, S.; Stordal, F.; Svendby, T.M.; Simpson, D.; Gauss, M.; Hilboll, A.; Pfister, G.G.; Turquety, S.; Richter, A.; et al. Impact of Forest Fires, Biogenic Emissions and High Temperatures on the Elevated Eastern Mediterranean Ozone Levels during the Hot Summer of 2007. Atmos. Chem. Phys. 2012, 12, 8727–8750. [Google Scholar] [CrossRef] [Green Version]
- Derwent-, R.G.; Jenkin, M.E.; Saundersm, S.M.; Pillingm, M.J. Photochemical ozone creation potentials for organic compounds in northwest europe calculated with a master chemical mechanism. Atmos. Environ. 1998, 32, 2429–2441. [Google Scholar] [CrossRef]
- Tarasova, O.A.; Karpetchko, A.Y. Accounting for Local Meteorological Effects in the Ozone Time-Series of Lovozero (Kola Peninsula). Atmos. Chem. Phys. 2003, 3, 941–949. [Google Scholar] [CrossRef] [Green Version]
- Camalier, L.; Cox, W.; Dolwick, P. The Effects of Meteorology on Ozone in Urban Areas and Their Use in Assessing Ozone Trends. Atmos. Environ. 2007, 41, 7127–7137. [Google Scholar] [CrossRef]
- Vautard, R.; Beekmann, M.; Roux, J.; Gombert, D. Validation of a Hybrid Forecasting System for the Ozone Concentrations over the Paris Area. Atmos. Environ. 2001, 35, 2449–2461. [Google Scholar] [CrossRef]
- Vautard, R.; Moran, M.D.; Solazzo, E.; Gilliam, R.C.; Matthias, V.; Bianconi, R.; Chemel, C.; Ferreira, J.; Geyer, B.; Hansen, A.B.; et al. Evaluation of the Meteorological Forcing Used for the Air Quality Model Evaluation International Initiative (AQMEII) Air Quality Simulations. Atmos. Environ. 2012, 53, 15–37. [Google Scholar] [CrossRef] [Green Version]
- Verma, N.; Lakhani, A.; Maharaj Kumari, K. High Ozone Episodes at a Semi-Urban Site in India: Photochemical Generation and Transport. Atmos. Res. 2017, 197, 232–243. [Google Scholar] [CrossRef]
- Lou, S.; Liao, H.; Yang, Y.; Mu, Q. Simulation of the Interannual Variations of Tropospheric Ozone over China: Roles of Variations in Meteorological Parameters and Anthropogenic Emissions. Atmos. Environ. 2015, 122, 839–851. [Google Scholar] [CrossRef]
- Hu, J.; Chen, J.; Ying, Q.; Zhang, H. One-Year Simulation of Ozone and Particulate Matter in China Using WRF/CMAQ Modeling System. Atmos. Chem. Phys. 2016, 16, 10333–10350. [Google Scholar] [CrossRef] [Green Version]
- Singh, J.; Singh, N.; Ojha, N.; Sharma, A.; Pozzer, A.; Kiran Kumar, N.; Rajeev, K.; Gunthe, S.S.; Rao Kotamarthi, V. Effects of Spatial Resolution on WRF v3.8.1 Simulated Meteorology over the Central Himalaya. Geosci. Model Dev. 2021, 14, 1427–1443. [Google Scholar] [CrossRef]
- Sharma, A.; Ojha, N.; Pozzer, A.; Mar, K.A.; Beig, G.; Lelieveld, J.; Gunthe, S.S. WRF-Chem Simulated Surface Ozone over South Asia during the Pre-Monsoon: Effects of Emission Inventories and Chemical Mechanisms. Atmos. Chem. Phys. 2017, 17, 14393–14413. [Google Scholar] [CrossRef] [Green Version]
- Yi, J.; Prybutok, V.R. A neural network model forecasting for prediction of daily maximum ozone concentration in an industrialized urban area. Environ. Pollut. 1996, 92, 349–357. [Google Scholar] [CrossRef]
- Comrie, A.C. Comparing Neural Networks and Regression Models for Ozone Forecasting. J. Air Waste Manag. Assoc. 1997, 47, 653–663. [Google Scholar] [CrossRef]
- Spellman, G. An Application of Artificial Neural Networks to the Prediction of Surface Ozone Concentrations in the United Kingdom. Appl. Geogr. 1999, 19, 123–136. [Google Scholar] [CrossRef]
- Gardner, M.W.; Dorling, S.R. Statistical Surface Ozone Models: An Improved Methodology to Account for Non-Linear Behaviour. Atmos. Environ. 2000, 34, 21–34. [Google Scholar] [CrossRef]
- Sousa, S.I.V.; Martins, F.G.; Alvim-Ferraz, M.C.M.; Pereira, M.C. Multiple Linear Regression and Artificial Neural Networks Based on Principal Components to Predict Ozone Concentrations. Environ. Model. Softw. 2007, 22, 97–103. [Google Scholar] [CrossRef]
- Capilla, C. Prediction of Hourly Ozone Concentrations with Multiple Regression and Multilayer Perceptron Models. Int. J. Sustain. Dev. Plan. 2016, 11, 558–565. [Google Scholar] [CrossRef] [Green Version]
- Yu, J.; Xu, L.; Gao, S.; Chen, L.; Sun, Y.; Mao, J.; Zhang, H. Establishment of a Combined Model for Ozone Concentration Simulation with Stepwise Regression Analysis and Artificial Neural Network. Atmosphere 2022, 13, 1371. [Google Scholar] [CrossRef]
- Freeman, B.S.; Taylor, G.; Gharabaghi, B.; Thé, J. Forecasting Air Quality Time Series Using Deep Learning. J. Air Waste Manag. Assoc. 2018, 68, 866–886. [Google Scholar] [CrossRef] [Green Version]
- Ko, K.; Cho, S.; Rao, R.R. Machine-Learning-Based Near-Surface Ozone Forecasting Model with Planetary Boundary Layer Information. Sensors 2022, 22, 7864. [Google Scholar] [CrossRef]
- Oufdou, H.; Bellanger, L.; Bergam, A.; Khomsi, K. Forecasting Daily of Surface Ozone Concentration in the Grand Casablanca Region Using Parametric and Nonparametric Statistical Models. Atmosphere 2021, 12, 666. [Google Scholar] [CrossRef]
- Jia, P.; Cao, N.; Yang, S. Real-Time Hourly Ozone Prediction System for Yangtze River Delta Area Using Attention Based on a Sequence to Sequence Model. Atmos. Environ. 2021, 244, 117917. [Google Scholar] [CrossRef]
- Juarez, E.K.; Petersen, M.R. A Comparison of Machine Learning Methods to Forecast Tropospheric Ozone Levels in Delhi. Atmosphere 2022, 13, 46. [Google Scholar] [CrossRef]
- Colette, A.; Andersson, C.; Manders, A.; Mar, K.; Mircea, M.; Pay, M.T.; Raffort, V.; Tsyro, S.; Cuvelier, C.; Adani, M.; et al. EURODELTA-Trends, a Multi-Model Experiment of Air Quality Hindcast in Europe over 1990–2010. Geosci. Model Dev. 2017, 10, 3255–3276. [Google Scholar] [CrossRef] [Green Version]
- Derwent, R.G.; Davies, T.J. Modelling the Impact of NOx or Hydrocarbon Control on Photochemical Ozone in Europe. Atmos. Environ. 1994, 28, 2039–2052. [Google Scholar] [CrossRef]
- Pavón-Domínguez, P.; Jiménez-Hornero, F.J.; Gutiérrez de Ravé, E. Proposal for Estimating Ground-Level Ozone Concentrations at Urban Areas Based on Multivariate Statistical Methods. Atmos. Environ. 2014, 90, 59–70. [Google Scholar] [CrossRef]
- Hashim, N.M.; Noor, N.M.; Ul-Saufie, A.Z.; Sandu, A.V.; Vizureanu, P.; Deák, G.; Kheimi, M. Forecasting Daytime Ground-Level Ozone Concentration in Urbanized Areas of Malaysia Using Predictive Models. Sustainability 2022, 14, 7936. [Google Scholar] [CrossRef]
- Silva, R.C.V.; Pires, J.C.M. Surface Ozone Pollution: Trends, Meteorological Influences, and Chemical Precursors in Portugal. Sustainability 2022, 14, 2383. [Google Scholar] [CrossRef]
- Gardner, M.W.; Dorling, S.R. Artificial neural networks (the multilayer perceptron)—A review of applications in the atmospheric sciences . Atmos. Environ. 1998, 32, 2627–2636. [Google Scholar]
- Lal, S.; Naja, M.; Subbaraya, B.H. Seasonal Variations in Surface Ozone and Its Precursors over an Urban Site in India. Atmospheric Environ. 2000, 34, 2713–2724. [Google Scholar] [CrossRef]
- Eliasson, I.; Thorsson, S.; Andersson-Sköld, Y. Summer Nocturnal Ozone Maxima in Göteborg, Sweden. Atmos. Environ. 2003, 37, 2615–2627. [Google Scholar] [CrossRef]
- Murphy, J.G.; Day, D.A.; Cleary, P.A.; Wooldridge, P.J.; Millet, D.B.; Goldstein, A.H.; Cohen, R.C. The Weekend Effect within and Downwind of Sacramento-Part 1: Observations of Ozone, Nitrogen Oxides, and VOC Reactivity. Atmos. Chem. Phys. 2007, 7, 5327–5339. [Google Scholar] [CrossRef] [Green Version]
- Hakola, H.; Joffre, S.; Lättilä, H.; Taalas, P. Transport, Formation and Sink Processes behind Surface Ozone Variability in North European Conditions. Atmos. Environ. Part A. Gen. Top. 1991, 25, 1437–1447. [Google Scholar] [CrossRef]
- Hsu, J.; Prather, M.J. Stratospheric Variability and Tropospheric Ozone. J. Geophys. Res. Atmos. 2009, 114, D06102. [Google Scholar] [CrossRef]
- Balamurugan, V.; Balamurugan, V.; Chen, J. Importance of Ozone Precursors Information in Modelling Urban Surface Ozone Variability Using Machine Learning Algorithm. Sci. Rep. 2022, 12, 5646. [Google Scholar] [CrossRef] [PubMed]





| Station Name | Altitude | Latitude | Longitude | Station Type |
|---|---|---|---|---|
| (m a.s.l.) | ||||
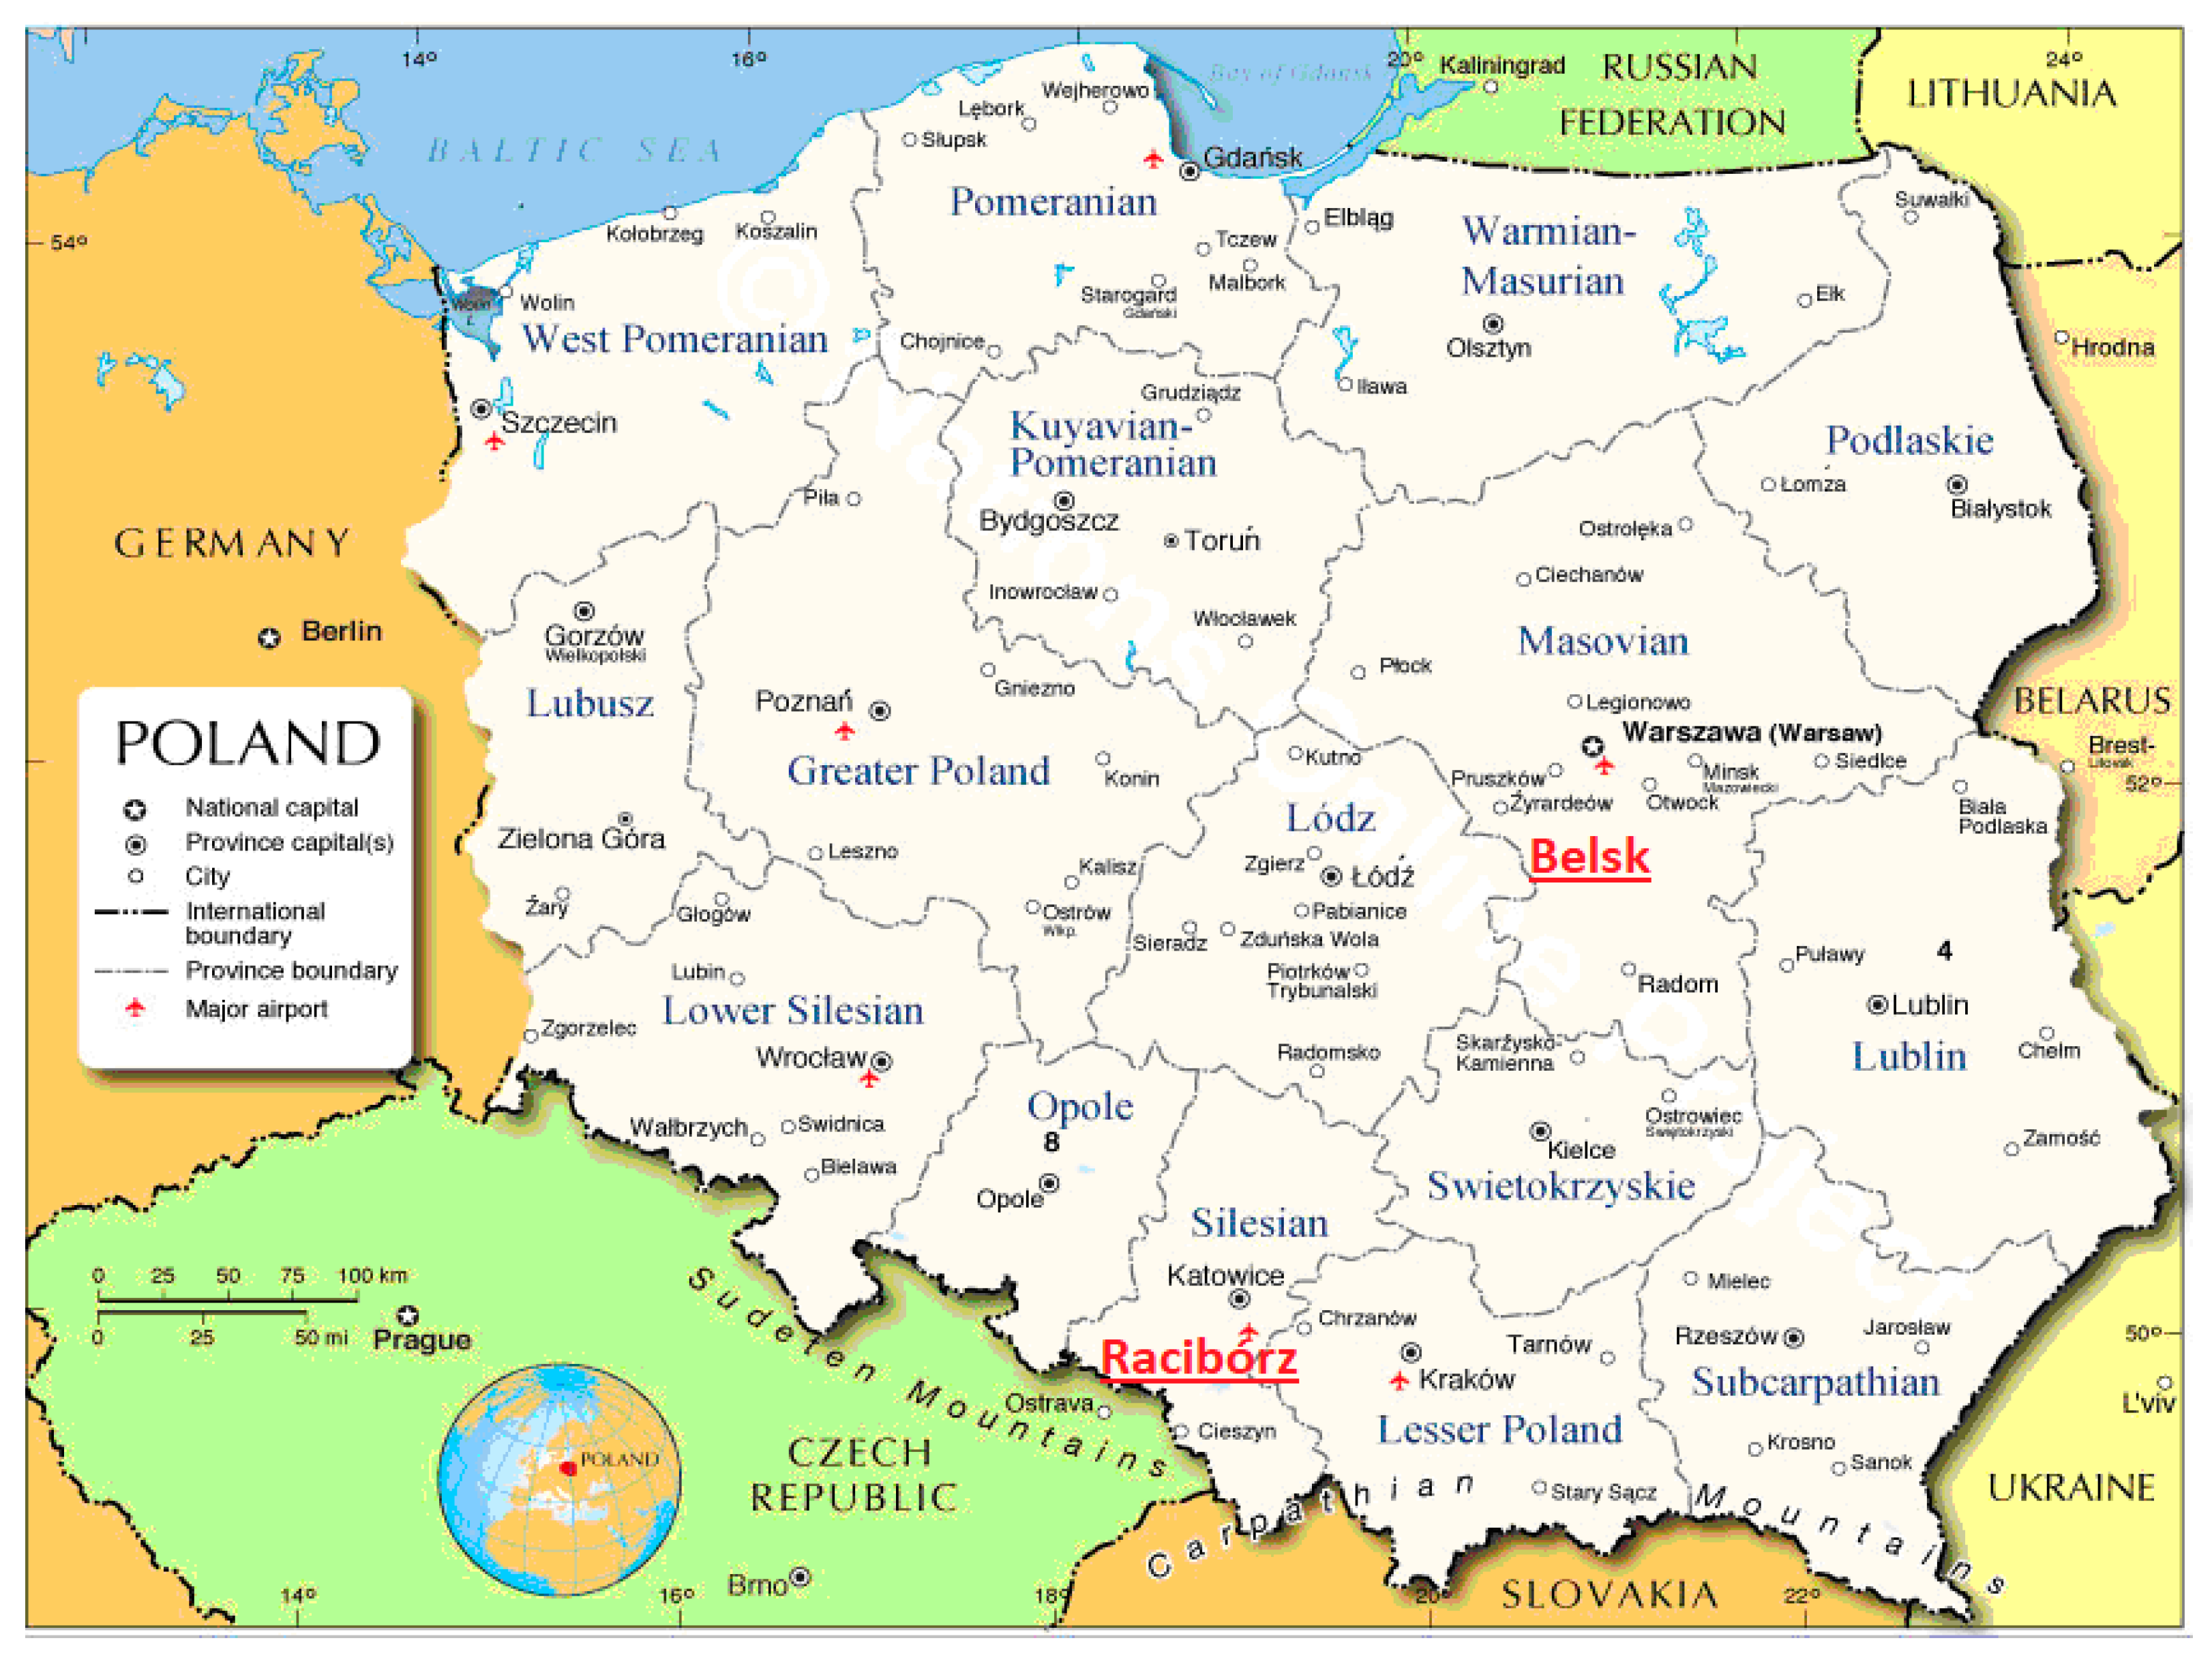
| Belsk | 176 | 51.837° N | 20.792° E | rural |
| Racibórz | 193 | 50.083° N | 18.192° E | suburban |
| Index | Racibórz | Belsk | ||||||||||||
|---|---|---|---|---|---|---|---|---|---|---|---|---|---|---|
| CH | EM | EN | MO | MA | LO | EU | CH | EM | EN | MO | MA | LO | EU | |
| Spring | ||||||||||||||
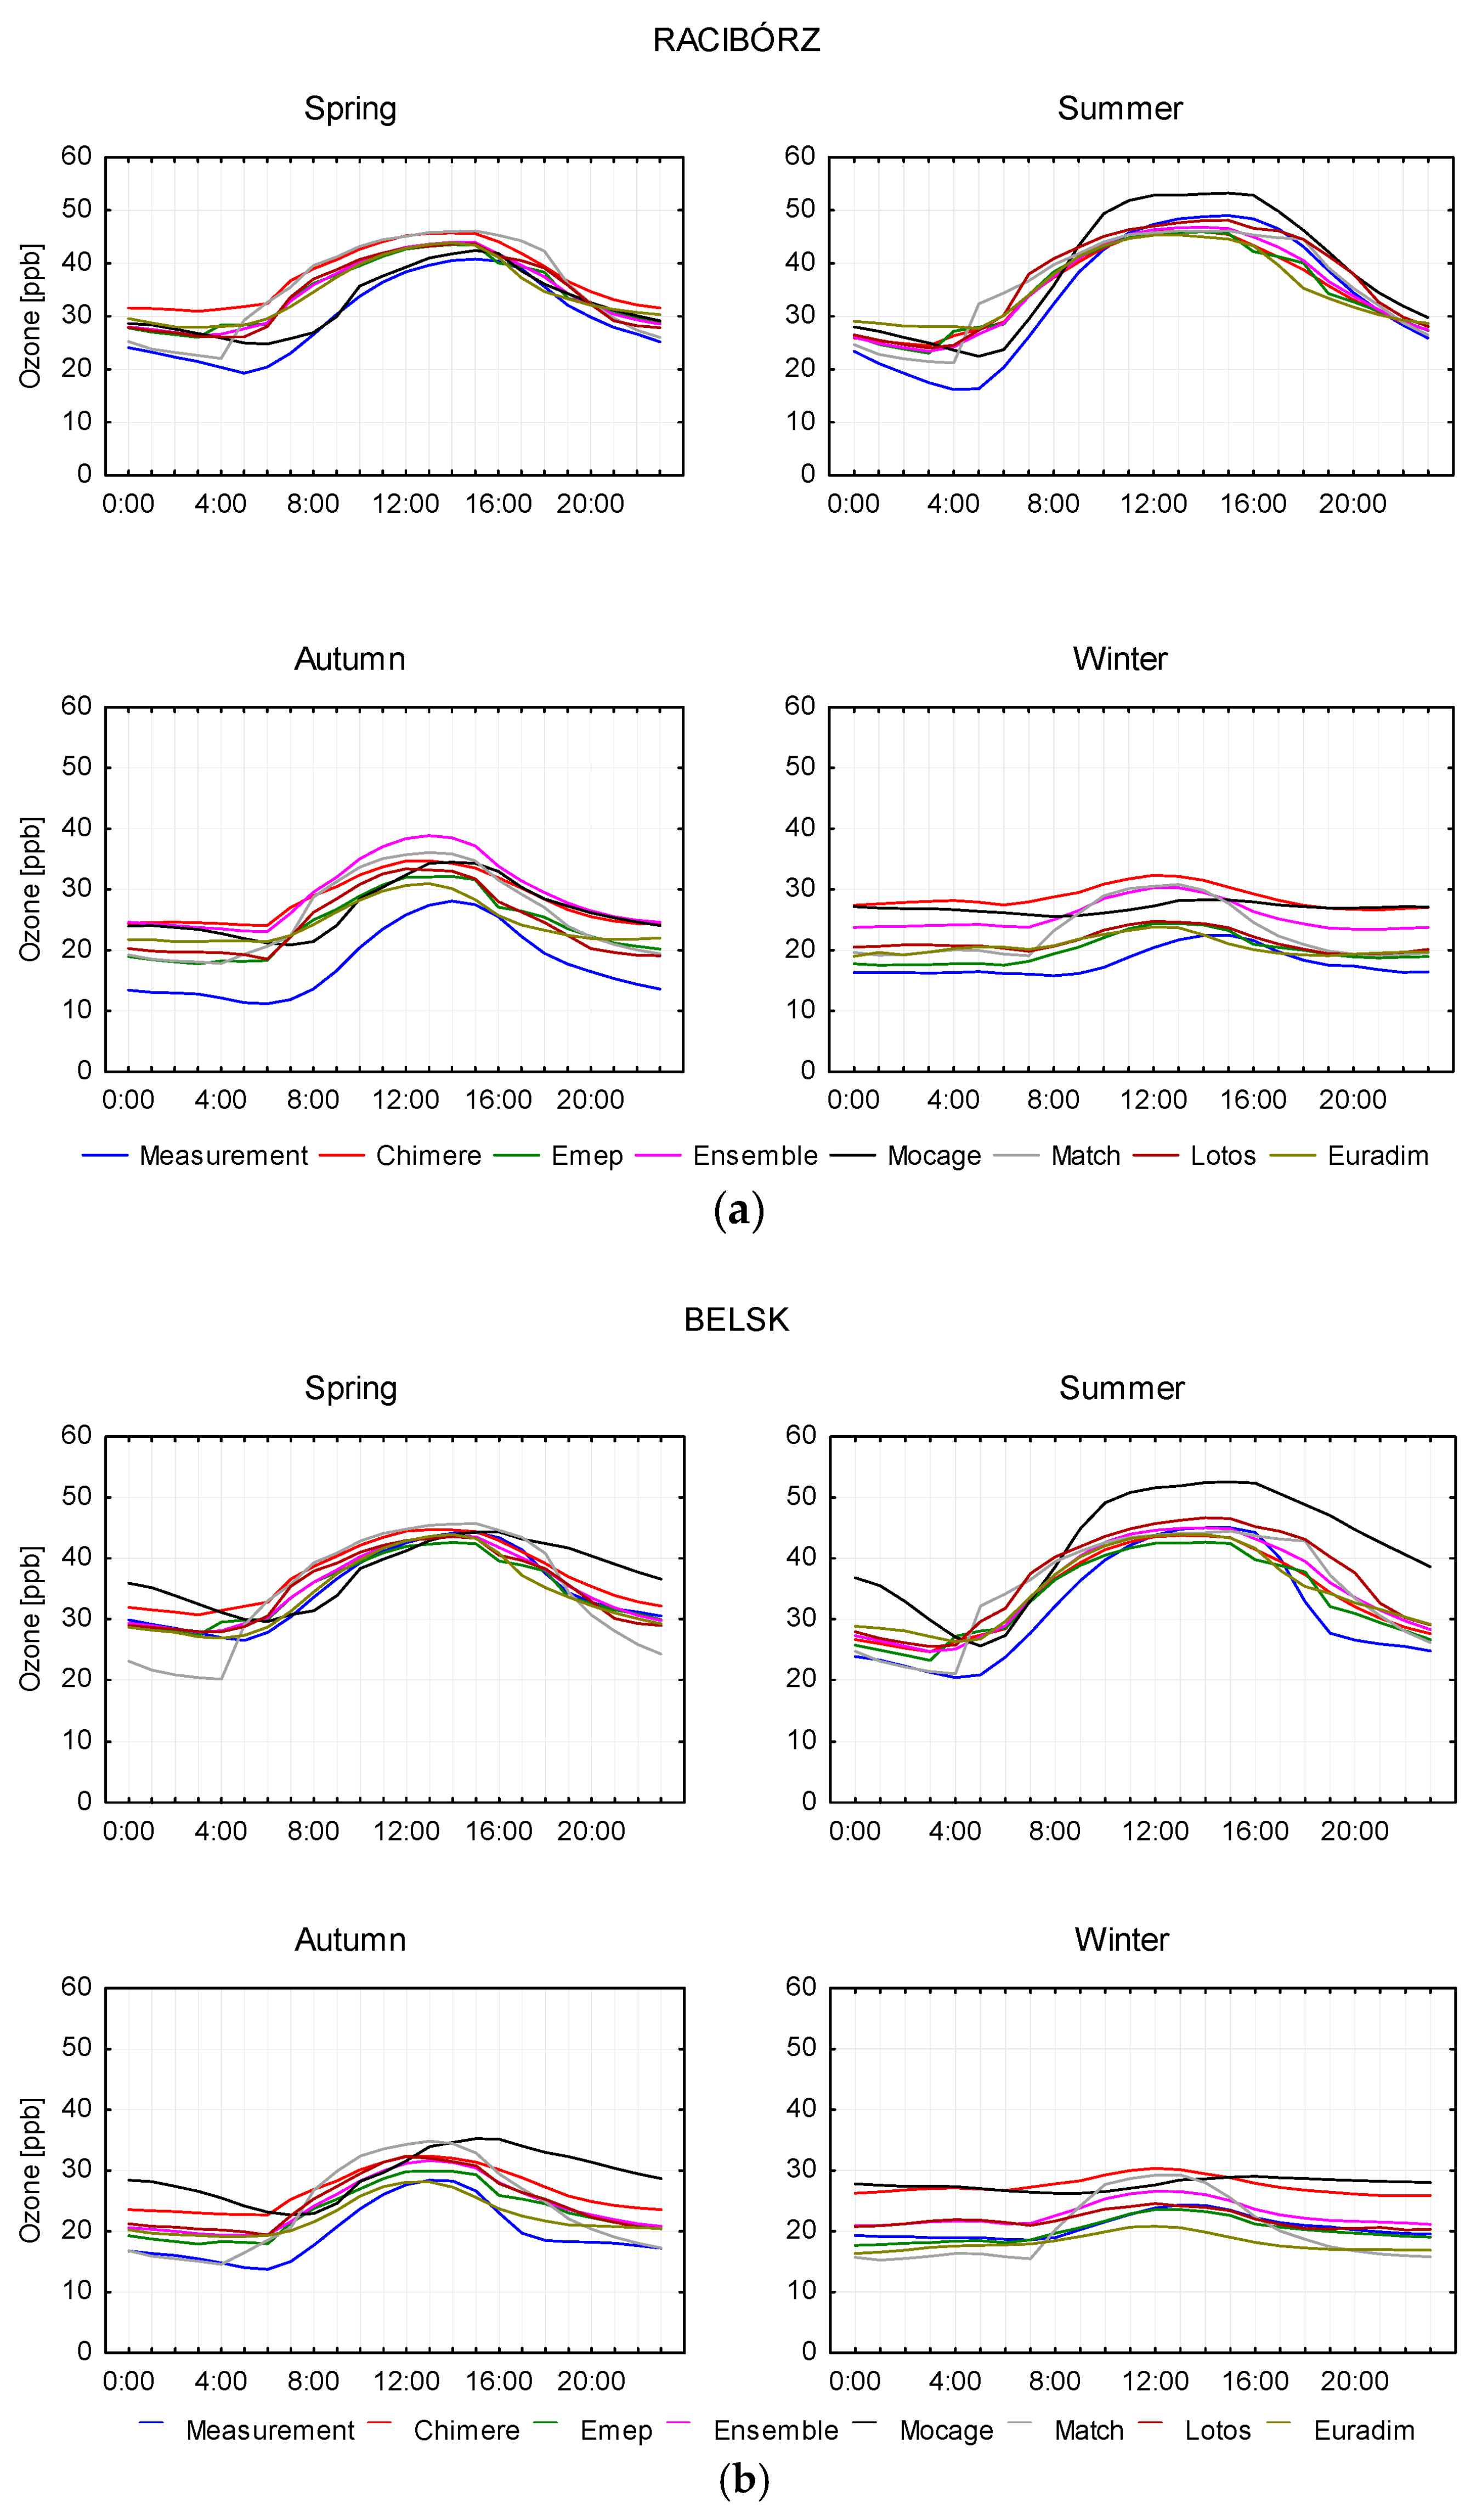
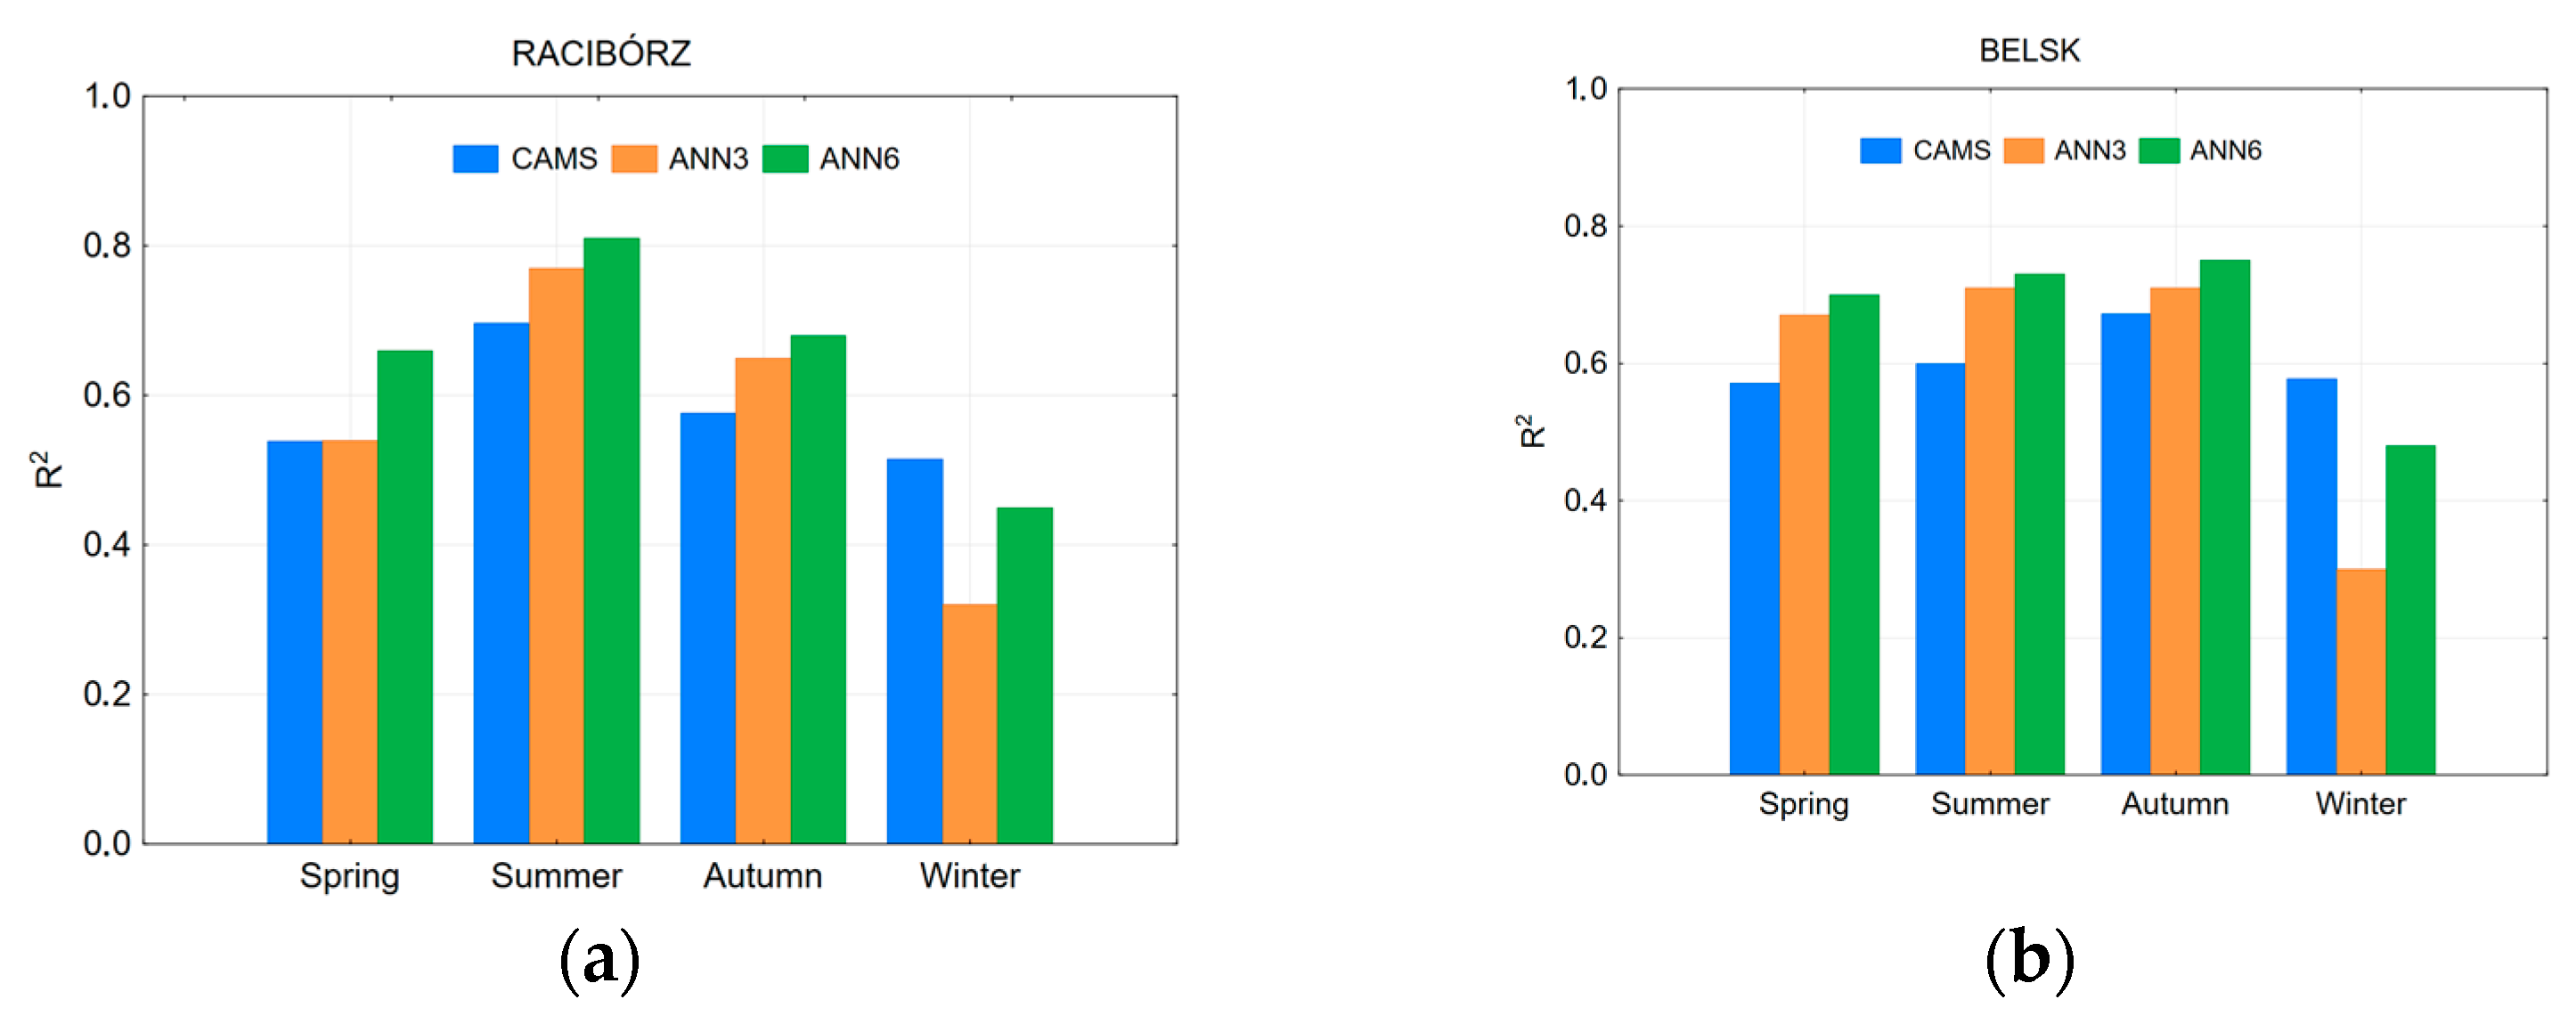
| R2 | 0.48 | 0.52 | 0.54 | 0.42 | 0.40 | 0.36 | 0.22 | 0.49 | 0.52 | 0.57 | 0.24 | 0.47 | 0.40 | 0.35 |
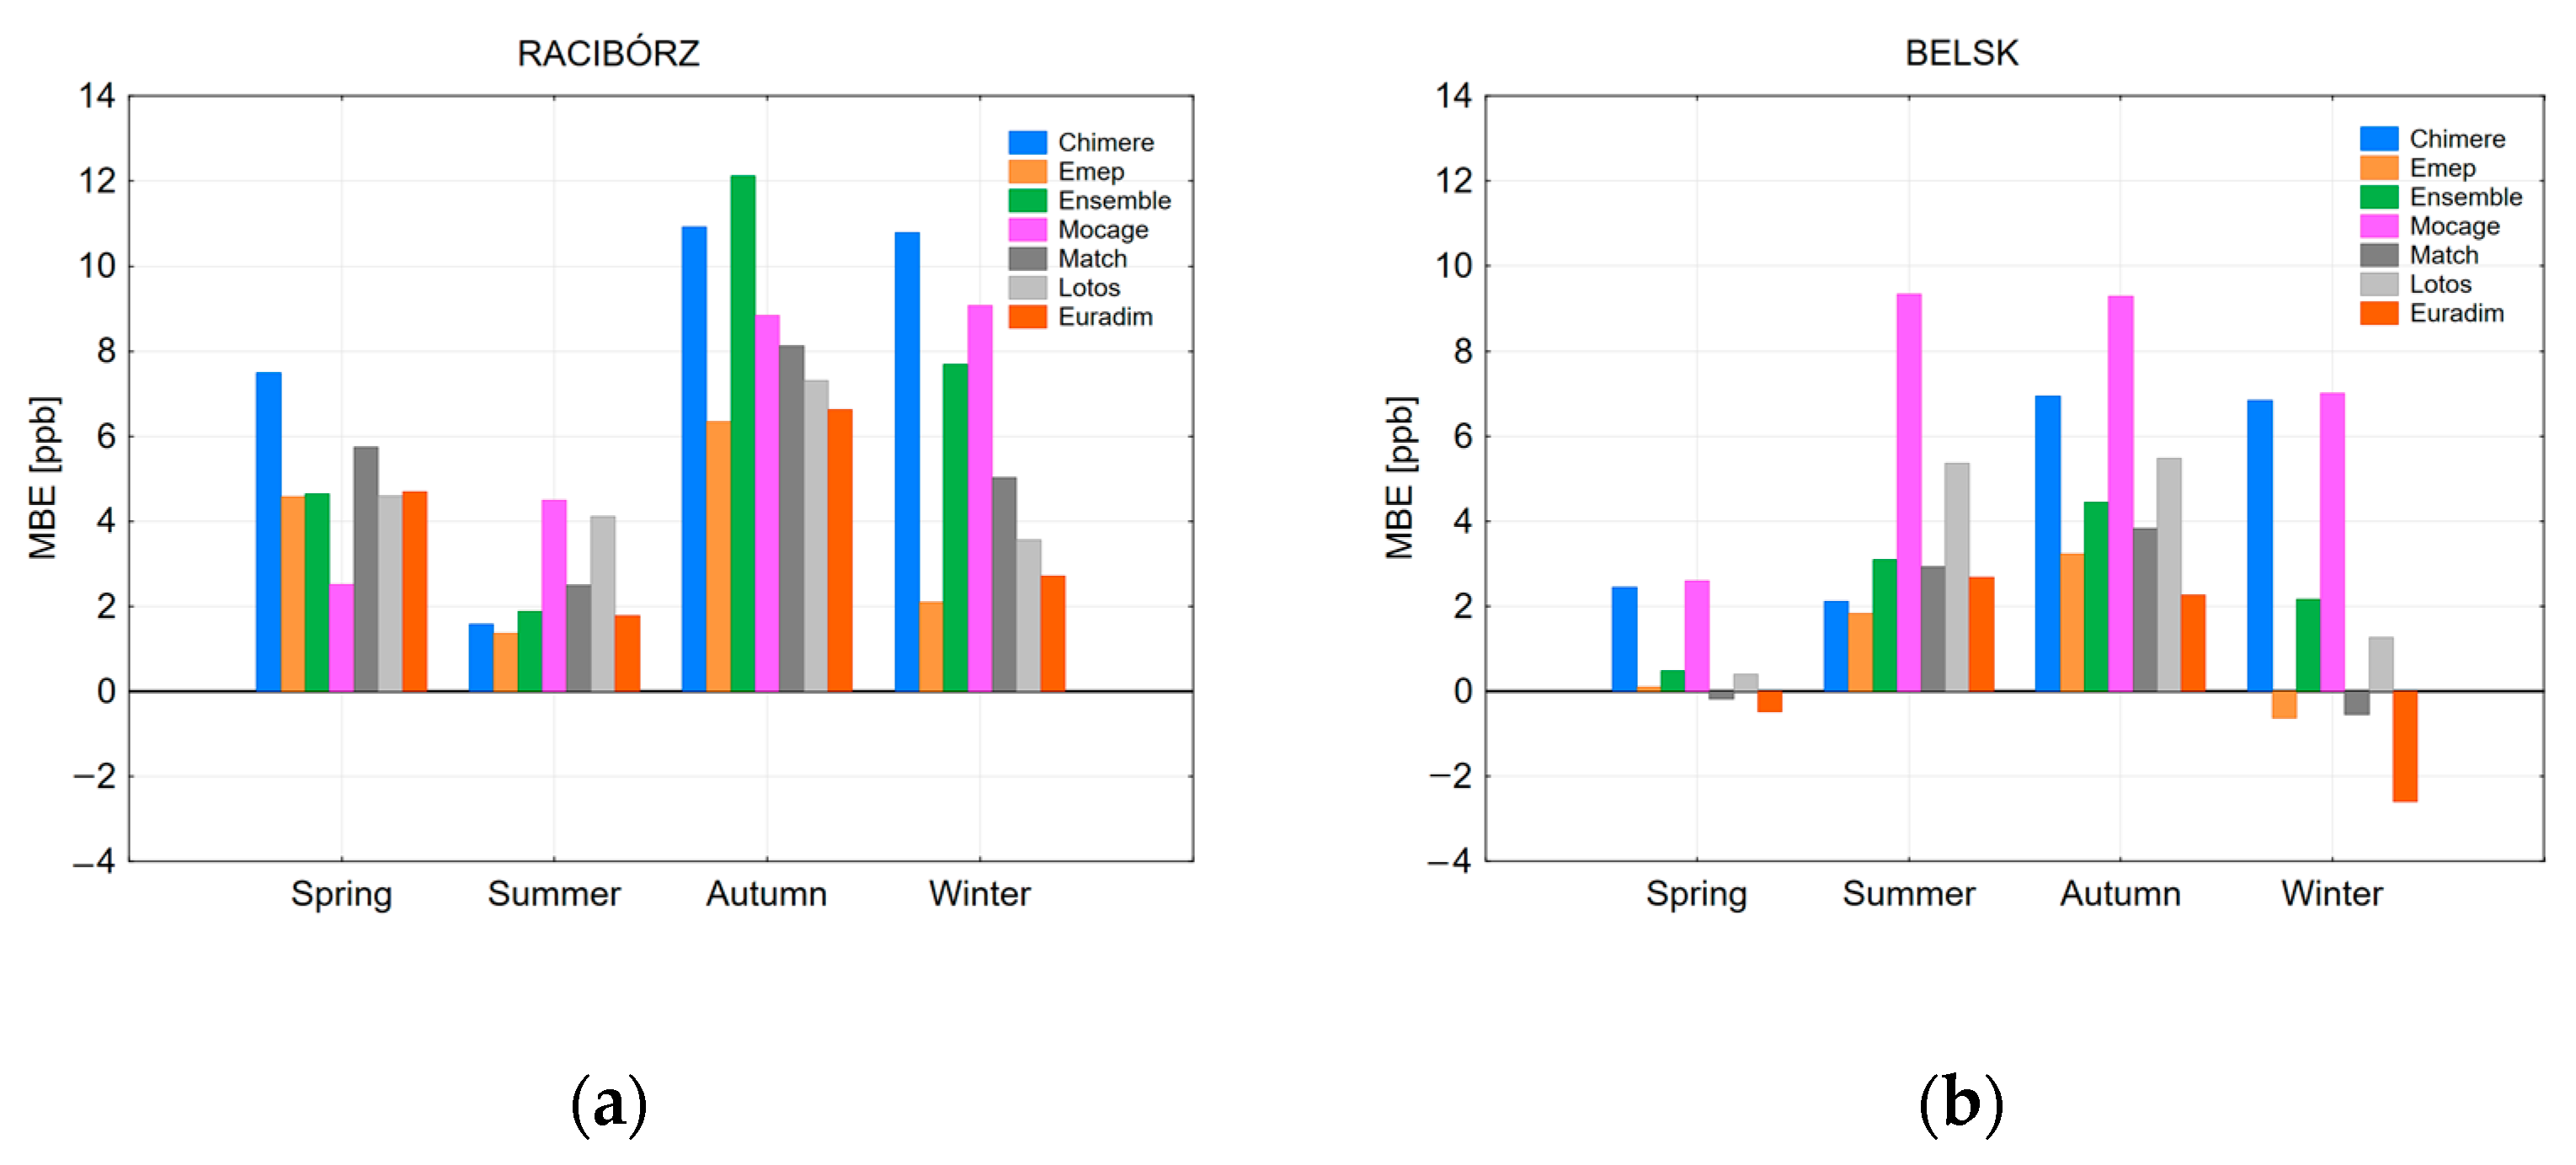
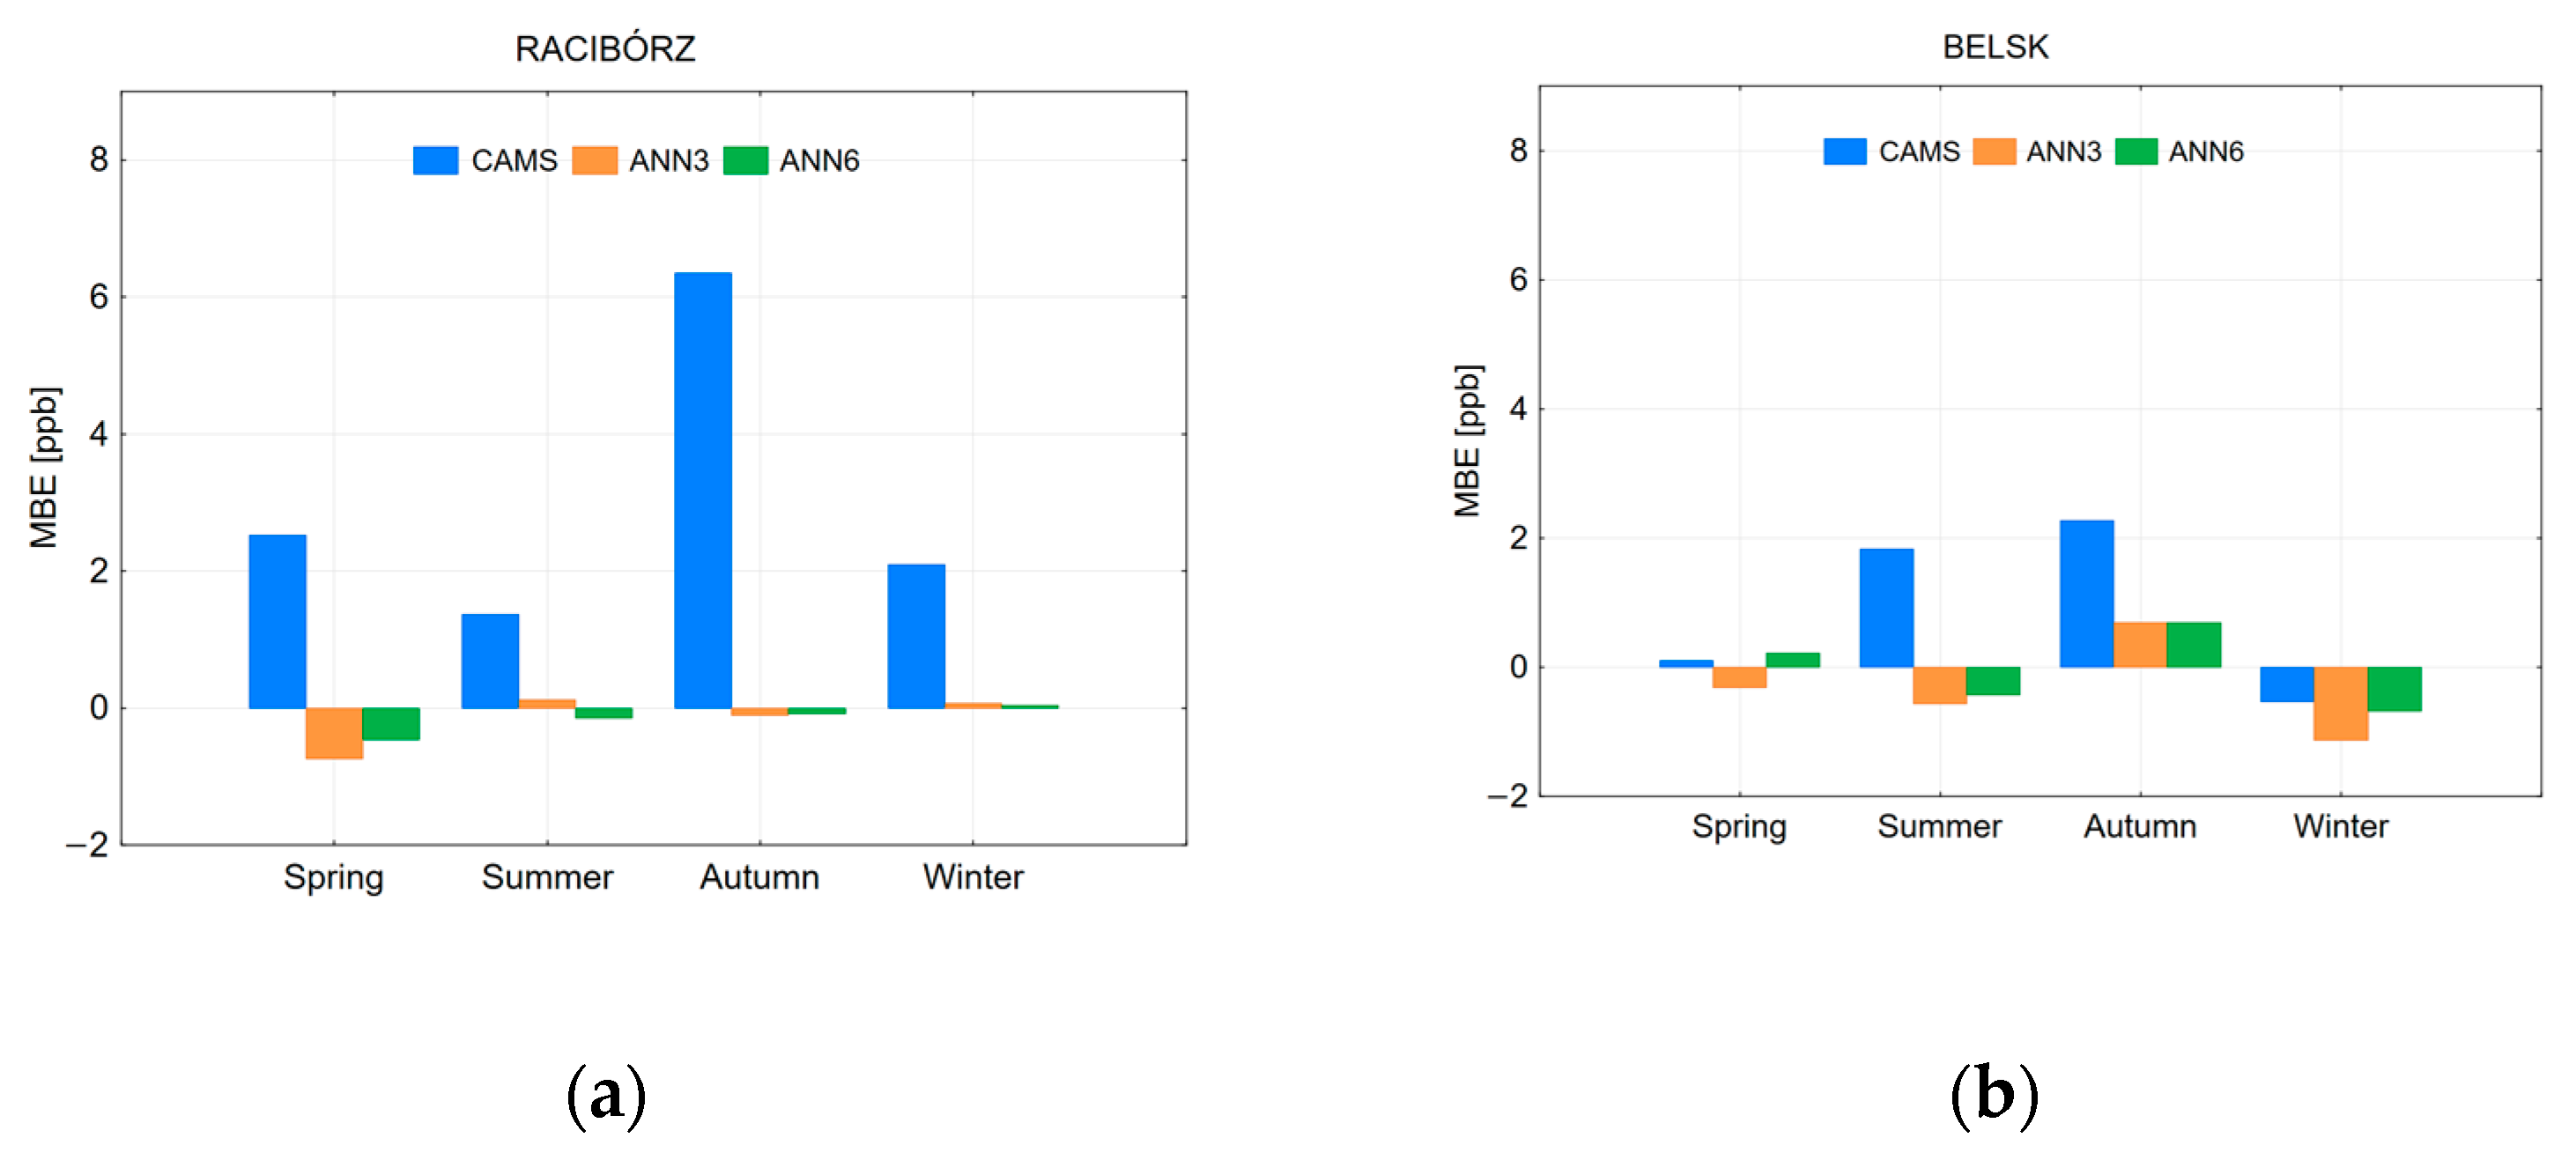
| MBE | 7.49 | 4.58 | 4.64 | 2.52 | 5.75 | 4.60 | 4.70 | 2.45 | 0.10 | 0.49 | 2.61 | −0.18 | 0.41 | −0.48 |
| MAE | 9.12 | 7.52 | 7.29 | 7.65 | 9.12 | 9.30 | 9.39 | 6.00 | 5.45 | 5.01 | 7.84 | 6.83 | 6.91 | 6.84 |
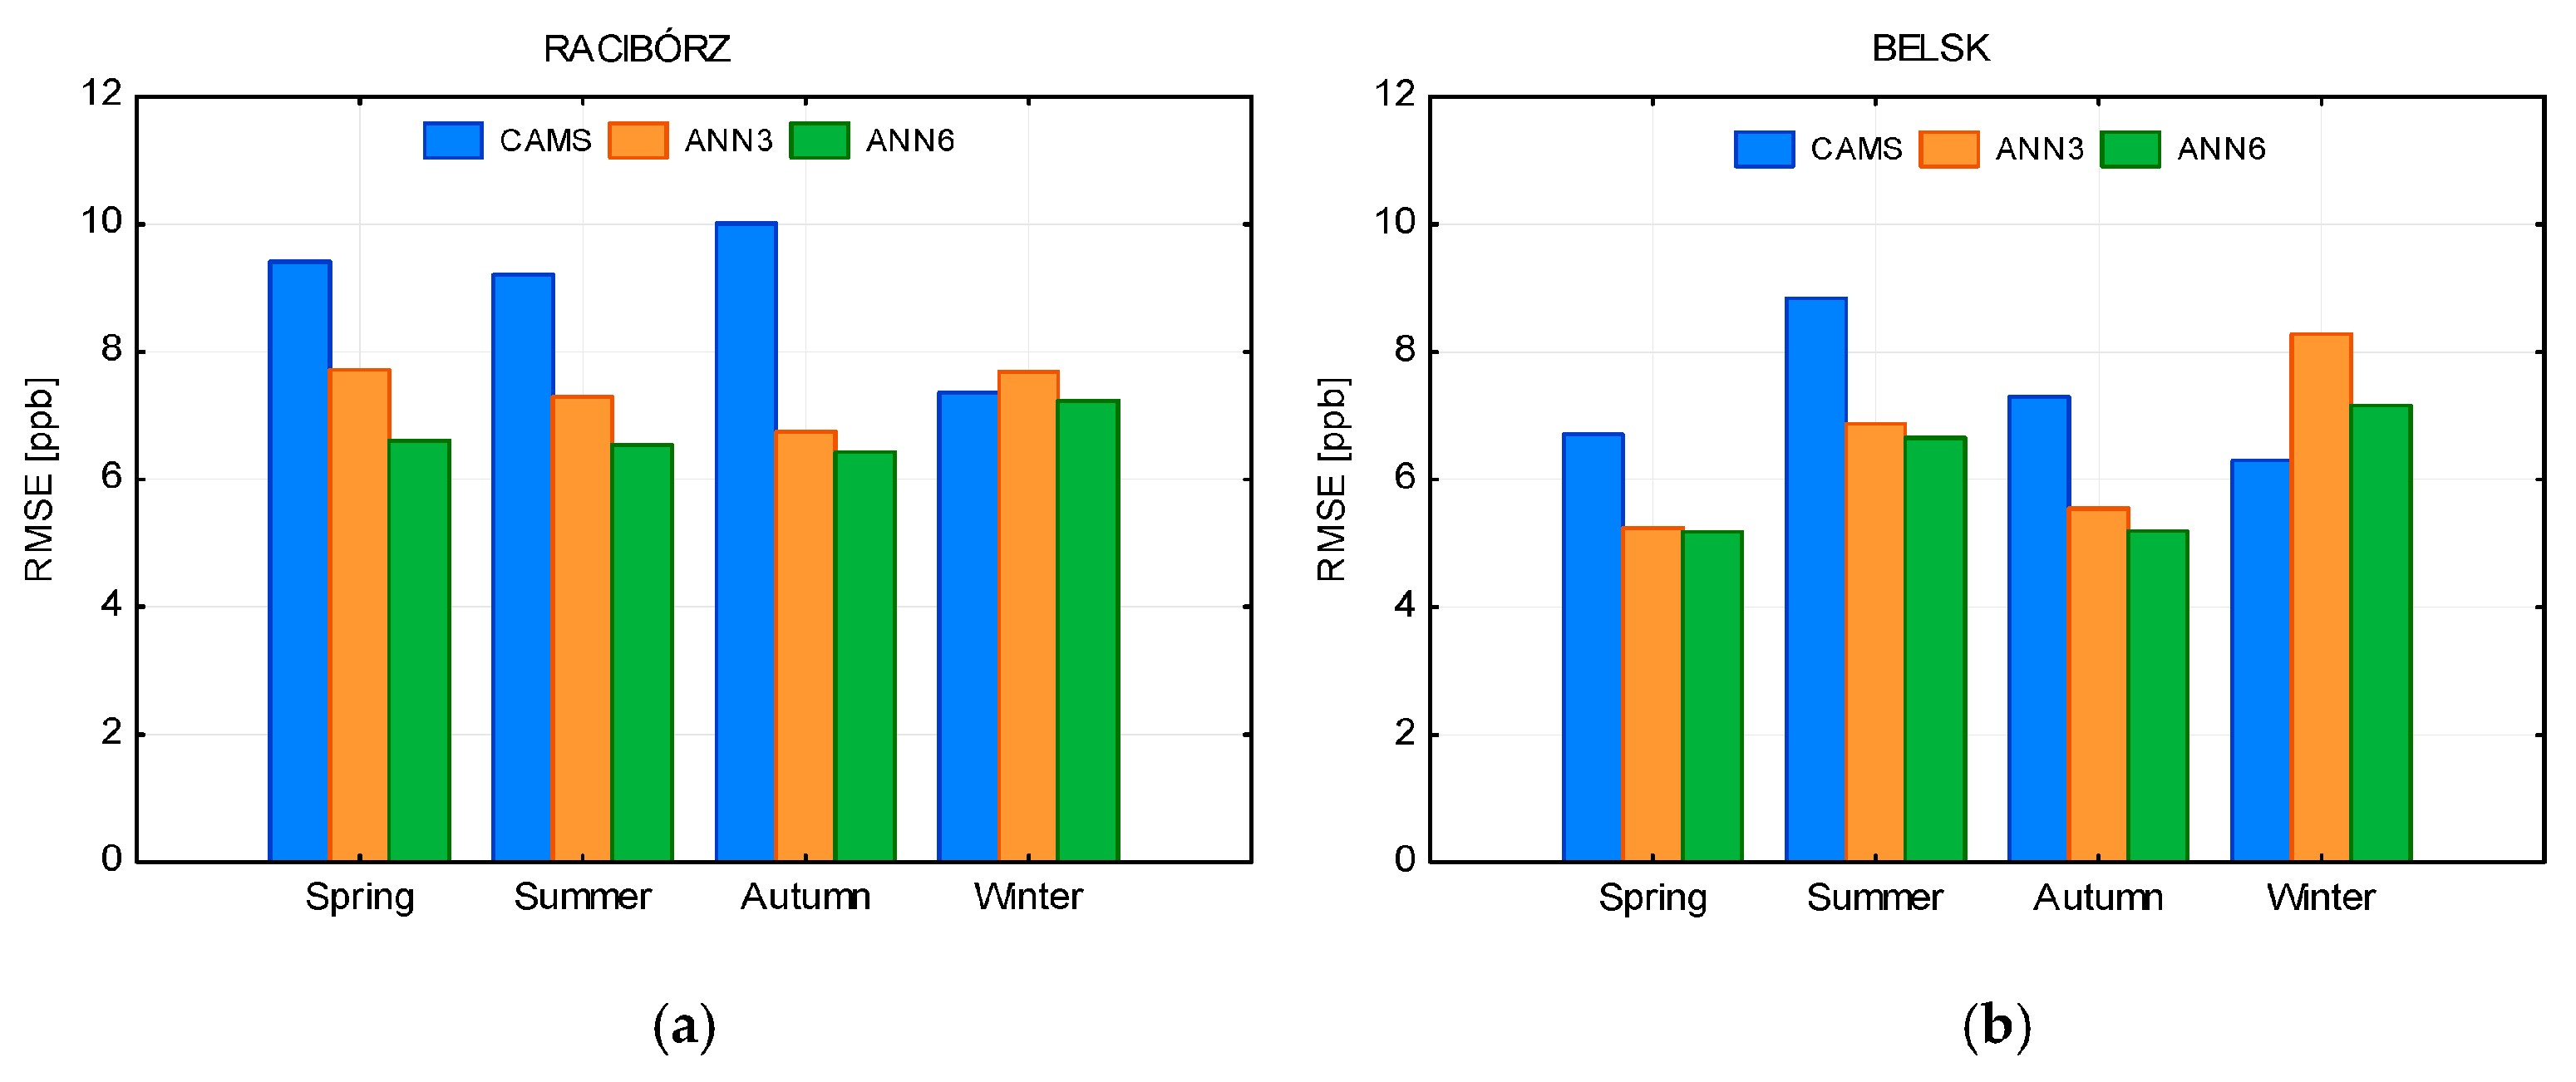
| RMSE | 11.46 | 9.63 | 9.42 | 9.83 | 11.59 | 11.77 | 12.30 | 7.71 | 7.18 | 6.71 | 10.16 | 8.69 | 9.03 | 8.99 |
| Summer | ||||||||||||||
| R2 | 0.61 | 0.53 | 0.70 | 0.61 | 0.56 | 0.56 | 0.41 | 0.54 | 0.42 | 0.60 | 0.40 | 0.49 | 0.45 | 0.41 |
| MBE | 1.58 | 1.37 | 1.89 | 4.49 | 2.50 | 4.12 | 1.78 | 2.12 | 1.83 | 3.10 | 9.34 | 2.93 | 5.36 | 2.69 |
| MAE | 8.04 | 8.66 | 7.34 | 8.76 | 8.49 | 8.80 | 9.66 | 7.02 | 7.62 | 6.82 | 11.39 | 7.65 | 8.85 | 8.11 |
| RMSE | 10.01 | 10.83 | 9.21 | 10.95 | 10.66 | 11.14 | 12.12 | 9.04 | 9.70 | 8.84 | 14.25 | 9.78 | 11.45 | 10.35 |
| Autumn | ||||||||||||||
| R2 | 0.49 | 0.58 | 0.40 | 0.46 | 0.53 | 0.46 | 0.37 | 0.55 | 0.63 | 0.67 | 0.39 | 0.55 | 0.49 | 0.52 |
| MBE | 10.93 | 6.35 | 12.13 | 8.84 | 8.12 | 7.32 | 6.63 | 6.95 | 3.23 | 4.45 | 9.29 | 3.83 | 5.47 | 2.27 |
| MAE | 11.58 | 8.03 | 12.54 | 9.99 | 9.62 | 9.98 | 9.12 | 8.35 | 5.77 | 6.11 | 10.66 | 6.82 | 8.00 | 6.16 |
| RMSE | 13.67 | 10.01 | 16.18 | 12.53 | 11.77 | 12.16 | 11.58 | 9.82 | 7.29 | 7.52 | 12.81 | 8.57 | 9.85 | 7.85 |
| Winter | ||||||||||||||
| R2 | 0.39 | 0.51 | 0.34 | 0.20 | 0.36 | 0.23 | 0.25 | 0.45 | 0.58 | 0.53 | 0.26 | 0.44 | 0.22 | 0.38 |
| MBE | 10.79 | 2.10 | 7.69 | 9.07 | 5.02 | 3.56 | 2.71 | 6.84 | −0.62 | 2.17 | 7.02 | −0.54 | 1.27 | −2.60 |
| MAE | 11.42 | 5.59 | 9.01 | 10.46 | 8.02 | 9.33 | 7.29 | 8.12 | 4.86 | 5.42 | 9.27 | 6.27 | 8.40 | 6.43 |
| RMSE | 13.54 | 7.36 | 12.09 | 13.25 | 10.19 | 11.78 | 9.51 | 9.86 | 6.30 | 6.93 | 11.56 | 7.80 | 10.46 | 8.15 |
| Season | ANN Structure | Error Function | Activation Function (Hidden Layer) | Activation Function (Output Layer) |
|---|---|---|---|---|
| Racibórz | ||||
| Spring | 3-5-1 | BFGS | Tanh | Linear |
| 6-7-1 | BFGS | Tanh | Linear | |
| Summer | 3-8-1 | BFGS | Tanh | Exponential |
| 6-8-1 | BFGS | Tanh | Linear | |
| Autumn | 3-10-1 | BFGS | Tanh | Logistic |
| 6-4-1 | BFGS | Logistic | Linear | |
| Winter | 3-8-1 | BFGS | Logistic | Exponential |
| 6-7-1 | BFGS | Tanh | Exponential | |
| Belsk | ||||
| Spring | 3-5-1 | BFGS | Logistic | Exponential |
| 6-8-1 | BFGS | Logistic | Logistic | |
| Summer | 3-8-1 | BFGS | Exponential | Exponential |
| 6-7-1 | BFGS | Exponential | Linear | |
| Autumn | 3-4-1 | BFGS | Logistic | Linear |
| 6-10-1 | BFGS | Exponential | Tanh | |
| Winter | 3-8-1 | BFGS | Tanh | Tanh |
| 6-9-1 | BFGS | Tanh | Tanh | |
| Index | MLR3 | ANN3 | MLR6 | ANN6 | MLR3 | ANN3 | MLR6 | ANN6 |
|---|---|---|---|---|---|---|---|---|
| Racibórz | Belsk | |||||||
| Spring | ||||||||
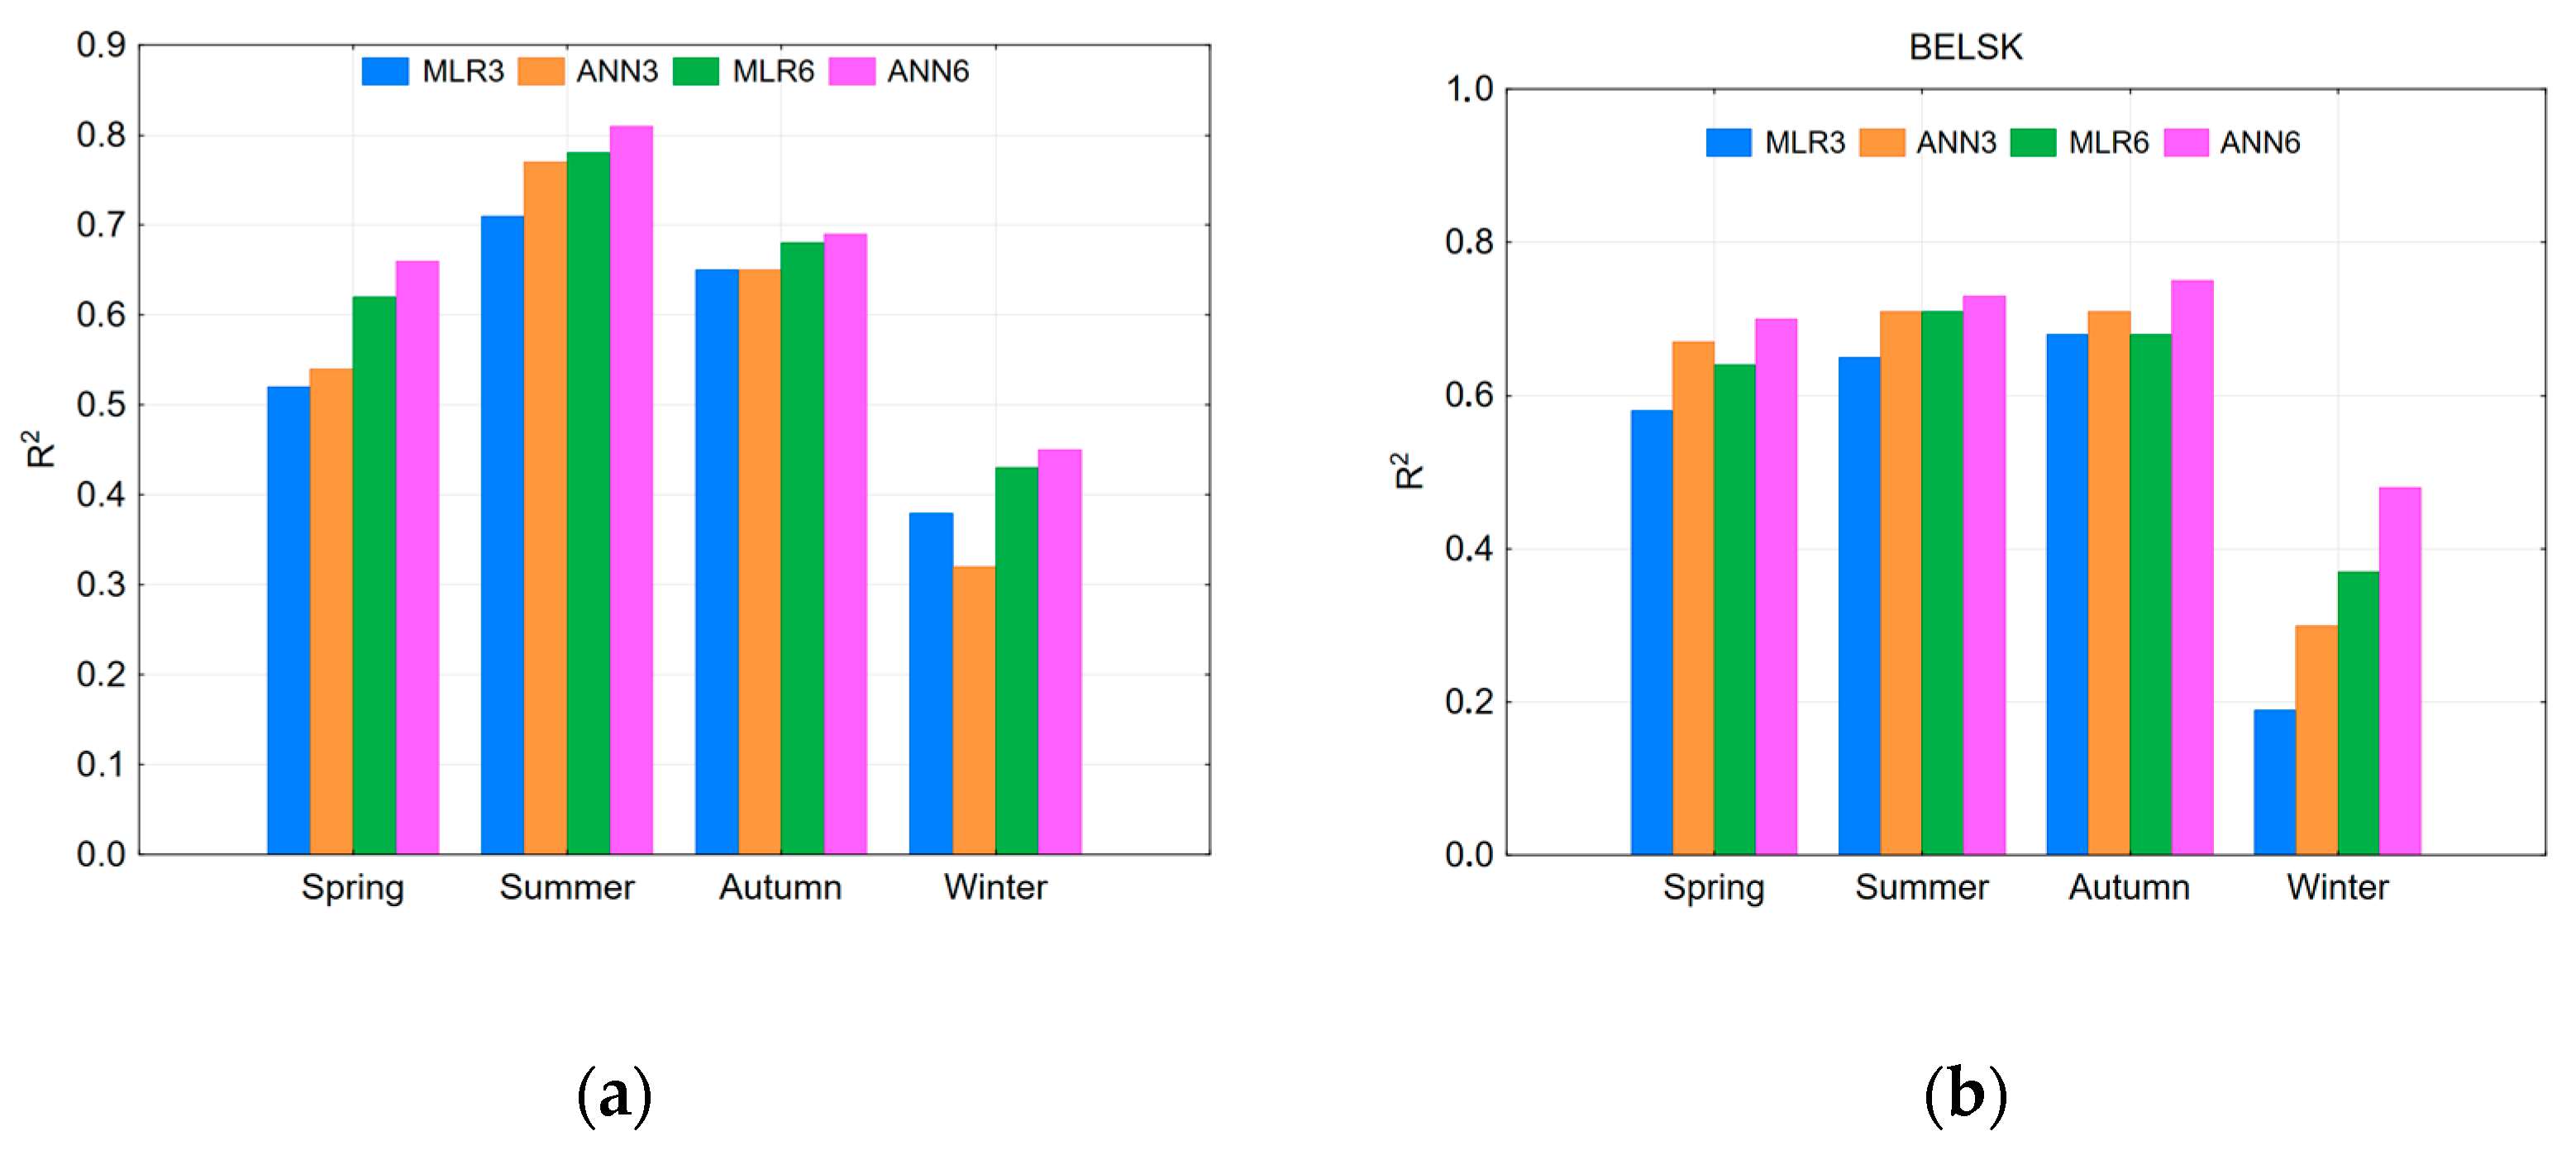
| R2 | 0.52 | 0.54 | 0.62 | 0.66 | 0.58 | 0.67 | 0.64 | 0.70 |
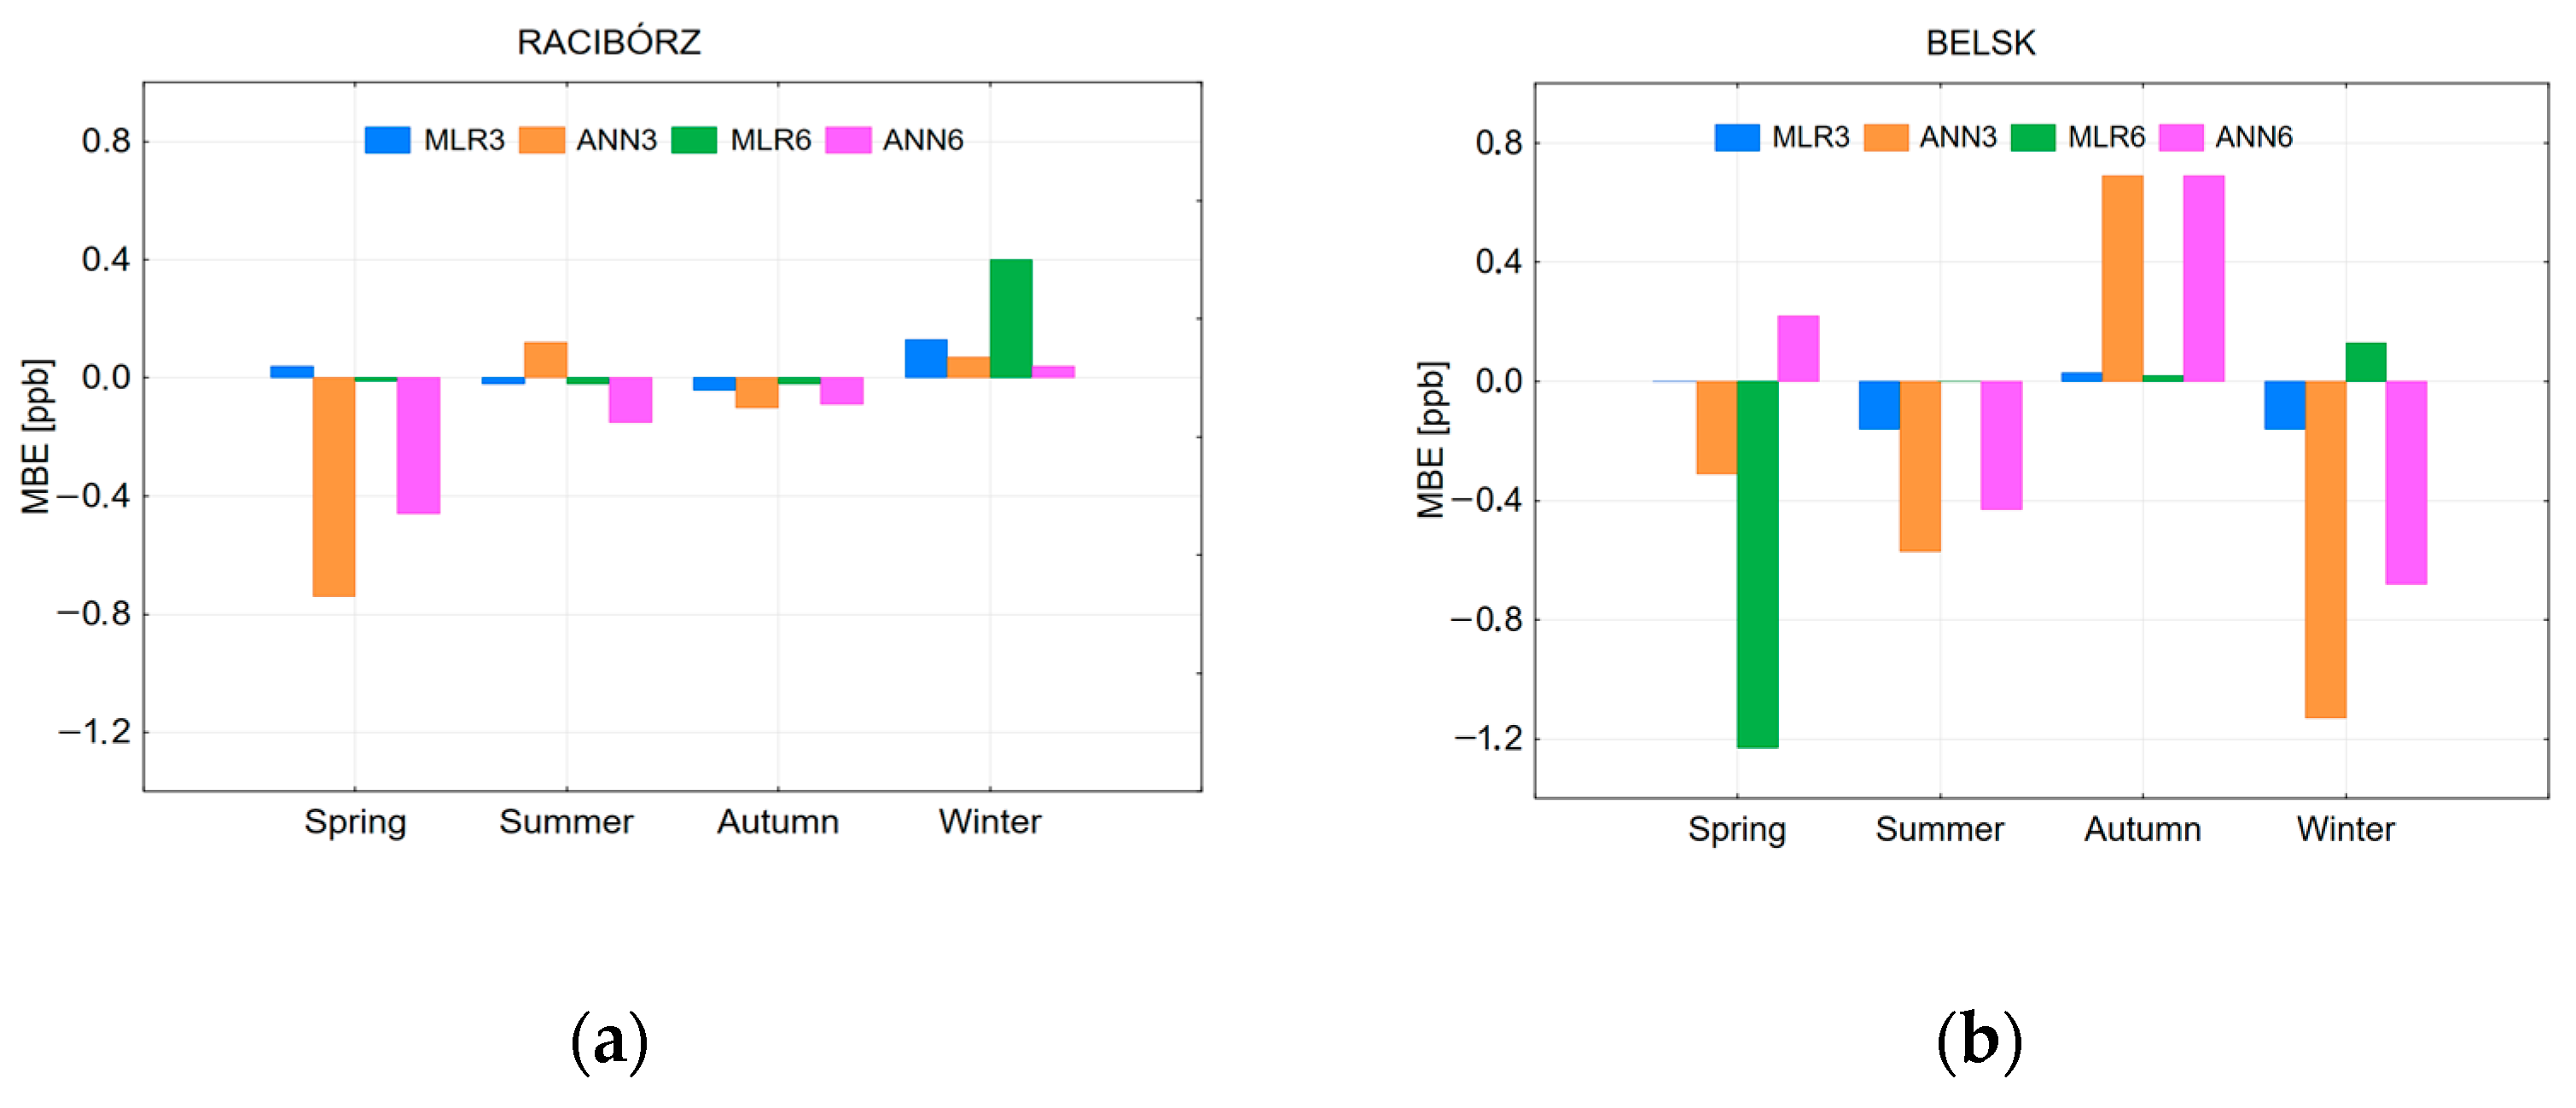
| MBE | 0.04 | −0.74 | −0.01 | −0.46 | 0.00 | −0.31 | −1.23 | 0.22 |
| MAE | 6.55 | 5.91 | 5.85 | 5.12 | 5.01 | 4.09 | 4.75 | 4.01 |
| RMSE | 8.38 | 7.72 | 7.49 | 6.61 | 6.31 | 5.24 | 6.04 | 5.18 |
| Summer | ||||||||
| R2 | 0.71 | 0.77 | 0.78 | 0.81 | 0.65 | 0.71 | 0.71 | 0.73 |
| MBE | −0.02 | 0.12 | −0.02 | −0.15 | −0.16 | −0.57 | 0.00 | −0.43 |
| MAE | 6.62 | 5.49 | 5.68 | 5.08 | 5.76 | 5.31 | 5.32 | 5.21 |
| RMSE | 8.39 | 7.29 | 7.27 | 6.54 | 7.48 | 6.87 | 6.81 | 6.65 |
| Autumn | ||||||||
| R2 | 0.65 | 0.65 | 0.68 | 0.69 | 0.68 | 0.71 | 0.68 | 0.75 |
| MBE | −0.04 | −0.10 | −0.02 | −0.09 | 0.03 | 0.69 | 0.02 | 0.69 |
| MAE | 5.64 | 5.41 | 5.30 | 5.18 | 4.75 | 4.26 | 4.52 | 4.07 |
| RMSE | 7.03 | 6.75 | 6.57 | 6.43 | 6.04 | 5.54 | 5.98 | 5.19 |
| Winter | ||||||||
| R2 | 0.38 | 0.32 | 0.43 | 0.45 | 0.19 | 0.30 | 0.37 | 0.48 |
| MBE | 0.13 | 0.07 | 0.40 | 0.04 | −0.16 | −1.13 | 0.13 | −0.68 |
| MAE | 6.48 | 6.34 | 5.94 | 5.84 | 6.96 | 6.74 | 6.00 | 5.86 |
| RMSE | 8.05 | 7.69 | 7.37 | 7.23 | 8.49 | 8.28 | 7.49 | 7.16 |
Disclaimer/Publisher’s Note: The statements, opinions and data contained in all publications are solely those of the individual author(s) and contributor(s) and not of MDPI and/or the editor(s). MDPI and/or the editor(s) disclaim responsibility for any injury to people or property resulting from any ideas, methods, instructions or products referred to in the content. |
© 2023 by the authors. Licensee MDPI, Basel, Switzerland. This article is an open access article distributed under the terms and conditions of the Creative Commons Attribution (CC BY) license (https://creativecommons.org/licenses/by/4.0/).
Share and Cite
Pawlak, I.; Fernandes, A.; Jarosławski, J.; Klejnowski, K.; Pietruczuk, A. Comparison of 24 h Surface Ozone Forecast for Poland: CAMS Models vs. Simple Statistical Models with Limited Number of Input Parameters. Atmosphere 2023, 14, 670. https://doi.org/10.3390/atmos14040670
Pawlak I, Fernandes A, Jarosławski J, Klejnowski K, Pietruczuk A. Comparison of 24 h Surface Ozone Forecast for Poland: CAMS Models vs. Simple Statistical Models with Limited Number of Input Parameters. Atmosphere. 2023; 14(4):670. https://doi.org/10.3390/atmos14040670
Chicago/Turabian StylePawlak, Izabela, Alnilam Fernandes, Janusz Jarosławski, Krzysztof Klejnowski, and Aleksander Pietruczuk. 2023. "Comparison of 24 h Surface Ozone Forecast for Poland: CAMS Models vs. Simple Statistical Models with Limited Number of Input Parameters" Atmosphere 14, no. 4: 670. https://doi.org/10.3390/atmos14040670
APA StylePawlak, I., Fernandes, A., Jarosławski, J., Klejnowski, K., & Pietruczuk, A. (2023). Comparison of 24 h Surface Ozone Forecast for Poland: CAMS Models vs. Simple Statistical Models with Limited Number of Input Parameters. Atmosphere, 14(4), 670. https://doi.org/10.3390/atmos14040670


