Article

Impacts of Cyclones on Arctic Clouds during Autumn in the Early 21st Century

1
Frontiers Science Center for Deep Ocean Multispheres and Earth System (FDOMES)/Key Laboratory of Physical Oceanography/Academy of the Future Ocean/College of Oceanic and Atmospheric Science, Ocean University of China, Qingdao 266100, China
2
Shandong Electric Power Engineering Consulting Institute Corp., Ltd., Jinan 250013, China
*
Author to whom correspondence should be addressed.
Atmosphere 2023, 14(4), 689; https://doi.org/10.3390/atmos14040689
Submission received: 31 January 2023 / Revised: 29 March 2023 / Accepted: 3 April 2023 / Published: 6 April 2023
(This article belongs to the Special Issue Feature Papers in Meteorological Science)

Abstract

:
Our study shows that, during 2001–2017, when the sea ice was melting rapidly, cyclone days accounted for more than 50% of the total autumn days at the sounding stations in the Arctic marginal seas north of the Eurasian continent and almost 50% of the total autumn days at the sounding station on the northern coast of Canada. It is necessary to investigate the influence of Arctic cyclones on the cloud fraction in autumn when the sea ice refreezes from its summer minimum and the infrared cloud radiative effect becomes increasingly important. Cyclones at the selected stations are characterized by a narrow maximum rising zone with vertically consistent high relative humidity (RH) and a broad region outside the high RH zone with low RH air from the middle troposphere covering the low troposphere’s high relative humidity air. Consequently, on approximately 40% of the cyclone days, the cloud formation condition was improved from the near surface to the upper troposphere due to the cooling of strong rising warm humid air. Therefore, cyclones lead to middle cloud increases and sometimes high cloud increases, since the climatological Arctic autumn clouds are mainly low clouds. On approximately 60% of the cyclone days, only low cloud formed, but the low cloud formation condition was suppressed due to the mixing ratio decrease induced by cold dry air sinking. As a result, cyclones generally lead to a decrease in low clouds. However, the correlation between the cyclones and low clouds is complex and varies with surface ice conditions.

1. Introduction

Arctic warming is accompanied by a rapid decrease in sea ice [1,2] and significant and obvious atmospheric changes, namely, increases in air humidity and temperature [3,4]. The infrared cloud radiative effect (CRE) plays an important role in the energy balance and air temperature variation over the Arctic through cloud radiation feedback [5,6,7,8]. The net radiative effect of Arctic low-level clouds warms the surface, except during a short period in midsummer [9,10]. Though the highest cloudiness period in the Arctic is from June to October [11], the CRE is almost balanced by cloud radiation cooling [12,13]. However, in autumn, when sea ice transits from melting to the initiation of freeze up, cloud changes contribute to cloud–ice feedback during early autumn [13]. Autumn cloud–ice feedback is also considered to be a delayed response of melting season sea ice anomalies [14]. In wetter and warmer Arctic conditions [3], CRE increases in autumn and winter [15,16]. The trends in cloud characteristics (cloud amount, water content, and radiative forcing) have the strongest and most consistent amplifying effect during autumn [16,17,18]. Therefore, it is necessary to pay further attention to the change in autumn clouds in the Arctic.
Previous studies observed the relationship between Arctic clouds and sea ice change. Schweiger et al. showed that sea ice retreat is linked to a decrease in the low-level cloud amount and a simultaneous increase in midlevel clouds [19]. Sato et al.’s model results indicate that ice-free conditions lead to a 30% decrease in the frequency of low clouds with a ceiling below 500 m [20]. Vavrus et al. pointed out that rapidly declining Arctic sea ice will be accentuated by changes in polar clouds [21]. Liu et al. found that moisture intrusions in winter produce more clouds and higher cloud liquid and ice water content [22]. There are also some observational studies and collaborative modeling studies. Sedlar et al. and Inoue et al. respectively reanalyzed and verified regional climate models of the Arctic atmosphere with shipborne data [23,24]. Shupe et al. analyzed the clouds and sea ice observed during the Multidisciplinary Drifting Observatory for the Study of Arctic Climate and found that clouds drift with sea ice [25]. However, few studies discuss autumn cloud changes under the conditions of increased cyclone occurrence over the Arctic. As indicated in many previous studies, mid-latitude cyclones were found to be the main cause of middle cloud formation and high cloud formation [26,27,28], and cyclone-induced cloud fraction (CF) can be larger than 0.7 in mid-latitude [29]. Arctic warming leads to a significant change in Arctic cyclone activities. Since the middle of the 20th century, there has been an increasing trend of Arctic cyclones due to the increasing number of mid-latitude polar cyclones [30,31]. The regions and paths of the Arctic cyclones have obvious distribution characteristics and seasonal variations. In summer, Arctic cyclones are mostly formed in Eurasia, while in autumn and winter, cyclones mainly move from the northern part of the North Atlantic Ocean to Greenland and the Barents Sea [32]. Inoue and Hori verified that in the marginal ice region of the Arctic, the thermal contrast between the ocean and the ice surface may be more conducive to the formation of cyclones [33]. Zhang et al. showed that the number and intensity of cyclones entering the Arctic from the mid-latitudes have increased, suggesting a shift of storm tracks into the Arctic [31]. Day et al. indicated that the number of Arctic Ocean cyclones reaches its maximum in summer and the number of cyclones increases with the retreat of the Arctic Sea ice [34].
Therefore, it is necessary to investigate the impact of cyclones on cloud fraction in the Arctic. Few studies focus on the connection between Arctic clouds and cyclones. Inoue et al. indicated that strong winds lead to an increase in particulate matter entering the lower atmosphere, corresponding to more low-level ice clouds [35]. Waseda et al. confirmed an increase in wave height [36]. The effect of Arctic cyclones on sea ice and snowfall is also related to the effect of showing cyclones [37]. The earlier observational study of Huschke [38] has shown that the maxima of middle and high cloudiness in October corresponds very well to the high degree of cyclonic activity over the Arctic during that month, a study that suggests cyclones have obvious influence on clouds in the Arctic. In this study, we investigated how Arctic cyclones influence cloud formation and how low clouds change during autumn in the conditions of increased Arctic cyclones. Our study may offer new insights into Arctic cloud variability during autumn. The data and methods are introduced in Section 2. In Section 3, we outline the statistical connection between autumn cloud change and cyclone behaviors in the Arctic, and further detail the impact of cyclones on clouds over the surface with different ice coverage conditions based on all of the cyclone days at the five selected locations. The conclusions and discussion are given in Section 4.

2. Data and Methods

2.1. Data

In this paper, cloud fraction is used to reflect cloud distribution characteristics. The autumn (September–November) cloud fraction data used in this study are from both satellite data and ERA5 reanalysis data. Cloud fraction is the proportion of a grid box covered by cloud, and the value ranges from 0 to 1. We used the Clouds and Earth’s Radiant Energy System (CERES) Synoptic TOA and surface fluxes and clouds (SYN1deg) Ed4A daily gridded cloud area fraction for the period 2001–2017, with a horizontal resolution of 1° × 1° (the CERES data hereafter), in which the low clouds, the mid-low clouds, and the mid-high clouds refer to clouds at the heights of from the surface to 700, from 700 to 500, and from 500 to 300 hPa, respectively. The CERES-SYN1deg data combine Terra and Aqua CERES and MODIS observations and geostationary (GEO) data to provide cloud properties [39]. Huang et al. demonstrated that CERES’s Arctic cloud fractions are more reliable in summer than in winter [40]. Zhan et al. proposed that MISR tends to underestimate cloud cover compared with CERES, which uses cloud attributes based on MODIS measurements [41].
We also used the CALIPSO-GOCCP, developed from the CALIPSO level 1 attenuated backscatter measurements, for evaluating clouds in climate models [42]. CALIPSO-GOCCP is well suited for Arctic assessment because of its high vertical resolution and the advantages of observing Arctic liquid clouds [43,44]. However, Arctic clouds are mostly underestimated in GOCCP [45,46]. CALIPSO-GOCCP cannot detect clouds near the surface or the optically thinnest clouds [42]. The daily CALIPSO-GOCCP observations of cloud fraction for the period of 2006–2017 (GOCCP data hereafter), with a vertical resolution of 480 m and a horizontal resolution of 1° × 1° (https://climserv.ipsl.Polytechnique.fr/cfmip-obs/index.html, accessed on 2 March 2020), are used.
The cloud fraction data from the ERA5 reanalysis include the fraction of cloud cover at pressure levels from 1000 to 200 hPa. We used the low cloud cover (1.0 > sigma > 0.8), the medium cloud cover (0.8 ≥ sigma > 0.45), and the high cloud cover (0.45 ≥ sigma) during autumn for the period 2006–2017, with a horizontal resolution of 1° × 1°. Sigma is a multiple greater than the pressure at the ground. For example, low cloud is a single-level field calculated from cloud occurring on model levels with a pressure greater than 0.8 times the surface pressure. If the surface pressure is 1000 hPa, low cloud can be calculated using levels with a pressure greater than 800 hPa (below approximately 2 km (assuming a ‘standard atmosphere’)). Sedlar et al. and Inoue et al. demonstrated that ERA5 performed well in both ice-covered and ice-free Arctic oceans [23,24]. Inoue et al. suggest that ERA5 performs better in terms of vertical cloud structure and cloud phase than regional climate model outputs because it absorbs many satellite data [24].
The relative humidity, air temperature, and vertical velocity are at the pressure levels from 1000 to 200 hPa and the sea level pressure is from the ERA-interim reanalysis for the period 2001–2017, with a horizontal resolution of 1° × 1° (https://apps.ecmwf.int/datasets/data/interim-full-daily/levtype=sfc/, accessed on 26 April 2020). The satellite-based observations of sea ice concentration are from the NOAA OI SST V2 High Resolution Dataset, with a horizontal resolution of 0.25° × 0.25° (https://psl.noaa.gov/data/gridded/data.noaa.oisst.v2.highres.html, accessed on 1 April 2020). The sounding data used in this study include air temperature, mixing ratio, relative humidity, and dew point deficit at 1200 UTC and were obtained from the online data archive at the University of Wyoming (http://weather.uwyo.edu/upperair/sounding.html, accessed on 26 April 2020). However, the available sounding data have different temporal lengths at different stations. The five sounding stations selected in this study are station 20744 (Malye Karmakuly Observations, 72.36° N, 52.7° E), with a data length of 12 years from 2006 to 2017; station 01028 (ENBJ Bjornoya Observations, 74.5° N, 19.00° E), with a data length of 17 years from 2001 to 2017; station 21432 (Ostrov Kotelnyj Observations, 76.00° N, 137.86° E), with a data length of 6 years from 2011 to 2016; station 20046 (Polargmo Im. Krenkelja Observations, 80.61° N, 58.05° E), with a data length of 9 years from 2009 to 2017, and station 71957 (YEV Inuvik Observations, 68.31° N, 133.53° W), with a data length of 15 years from 2001 to 2009 and 2012 to 2017.
The five chosen stations represent three categories of different ground surfaces: the ice edge, the ice-covered sea, and the ice-covered land coast. Two ice edge stations are located at the west edge (sounding station 01028) and east edge (sounding station 20744) of the Barents Sea. Two sea ice-covered island stations are located at the Franz Josef Land (northeast edge of the Barents Sea, sounding station 20046) and the New Siberian Islands (sounding station 21432). The ice-covered land coast station is located on the northern Canadian coast (sounding station 71957). They are denoted as the colored spots in Figure 1.

2.2. Methods

With the update of numerical algorithms and the available data, cyclone tracking has experienced a process from manual recognition to automatic and semi-automatic objective recognition. Scholars have proposed that the potential height field of 1000 hPa, the sea level pressure field, and the relative vorticity field of the lower troposphere can be used as analysis fields to identify cyclones [47,48,49]. The cyclone definition and tracking scheme used in this study follows the cyclone tracking method of Hart [48]. The detailed tracking methods used in this study can be found in Sun and Diao [50]. Considering the spatial scale of cyclones, the grid-based cyclone frequencies are calculated according to the recognized cyclone cases as follows: At a given time, when a cyclone center is detected at a grid point, the cyclone frequency at the grid points within the 5° × 5° square around it is increased by one. We used composites at the locations of the five sounding stations shown in Figure 1, utilizing the ground-based sounding data at these stations and the gridded satellite data and the ERA5 data at the grids nearest to the five stations.
At a given station, we defined a cyclone day as a day in which at least one cyclone center appears within a distance of approximately 800 km from the given station. A no-cyclone day is a day in which no cyclone appears in the 800 km sounding station-centered circle. Because the radius of a large-scale traveling extratropical cyclone is generally larger than 1000 km [51,52], the chosen distance from a given station ensures that air over the station is influenced by cyclones; thus, the cloud fraction on the day can be considered to have been influenced by cyclones. The number of cyclone days at the five selected stations is shown in Table 1.
We use a cyclone-centered composite to show the distributions of cyclone wind velocity and relative humidity field at the five stations based on all of the selected cyclone days. The cyclone-centered composite means that the coordinate origin of the composite field is the center point of the cyclones. The x axis ranges from 40° west to 40° east of the center point, and the y axis ranges from 8° south to 8° north of the center point. The composites of local vertical profiles of the cloud fraction and other variables on the cyclone days are based on all of the selected cyclone days and the no-cyclone days. The composited cloud fractions and other variables based on the no-cyclone days are considered the background state. We used the cloud formation criterion referred to in Poore et al. [53], which is a criterion based on the vertical distributions of dew point deficit and air temperature. The cloud forms when either of the following conditions are met. If the air temperature is warmer than 0 °C, the dew point deficit should be less than 1.7 °C; the dew point deficit is less than 3.4 °C when the air temperature is between −20 and 0 °C, and the dew point deficit is less than 5.2 °C when the temperature is between −40 and −20 °C.

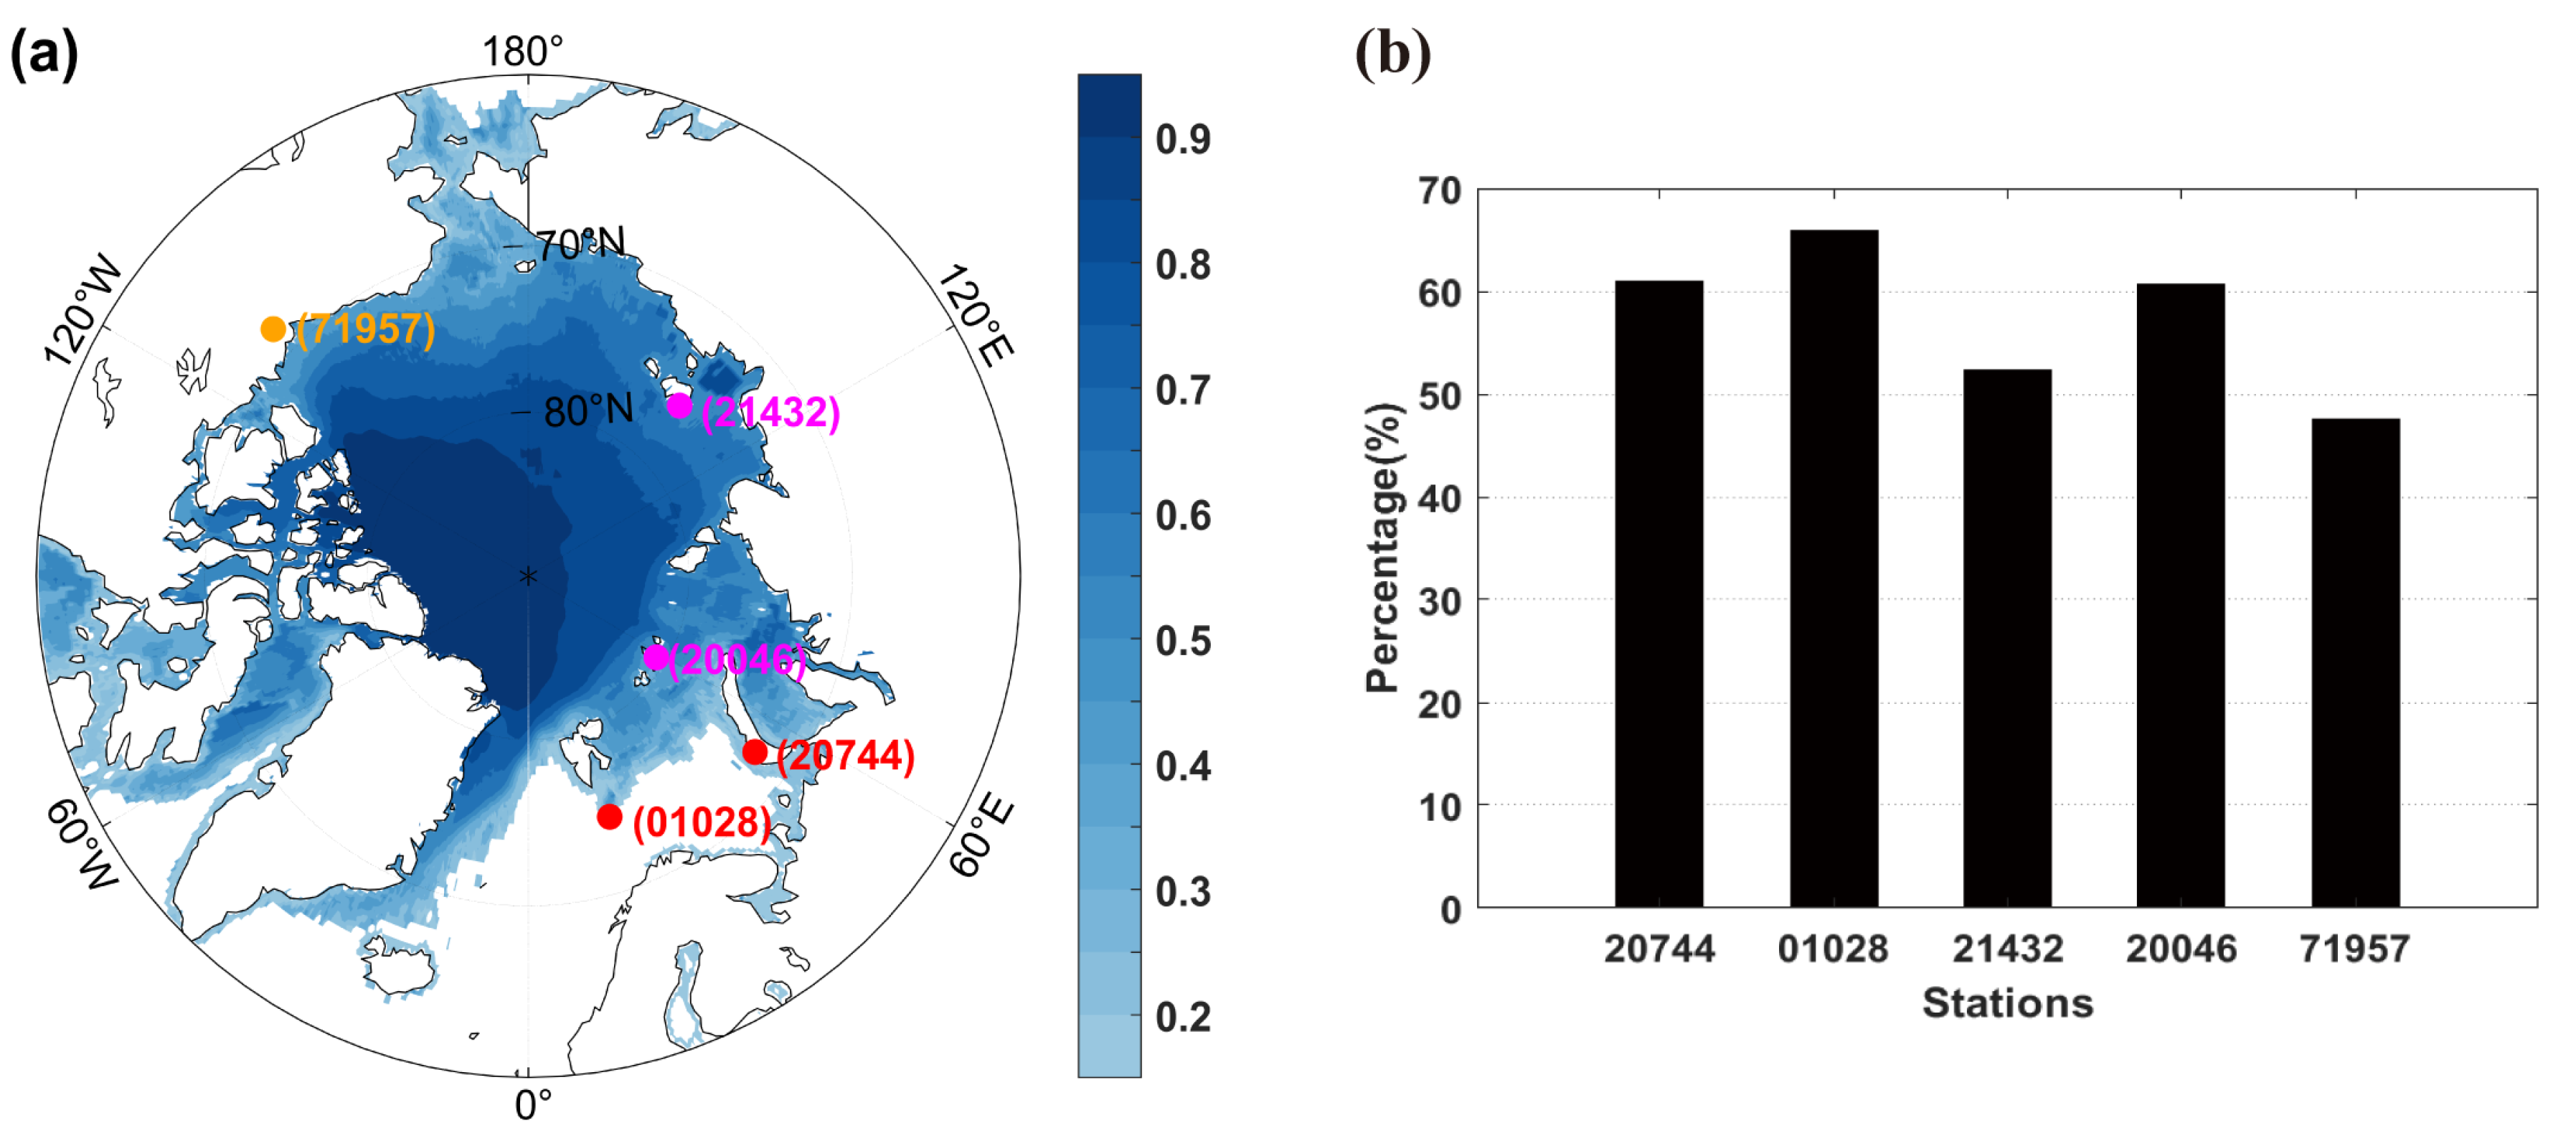
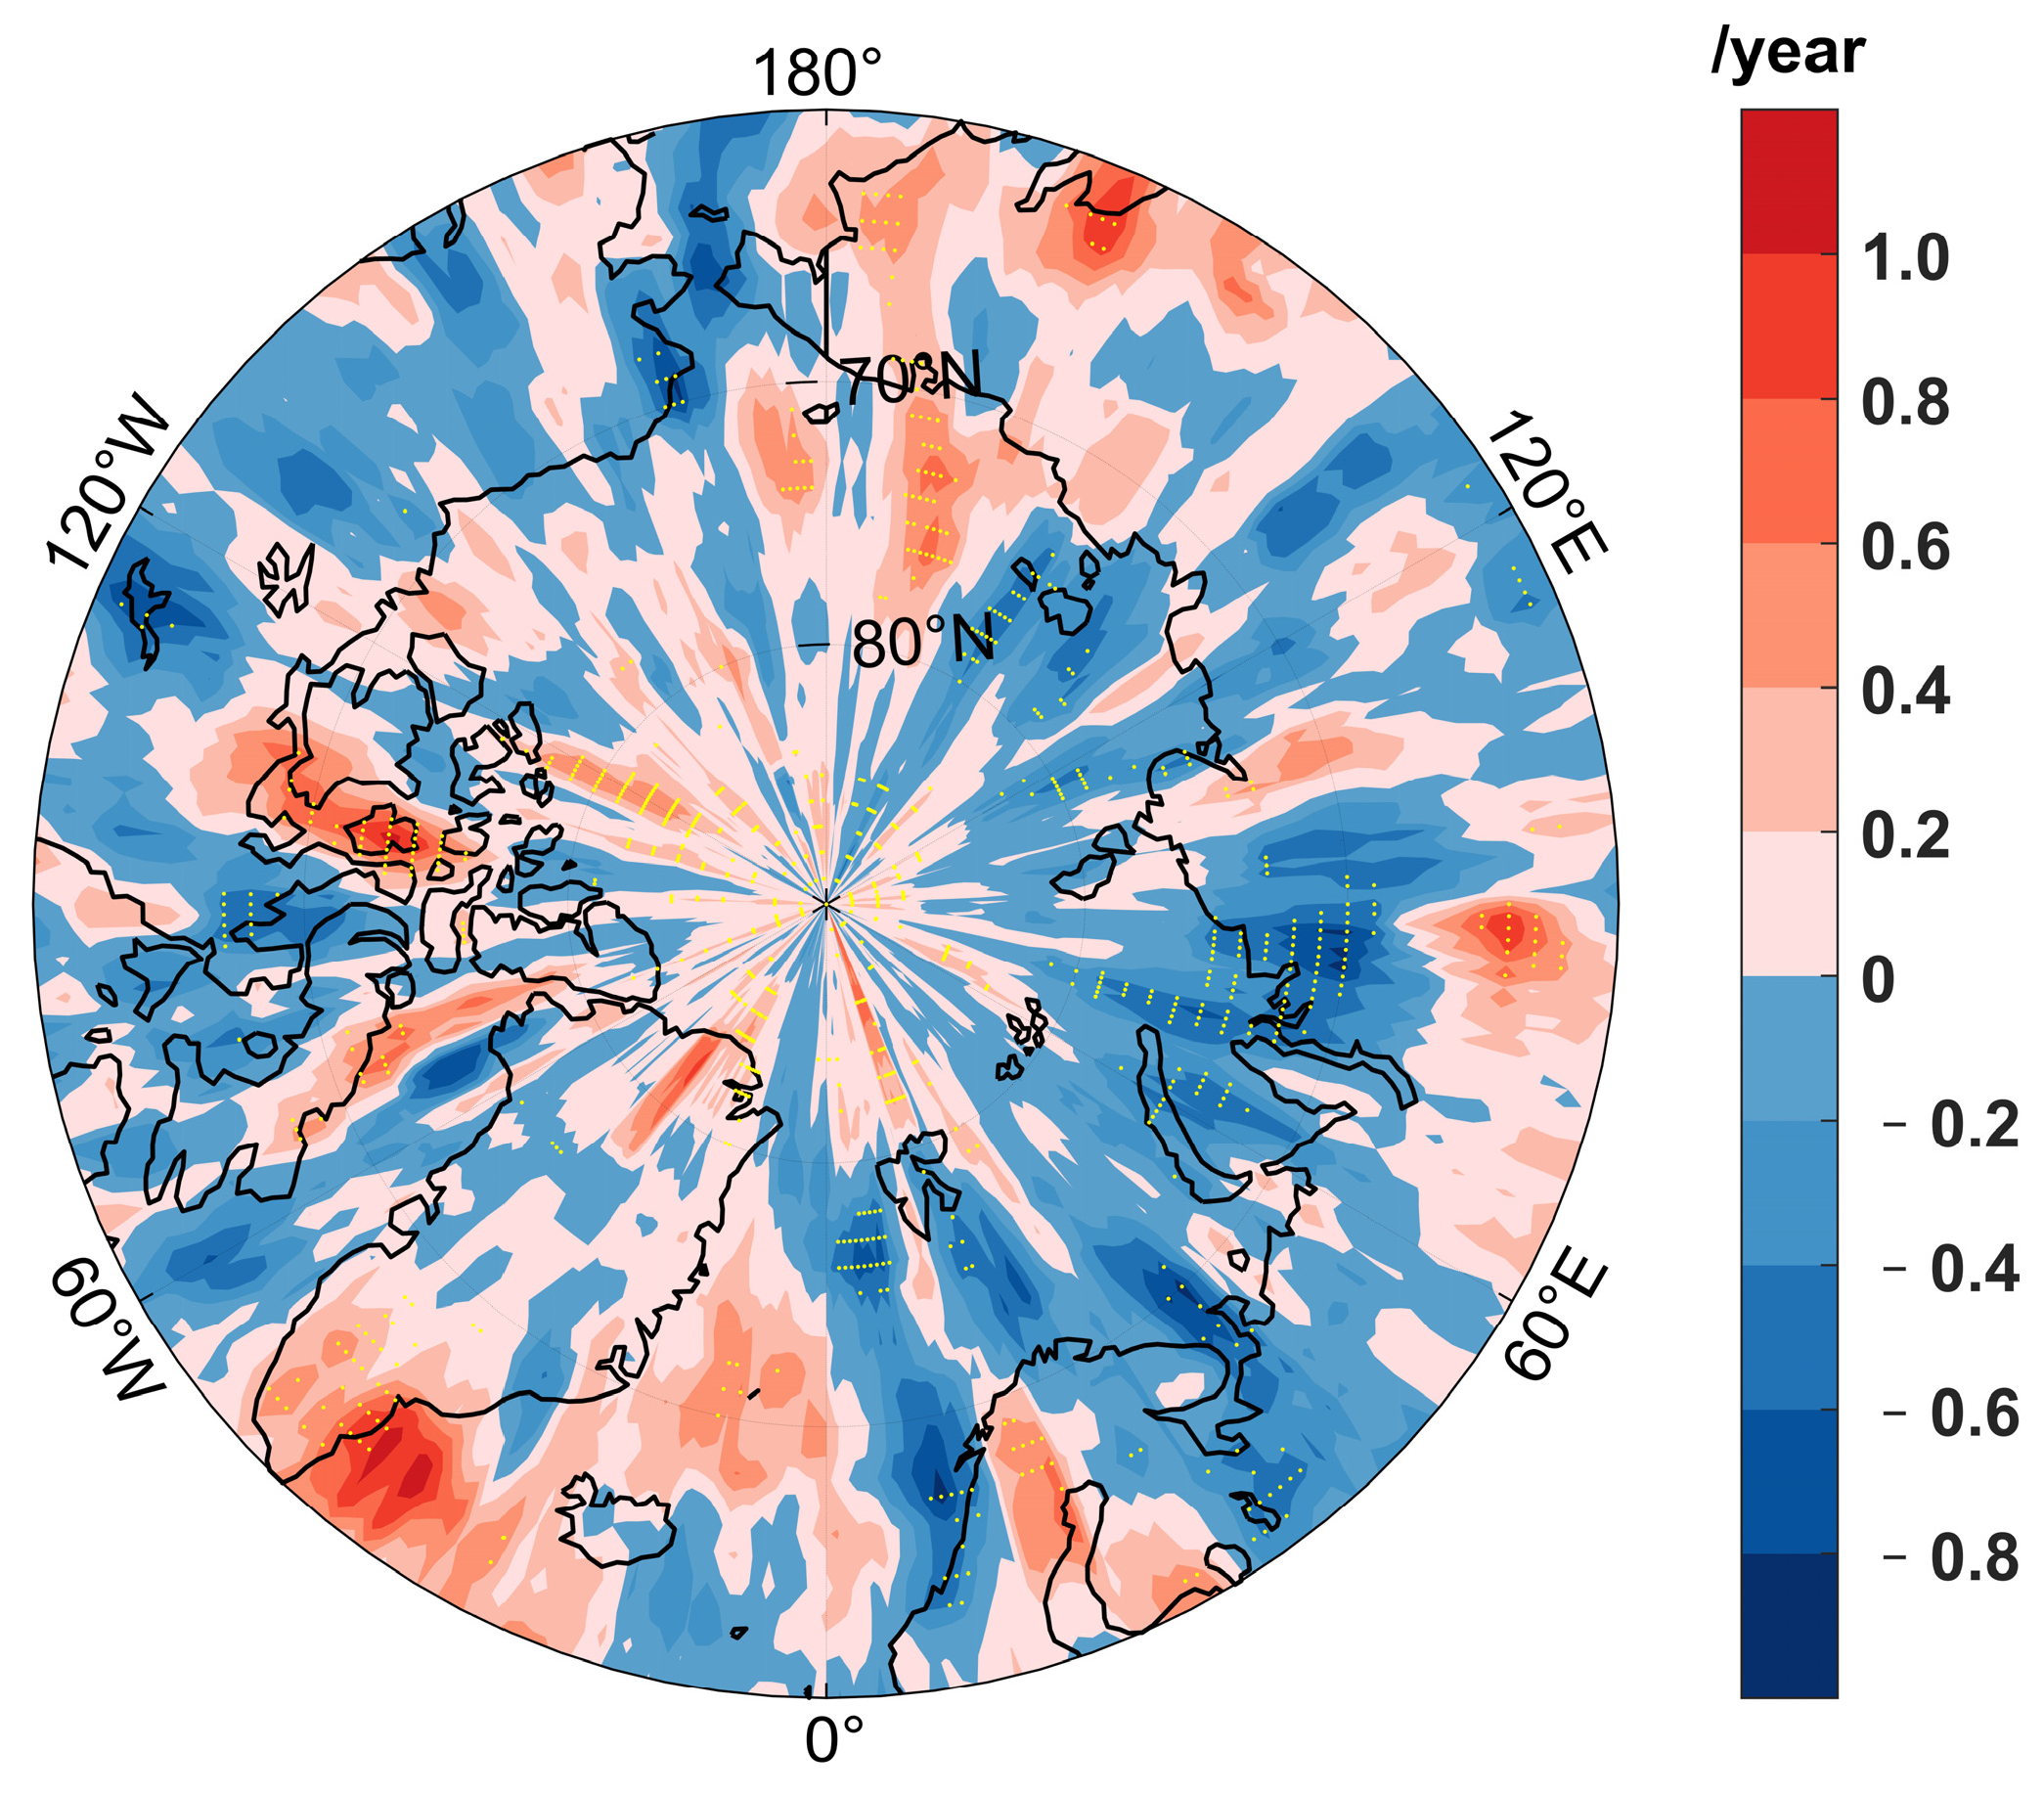
3. Statistical Connection between Autumn Cloud Change and Cyclone Activities

As shown in Figure 2, both the CERES data and the ERA5 reanalysis data illustrate a trend of low cloud fraction decrease and middle cloud fraction increase during autumn over several regions of the Arctic, typically over the Beaufort Sea, the Chukchi Sea, and the East Siberian Sea. Meanwhile, autumn cyclone frequencies present an increasing trend over the above regions with low clouds decreasing and middle and high clouds increasing (Figure 3). However, for the low cloud, there are discrepancies between the results of the two data sources, and its relationship with cyclones varies as surface ice conditions change. Over the Greenland Sea, the ERA5 reanalysis data show an increase in low cloud, but the CERES data show a decrease in low cloud fraction. At the Barents–Kara seas, both cyclones and low cloud fraction have a decreasing trend, which is different from the situations over the regions from Beaufort Sea to East Siberian Sea.
The detrended inter-annual correlation coefficient between cloud variation and cyclone activities during autumn for the period 2001–2017 is shown in Figure 4. Both the CERES data and the ERA5 data show a positive correlation between mid-low clouds and cyclone frequencies over most of the Arctic Ocean and a positive correlation between the mid-high clouds and cyclone frequencies over the Beaufort–Chukchi–East Siberian seas and east of Greenland. This is consistent with the positive trends of both the mid-low and mid-high clouds and cyclone frequency shown in Figure 2 and Figure 3. However, discrepancies exist among the correlations between the low clouds and the cyclones calculated from the two different data sources. The CERES data show a negative correlation between low clouds and cyclones over the Beaufort–Chukchi–East Siberian seas and Greenland Sea, but a positive correlation over the Barents–Kara seas. However, the ERA5 data do not show a consistently negative correlation between low clouds and cyclones over the Beaufort–Chukchi–East Siberian seas. The discrepancy between the correlation results from the two data sources implies the inconsistency of the inter-annual variation of clouds and cyclones. This inconsistency may also come from the difference between the two types of cloud data.
The vertical and latitudinal distributions of the correlation between the zonal mean daily cloud variabilities and the daily cyclone activities over the Arctic were further calculated for the zonal mean values using the ERA5 reanalysis data (Figure 5) in order to show a continuous figure of the correlation between cloud fraction and cyclone frequency along altitudes. The results show that there is a negative correlation between cyclones and cloud cover at low levels. From 65° N to 90° N, the height of the negative correlation between cloud fraction and cyclone frequency decreases with latitude. It is the highest near to 65° N, which can reach 900 hPa and is limited below 975 hPa north of 75° N. The sign of the correlation between cyclones and cloud cover reverses as the altitude increases. Cyclone frequency is positively correlated with cloud cover above the height of negative correlation below 400 hPa, which also indicates that the middle cloud fraction increases as the cyclone frequency increases. Therefore, cyclone activities are positively correlated with the mid-low (700–500 hPa) clouds in the daily, inter-annual, and trend timescales, which indicates that the positive correlation between the cloud fraction and cyclone frequency is rather stable. From 65° N to 90° N, the height of the negative correlation between the cloud fraction and cyclone frequency decreases with latitude. Above 400 hPa, the cloud fraction is negatively correlated with the cyclone frequency.

4. Further Insight into the Influence of Cyclones on Cloud

Considering the condition of autumn mean sea ice concentration (SIC) (Figure 1), which shows that the SIC over the Barents–Kara seas is much smaller than the SIC over the Beaufort Sea, the Chukchi Sea, and the East Siberian Sea during autumn, the geographic distributions of the cyclone–cloud correlation coefficient shown in Figure 4 indicate that the correlation between cyclones and cloud fractions is connected to the surface conditions of sea ice coverage. In order to discover the possible reasons that explain the statistic correlations between clouds and cyclones, we further investigated how cyclones influence cloud formation and its vertical distribution based on all of the cyclone days during the autumns of 2001–2017 at the five selected sounding stations (shown by the color spots in Figure 1), which represent the three different surface conditions, the ice edge stations (station 01028 and station 20744), the ice-covered island stations (station 20046 and station 21432), and the ice-covered land coast station at the north coast of Canada (station 71957).

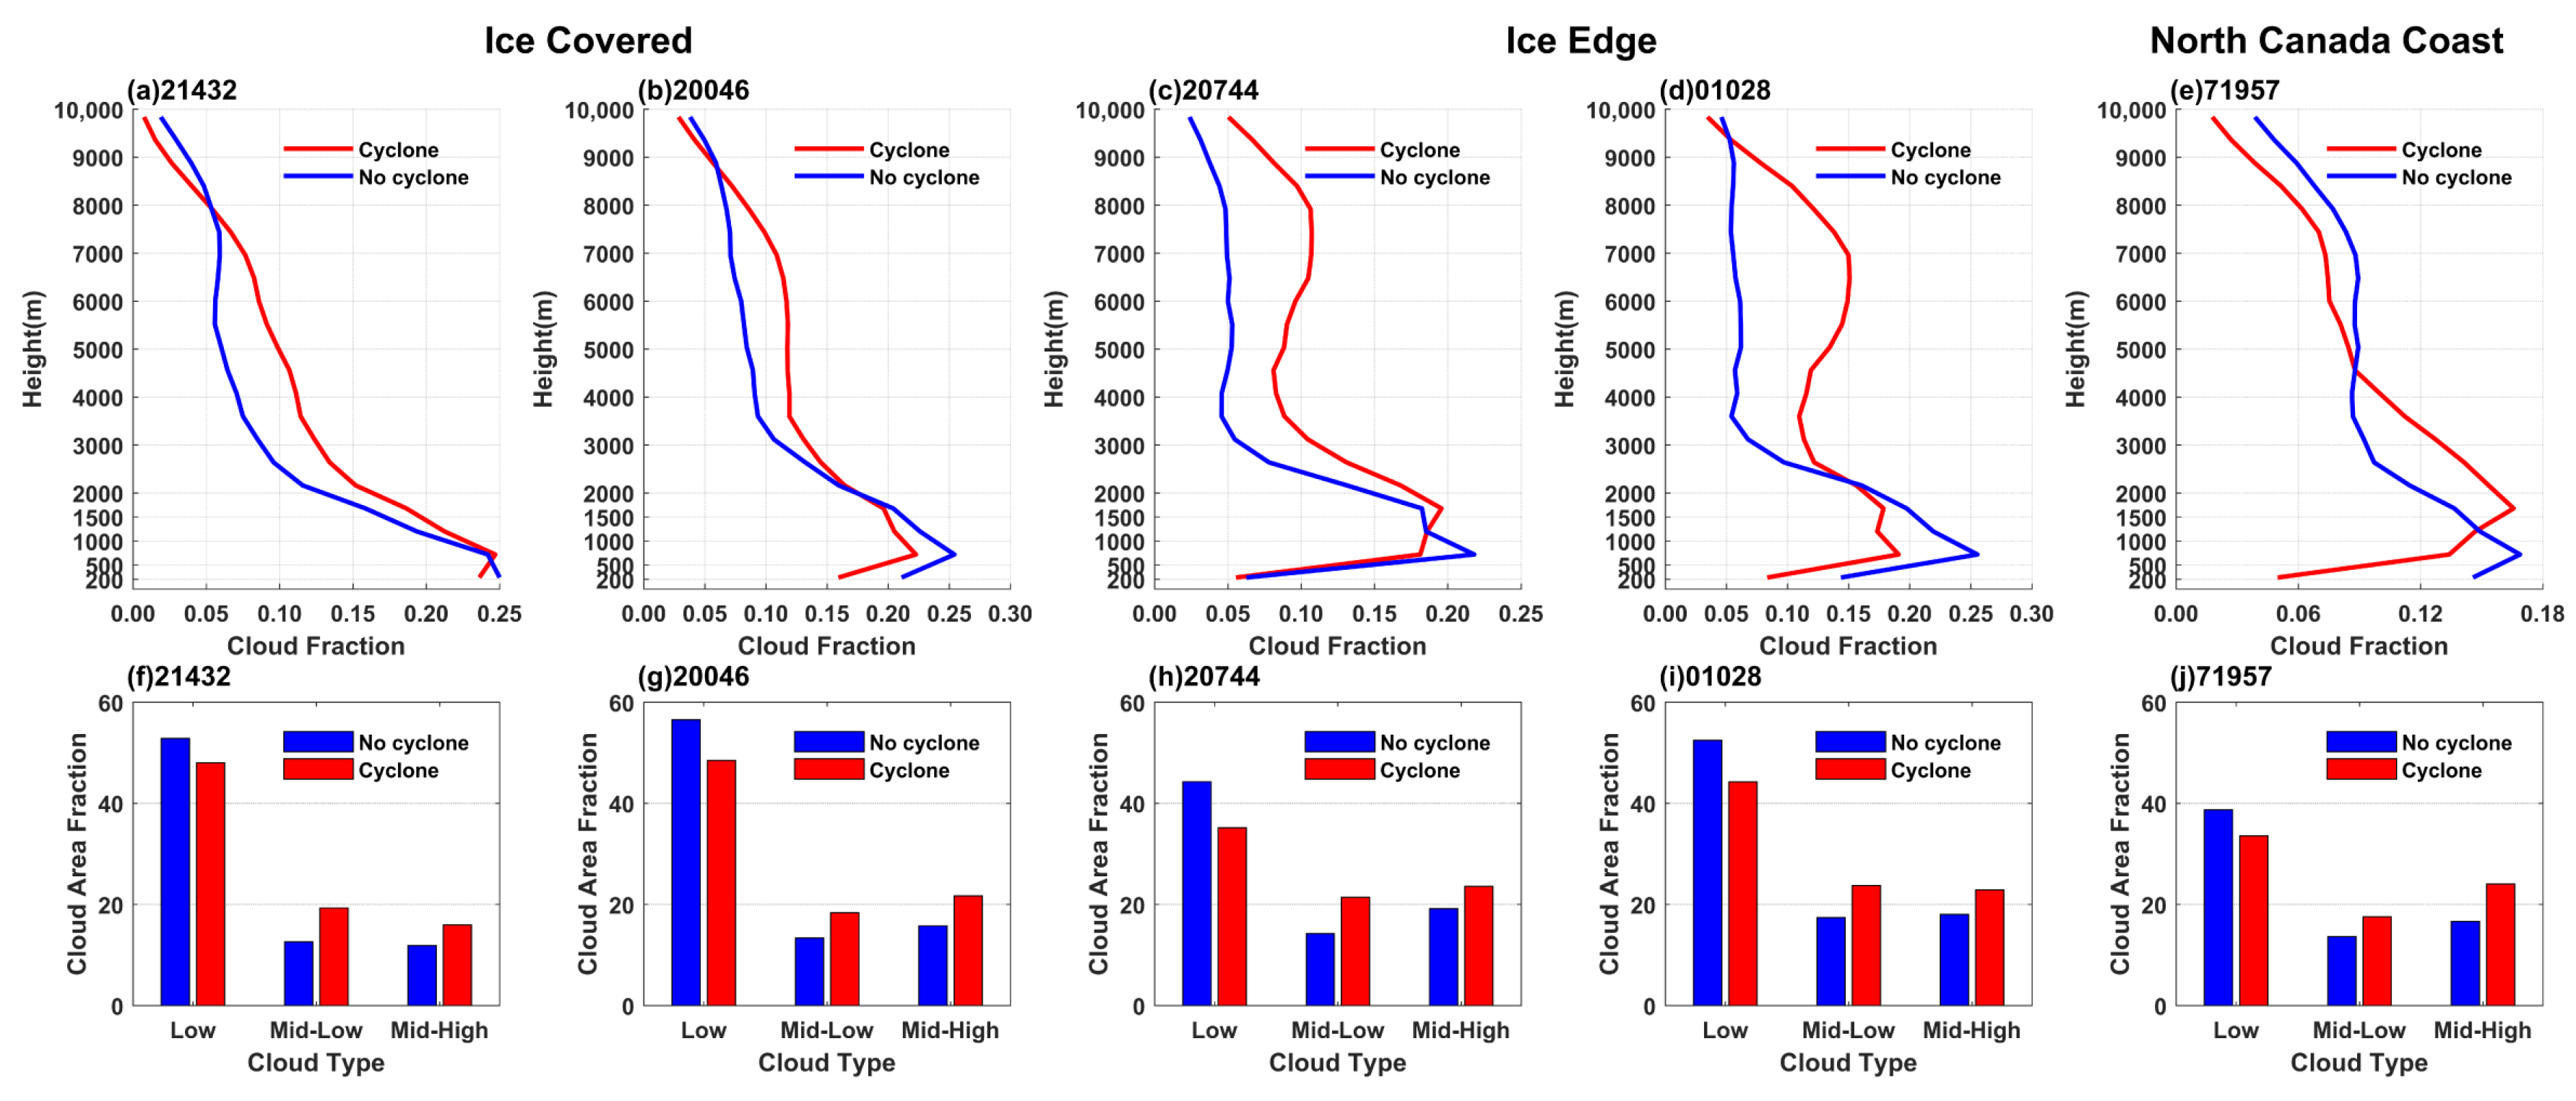
4.1. Climatology of Cloud Vertical Profile over Different Surface Conditions

In order to show the influence of cyclones on local cloud distribution, we first calculated the climatology vertical profiles of seasonal mean cloud fractions, averaging from the four grid points nearest to each of the five sounding stations at the five stations based on the GOCCP data and ERA5 data (Figure 6). The results show that over all of the five stations, the autumn cloud fractions peak at a height ranging from 500 to 2000 m. The cloud fraction decreases sharply above 2000 m over all of the five stations and has a quick/slow decrease under 500 m over the ice edge/ice-covered island stations. The above result indicates that low clouds are dominant during autumn in the Arctic. However, the vertical distributions of low cloud fraction show a substantial difference between the different stations. Below 500 m, cloud fraction over the ice-covered islands stations (21432, 20046) is about 20~30% from the GOCCP data and about 30~40% from the ERA5 data. GOCCP underestimated cloud cover, which is consistent with the work of Cesana et al. and Boudala et al. [45,46]. This fraction is much larger than that over the ice edge stations, where the cloud fraction is less than 10%. Although the surface is covered with ice, the cloud fraction below 500 m over the north coast of Canada is nearly 10%, a number that is much smaller than that over the island stations, but comparable to that over the ice edge stations. Therefore, the cloud fraction over ice-covered island stations peaks near 500 m or 925 hPa, whereas the maximum of the cloud fraction over the ice edge stations is located near 1000 m, or 900 hPa, which is much higher than the cloud fraction maximum over the ice edge stations. The high cloud fractions over ice edge stations are generally larger than those over ice-covered stations. A secondary maximum of cloud fraction lies near 400 hPa, or 6000–7000 m, over the ice edge stations. Almost no high cloud maximum appears over the ice-covered stations.

4.2. Impact of Cyclones on Cloud Fractions

4.2.1. Variation of Cloud Fraction on Cyclone Days and No-Cyclone Days

In order to show the influence of cyclones on the Arctic cloud fractions in autumn, we composited the daily cloud fraction at each vertical level from the near surface to the upper troposphere based on the cyclone days and the no-cyclone days using the GOCCP data and the CERES data (Figure 7). The result based on the GOCCP data (Figure 7a–e) indicates that, compared to the no-cyclone days, clouds increase obviously above 2000 m on the cyclone days over all of the five stations, whereas, under 2000 m, the vertical cloud fraction profiles on cyclone days show a substantial difference between the ice edge stations and the ice-covered stations. Over the three ice-covered stations, the cloud fractions under 500 m are higher, and the reduction in cloud fraction on cyclone days is significant over station 20046, but not significant at station 21432. Over the ice edge stations, where the cloud fractions under 500 m are much smaller, the cloud fraction reduction is not obvious below 500 m, especially at station 20744. The obvious cloud fraction reduction on cyclone days appears above 500 m at the two ice edge stations. Over station 71957, with a larger cloud fraction below 500 m, the cloud fraction on the cyclone days significantly decreases below 1000 m. Moreover, the cyclone day cloud fraction reduction seems to be larger at a higher altitude at the lower latitude station or ice edge station, e.g., station 01028, than at the higher latitude station or ice-covered station, e.g., station 21432 (Figure 7a–e), which is partly consistent with the result shown in Figure 4, where the negative connection between cloud fraction and cyclones can reach higher altitudes at lower latitudes. Based on the CERES data, Figure 7f–j show the difference between the cyclone day cloud fraction and the no-cyclone day cloud fraction for the low cloud (below 700 hPa), the mid-low cloud (700–500 hPa), and the mid-high cloud (500–300 hPa). However, as shown by Figure 7a–e, cyclone day cloud fraction reductions occur at different altitudes for the different stations, and the total low cloud decreases at all of the five stations on cyclone days because cyclone day cloud reduction generally happens at the height of maximum background cloud fraction at all of the five stations. The above result also indicates a negative correlation between low cloud fraction and cyclone frequency. Warming from an ice-free ocean or warm southerly intrusion leads to a stronger increase in the cyclones at the lower latitude station. This is shown in Section 4.2.2. This strong increase results in a strong adiabatic cooling and an obvious reduction in relative humidity and cloud fraction at a high altitude. As a result, the negative correlation between cyclone frequency and cloud fraction extends to a high altitude. The CERES data illustrate an increase in mid-low and mid-high cloud fractions on cyclone days at all of the five stations, a result that is generally consistent with that illustrated by the GOCCP data, except for station 71957, where the GOCCP data show that cyclone day cloud fraction only increases below 5000 m, which matches the mid-low cloud in the CERES data. This indicates an instability of the correlation between the mid-high cloud fraction and the cyclone frequency and may also result from the different time ranges of the two data sources, since the GOCCP data are from 2006–2017, but the CERES data are from 2001–2017.

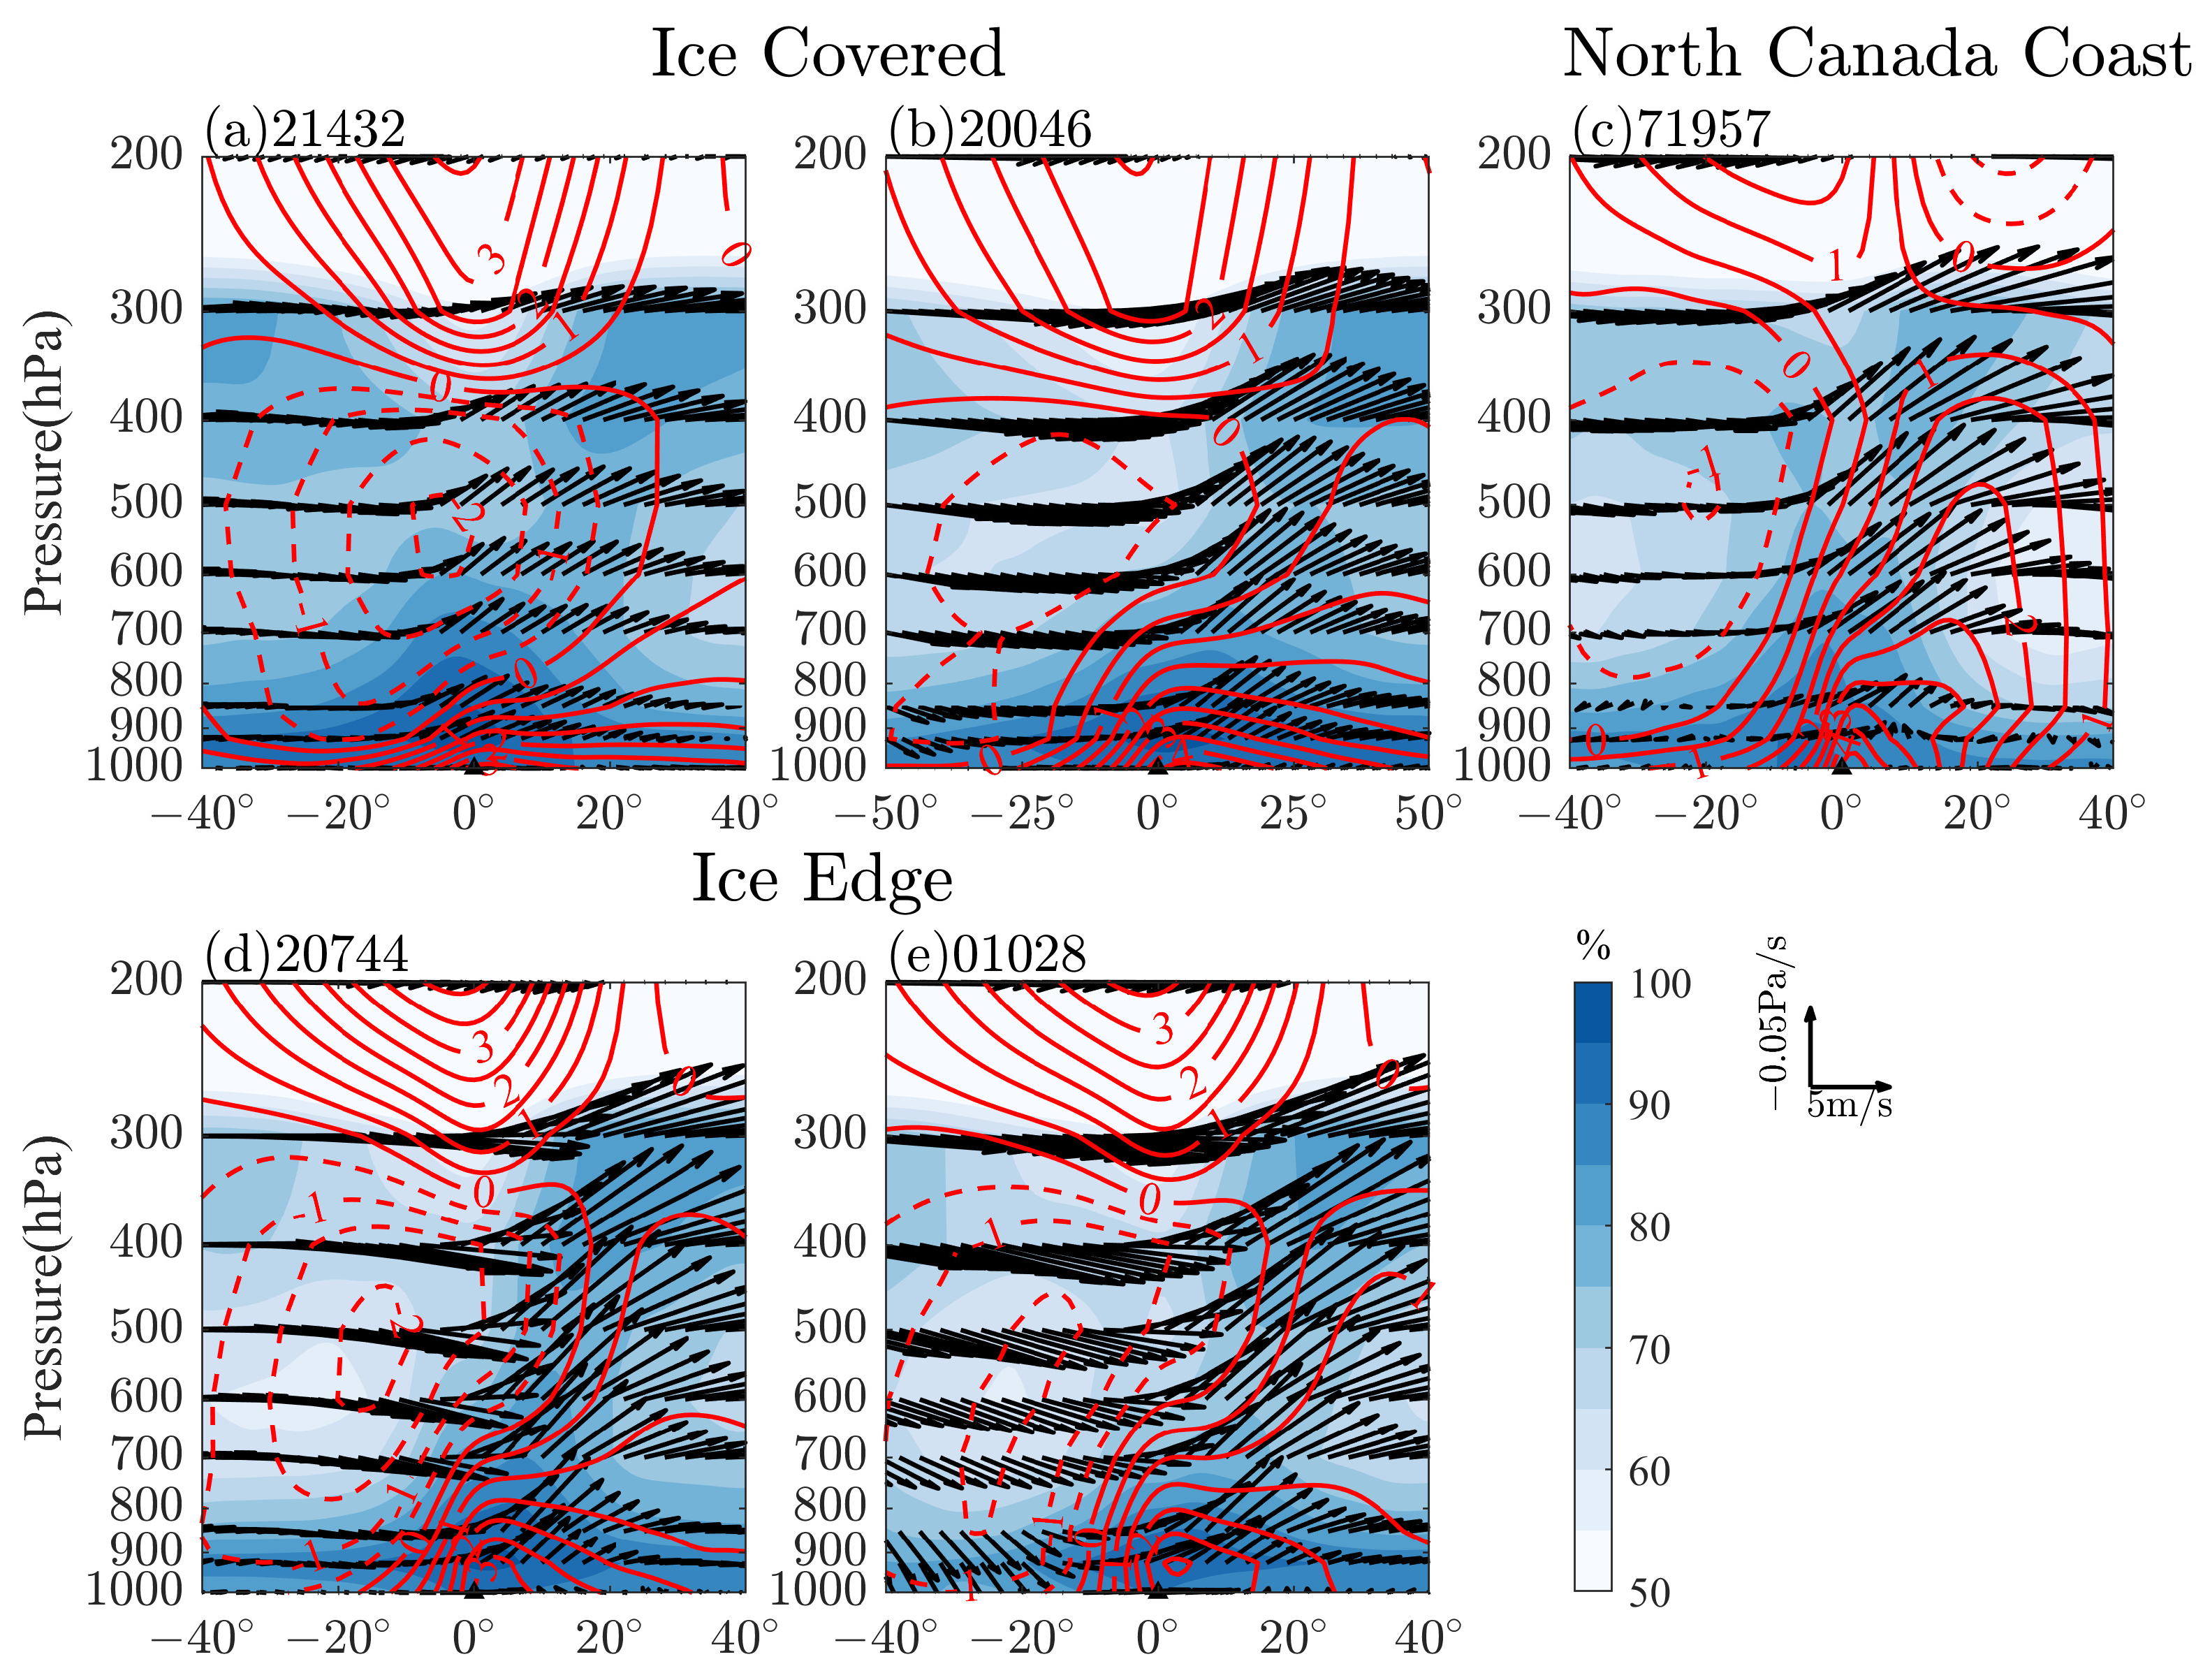
4.2.2. Atmospheric Conditions in Cyclones

In order to determine how the vertical distribution of cloud fraction changes with the impact of cyclones and why the cloud cyclone correlations are different at the locations with different surface ice coverage conditions, we further composited cyclone-centered horizontal velocity vectors, vertical velocity, and relative humidity at the 850 hPa level based on all of the cyclone days at the five selected stations. The cyclone-centered composited map (Figure 8) was created by taking the center of each cyclone as the origin of the composite coordinate. According to the cyclone tracking scheme used in this study [32], the cyclone-centered composition is based on the cyclone center at the sea level pressure field. We also composited the cyclone-centered longitude-pressure cross-section based on the center latitude of each cyclone field on cyclone days (Figure 9).
The composited vertical section of the cyclone (Figure 9) shows that the cold core is generally consistent with the descending air and is located at the mid-low troposphere near 600 hPa. Since warm air rises from warm surface to upper levels, the warm core is located at the low troposphere, and the positive temperature anomalies extend upward to near 400 hPa due to warm air rising. However, the centers of positive air temperature anomalies at the upper levels are located at the east of the vertical velocity maximum, for the reason that strong rising leads to an adiabatic cooling in the air. Because relative humidity decreases with both the decrease in moisture and the increase in air temperature, low relative humidity is observed near the cold core where cold dry air concentrates and near the warm core where the air temperature increases (Figure 9a–e). Therefore, in the broad region around the warm and cold cores of the cyclone’s vertical section, the relative humidity is low, which leads to high relative humidity air being constrained below the 800 hPa level and above the 400 hPa level, except for the narrow area of upward vertical velocity maximum where the relative humidity increases due to the adiabatic cooling of the humid rising air. As a result, for most of the cyclones, low relative humidity air covers the high relative humidity air, a condition that favors the formation of low clouds. Above 400 hPa, the rising warm humid air cools, and the relative humidity increases, which indicates a possibility of high cloud formation. The composite vertical sections show that cyclones at the five stations show a vertically consistent distribution of both the dynamic and thermal dynamic structure; that is, the cyclones at the Arctic region show little vertical tilt. Therefore, the cloud distribution in the Arctic cyclones could be vertically consistent.
The above features of the atmospheric conditions in cyclones are common at all of the five stations. However, differences exist among the cyclones at the different stations with different ice cover conditions. Though both station 21432 and station 20046 are in the ice-covered sea, because a large number of the cyclones at station 21432 are from the Eurasian continent, but the cyclones at station 20046 are generally from the North Atlantic, the vertical motion in the cyclones at the ice-covered East Siberian Sea station (ice-covered station 21432) is much weaker than that in the cyclones at the northeast edge of the Barents Sea station (ice-covered station 20046) (Figure 9a,b), indicating a weaker vertical transportation and weaker high-altitude air temperature increase. As a result, the middle troposphere’s air relative humidity in cyclones over station 20046 is smaller than that over station 21432. In terms of the northern Canada coast station (station 71957), a station that is also near the ice-covered sea, but is at the lowest latitude among the five stations, the cyclones here are from a lower latitude, and they have a stronger rising velocity (Figure 9c). At the ice edge island stations (station 20074 and station 01028), cyclones are mainly from the North Atlantic. Both the descending and ascending motions (Figure 9d,e) are strong in the cyclones, a structure that is more similar to the typical mid-latitude cyclones. The stronger vertical motions lead to stronger contrast of the relative humidity and temperature in the cyclones. The strong sinking extends to the ground, a situation that results in a significant decrease in the low-level relative humidity. Though moisture is more plentiful over the ice edge, strong cold air sinking and warm air rising lead to a lower relative humidity outside the high relative humidity band of maximum rising. The contrast between the high relative humidity in the strong rising region and the low relative humidity outside the region is more obvious in the cyclones at these ice edge stations.

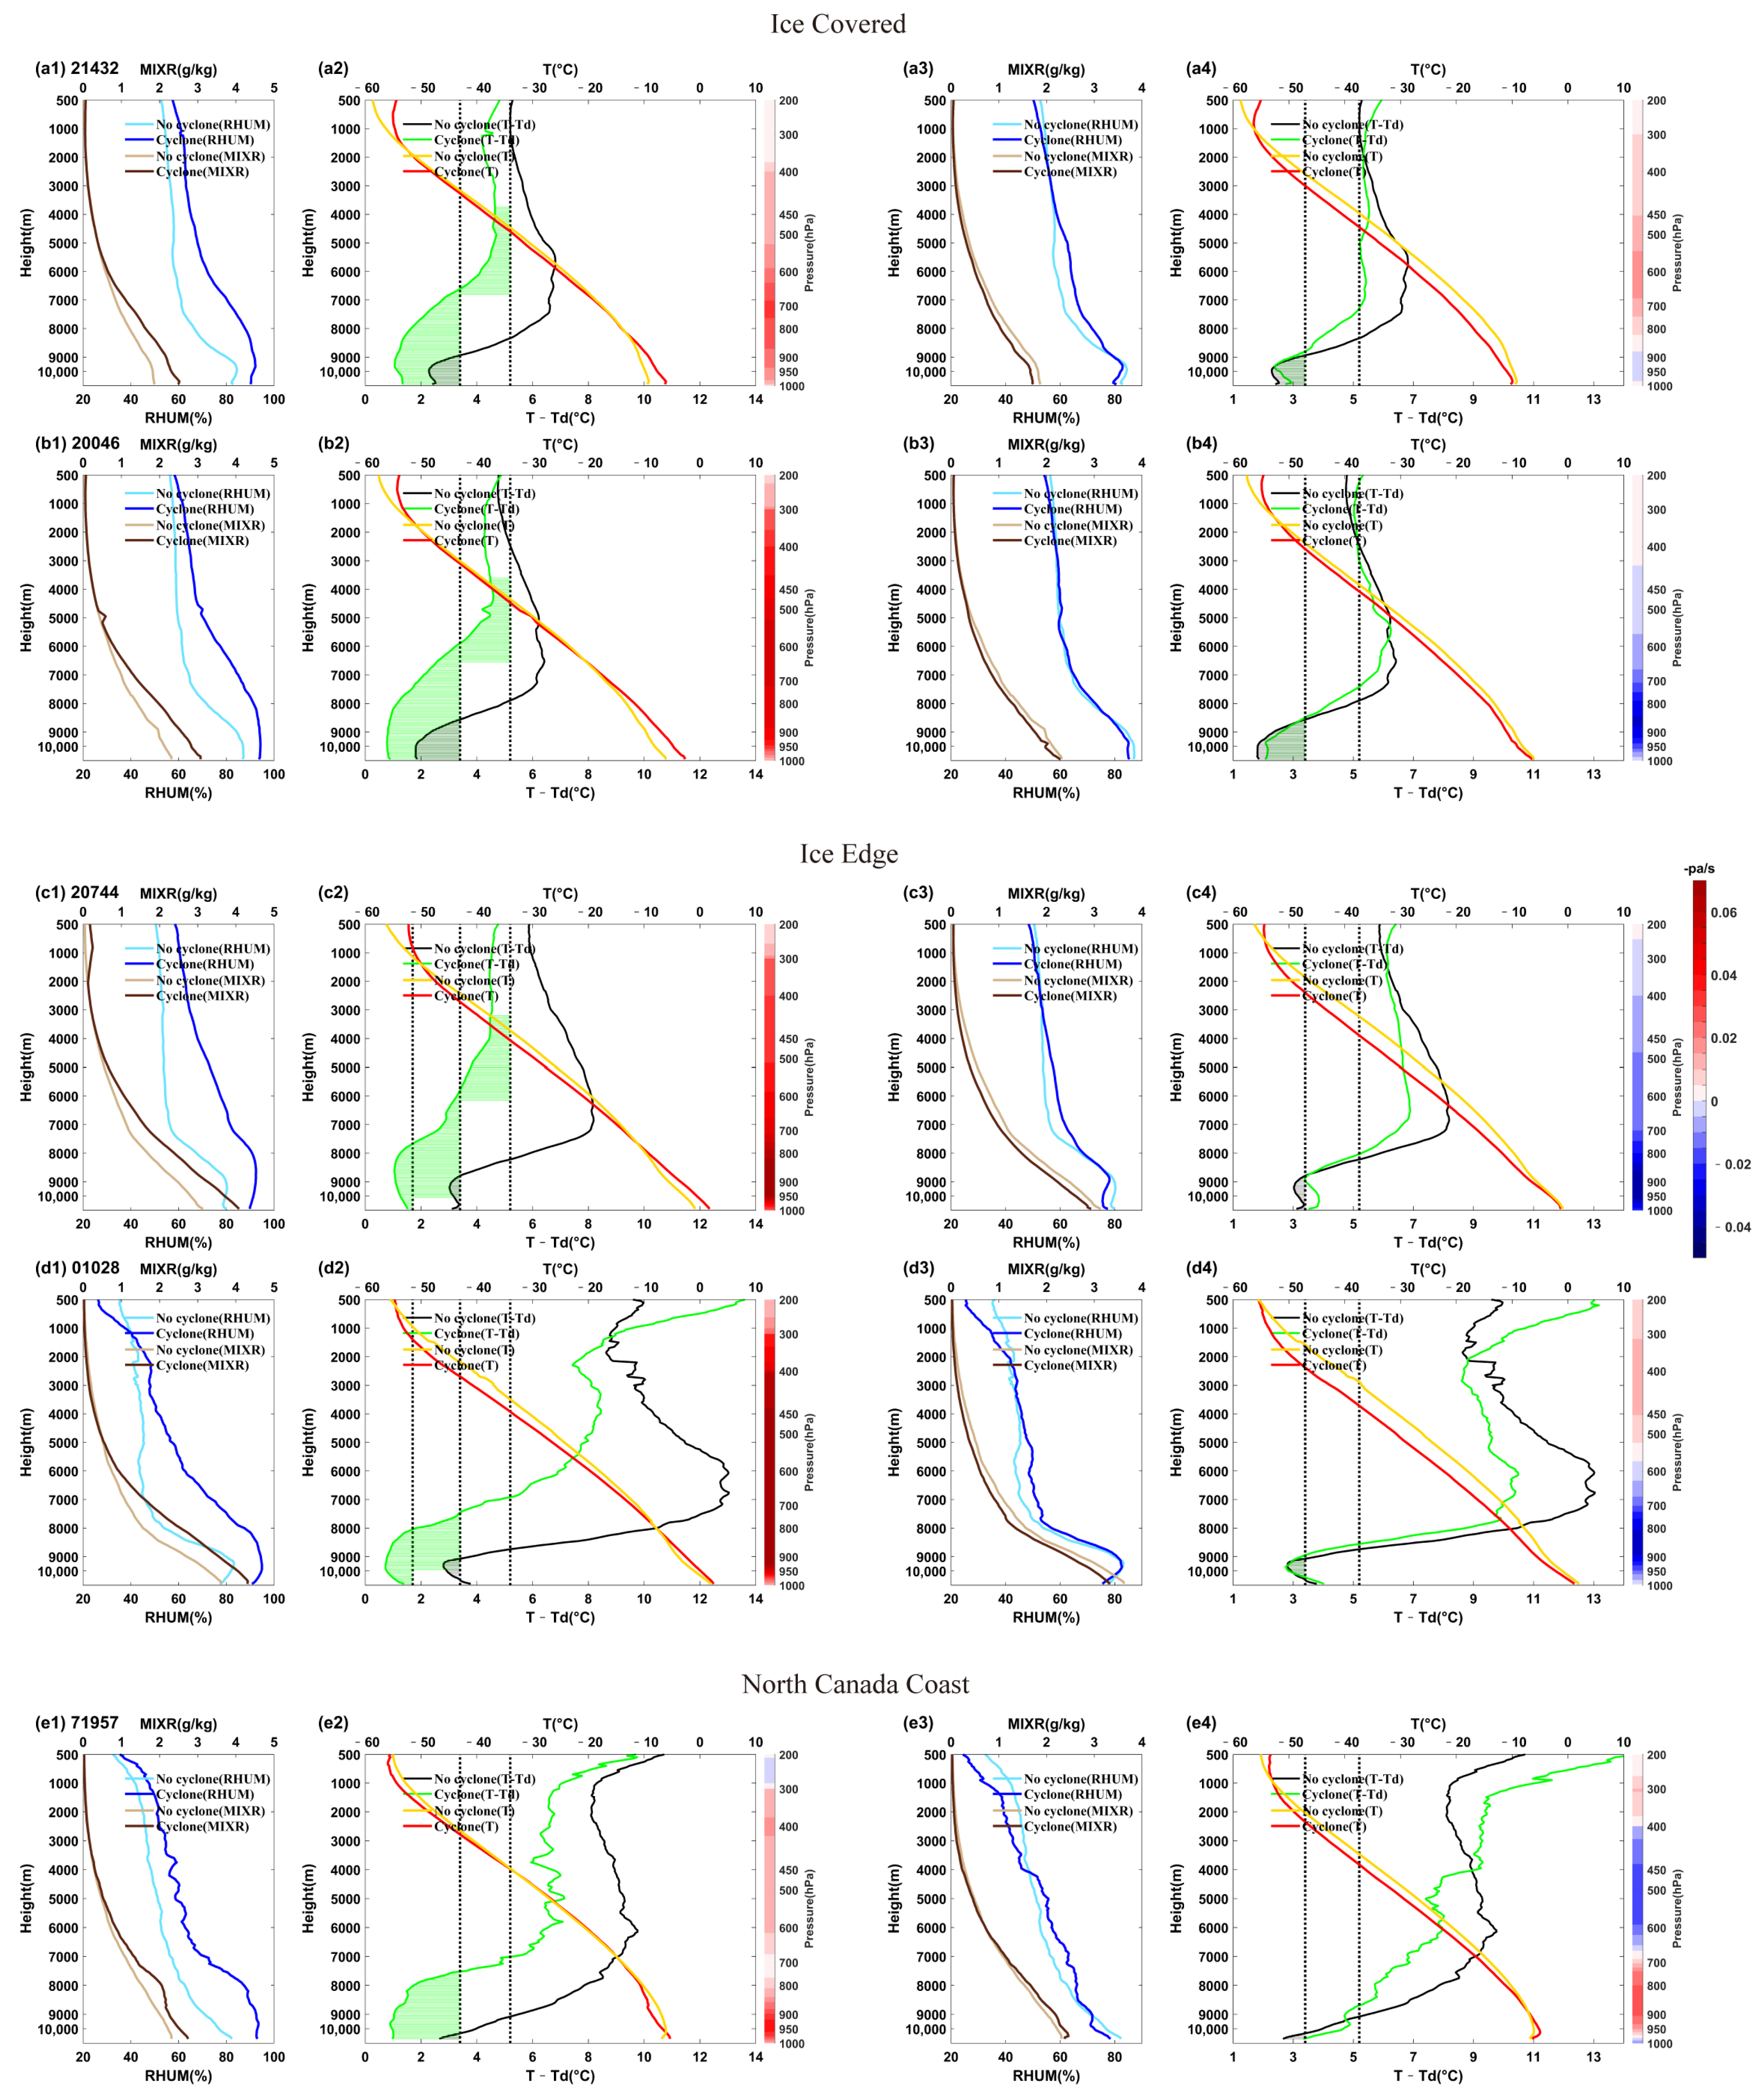
4.2.3. Local Vertical Atmospheric Conditions for Cloud Formation on Cyclone Days

The above discussion indicates that cyclone-induced heat and moisture transport results in an increase or decrease in relative humidity. In other words, clouds increase in some regions, but decrease in other regions of cyclone circulation fields. Thus, for a given station, clouds increase on some cyclone days, but decrease on other cyclone days. The cyclone days used in the composite at each station are those picked from the time period that is consistent with the period when the sounding data are available at the station; thus, we have 145 cyclone days at station 21432 in the period 2011–2016, 266 cyclone days at station 20046 in the period 2009–2017, 307 cyclone days at station 20744 in the period 2006–2017, 587 cyclone days at station 01028 in the period 2001–2017, and 126 cyclone days at station 71957 in the periods 2001–2009 and 2012–2017. The number of cyclone days with sounding data is less than the total cyclone days with satellite data. We used the relative humidity change as an index to reflect the cloud change induced by cyclone circulation; thus, the cyclone days were further divided into relative humidity increase (RHI) days and relative humidity decrease (RHD) days. An RHD/RHI day is defined as a cyclone day where the relative humidity is not/is larger than the background relative humidity, respectively, at all vertical levels under 2000 m at a given station. Here, the background relative humidity is the mean relative humidity over no-cyclone days. In order to show how cyclones influence cloud formation, we composited the vertical profiles of air temperature, mixing ratio, relative humidity, and dew point deficit based on the RHI days and the RHD days. The vertical location where clouds form can be approximately determined according to the cloud formation criterion indicated in Poore et al. [53], which is shown as the hatched areas in Figure 10.
The composited atmospheric conditions illustrate air rising from the surface to the upper levels during the RHI days, which is accompanied by an air temperature increase below 2000 m, mixing ratio increase below 5000 m, and relative humidity/dew point deficit increase/decrease above the surface to the upper levels over the five stations (Figure 10(a1–e1)). Considering the air condition in the cyclones shown in Figure 8 and Figure 9, the atmospheric conditions during the RHI days are consistent with the region of strong rising. The vertical air temperature lapse rate on the RHI days is larger than the lapse rate on the no-cyclone days due to the strong rising. Therefore, both the increase in moisture and decrease in air temperature benefit water vapor condensation; thus, cloud forms from the lower to upper troposphere during the RHI days. The background mixing ratios over the two ice-covered island stations and the North Canada coast station are lower than those over the ice edge stations. The background air temperatures are colder than those over the ice edge stations. For the two ice edge stations, the composite sounding data show that the RHI day relative humidity increase at station 20744 is larger than that at station 01028 at the upper troposphere, and the cloud formation criterion is only met below 3000 m at station 01028. However, both the composite GOCCP cloud fraction and the composite vertical section of the cyclones show a similar large cloud fraction increase and relative humidity increase above 500 hPa at the two ice edge stations. This inconsistency may arise from the inconsistency of the cyclone days in the different data sources. For the North Canada coast station 71957, the composite vertical profile of the sounding data indicates an increase in cloud at the lower troposphere, which is also indicated by the composite cloud fraction from the GOCCP data. Because the no-cyclone day cloud fraction reaches a maximum below 1000 m, the results indicate that middle and high clouds generally increase during the RHI days. The result is consistent with the composite vertical profile of the cloud fraction from the GOCCP data and the composite relative humidity distribution in the vertical section of the cyclones.
The average atmospheric conditions during the RHD days are characterized by a mixing ratio decline and relative humidity decline from the upper troposphere to near the surface. As shown in Figure 9, the middle troposphere low relative humidity lies both at the cold core with strongest cold dry air sinking and at the warm core near the narrow branch of upward vertical velocity maximum. Therefore, the RHD days are the cyclone days when the station is under the influence of both the cold core and the warm core of the cyclone. Since, as shown in Figure 9, the cold core air sinking is much stronger than the warm core air rising, the composited RHD day vertical velocity exhibits sinking or weak rising (Figure 10(a4–e4)). Due to the significant mixing ratio decrease and air temperature decrease, or moderate mixing ratio increase and air temperature increase, the cloud formation criterion cannot be met at the middle troposphere. It can only be met at some heights below 2000 m. Thus, only low cloud forms. This condition is similar to the cloud condition during the no-cyclone days (the background condition). Moreover, compared to the cloud fraction distribution during the no-cyclone day, the cloud formation condition under 1000 m is significantly suppressed during the RHD days at all of the five stations due to a large mixing ratio decrease. This indicates that clouds under 1000 m decrease during the RHD days, especially under 500 m.
In order to show the total impacts of cyclones on local cloud formation conditions, we further calculated the percentages of the RHI days and the RHD days. The result (Figure 11) indicates that the RHD/RHI days occupy nearly 60%/40% of the total cyclone days at the island stations in the Barents Sea (station 20744, station 01028 and station 20046), respectively, and the percentage of the RHD days is larger than 70% at the land coast stations (station 71957 and station 21432). The above results indicate that the RHD/RHI days respectively constitute the major/minor fraction of the total cyclone days—a result that is consistent with the composite vertical air condition section of the cyclone fields (Figure 9). The result shows that the maximum relative humidity increases consistently from the near surface to upper troposphere in the narrow region of maximum rising, a condition that corresponds to the RHI days, whereas in the broad region outside the maximum rising branch, the relative humidity only increases below 800 and above 400 hPa, which corresponds to the RHD days.
During no-cyclone days, the background clouds mostly exist as low clouds over the Arctic with the maximum cloud fraction at 500–2000 m; therefore, almost no middle or high clouds appear during no-cyclone days (Figure 7). It is clear that, when taking both the RHI days and RHD days into consideration, the occurrence of cyclones leads to an increase in the middle- to high-level clouds over the Arctic. Nevertheless, whether low clouds increase or decrease depends on the impacts of cyclones during the RHI days and during the RHD days, since the former facilitates low cloud formation conditions and the latter suppresses them. Because the percentage of the RHD days is significantly larger than that of the RHI days, the occurrence of cyclones generally results in a decrease in low clouds. However, the resulting change in the cyclone-induced vertical cloud fraction distribution also depends on the background cloud fraction distribution. Though low clouds dominate over the Arctic during no-cyclone days, as shown in Figure 7, the background vertical distributions of low cloud are different among the five stations with different land surface conditions. Clouds over the ice edge stations appear at a much higher height than those over the sea ice-covered stations. Therefore, the correlation between low clouds and cyclones is more complex over the ice edge stations. Generally, cyclone-induced low cloud suppression should be more significant over the sea ice-covered stations than that over the ice-covered stations. This partly explains the cloud fraction difference between the cyclone days and no-cyclone days shown in Figure 7a–e, and explains the negative correlation between the cyclone frequency and the low cloud fraction over the ice-covered Arctic Ocean in Figure 4.

5. Conclusions

Based on the CERES data and the ERA5 reanalysis data, the statistical results show a relatively stable positive correlation between the Arctic middle cloud fraction and Arctic cyclone frequency in autumn. Conversely, the low cloud fraction and the cyclone frequency have the opposite trends and a negative inter-annual correlation between low cloud fraction and cyclone frequency over several regions of the Arctic during autumn in the period 2001–2017. However, the relationship between Arctic low clouds and cyclones is unstable, and it changes with location and data source. The continuous vertical section of the daily correlation between the zonal mean cloud fraction and cyclone frequency based on the ERA5 data north of 60° N indicated that a significant negative correlation between cyclone frequency and cloud fraction exists below 900 and above 300 hPa, and a positive correlation exists between cyclone frequency and cloud fraction in the middle troposphere. From 65° N to 90° N, the height of the negative correlation between cloud fraction and cyclone frequency decreases with latitude. At the latitudes north of 70° N, the cyclone frequency is negatively correlated with cloud fraction, but only below 975 hPa (below almost 500 m).
The influence of cyclones on cloud fraction was further investigated at the five selected stations. Over all of the five stations, the climatological vertical distribution of autumn cloud fraction peaks at a height between 500 and 2000 m. The cloud fraction decreases significantly with height, except for at the warmer ice edge station 01028, where the cloud fraction has its secondary maximum near 7000 m. The cloud fraction maximum over the ice-covered island stations (21432, 20046) peaks near 500 m and with a larger cloud fraction below 500 m, which is located at a lower altitude than over the ice edge stations. The climatology cloud fraction over the north coast of Canada is smaller than that over the other four stations. The composite cyclone day cloud fraction significantly increases from 2000 to 5000 m at all of the five stations, whereas the cloud fraction above 5000 m increases more significantly at the ice edge stations. The cloud fraction during cyclone days decreases below 2000 m.
The cyclone-centered composites show that the ascending/descending region is consistent with the region of high/low relative humidity. For most of the cyclones, high relative humidity air is constrained below 800 and above 400 hPa; thus, the low relative humidity air of the middle troposphere covers the low troposphere’s high relative humidity air—a condition that favors the formation of low clouds. In contrast, in the narrow area with maximum upward vertical velocity, the relative humidity increases from the low troposphere to the high troposphere due to the adiabatic cooling of the humid rising air. For cyclones near the ice edge island stations and the North Canada coast station, due to the stronger vertical motion and the relatively high background air temperature, the relative humidity outside the strong rising region is lower than that in the cyclones near the ice-covered island stations.
In view of the vertical distributions of cyclone day local air condition composites, the cyclone days clearly show the category of vertically consistent relative humidity increase and the category of relative humidity decrease at some vertical heights, named the RHI days and RHD days, respectively, in this study. The RHI days are characterized by strong air rising from the surface to the upper levels, an air temperature increase, a mixing ratio increase, and a relative humidity/dew point deficit increase/decrease from the surface to upper troposphere over the five stations, which is consistent with the narrow strong air rising region in the composite vertical section of cyclones. The atmospheric conditions in the RHI days lead to an improvement in the cloud formation condition from the lower troposphere to the higher troposphere, which implies an increase in low, middle, and high clouds. During the RHD days, the composite local atmospheric conditions are characterized by sinking or weak rising and a decrease in air temperature and mixing ratio, a result that represents the mean conditions of the low relative humidity region in Figure 9. Due to the cold dry air intrusion or vertical heat advection inducing air temperature increase and relative humidity/dew point deficit decrease/increase below 1000 m, the low cloud formation is suppressed. Though the relative humidity/dew point deficit may increase/decrease, the cloud formation criterion is not met. Therefore, taking into account both the RHI days and the RHD days, it is clear that the occurrence of cyclones leads to an increase in the middle- to high-level clouds over the Arctic, because the no-cyclone day middle and high cloud fraction is very small. However, whether low clouds increase or decrease depends on the impacts of the cyclones during the RHI days and during the RHD days. The heat and water vapor transport of cyclone circulation leads to the increase and decrease of relative humidity (Figure 9). Because the percentage of the RHD days is significantly larger than that of the RHI days, the occurrence of cyclones generally results in a decrease in low clouds. In RHD, the sinking of dry and cold air leads to the increase in the temperature dew point difference, especially below 500 m, so a reduction in the cloud layer occurs below 500 m and is more intense at ice covered stations and colder ice edge stations.
The resulting cyclone-induced vertical cloud fraction distribution change also depends on the background cloud fraction distribution. Under the condition of climatology and unaffected by cyclones, the cloud system at each station is dominated by low clouds, which are mainly distributed below 1000–2000 m. In addition, the sea ice surface is more prone to low cloud formation, which is consistent with the cloud cover synthesis results (Figure 6). Because clouds over the ice edge stations appear at much higher levels, cyclone-induced low cloud suppression is more significant over the sea ice-covered stations.

6. Discussion

The study sought to tackle a key question of how the Arctic clouds respond when cyclones appear in the Arctic. Existing studies on Arctic clouds mostly focus on the influence of Arctic sea ice changes on clouds and the influence of atmospheric boundary layer structure, atmospheric water vapor content, and temperature changes caused by sea ice changes on clouds [3,54,55]. However, with the increase in Arctic cyclone activity [56], the cyclone has become an important factor affecting the cloud cover and cloud distribution in the Arctic. Several previous studies suggest a decrease in low cloud and an increase in mid-cloud in the Arctic [17,20,22]. However, few studies provide the physical processes behind this phenomenon. This study discusses the issue by combining satellite, local sounding, and reanalysis and shows the asymmetry between humidity increases and decreases during the cyclone day, which has not been discussed in the previous studies. Our study focuses on the analysis of the differences in the vertical distribution of cloud caused by the differences in the velocity field, water vapor temperature, and humidity characteristics of cyclones on different underlying surfaces. In the Arctic, the warming from ice-free ocean or warm southerly intrusion leads to a stronger increase in the cyclones, which causes a strong adiabatic cooling and a marked reduction in upper altitude relative humidity and cloud fraction. This is an important finding for understanding the cloud–cyclone interaction in the Arctic region. The results in this paper clearly support this and provide a plausible explanation. The importance of autumn cloud–ice feedback deserves more research, as Arctic autumn clouds are even less studied than spring and summer clouds.
The differences in the correlation between cyclones and clouds arise from both the local surface conditions and the characteristics of cyclones. The moisture content and distribution in cyclones, the circulation pattern, and the thermal structure of cyclones have impacts on clouds. Atmospheric circulations also have impacts on cloud distribution. The source of water vapor from the horizontal advection of the atmosphere is important for cloud formation [57,58]. Eastman and Warren pointed out that when the atmospheric water vapor is limited in autumn, the positive phase of the AO (Arctic oscillation) can increase the water vapor transport to the pole, and changes in sea ice distribution caused by surface wind anomalies related to AO may also affect the autumn cloud cover [17]. The impacts from different cyclones and also the background large-scale circulations on clouds are important and complex. We will further explore these issues in future studies. Due to the limitations of observation in the Arctic region, the role of cloud radiation effects in the Arctic system has always been difficult to study. Studies have shown that the variation of downward long-wave radiation affects the variation of Arctic sea ice [59,60,61]. Low-level Arctic liquid clouds play an important role in the radiation balance of multi-year sea ice surface [62]. Changes in the surface radiation balance caused by reduced Arctic low clouds clearly cannot be ignored. The analysis of radiosonde stations should also continue, and the type of radiosonde instruments at each site is likely to influence the comparison results. Hori et al. explored temperature deviations at two Russian sites (Baranova and Fedorova), suggesting that they depend on the type of radiosonde, particularly the middle and upper troposphere [63]. ERA-Interim showed significant surface warming over the Arctic [59,64], which would undoubtedly affect the conditions for water vapor condensation and cloud formation by changing the saturated water vapor pressure. In other words, attention should also be paid to the role of atmospheric temperature and humidity background changes in the Arctic in low cloud changes.

Author Contributions

Conceptualization, X.L.; Methodology, X.L., Y.D., R.S. and Q.G.; Formal analysis, Y.D.; Data curation, X.L., R.S. and Q.G.; Writing—original draft, X.L., Y.D.; Writing—review & editing, Y.D.; Supervision, Y.D. All authors have read and agreed to the published version of the manuscript.

Funding

National Natural Science Foundation of China (NSFC) Projects (42075025); National Key Basic Research Project of China (Grant 2019YFA0607002); Shandong Natural Science Foundation Project (ZR2019ZD12).

Data Availability Statement

CALIPSO-GOCCP data (https://climserv.ipsl.Polytechnique.fr/cfmip-obs/index.html, accessed on 30 January 2023); ERA-interim data (https://apps.ecmwf.int/datasets/data/interim-full-daily/levtype=sfc/, accessed on 30 January 2023); NOAA OI SST V2 High Resolution Dataset (https://psl.noaa.gov/data/gridded/data.noaa.oisst.v2.highres.html, accessed on 30 January 2023); The sounding data is obtained from the online data archive at the University of Wyoming (http://weather.uwyo.edu/upperair/sounding.html, accessed on 30 January 2023); CERES-SYN1deg data (https://ceres.larc.nasa.gov/data/, accessed on 30 January 2023); ERA5 data (https://cds.climate.copernicus.eu/cdsapp#!/dataset/reanalysis-era5-pressure-levels?tab=form, accessed on 30 January 2023).

Conflicts of Interest

The authors declare no conflict of interest.

References

  1. Stroeve, J.; Holland, M.M.; Meier, W.; Scambos, T.; Serreze, M. Arctic sea ice decline: Faster than forecast. Geophys. Res. Lett. 2007, 34, L09501. [Google Scholar] [CrossRef]
  2. Screen, J.A.; Simmonds, I. The central role of diminishing sea ice in recent Arctic temperature amplification. Nature 2010, 464, 1334–1337. [Google Scholar] [CrossRef] [PubMed] [Green Version]
  3. Lee, H.J.; Kwon, M.; Yeh, S.W.; Kwon, Y.O.; Park, W.; Park, J.-H.; Kim, Y.H.; Alexander, M.A. Impact of Poleward Moisture Transport from the North Pacific on the Acceleration of Sea Ice Loss in the Arctic since 2002. J. Clim. 2017, 30, 6757–6769. [Google Scholar] [CrossRef]
  4. Clark, J.P.; Lee, S. The role of the Tropically Excited Arctic Warming Mechanism on the warm Arctic cold continent surface air temperature trend pattern. Geophys. Res. Lett. 2019, 46, 8490–8499. [Google Scholar] [CrossRef]
  5. Curry, J.; Rossow, W.B.; Randall, D.; Schramm, J.L. Overview of Arctic Cloud and radiation characteristics. J. Clim. 1996, 9, 1731–1764. [Google Scholar] [CrossRef]
  6. Vavrus, S. The impact of cloud feedbacks on Arctic climate under greenhouse forcing. J. Clim. 2004, 17, 603–615. [Google Scholar] [CrossRef]
  7. Kay, J.E.; L’Ecuyer, T. Observational constraints on Arctic Ocean clouds and radiative fluxes during the early 21st century. J. Geophys. Res. Atmos. 2013, 118, 7219–7236. [Google Scholar] [CrossRef]
  8. Yi, L.; Li, K.F.; Chen, X.; Tung, K.K. Arctic Fog Detection Using Infrared Spectral Measurements. J. Atmos. Ocean. Technol. 2019, 36, 1643–1656. [Google Scholar] [CrossRef]
  9. Intrieri, J.M.; Fairall, C.W.; Shupe, M.D.; Persson, P.O.G.; Andreas, E.L.; Guest, P.S.; Moritz, R.E. An annual cycle of Arctic surface cloud forcing at SHEBA. J. Geophys. Res. 2002, 107, 8039. [Google Scholar] [CrossRef]
  10. Wendisch, M.; Yang, P.; Ehrlich, A. Amplified climate changes in the Arctic: Role of clouds and atmospheric radiation. Sitzungsber. Saechs. Akad. Wiss. Leipzig. Math.-Naturwiss. Kl. 2013, 132, 1–34. [Google Scholar]
  11. Przybylak, R. The Climate of the Arctic, 2nd ed.; Atmospheric and Oceanographic Sciences Library; Springer: Berlin/Heidelberg, Germany, 2016; Volume 52, p. 279. [Google Scholar] [CrossRef]
  12. Wang, X.; Key, J.R. Cloud, and Radiation Properties Based on the AVHRR Polar Pathfinder Dataset. Part I: Spatial and Temporal Characteristics. J. Clim. 2005, 18, 2558–2574. [Google Scholar] [CrossRef] [Green Version]
  13. Kay, J.E.; Gettelman, A. Cloud influence on and response to seasonal Arctic sea ice loss. J. Geophys. Res. 2009, 114, D18204. [Google Scholar] [CrossRef]
  14. Krikken, F.; Hazeleger, W. Arctic Energy Budget in Relation to Sea Ice Variability on Monthly-to-Annual Time Scales. J. Clim. 2015, 28, 6335–6350. [Google Scholar] [CrossRef]
  15. Yamanouchi, T. Arctic warming by cloud radiation enhanced by moist air intrusion observed at Ny-Ålesund, Svalbard. Polar Sci. 2019, 21, 110–116. [Google Scholar] [CrossRef]
  16. Philipp, D.; Stengel, M.; Ahrens, B. Analyzing the Arctic Feedback Mechanism between Sea Ice and Low-Level Clouds Using 34 Years of Satellite Observations. J Clim. 2020, 33, 7479–7501. [Google Scholar] [CrossRef]
  17. Eastman, R.; Warren, S.G. Interannual variations of Arctic cloud types in relation to sea ice. J. Clim. 2010, 23, 4216–4232. [Google Scholar] [CrossRef]
  18. Wu, D.L.; Lee, J.N. Arctic low cloud changes as observed by MISR and CALIOP: Implication for the enhanced autumnal warming and sea ice loss. J. Geophys Res. 2012, 117, D07107. [Google Scholar] [CrossRef] [Green Version]
  19. Schweiger, A.J.; Lindsay, R.W.; Vavrus, S.; Francis, J.A. Relationships between Arctic Sea Ice and Clouds during Autumn. J. Clim. 2008, 21, 4799–4810. [Google Scholar] [CrossRef]
  20. Sato, K.; Inoue, J.; Kodama, Y.-M.; Overland, J.E. Impact of Arctic sea-ice retreat on the recent change in cloud-base height during autumn. Geophys. Res. Lett. 2012, 39, L10503. [Google Scholar] [CrossRef] [Green Version]
  21. Vavrus, S.; Holland, M.M.; Bailey, D.A. Changes in Arctic clouds during intervals of rapid sea ice loss. Clim. Dyn. 2011, 36, 1475–1489. [Google Scholar] [CrossRef] [Green Version]
  22. Liu, Y.; Key, J.R.; Vavrus, S.; Woods, C. Time Evolution of the Cloud Response to Moisture Intrusions into the Arctic during Winter. J. Clim. 2018, 31, 9389–9405. [Google Scholar] [CrossRef] [Green Version]
  23. Sedlar, J.; Tjernström, M.; Rinke, A.; Orr, A.; Cassano, J.; Fettweis, X.; Heinemann, G.; Seefeldt, M.; Solomon, A.; Matthes, H.; et al. Confronting Arctic troposphere, clouds, and surface energy budget representations in regional climate models with observations. J. Geophys. Res. Atmos. 2020, 125, e2019JD031783. [Google Scholar] [CrossRef]
  24. Inoue, J.; Sato, K.; Rinke, A.; Cassano, J.J.; Fettweis, X.; Heinemann, G.; Matthes, H.; Orr, A.; Phillips, T.; Seefeldt, M.; et al. Clouds and radiation processes in regional climate models evaluated using observations over the ice-free Arctic Ocean. J. Geophys. Res. Atmos. 2021, 126, e2020JD033904. [Google Scholar] [CrossRef]
  25. Shupe, M.D.; Rex, M.; Blomquist, B.; Persson, P.O.G.; Schmale, J.; Uttal, T.; Althausen, D.; Angot, H.; Archer, S.; Bariteau, L.; et al. Overview of the MOSAiC expedition: Atmosphere. Elem. Sci. Anthr. 2022, 10, 00060. [Google Scholar] [CrossRef]
  26. Stewart, R.E.; Szeto, K.K.; Reinking, R.F.; Clough, S.A.; Ballard, S.P. Midlatitude cyclonic cloud systems and their features affecting large scales and climate. Rev. Geophys. 1998, 36, 245–273. [Google Scholar] [CrossRef] [Green Version]
  27. Xu, H.; Xu, M.; Xie, S.; Wang, Y. Deep Atmospheric Response to the Spring Kuroshio over the East China Sea. J. Clim. 2011, 24, 4959–4972. [Google Scholar] [CrossRef]
  28. Naud, C.M.; Posselt, D.J.; van den Heever, S.C. Observational Analysis of Cloud and Precipitation in Midlatitude Cyclones: Northern versus Southern Hemisphere Warm Fronts. J. Clim. 2012, 25, 5135–5151. [Google Scholar] [CrossRef] [Green Version]
  29. Naud, C.M.; Booth, J.F.; Posselt, D.J.; van den Heever, S.C. Multiple satellite observations of cloud cover in extratropical cyclones. J. Geophys. Res. Atmos. 2013, 118, 9982–9996. [Google Scholar] [CrossRef] [Green Version]
  30. Gulev, S.K.; Zolina, O.; Grigoriev, S. Extratropical cyclone variability in the Northern Hemisphere winter from the NCEP/NCAR reanalysis data. J. Clim. Dyn. 2001, 17, 795–809. [Google Scholar] [CrossRef]
  31. Zhang, X.D.; Walsh, J.E.; Zhang, J.; Bhatt, U.S.; Ikeda, M. Climatology and Interannual Variability of Arctic Cyclone Activity: 1948–2002. J. Clim. 2004, 17, 2300–2317. [Google Scholar] [CrossRef]
  32. Sepp, M.; Jaagus, J. Changes in the activity and tracks of Arctic cyclones. J. Clim. Chang. 2011, 105, 577–595. [Google Scholar] [CrossRef]
  33. Inoue, J.; Hori, M.E. Arctic cyclogenesis at the marginal ice zone: A contributory mechanism for the temperature amplification? Geophys. Res. Lett. 2011, 38, L12502. [Google Scholar] [CrossRef]
  34. Day, J.J.; Holland, M.M.; Hodges, K.I. Seasonal differences in the response of Arctic cyclones to climate change in CESM1. Clim. Dyn. 2018, 50, 3885–3903. [Google Scholar] [CrossRef] [Green Version]
  35. Inoue, J.; Tobo, Y.; Taketani, F.; Sato, K. Oceanic supply of ice-nucleating particles and its effect on ice cloud formation: A case study in the Arctic Ocean during a cold-air outbreak in early winter. Geophys. Res. Lett. 2021, 48, e2021GL094646. [Google Scholar] [CrossRef]
  36. Waseda, T.; Webb, A.; Sato, K.; Inoue, J.; Kohout, A.; Penros, B.; Penrose, S. Correlated Increase of High Ocean Waves and Winds in the Ice-Free Waters of the Arctic Ocean. Sci. Rep. 2018, 8, 4489. [Google Scholar] [CrossRef] [PubMed] [Green Version]
  37. Sato, K.; Inoue, J. Comparison of Arctic sea ice thickness and snow depth estimates from CFSR with in situ observations. Clim. Dyn. 2018, 50, 289–301. [Google Scholar] [CrossRef] [Green Version]
  38. Huschke, R.E. Arctic Cloud Statistics from “Air Calibrated” Surface Weather Observations; Mem. RM-6173-PR; Rand Corp.: Santa Monica, CA, USA, 1969; p. 79. [Google Scholar]
  39. Doelling, D.R.; Loeb, N.G.; Keyes, D.F.; Nordeen, M.L.; Morstad, D.; Nguyen, C.; Wielicki, B.A.; Young, D.F.; Sun, M. Geostationary Enhanced Temporal Interpolation for CERES Flux Products. J. Atmos. Ocean. Technol. 2013, 30, 1072–1090. [Google Scholar] [CrossRef]
  40. Huang, Y.; Dong, X.; Xi, B.; Dolinar, E.K.; Stanfield, R.E.; Qiu, S. Quantifying the Uncertainties of Reanalyzed Arctic Cloud and Radiation Properties Using Satellite Surface Observations. J. Clim. 2017, 30, 8007–8029. [Google Scholar] [CrossRef]
  41. Zhan, Y.; Di Girolamo, L.; Davies, R.; Moroney, C. Instantaneous Top-of-Atmosphere Albedo Comparison between CERES and MISR over the Arctic. Remote Sens. 2018, 10, 1882. [Google Scholar] [CrossRef] [Green Version]
  42. Chepfer, H.; Bony, S.; Winker, D.; Cesana, G.; Dufresne, J.L.; Minnis, P.; Stubenrauch, C.J.; Zeng, S. The GCM-Oriented CALIPSO Cloud Product (CALIPSO-GOCCP). J. Geophys. Res. 2010, 115, D00H16. [Google Scholar] [CrossRef]
  43. Barton, N.P.; Klein, S.A.; Boyle, J.S.; Zhang, Y.Y. Arctic synoptic regimes: Comparing domain-wide Arctic cloud observations with CAM4 and CAM5 during similar dynamics. J. Geophys. Res. 2012, 117, D15205. [Google Scholar] [CrossRef]
  44. English, J.M.; Gettelman, A.; Henderson, G.R. Arctic Radiative Fluxes: Present-Day Biases and Future Projections in CMIP5 Models. J. Clim. 2015, 28, 6019–6038. [Google Scholar] [CrossRef]
  45. Cesana, G.; Chepfer, H. How well do climate models simulate cloud vertical structure? A comparison between CALIPSO-GOCCP satellite observations and CMIP5 models. Geophys. Res. Lett. 2012, 39, L20803. [Google Scholar] [CrossRef] [Green Version]
  46. Boudala, F.S.; Milbrandt, J.A. Evaluations of the Climatologies of Three Latest Cloud Satellite Products Based on Passive Sensors (ISCCP-H, Two CERES) against the CALIPSO-GOCCP. Remote Sens. 2021, 13, 5150. [Google Scholar] [CrossRef]
  47. Blender, R.; Fraedrich, K.; Lunkeit, F. Identification of cyclone-track regimes in the North Atlantic. Q. J. R. Meteorol. Soc. 1997, 123, 727–741. [Google Scholar] [CrossRef]
  48. Hart, R.E. A Cyclone Phase Space Derived from Thermal Wind and Thermal Asymmetry. Mon. Weather Rev. 2003, 131, 585–616. [Google Scholar] [CrossRef]
  49. Sinclair, M.R. An Objective Cyclone Climatology for the Southern Hemisphere. Mon. Weather Rev. 1994, 122, 2239–2256. [Google Scholar] [CrossRef]
  50. Sun, R.P.; Diao, Y.N. Statistical Analysis of Spatial Temporal Characteristics of Extratropical cyclone activity in the northern hemisphere in 1979–2017. Period. Ocean. Univ. China 2020, 50, 12–21. [Google Scholar] [CrossRef]
  51. Nielsen, J.W.; Dole, R.M. A survey of extratropical cyclone characteristics during GALE. Mon. Weather Rev. 1992, 120, 1156–1168. [Google Scholar] [CrossRef]
  52. Field, P.R.; Wood, R. Precipitation and cloud structure in midlatitude cyclones. J. Clim. 2007, 20, 233–254. [Google Scholar] [CrossRef]
  53. Poore, K.D.; Wang, J.; Rossow, W.B. Cloud Layer Thicknesses from a Combination of Surface and Upper-Air Observations. J. Clim. 1995, 8, 550–568. [Google Scholar] [CrossRef]
  54. Sedlar, J.; Shupe, M.D.; Tjernström, M. On the Relationship between Thermodynamic Structure and Cloud Top, and Its Climate Significance in the Arctic. J. Clim. 2012, 25, 2374–2393. [Google Scholar] [CrossRef]
  55. Simpfendoerfer, L.F.; Verlinde, J.; Harrington, J.Y.; Shupe, M.D.; Chen, Y.S.; Clothiaux, E.E.; Golaz, J.C. Formation of Arctic stratocumuli through atmospheric radiative cooling. J. Geophys. Res. Atmos. 2019, 124, 9644–9664. [Google Scholar] [CrossRef]
  56. Simmonds, I.; Burke, C.; Keay, K. Arctic climate change as manifest in cyclone behavior. J. Clim. 2008, 21, 5777–5796. [Google Scholar] [CrossRef]
  57. Vihma, T.; Screen, J.; Tjernström, M.; Newton, B.; Zhang, X.; Popova, V.; Deser, C.; Holland, M.; Prowse, T. The atmospheric role in the Arctic water cycle: A review on processes, past and future changes, and their impacts. J. Geophys. Res. Biogeosci. 2016, 121, 586–620. [Google Scholar] [CrossRef] [Green Version]
  58. Vavrus, S.J.; Bhatt, U.S.; Alexeev, V.A. Factors Influencing Simulated Changes in Future Arctic Cloudiness. J. Clim. 2011, 24, 4817–4830. [Google Scholar] [CrossRef]
  59. Gong, T.; Feldstein, S.; Lee, S. The role of downward infrared radiation in the recent Arctic winter warming trend. J. Clim. 2017, 30, 4937–4949. [Google Scholar] [CrossRef]
  60. Dong, X.; Mace, G.G. Arctic stratus cloud properties and radiative forcing derived from ground-based data collected at Barrow, Alaska. J. Clim. 2003, 16, 445–461. [Google Scholar] [CrossRef]
  61. Curry, J.A.; Ebert, E.E. Annual cycle of radiation fluxes over the Arctic Ocean: Sensitivity of cloud optical properties. J. Clim. 1992, 5, 1267–1280. [Google Scholar] [CrossRef]
  62. Shupe, M.D.; Intrieri, J.M. Cloud Radiative Forcing of the Arctic Surface: The Influence of Cloud Properties, Surface Albedo, and Solar Zenith Angle. J. Clim. 2004, 17, 616–628. [Google Scholar] [CrossRef]
  63. Hori, M.E.; Inoue, J.; Dethloff, K.; Kustov, V. Near-tropopause bias in the Russian radiosonde-observed air temperature during the YOPP special observing periods in 2018. Polar Sci. 2021, 27, 1873–9652. [Google Scholar] [CrossRef]
  64. Simmons, A.J.; Poli, P. Arctic warming in era-interim and other analyses. Q. J. R. Meteorol. Soc. 2015, 141, 1147–1162. [Google Scholar] [CrossRef]
Figure 1. (a) Seasonal mean 2001–2017 autumn sea ice concentration and the selected five stations. The red dots denote open sea island stations (station 01028 and station 20744), the blue dots denote ice-covered island stations (station 20046 and station 21432), and the green dots denote the northern Canada coast station (station 71957); (b) the percentage of cyclone days in the total autumn days of the period 2001–2017 at each of the five stations.
Atmosphere 14 00689 g001
Figure 2. Trend of cloud fraction in autumn for (a) the low cloud (surface–700 hPa), (b) the mid-low cloud (700–500 hPa), and (c) the mid-high cloud (500–300 hPa) derived from the CERES data, and (d) the low cloud (1.0 > sigma > 0.8), (e) the mid-cloud (0.8 ≥ sigma > 0.45), and (f) the high cloud (0.45 ≥ sigma) derived from the ERA5 data. Both the CERES data and ERA5 data are for the period 2001–2017. The yellow dots denote statistical significance at the 95% level.
Atmosphere 14 00689 g002
Figure 3. Trends of autumn cyclone frequency in the period 2001 to 2017. The yellow dots denote the 95% confidence level.
Atmosphere 14 00689 g003
Figure 4. Correlation between cyclone frequency and cloud fraction in the autumns of 2001–2017 for (a) the low cloud (surface–700 hPa), (b) the mid-low cloud (700–500 hPa), and (c) the mid-high cloud (500–300 hPa) from the CERES data, and (d) the low cloud (1.0 > sigma > 0.8), (e) the mid-cloud (0.8 ≥ sigma > 0.45), and (f) the high cloud (0.45 ≥ sigma) from the ERA5 data, in which the sigma is a parameter that indicates how many times the pressure at the altitude is the sea surface pressure. The black dots denote the 95% confidence level.
Atmosphere 14 00689 g004
Figure 5. Correlations between zonal averaged daily cyclone frequency and cloud fraction in the autumns of the period 2001–2017 based on the ERA5 reanalysis data. The black cross denotes the 95% confidence level.
Atmosphere 14 00689 g005
Figure 6. Vertical climatology profiles of seasonal mean cloud fractions averaging from the four grid points nearest to each of the five sounding stations, based on (a) 2006–2017 GOCCP data and (b) 2001–2017 ERA5 data.
Atmosphere 14 00689 g006
Figure 7. Composite vertical profiles of the cloud fraction on the cyclone days (red line) and no-cyclone days (blue line) based on the GOCCP data (ae), and composite daily low, mid-low, and mid-high cloud fractions on the cyclone days (red column) and no-cyclone days (blue column) based on the CERES data (fj) at the five sounding stations (the station number is labeled above each figure). The cloud fraction at each station is the mean value of the data at the four grid points surrounding the location of each sounding station.
Atmosphere 14 00689 g007
Figure 8. Cyclone-centered composites of horizontal velocity vectors (white vectors), vertical velocity (black contours, the positive and negative values for the sinking and rising, respectively, unite, Pa/s), and relative humidity (blue shaded) at 850 hPa level based on all cyclone days on which the cyclone centers are located within the distance of nearly 800 km from the location of each sounding station during autumns for the period 2001–2017. In the composite, a relative coordinate is used, with the coordinate origin being the center point of the cyclones. The x axis ranges from 40° west to 40° east of the center point, and the y axis ranges from 8° south to 8° north of the center point. Generally, the composite horizontal cyclone circulation fields show that air rising/sinking is located in the region of southerly/northerly flow; the region of ascending/descending is consistent with the region of high/low relative humidity for all of the cyclone-centered composites at the five stations (Figure 8) at the 850 hPa level where low cloud fraction is high (Figure 7) and cyclone-induced cloud uplift occurs (Figure 8). In contrast, at the station near the New Siberian Island (station 21432), air rising and high relative humidity are accompanied by northerly flow in the southwest of the cyclone. This can be explained by the geography of the cyclone. Station 21432 is located on New Siberian Island, close to Eurasia, where the cyclone’s southbound air flows from the cold East Siberian Mountains and its northbound air flows from the Arctic marginal sea. Station 71957 is located on the North American continent, and the influence of the cyclone flow is weakened considerably. Therefore, the horizontal and vertical velocities in the cyclones at station 71957 and station 21432 are much smaller than the horizontal and vertical velocities in the cyclones at three stations in the Barents Sea, indicating a weaker lower troposphere intensity of the cyclones along the land coasts. Moreover, the relative humidity at 850 hPa is the smallest in the cyclones at the station of the north coast of Canada.
Atmosphere 14 00689 g008
Figure 9. Cyclone-centered composite of longitude-pressure cross-section of relative humidity (blue shaded), air temperature anomaly (red contours), and zonal vertical velocity vector (black vectors) along the center latitude of each of the selected cyclones based on all of the cyclone days in autumns during the period 2001–2017. The x axis ranges from 40° west to 40° east of the center point.
Atmosphere 14 00689 g009
Figure 10. Composited vertical profiles of air temperature on no-cyclone days (yellow line) and cyclone days (red line), the mixing ratio on no-cyclone days (light brown line) and cyclone days (dark brown line), the relative humidity on no-cyclone days (light blue line) and cyclone days (dark blue line), and the dew point deficit on no-cyclone days (black line) and cyclone days (green line) based on the relative humidity increase days (a1e1,a2e2) and relative humidity decrease days (a3e3,a4e4) at the five sounding stations. (a1e1/a3e3) illustrate the under 10,000 m profiles of the air temperature and relative humidity on the relative increase cyclone days/relative decrease cyclone days versus no-cyclone days. (a2e2/a4e4) illustrate the under 10,000 m profiles of the air temperature and dew point deficit on the relative increase cyclone days/relative decrease cyclone days versus no-cyclone days, in which the dew point deficit under the conditions of air temperature (vertical black dotted lines) decides whether the cloud formation criterion is met. The vertical location where the cloud formation criterion is met is shown as the black and green hatched areas on the no-cyclone days and cyclone days, respectively.
Atmosphere 14 00689 g010
Figure 11. Percentages of relative humidity increase (RHI) days (blue column) and relative humidity decrease (RHD) days (red column) in the total cyclone days at ice-covered station 21432 and station 20046 (a), the ice edge station 20744 and station 01028 (b), and the North Canada coast station 71957 (c).
Atmosphere 14 00689 g011
Table 1. Number of cyclone days at the five selected stations during autumn in the period 2001–2017.
Ground SurfaceStationCyclone Days
Ice-covered 21432810
20046938
Ice edge20744944
010281020
Ice-covered land coast station71957735
Disclaimer/Publisher’s Note: The statements, opinions and data contained in all publications are solely those of the individual author(s) and contributor(s) and not of MDPI and/or the editor(s). MDPI and/or the editor(s) disclaim responsibility for any injury to people or property resulting from any ideas, methods, instructions or products referred to in the content.

